
Abstract
Quality function deployment (QFD) is a customer-oriented tool for developing products. Based on the idea of the best-worst method (BWM), a novel model is developed to determine the relative importance ratings (RIRs) of customer requirements (CRs) with interval grey linguistic (IGL) information, which plays a significant role in QFD. CRs are rated with IGL variables, and the degree of greyness degree function that can be used to handle the IGL variables is defined based on the power utility function. Then, considering customer heterogeneity, a model is constructed to derive the RIRs of CRs by following the logic of the BWM. Finally, a case study of 5 G smartphone development is provided to verify the validity and the feasibility of the proposed method.
Introduction
In today’s intensely competitive environment, quality function deployment (QFD) has been widely applied in various industries [1–4]. As a customer-oriented tool, QFD is an efficient approach for translating customer requirements (CRs) into design specifications all over the product development [5]. It has been reported that companies using QFD for product or service development may achieve a 60 percent reduction in design costs, a 40 percent reduction in design time, and help promote team cooperation [6]. The structure of a typical QFD system is shown in Fig. 1. Obviously, during the implementation of QFD, determining the relative importance ratings (RIRs) of CRs is a most fundamental phase and that may have a marked impact on subsequent stages, including product planning, parts characteristics, process plans, and manufacturing operations [3, 5].
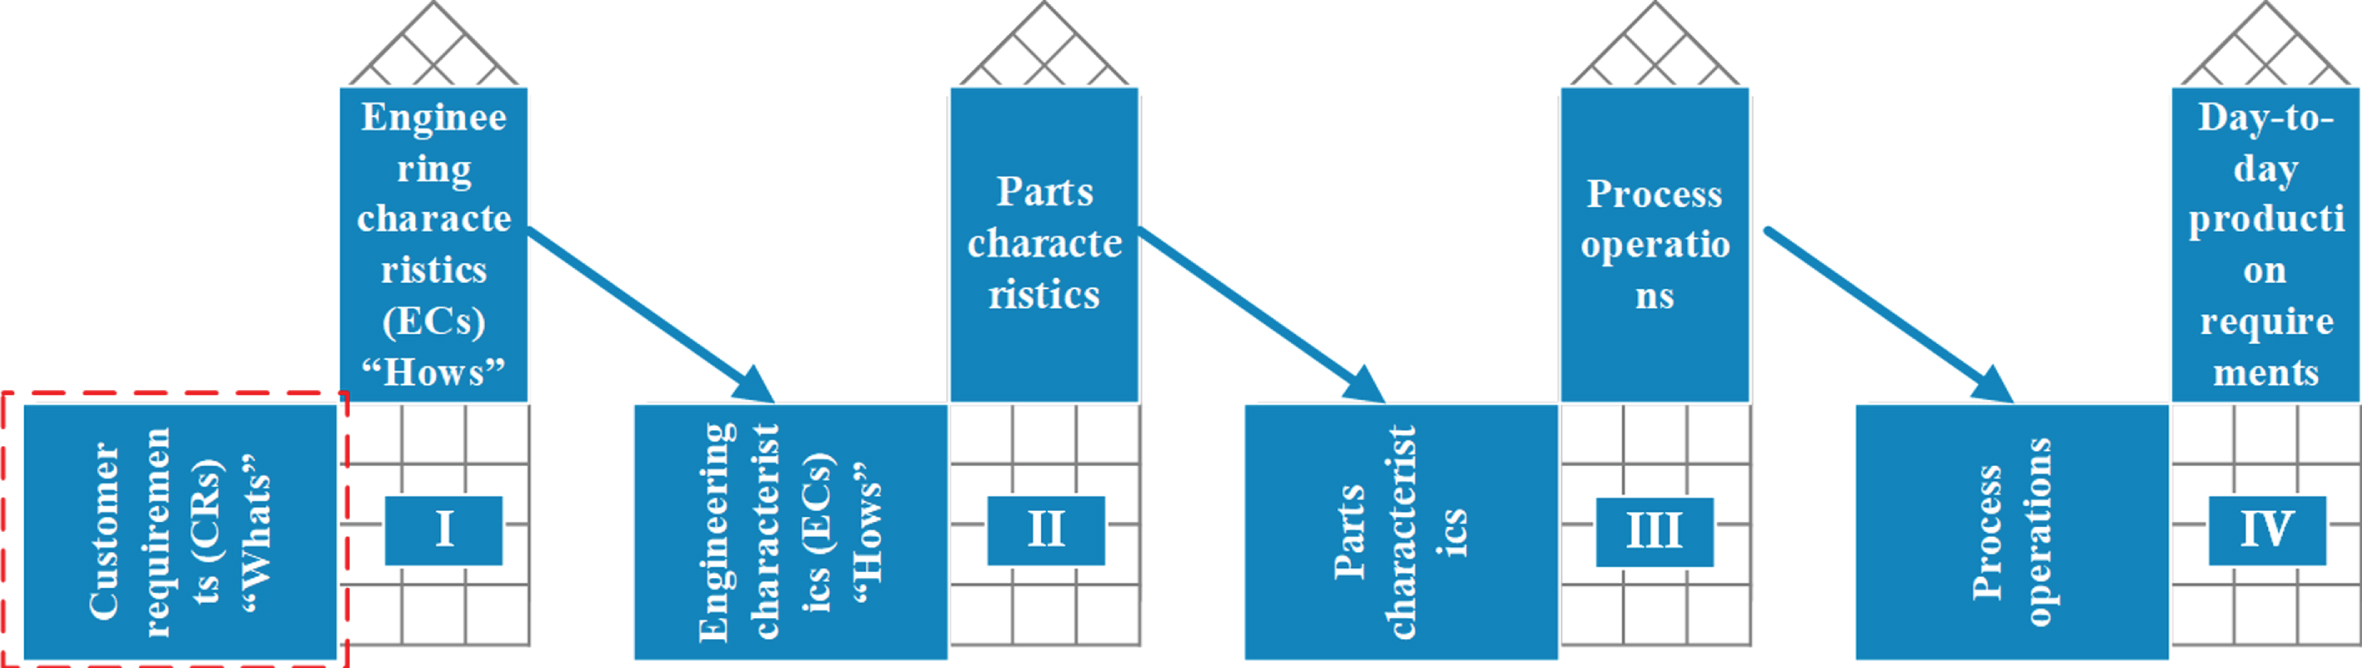
Structure of a typical QFD system.
Determining the RIRs of CRs has been widely discussed, and there are three main ways for customers to define the relative importance of CRs: direct assignment, pairwise comparison, and preference ordering [3]. The direct assignment method is a very simple and straightforward approach that allows customers to directly assess the relative importance of one customer requirement (CR) over the others directly on a certain scale (e.g., 1–5, or 1–10) [7]. However, these methods have some drawbacks, such as low robustness, dependence on their rating scale, and difficulty for customers to choose the correct values in the case of limited information [3, 8]. The pairwise comparison method is another useful way to acquire the RIRs of CRs by asking customers to compare CRs in pairs. Conjoint analysis and analytic hierarchy process (AHP) / analytic network process (ANP) approaches have been widely applied [6–9]. While, all these methods require considerable detailed information from customers, which may make customers impatient [6]. Hence, preference ordering methods, which allow customers to give their individual rankings of CR preferences, were developed [8]. In fact, the problem of uncertain decision-making is pervasive [10]. To deal with the imprecision and uncertainty of information, fuzzy set-based approaches, rough set-based approaches, and linguistic information-based approaches have been separately proposed [11–14].
What needs to be pointed out is that the methods mentioned above may lead to misleading results because that they ignore the information greyness caused by insufficient information [15]. For example, when a customer has 100 percent of the information about a CR, he/she could give accurate evaluation information without tending to overestimate his/her preferences [3]. In practice, it is difficult for customers to have 100 percent of the information about CRs, which are often characterized by dynamics, uncertainty, and complexity [16]. Therefore, both the fuzziness caused by uncertainties and the greyness caused by insufficient information should be considered together in the process of determining the RIRs of CRs. Furthermore, customers have different educational backgrounds, knowledge fields, and decision-making capabilities, which determines the need to consider customers’ behavioral preferences in the processing of their evaluation information. Also, the pair-wise comparison method is widely used (i.e., AHP) to obtain the RIRs of CRs, but it becomes more difficult to implement when the number of customer requirements to be evaluated is large. How to solve the above problems constitutes the research motivation of this paper.
To address the above issues, this paper proposes a novel decision-making framework for determining the RIRs of CRs in QFD with insufficient information. First, the interval grey linguistics (IGL) information form is introduced in the implementation of QFD to effectively describe both the fuzziness and the greyness of customer evaluation information [17–19]. Then, the utility function is employed in the IGL information processing process to measure the influence of customers’ behavior preferences, and a new distance formula is defined to realize the comparative analysis among different CRs. Finally, due to the best-worst method (BWM) that was proposed by Rezaei (2015) [20] can significantly reduce the workload of pairwise comparison and obtain a better consistency compared with the AHP method [20–25]. For BWM, we only need to do 2n-3 comparisons, whereas, for AHP, we need to do n(n-1)/2 comparisons [20]. The BWM is extended to be able to acquire the RIRs of CRs in QFD with IGL variables, and we call this extension the IGL-BWM for short.
In summary, the main contribution of this study focuses on the following issues, as details: How can we effectively handle IGL variables? How can we consider customer heterogeneity? How can we employ the BWM to determine the RIRs of CRs in an IGL environment?
The rest of this paper is organized as follows: literature related to the analyses of CRs, interval grey linguistics, and the BWM are reviewed in Section 2. The steps of the proposed approach for determining the RIRs of CRs are described in Section 3. A case study of 5 G smartphone development is provided in Section 4. Finally, Section 5 discusses the conclusions and future works.
Analyses of CRs
The core of QFD implementation is a matrix called the house of quality (HoQ), as shown in Fig. 2. Obviously, the analyses of CRs are a critical starting point of the QFD, since the final importance ratings of CRs are a crucial process, and the inaccurate evaluation will have a significant influence on the setting of engineering characteristics target value of the product development [26]. As shown in Fig. 2, CRs need to be identified before they are ranked in importance [27, 28]. In fact, the qualitative analysis method is mainly used in the CR identification stage (Step 1 in Fig. 2), including focus group, Gemba walk, individual interviews, the critical incident technique, and mail or telephone surveys using questionnaires [27, 29]. Considering that QFD is a technology that uses CR list priority to improve service/product quality [30], this study focuses on how to process customer evaluation information and obtain customer requirement importance rankings (Step 2 and Step 3 in Fig. 2). In general, the final importance rating of a CR is acquired by integrating its relative importance rating (RIR) and competitive priority rating.
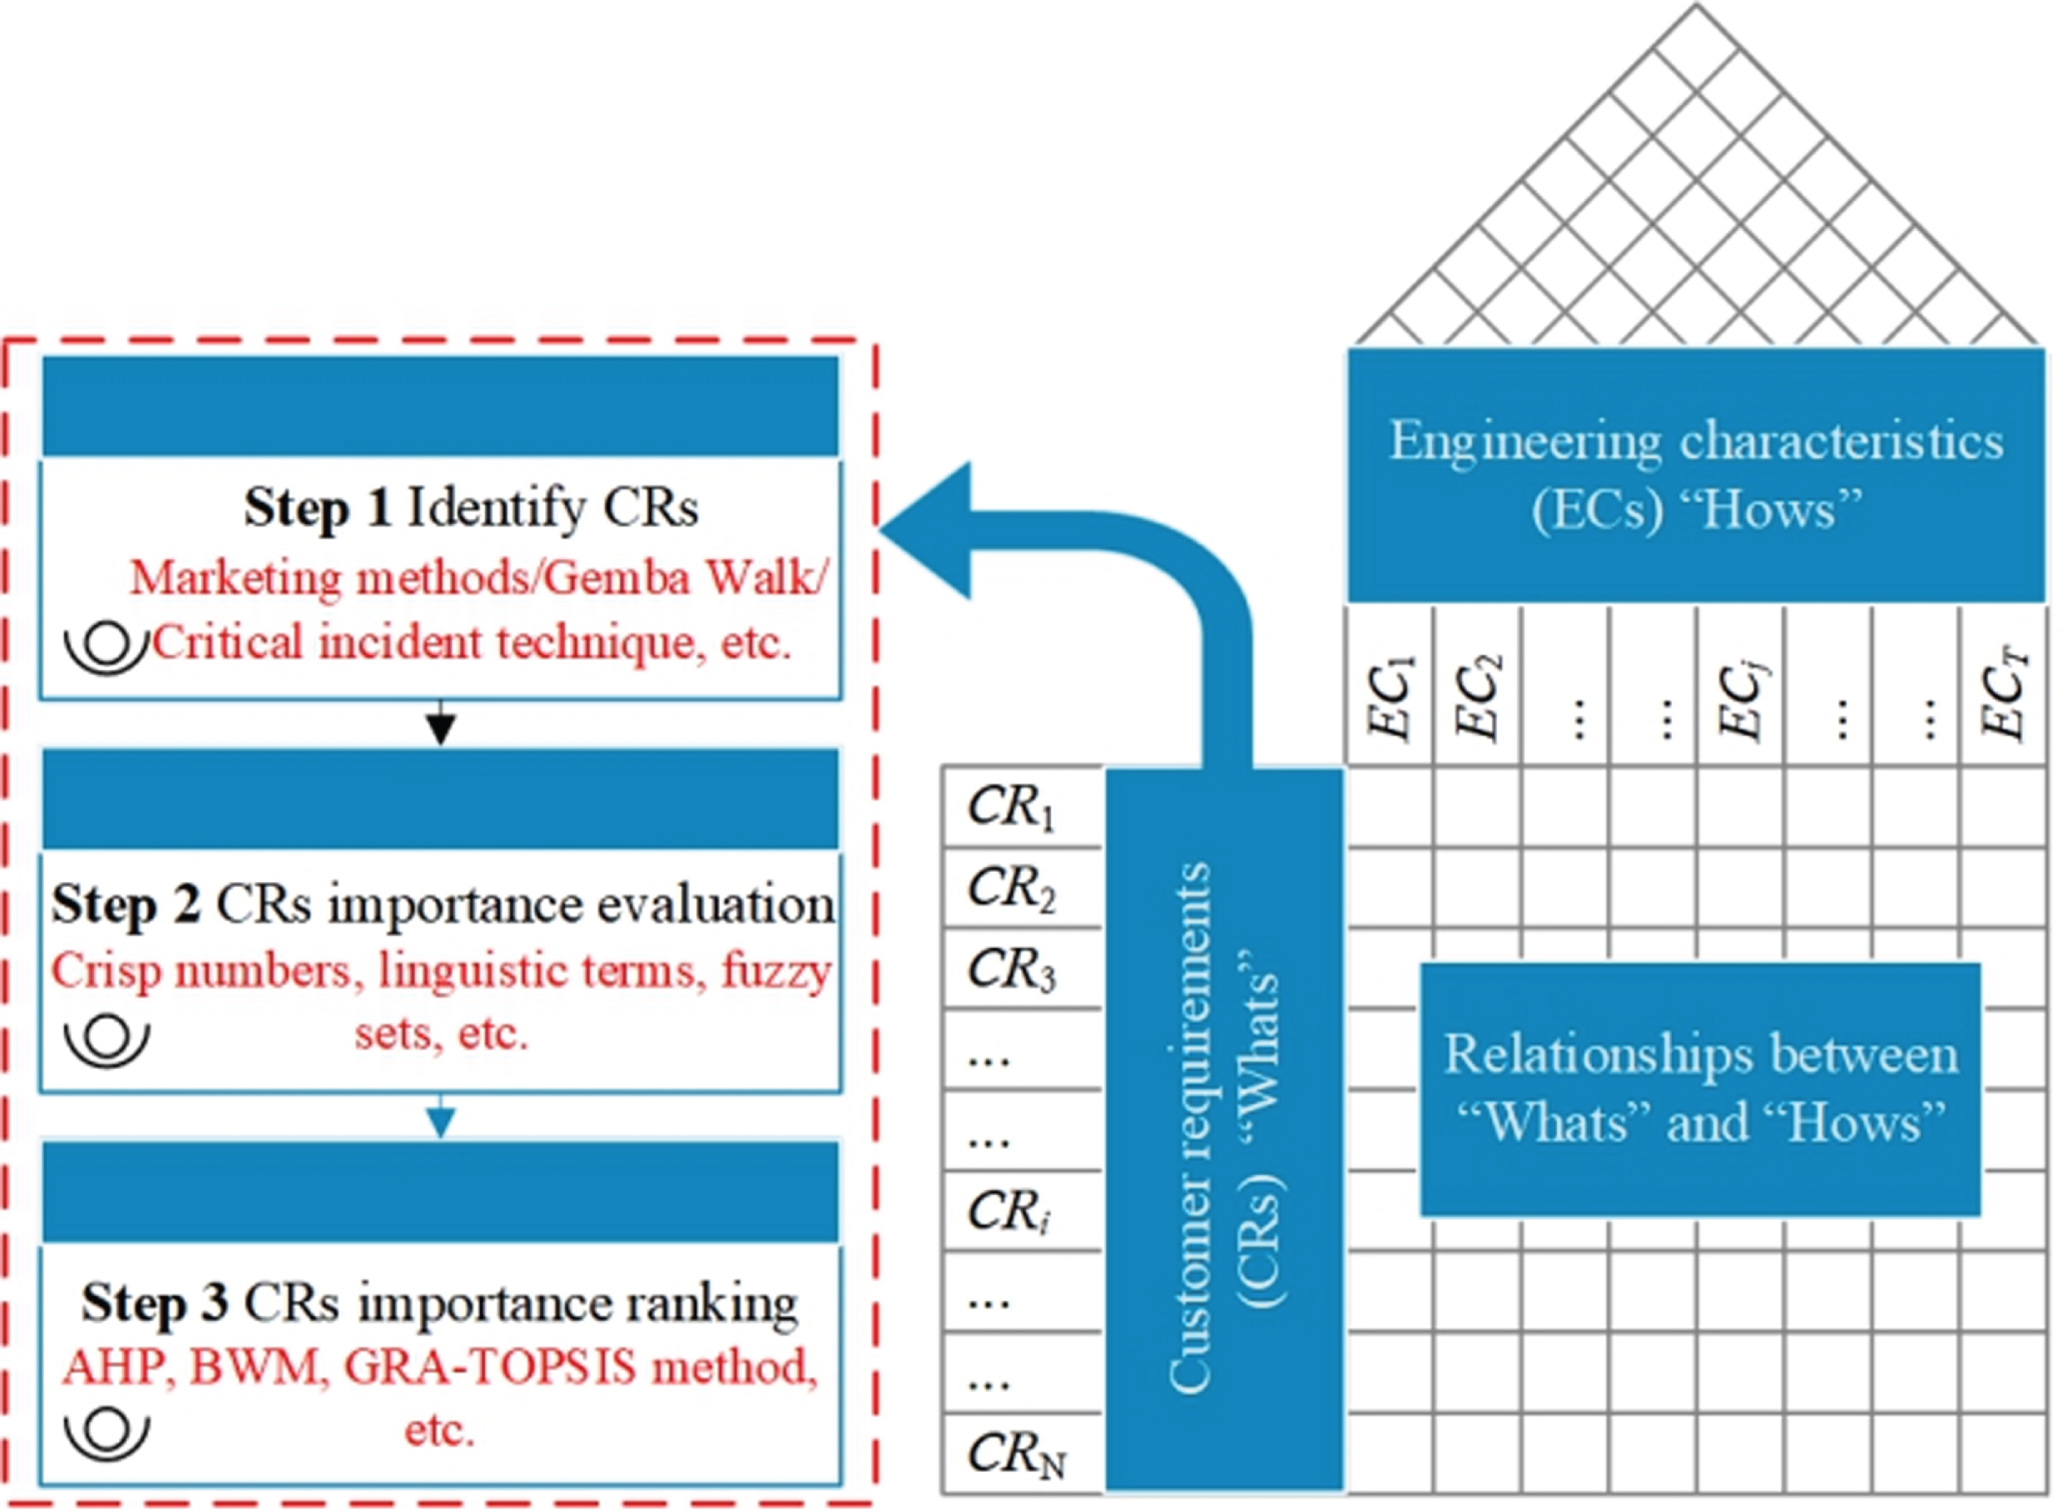
An illustration of the HoQ.
The RIR of a CR is usually calculated based on the evaluation value of the importance (EVI) of the CR, which means that the accuracy of the EVI will have a significant impact on the results. Since the introduction of QFD, scholars have proposed various information forms to describe customer evaluation information. Crisp numbers are a simple and effective form of information, on which many approaches have been based, such as the point-scoring scale [6, 31], AHP [9], BWM [32]. Considering the inaccuracy and ambiguity of customer perception, fuzzy numbers or hesitant fuzzy sets were widely used to describe customer assessment information, and fuzzy AHP/ANP approaches [33], tolerance deviation function [34], and weighted operators [35] have been developed. In view of the subjective problem of membership function selection in fuzzy set theory, the rough set theory [3, 11] was developed. Moreover, because crisp numbers or fuzzy numbers have difficulty accurately expressing the inherent vagueness or impreciseness in QFD accurately [26], various methods have been designed based on the linguistic information [26, 36]. Meanwhile, the form of information used to determine the competitive priority ratings (CPRs) of CRs in QFD has also been expanded from crisp numbers [6, 9] to linguistic terms [2, 26], and the interval-valued Pythagorean fuzzy sets [36]. In fact, for both the RIRs and the CPRs of CRs, customers are more likely to use linguistic terms that more easily express fuzzy information to describe their preferences for different CRs [2, 36].
However, due to limited resources and conditions, it is difficult to obtain all the information about CRs. In other words, the information about CRs obtained is objective insufficiency and incompleteness, and this is exactly the problem that the existing achievements have ignored. Therefore, aiming to obtain more accurate RIRs of CRs, not only the fuzziness caused by human (customer) thinking but also the objective uncertainty (greyness) caused by insufficient information needs to be considered [18]. Fuzzy grey theory, which is more aligned with the objective reality of things was launched to describe both the fuzziness and the greyness of decision-making problems [19, 37–39]. This research intends to develop a novel decision analysis method to determine the RIRs of CRs with IGL variables, which would help decision-makers to obtain more rational decision-making results. It is important to note that the proposed method in this work could be easily extended to determine the CPRs of CRs.
In 1982, Professor Deng proposed the grey system theory, which can effectively solve and address the problems of decision making and prediction with uncertain or poor information [40–42]. On this basis, the IGL variable was defined to describe the greyness of individual evaluation information [17–19, 44].
Characteristics and operational laws of IGL variables were discussed by Li and Yuan [45], and the achievements mainly focus on the information aggregation operators [17–19, 43].
However, the literature reviewed above seldom considered, or deeply discussed how to deal with IGL variables in the context of customer behavior preference, namely, there are still two issues remain that require further discussion: (1) a lack of technology to measure the degree of the greyness of customer evaluation information considering individual heterogeneity, and (2) ignoring the role of customers’ amount of information in the objective solution process of customers’ weights. Based on behavioral decision theory and grey system theory, the problems mentioned above will be discussed in this study.
IGL-BWM model for determining the RIRs of CRs
Estimating the importance of CRs with IGL variables
Let

The structure of IGL variables.
Definition 1 shows that the difficulty in information processing of an IGL variable is how to determine its degree of greyness. Actually, the magnitude of the degree of the greyness of a grey number is closely related to the background or the universe of discourse on which the grey number is defined in grey system theory [46, 47]. Due to the differences in the age, educational background, product understanding and evaluation ability of each customer, the characteristics of different customers are different, and the background of the grey part of his/her evaluation information is also different. On the other hand, experimental researches have shown that individual (i.e., customer) characteristics would affect his/her risk attitudes [48, 49]. For example, educated individuals are significantly more risk-averse than those with less education, and the willingness to take risks is negatively related to age. In fact, as individuals grow older and have a better education, the amount of information they have increased. Therefore, it is reasonable to employ a utility function to describe the amount of information an individual possesses. Without any loss of generality, if individuals are risk-seeking, then suppose they have less information. Otherwise, they have more information. The power utility function is easy to calculate and can describe three different individual risk attitudes: risk aversion risk-seeking and risk-neutral [50, 51]. The power utility function is used to measure the background or the universe of discourse on which different customer’s degree of the greyness of their evaluation information is calculated.
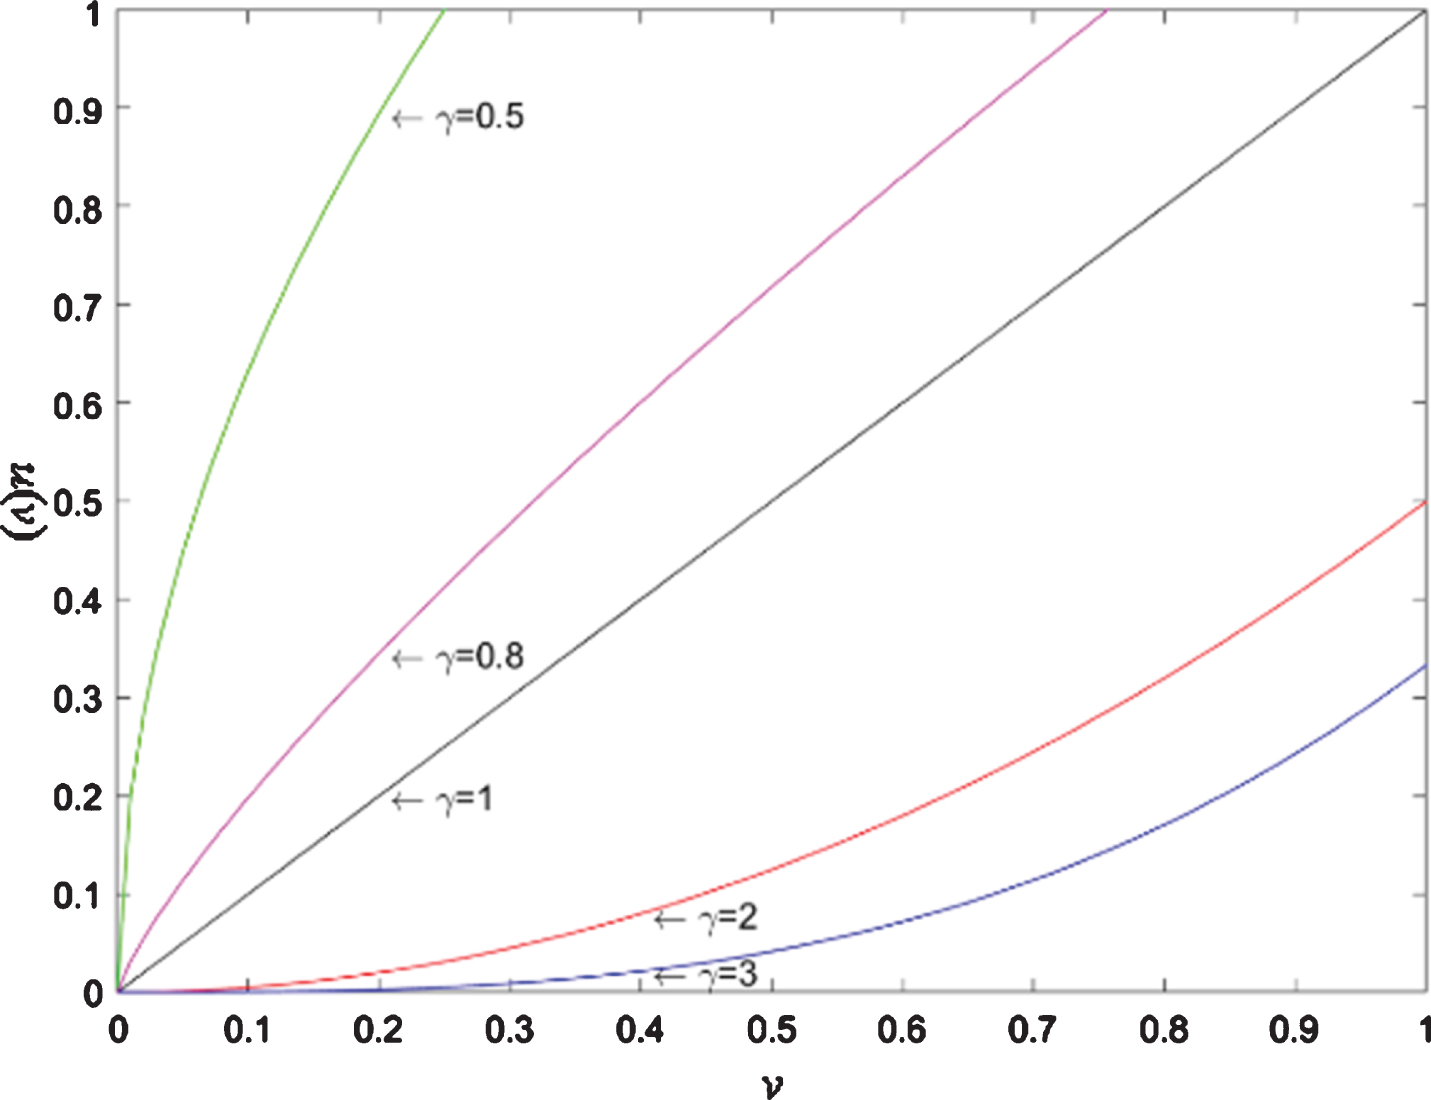
The power utility function.
Where
In Formula (3), x represents the amount of information estimated by the jth customer. γ j represents the risk preference parameter of customer j, and different values of γ j mean different customers. f (x) j is used to describe the reliability of customer j’s evaluation information.

The greyness of the grey part of IGL.
Where
Qualitative analysis methods (e.g., focus group, Gemba walk, and individual interviews) are used to build the set of CRs, and then the importance of the CRs can be quantified via the IGL-BWM model. In the process of calculating the RIRs of CRs, inappropriate handling of the ambiguity and incompleteness of information will affect the accuracy of the calculation. Linguistic terms could be used to describe the subjective uncertainty (vagueness) of customer assessments; however, most researchers do not consider the objective uncertainty (greyness) of information caused by information insufficiency and incompleteness [18], and this may lead to information loss in determining CRs’ RIRs. Therefore, a novel method is developed with IGL variables, and it consists of two phases, namely, preprocessing customer evaluation information and determining the RIRs of CRs (Fig. 6).
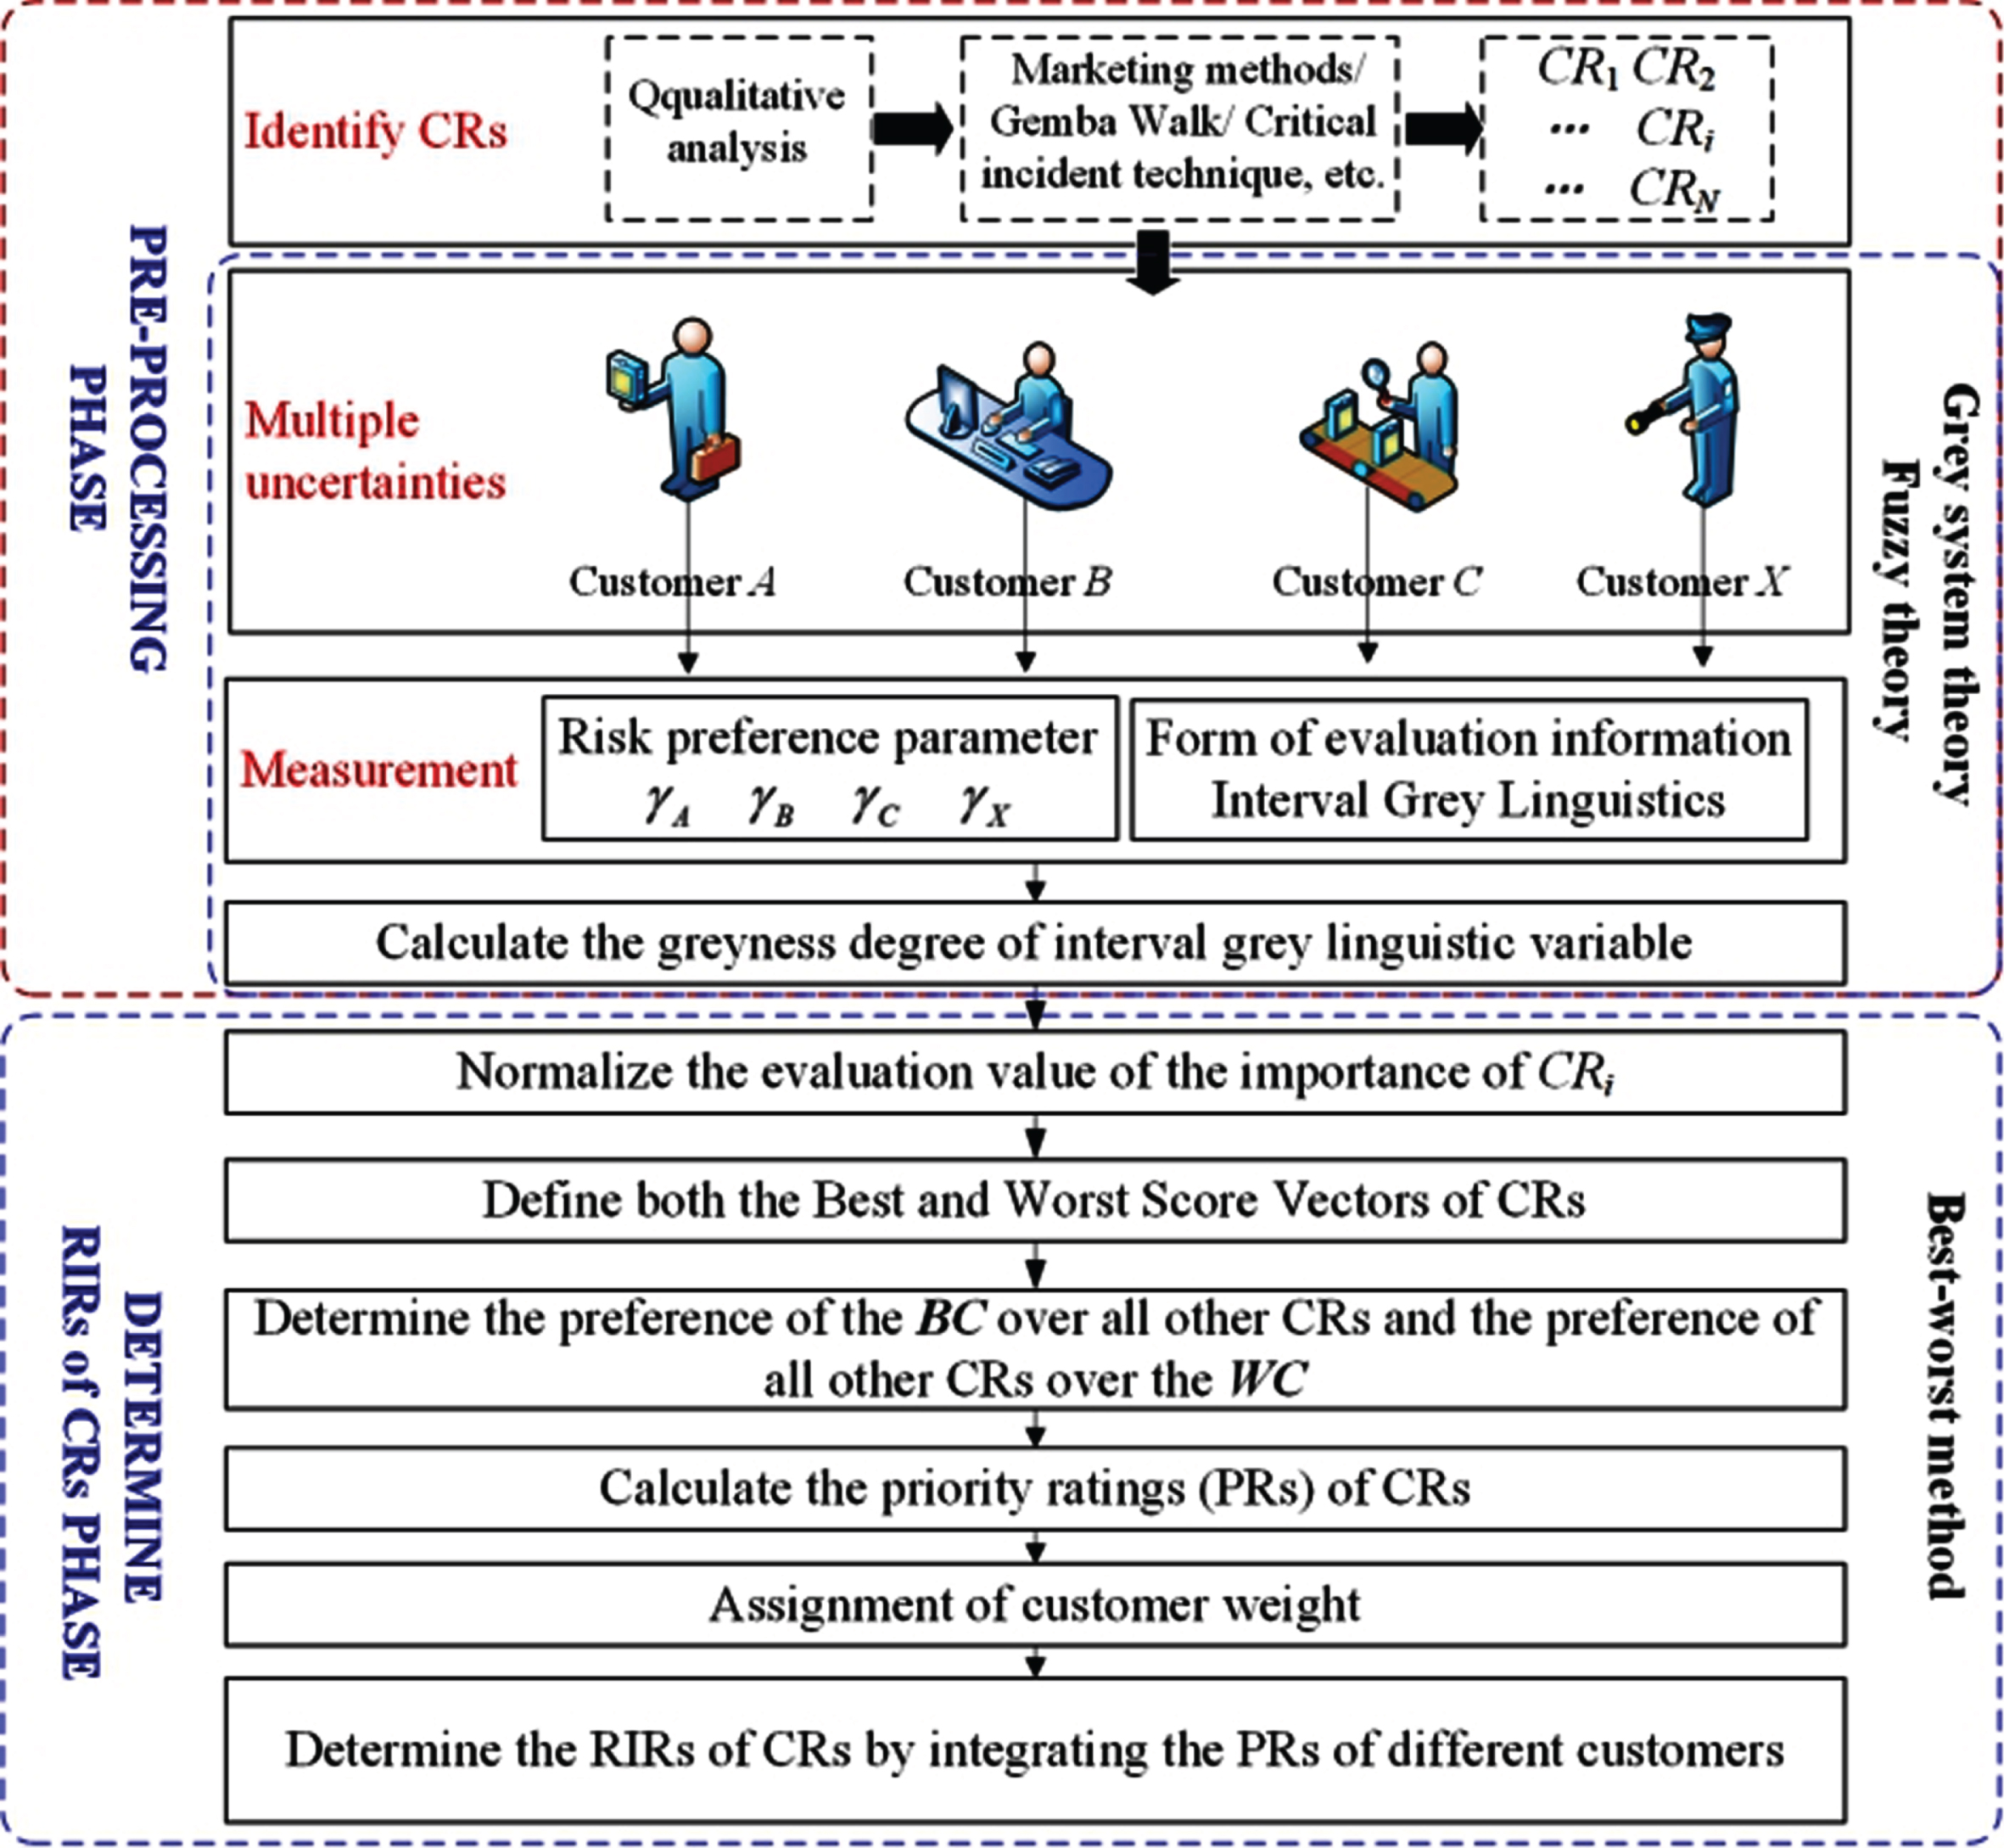
The procedures of the proposed approach.
In the preprocessing phase, customers are invited to provide the EVI of CR
i
with IGL information, and the degree of greyness function of the IGL variable is defined to measure the greyness of different customer evaluation information. Then, combining the calculated degree of greyness with the linguistic variable of IGL information, the normalized EVI (NEVI) of CRs can be obtained. Later, given the intricacy of CR assessment, a model is first constructed to derive the priority rating (PR) of each CR based on the idea of BWM. Then, considering customer heterogeneity, the RIR
i
of CR
i
is calculated by integrating the
It is noted that a larger value of
Best score vectors of CRs:
Worst score vectors of CRs:
For convenience, we suppose
It is important to point out that the consistency ratio of the comparison system provided by customer j can be defined as:
Table 1 demonstrates the CI (consistency index). The value of TCR j closer to 0 indicates higher reliability of the comparisons [20, 52].
Consistency index (CI)
Because different customers have different amounts of information, the importance of their evaluation information is different. Based on definition 3, the model to determine weights for different customers is constructed as follows:
Finally, all CRs are ranked by RIR i , and the RIRs of CRs are obtained.
During the calculation, the Lingo software can be used to solve model (12), and the remaining calculations can be performed via Microsoft Office Excel.
To exemplify the validity and feasibility of the proposed method, section 4.1 illustrates an example of CRs prioritization for a 5 G smartphone from the perspective of customers. Moreover, three different scenarios are set in section 4.2, and the superiority of the proposed method is further verified through comparative analysis.
Identify the key CRs of a 5 G smartphone
A smartphone development company decides to adopt QFD to design 5 G phones. Before designing the phone, the company should first determine which CRs should be satisfied first. That is, what are the selling points? Therefore, the company builds the QFD team, which includes marketers, data analysts, R&D staff members, and other professionals. The QFD team can obtain the major CRs via questionnaires, brainstorming, focus groups, face-to-face interviewing, Gemba walk, critical incident technique, and other useful methods. Suppose the company’s QFD team determines that Pinto’s achievement [53] provides a good overview of the main CRs (Price, Design, Ease of handling, etc.) for smartphones, and the details are shown in Table S1.
Considering the differences in customers’ cognition of 5 G smartphones and the amount of information they have, it is more reasonable and accurate to use IGL information to express customers’ evaluation value. When a customer thinks that the durability of a 5 G phone is extremely important, he gives it a 9. However, how reliable are the results? This depends on the amount of information the customer possesses, such as information on the customer’s lifestyle, time spent, and product knowledge. If the IGL variable (S9, [0.30,0.50]) is used to describe the evaluation information given by customers, it can not only represent the evaluation value of customers (S9), but also reflect the amount of information customer possess ([0.30,0.50]). Then through a questionnaire platform (i.e., https://www.wjx.cn/m/42464722.spx), we sent 150 questionnaires for smartphone users between the ages of 20 and 50. After sorting the questionnaires, 107 valid questionnaires remained. Then we randomly selected 11 questionnaires as samples using the random number method. The EVI of each of the twelve CRs was collected and the results are reported in Table S2.
To obtain the RIRs of CRs, our proposed method in Section 3 is employed. The degree of the greyness of IGL variables is calculated by formulas (2) and (3). Because the 11 selected customers have been using 4 G smartphone for 5, 5, 5, 5, 4, 5, 2, 3, 3, 5, and 5 years, the values of γ and
The NEVI of CR i can be obtained by Equation (5), and the best score vectors of the CRs are defined as:
The worst score vectors of the CRs are defined as:
Then, the distance of the
To save space, we take CT1 as an example to show the calculation process.
By solving model (16), the PRs of CRs are obtained.
In addition, according to formula (13), considering CI = 5.23 [20], the TCR1 of CT1 is 0.4962. Similarly, the PRs of the CRs given by other customers and the TCR
j
of different customers can be calculated, and the results are shown in Table 2. Since the TCR
j
of all customers is closer to 0, the result is acceptable. Then there is the need to integrate information from different customers, and the weights of customers are calculated by the formula (14). Here,
The PRs of CRs by 11 customers
Finally, by using formula (15), the RIRs of CRs are obtained:
The ranking order of the CRs is CR9≻CR6≻CR10 ≻CR7≻CR11≻CR3≻CR8≻CR1≻ CR4≻CR5≻CR2≻CR12 (Battery capacity≻Memory capacity≻ Camera≻Connectivity≻Apps≻Brand ≻Type of OS≻Price≻Ease of handling≻ Multimedia ≻ Design ≻Durability), where ‘ ≻’ means ‘more important than’.
Management implications: (1) If the company has enough capital and technology reserves, it could give priority to developing new 5G phone batteries, which will greatly improve customer satisfaction and enhance market competitiveness. (2) If the company does not have an edge in battery development, it could prioritize improving the memory and camera capabilities of 5G phones. Examples include the development of a better, more secure, and more convenient 5G mobile virtual memory link program or equipping a camera under the screen. (3) If the company has strong software development strength, it should consider developing more apps, such as developing programs and interfaces suitable for testing blood pressure, blood sugar, and lipids, to gain a competitive advantage in the market.
In fact, 5G phones need to achieve the over-the-air high-data-rate transmission, virtual reality, augmented reality, and artificial intelligence, the ability to play ultra-high-definition videos, and other functions [54], which all require 5G phones with larger battery capacities, larger memory capacities, high-definition cameras, wider connectivity, and diverse Apps. Arguably, battery problems have been identified as one of the largest challenges for smartphones, so it is reasonable for the battery capacity to be the customers’ most concerned CRs. Taking the Huawei Mate 20 X (5G) as an example, its selling points include a 40W Huawei super-fast charger, the ability to take 40 million super large wide-angle Leica three photos, and the HUAWEI m-pen 4096 class pressure-sensitive Pen (https://consumer.huawei.com/cn/phones/mate20-x-5g/), which are highly consistent with our results. There is no doubt that brands are crucial to enterprises and establishing 5G smartphone brands will help enterprises seize market shares, which due to the perceived brand quality and perceived brand prestige will affect consumers’ purchasing decisions [55].
Considering that the IGL-BWM model mainly solves the problem of sorting the importance of CRs in the context of insufficient information, scenario 1 describes the effect of the amount of information owned by the customer on the result by taking different values of parameter γ, scenario 2 discusses the results obtained with complete information, and scenario 3 analyzed the degree of influence of customer heterogeneity on the results.
Scenario 1: Comparative analysis of customers’ different risk preferences
Due to the heterogeneity of individuals, the amount of information each customer has is different, that is, the information domain on which the grey part of the IGL variable is generated is also different. Therefore, the sensitivity analysis of the parameter γ is conducted in this section, and the results are shown in Table S5. If γ= 2, it means that such customers tend to be risk-seeking. In contrast, if γ= 0.8, it denotes that such customers tend to be risk-averse. Finally, when γ= 1, it denotes that such customers are risk-neutral.
The results show that the camera (CR10) is identified as the most important CR in most cases for γ= 2 as shown in Table S5. The battery capacity (CR9) is identified as the consistently most important CR for γ= 1, and more than 58.33% of the CR sorting results are changed compared with the CR sorting results at γ= 2. Furthermore, when γ= 0.8, the most important CR is also the battery capacity (CR9), and more than 66.67% of the CR ranking results have changed compared with those of the γ= 2, too. Therefore, for different types of customers, their attention to CRs has both similarities and differences. Specifically, the ranking positions of CR3, CR8, CR11, and CR12 do not change as γ changes. That is, the relative importance of these CRs is the same for different types of customers, which requires enterprises to develop products around these CRs (i.e., Brand, Type of OS, Apps, Durability) to cultivate their core competitiveness. While the ranking position of the other CRs varies as γ changes, that is, the importance of these CRs varies for different types of customers, and so enterprises should conduct market segmentation when designing products (i.e., “Virtual reality (VR)+5G smartphone” and a “Super wide-angle zoom (SWAM) +5G smartphone”). Meanwhile, the TCR j will change as γ changes, which means that for the same set of data, different γ’s will produce different results. Taking CT1 as an example, if γ= 2, then TCR1 = 0.2710, which indicates that the result is acceptable. When γ= 0.8, then TCR1 is closer to 1, which means that the consistency of the result is poor. Thus, it is worth noting that the results could exactly describe the different psychological behaviors of customers affected by the external environment, which fully reflects the heterogeneity of customers.
Scenario 2: Compared to the IGL-BWM model with crisp numbers
With the increasing amount of information customers have, the degrees of greyness of customer evaluation information are decreasing continuously, which will affect the CR ranking results. Supposing that the total information can be obtained by every customer, so the degree of the greyness of the IGL variable is calculated by the formula (17).
Then the new optimal weights of CRs can be calculated by Step 3 to Step 7 in section 3.3, and the results are shown in Table S6.
By using Formula (14), the RIRs of CRs are obtained:
Then, the ranking orders of the CRs are as follows: CR9≻CR7≻CR11≻CR6≻CR5≻CR8≻CR10≻ CR1≻CR2≻CR3≻CR12≻CR4 (Battery capacity≻Connectivity≻Apps≻Memory capacity≻Multimedia≻Type of OS≻Camera≻Price≻Design≻Brand≻Durability≻Ease of handling).
As shown in Fig. 7, when parameter γ was changed, not only the ranking results of CRs but also the consistency ratio was changed. According to the BWM, the consistency ratio takes values closer to zero and shows high consistency [21]. Obviously, the consistency ratio of the ranking order of CRs with crisp numbers is smaller than the result with IGL variables (). The underlying reason is that when customers’ evaluation information is described by IGL variables, it contains uncertain information which may result in inconsistency [23]. However, in the real world, customers often cannot obtain all the information to make the most accurate judgments, which requires research on decision-making technology in an environment of insufficient information. Therefore, the IGL-BWM model that is developed in this study could provide technical support for handling CRs ranking problems in uncertain and insufficient information environments.

The impact of the amount of customer information on the results.
Li et al. [26] used TOPSIS as a benchmark, which can be used to determine the ranking of CRs. According to TOPSIS, the positive ideal solution is defined as
When customer heterogeneity is not considered, that is, assuming the same weight of customers (i.e., 1/11), the integrated RC
i
of CRs are calculated and the NRC
i
is obtained after normalization. In contrast, if the heterogeneity of customers is considered, our proposed method is adopted to determine the weight of customers and the integrated RC
i
of the CRs is recalculated. The results of the two cases are shown in Table S7. Table S7 shows that customer heterogeneity has a significant impact on the ranking results of CRs. Specifically, the most important CR in both cases is CR9, but 50 percent of the CR ordering changed. Hence, to obtain more accurate ranking results of CRs, it is necessary to consider the influence of customer heterogeneity [2, 36]. Different from the existing achievements, the weight of different customers is determined by the subjective weighting method. This paper constructs a model to solve the weight of different customers based on the utility function, which provides a new way to commendably describe customer heterogeneity. In addition, by comparing the results of the IGL-BWM model and the TOPSIS, it is not difficult to find that the ordering results of CRs are also different, and 50 percent of the CR ordering changed. The possible underlying cause is that the two methods process the data differently. The TOPSIS is a distance-based approach that realizes the ranking of alternatives by calculating the degrees of both the closeness and the faraway distance between each alternative and the ideal/negative ideal solution, but it is difficult to maintain consistency in the decision process [57]. By contrast, the IGL-BWM model could guarantee the level of consistency of the results by establishing an optimization model based on the distance (i.e.,
In the process of product development or improvement through QFD, design teams need to prioritize CRs, to devote limited resources to the focal requirements of customers. However, the reliability of prioritizing CRs depends on the accuracy of customer evaluation information. In this paper, a novel IGL-BWM model is proposed to address the RIRs of CR problems in an IGL environment.
The advantages of the proposed methodology can be summarized as follows: (1) In the implementation process of QFD, the IGL is employed to represent the form of evaluation information given by customers, which could well describe both the fuzziness caused by subjective uncertainty and the greyness caused by objective uncertainty, thus expanding the application field of QFD in insufficient information scenarios. (2) Considering that existing greyness measures of IGL variables cannot adequately consider customer heterogeneity, the degree of greyness function of IGL variables is defined based on the power utility function. The function can describe three different risk behaviors of individuals (risk attitudes: risk-averse, risk-seeking, and risk neutrality), which provides a new way to describe individual behavior factors in information processing. (3) A new Euclidean distance is defined, and a novel optimization model is constructed to derive the PR of each CR based on the idea of BWM, which provides a new technology for enterprises to identify the key CR in the process of product development. In the future, the application of the proposed model could be applied in risk evaluation, service design, performance evaluation, power system planning project selection [58], and other decision-making problems in uncertain environments.
However, the proposed approach still has some drawbacks, i.e., the approach is no longer able to handle the complex linguistic information (i.e., interval grey trapezoid fuzzy linguistic variables [59], interval grey uncertain linguistic variable [60], interval-valued fuzzy-rough number [61, 62]), the logarithm utility function, exponential utility function, and s-shaped utility function [50] are not considered, and how to determine the parameter γ more objectively, which deserve further discussion in the next work. Also, both the Full Consistency Method (FUCOM) [63] and the Level Based Weight Assessment model (LBWA) [64] were two newly developed methods for determining weights of criteria, which have more obvious advantages than AHP and BWM, and their application in QFD implementation is worth discussing in the future.