
Abstract
Deep learning has dominated the research field of traffic sign detection, but the traffic sign detection algorithms based on deep learning have difficulty in solving the two tasks of localization and classification simultaneously when performing traffic sign detection on realistic and complex traffic scene images, and the images or the types of traffic signs provided by the public dataset used by the relevant algorithm cannot meet the situations encountered in realistic traffic scenes.To solve the above problems, this paper creates a new road traffic sign dataset, and based on the YOLOv4 algorithm, designs a multi-size feature extraction module and an enhanced feature fusion module to improve the algorithm’s ability to locate and classify traffic signs simultaneously, in view of the complexity of realistic traffic scene images and the large variation of traffic sign sizes in the images. The experimental results on the newly created dataset show that the improved algorithm achieves 83.63% mean Average Precision (mAP), which is higher than several major object detection algorithms based on deep learning for the same type of task at present. The newly created dataset in this paper is publicly available at https://github.com/zhang1018/Traffic-sign-dataset-for-public.
Keywords
Introduction
With the rise of intelligent transportation system and autonomous driving technology, road traffic problems are becoming increasingly serious. As a major component of both, the reliability of traffic sign detection is crucial.
Traditional research methods use the color and geometric features of traffic signs to detect them, and this method not only takes a lot of time to design hand-made features for the specific color [1, 2] and shape [3–5] of traffic signs in images, but also is sensitive to external factors such as weather changes and occlusions.To solve the problems in the traditional method, related research [6, 7] added machine learning to the traditional method, which divides the detection into two steps, first locating the region of traffic signs in the image using the traditional method, and subsequently classifying the traffic signs in the region using a Support Vector Machine (SVM) classifier. The SVM classifier can effectively mitigate the effect of external factors, but this method still suffers from the trouble of needing to design hand-crafted features for different traffic signs. With AlexNet [8] winning the ILSVRC image classification and object recognition competition, Convolutional Neural Networks (CNN), as one of the representative algorithms of deep learning, reappear in the object detection field.The powerful learning capability of CNN allows it to rapidly dominate the field of object detection and produces many excellent algorithms: RCNN [9], Fast R-CNN [10], Faster R-CNN [11], SSD [12], and YOLO [13]. The goal of traffic sign detection is to enable the computer to locate and recognize all traffic signs within a scene, which belongs to the part of object detection. Therefore, CNN-based research methods are also applicable to the field of traffic sign detection. The CNN-based methods eliminate the need for hand-made features as in traditional traffic sign detection methods and are robust to detect traffic signs with different backgrounds due to external factors such as lighting and weather changes.
In order to transfer the achievements of CNN in the field of object detection to the field of traffic sign detection, some research [14–16] attempted to directly use excellent algorithms in the field of object detection to detect traffic signs, but failed to achieve a satisfactory result. Algorithms in the object detection field use the PASCAL VOC [17] and COCO [18] datasets for training and testing, and these datasets provide images with large sizes of objects, which leads to the weak ability of these algorithms to detect small size objects. But, in images of traffic scene, there are too many large size and small size traffic signs, which makes the algorithms in the field of object detection cannot perform well in the field of traffic sign detection. Other research [19–22] constructed their own detection networks using CNN, borrowing the structure of excellent algorithms in the field of object detection and using classical feature extraction networks such as VGGNet [23], GoogLeNet [24] and ResNet [25] as the base network. These algorithms cannot effectively solve the two tasks of localization and classification simultaneously when facing with realistic traffic scene images, because they do not give an effective method to detect traffic scene images with complex backgrounds and large differences in object sizes. On the one hand, the difficulty of traffic sign detection lies in the complexity of the background of the traffic scene images, which can interfere with the algorithm during detection. On the other hand, the traffic sign sizes in the images vary greatly, and there are mostly small size traffic signs, which are usually more difficult to detect than the large size traffic signs. Therefore, to solve the problems in traffic sign detection, it is necessary to design an algorithm that can detect both large size and small size traffic signs in complex trafficscenes.
Currently, the commonly used datasets for related research are GTSRB [26] and GTSDB [27], among which only GTSDB provides data that can be used to research the detection of traffic signs. But GTSDB only provides images and label information of three major categories of common traffic signs, which are far less than the types of traffic signs encountered in reality. Among the 43 types of traffic signs provided by GTSRB, traffic signs occupy such a large proportion that some images contain only one type of traffic signs, and these images can only be used to research the classification of traffic signs. For the above reasons, the data provided by GTSRB and GTSDB cannot meet the requirements of traffic sign detection in realistic traffic scenes, and the research results cannot be applied to actual traffic scenes. To solve the above proposed problems in the field of traffic sign detection, the main research contributions of this paper are as follows.
To make up for the shortage of public datasets, this paper creates a new dataset based on Chinese road traffic scenes with data from realistic traffic scene images. This dataset contains 77 categories of common traffic signs, and the information of categories and locations of traffic signs in each image are labeled.
The Multi-size Feature Extraction Module (MsFEM) and the Enhanced Feature Fusion Module (EFFM) are designed based on the YOLOv4 algorithm. MsFEM can help the feature extraction network to efficiently extract feature semantic information from the upper-level feature maps. EFFM can effectively retain and enhance the feature semantic information of small size objects in multi-scale prediction and improve the algorithm’s ability to detect small objects. Through experiments, these two modules show their effectiveness in improving the ability of the YOLOv4 algorithm to simultaneously locate and classify traffic signs on newly created datasets.
Several different sets of parameters are set for the MsFEM1, MsFEM2 and Maxpooling (sizen×sizen) modules of the improved algorithm for comparison experiments, and we finally obtain a set of parameters with the best performance.
The remainder of the paper is organized as follows. Section 2 introduces the related work in the field of traffic sign detection and recognition. Section 3 introduces the newly created dataset. Section 4 introduces the proposed method. Section 5 and Section 6 are the experimental and concluding sections, respectively.
Related work
CNN-based methods have become the mainstream research methods in the field of traffic sign detection and recognition, which has the same idea as the methods in the field of objectt detection. Object detection has essentially two tasks, one is detection and the other is classification. At present, CNN-based object detection methods can be divided into two-stage and one-stage. Two-stage divides detection and classification into two steps, first predicting the regions where objects exist in the image, followed by predicting the categories of objects in the regions; One-stage uses detection and classification as one step, directly predicting the location and categories of different objects in the image.
R-CNN is the first to use the two-stage method, which uses selective search [28] to generate object proposals and recognize these object proposals, and each generated object proposal is processed by convolutional neural networks, which leads to the low efficiency of R-CNN. Subsequently, Girshick et al. proposed Fast R-CNN, which uses a softmax layer in the final layer of the network to replace the SVM classifier in the R-CNN, but still didn’t solve the problem of low efficiency. In order to solve the problem of low efficiency, Ren et al. proposed Faster R-CNN. The highlight of Faster R-CNN is the use of region proposal network (RPN), which is a network structure that efficiently locate the object region. The RPN generates object proposals based on the feature maps extracted from VGG16 or ResNet101, determines whether these object proposals belong to foreground (containing objects) or background (not containing objects) by softmax layer, and performs bounding box regression on the object proposals belonging to foreground, which obtains the effective localization of the object regions. All object proposals in Faster R-CNN are generated on the RPN, so that each object proposal doesn’t need to be processed by the convolutional neural networks, which accelerates the detection speed of the network. But, RPN still does not meet the real-time requirement.
In order to further speed up the detection speed of the network, algorithms such as YOLOv3 [29] and SSD using the one-stage method successively emerge, and the design of these algorithms borrows the idea of full convolution of FCN [30] and multi-scale prediction of FPN [31]. The idea of multi-scale prediction is to use feature maps of different sizes obtained from feature extraction networks to perform feature fusion between high and low layer first and then separately and independently perform prediction operations. The full convolution idea is different from the traditional CNN network which uses a fully connected layer for classification at the end of the network, it uses a 1×1 convolution kernel instead of a fully connected layer at the end of the network. The output of full convolution is a feature map of the same size as the previous input layer, each value on which is the network’s prediction of a region of the original input image. The purpose of full convolution is to detect and classify the image at the pixel level, and calculate the loss function pixel by pixel, which is equivalent to one training sample per pixel. Through full convolution operation, the network can reduce the amount of computation, speed up the detection, and only need to input the image into the network to directly predict the result. SSD and YOLOv3 are faster than Faster R-CNN, but there is no significant improvement in detection precision. To improve the detection precision of the algorithm and its ability to detect small size objects, the author of YOLOv4 [32] used CSPDarknet53 as the base feature extraction network and used PANet [33] for multi-scale prediction, and these tricks showed their effectiveness on the PASCAL VOC and COCO datasets.
As described in the previous section, traffic scene images have the large variation of sizes and the complex background, which causes the object detection algorithms to perform poorly when used directly to detect traffic signs in traffic scene images. However, these object detection algorithms provide very advanced ideas, in particular, in YOLOv4, the author gives ideas to improve the detection capability of small size objects. Therefore, this paper based on YOLOv4 constructs an algorithm that can effectively detect and recognize traffic signs combining the distribution characteristics of traffic signs in traffic scene images.
Traffic sign dataset
Data collection
The images in the dataset are taken from Chinese road traffic scenes, and 40% of the images are provided by two authors, Zhu et al. [34] and Zhang et al. [35]. On the other hand, this paper uses cameras to take a large number of images about urban road traffic scenes, and keeps those images that contain traffic signs by selecting and cropping these images, which are the second data source of the dataset. In order to keep the realistic road scenes in the images, this paper resizes these images to 800×800 pixels, and some of the images are shown in Fig. 1. These images are taken under different road scenes, and the background of the images and the size of the traffic signs in the images are consistent with the realistic situation encountered in reality.
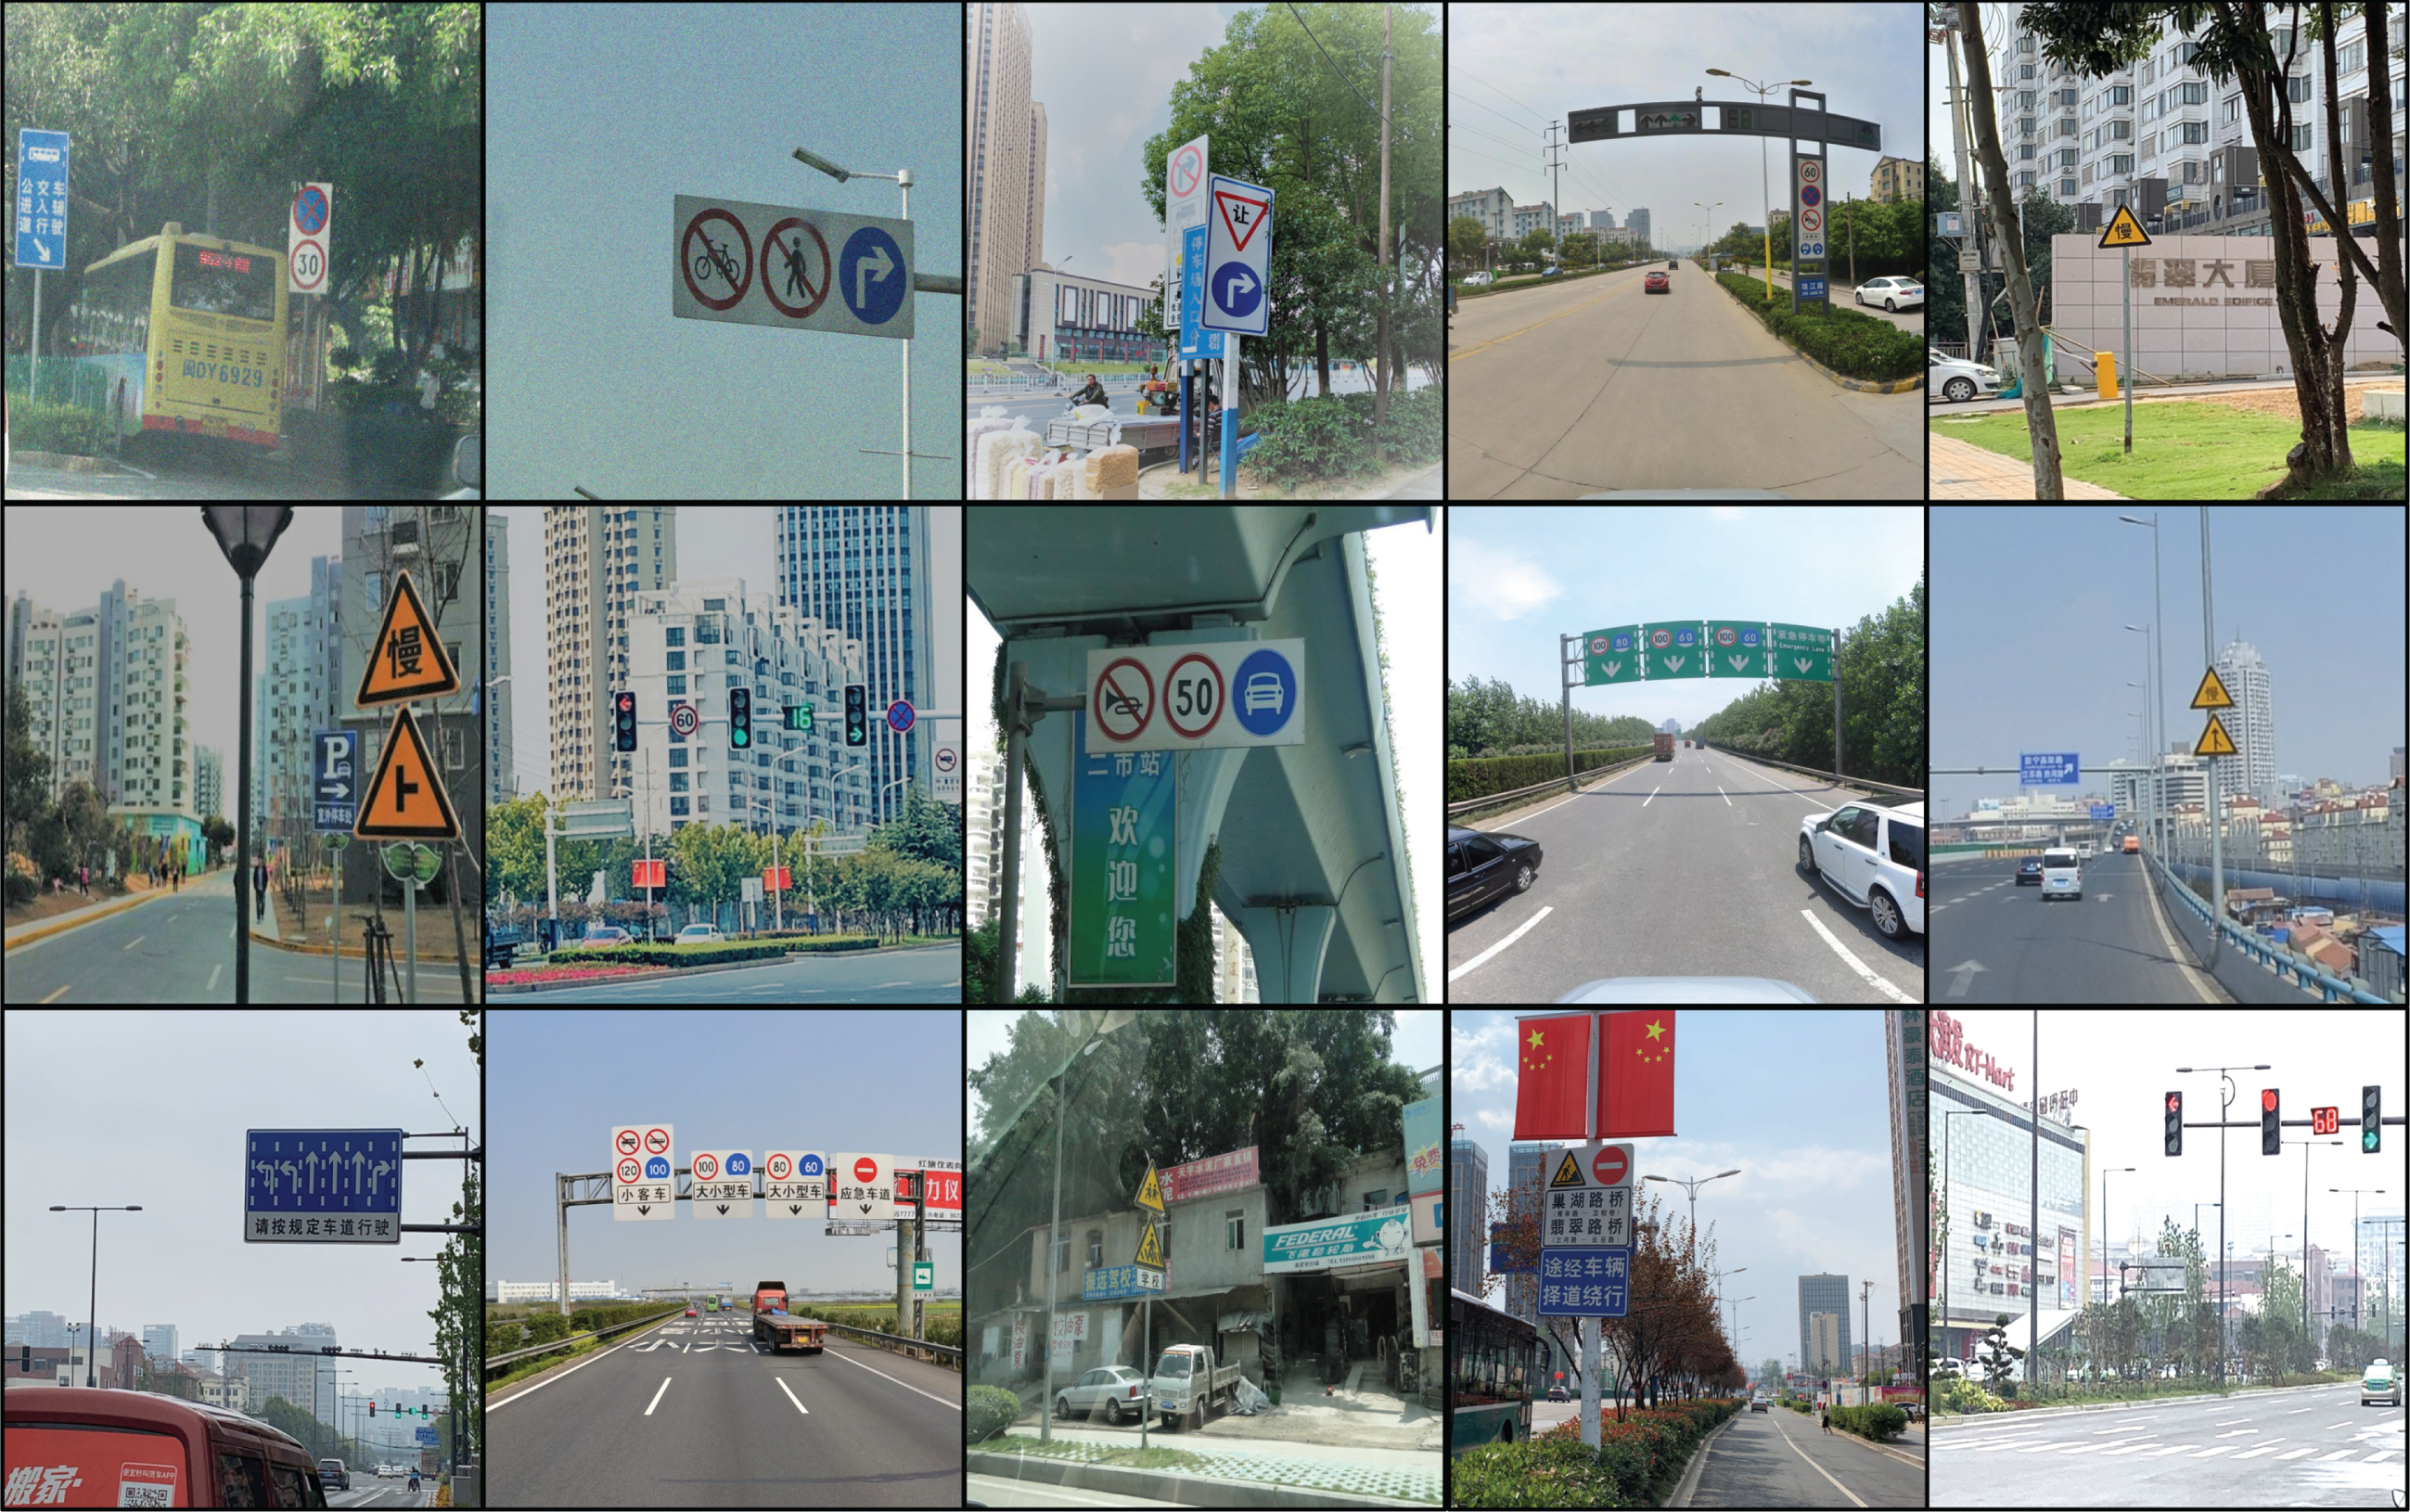
Traffic scene images.
As shown in Fig. 2, the dataset contains 77 categories of common traffic signs, and each color box in the figure represents a large category, from left to right, which are mandatory signs, prohibitory signs, warning signs and traffic signal. The character under each traffic sign represents its unique label. The traffic signs in the image are labeled by rectangular boxes and each traffic sign is labeled with a specific category. After labeling all the traffic signs in the image, the label information is saved as an xml file. During training and testing, these xml files provide the required label information, as shown in Fig. 3.

77 categories of common traffic signs.
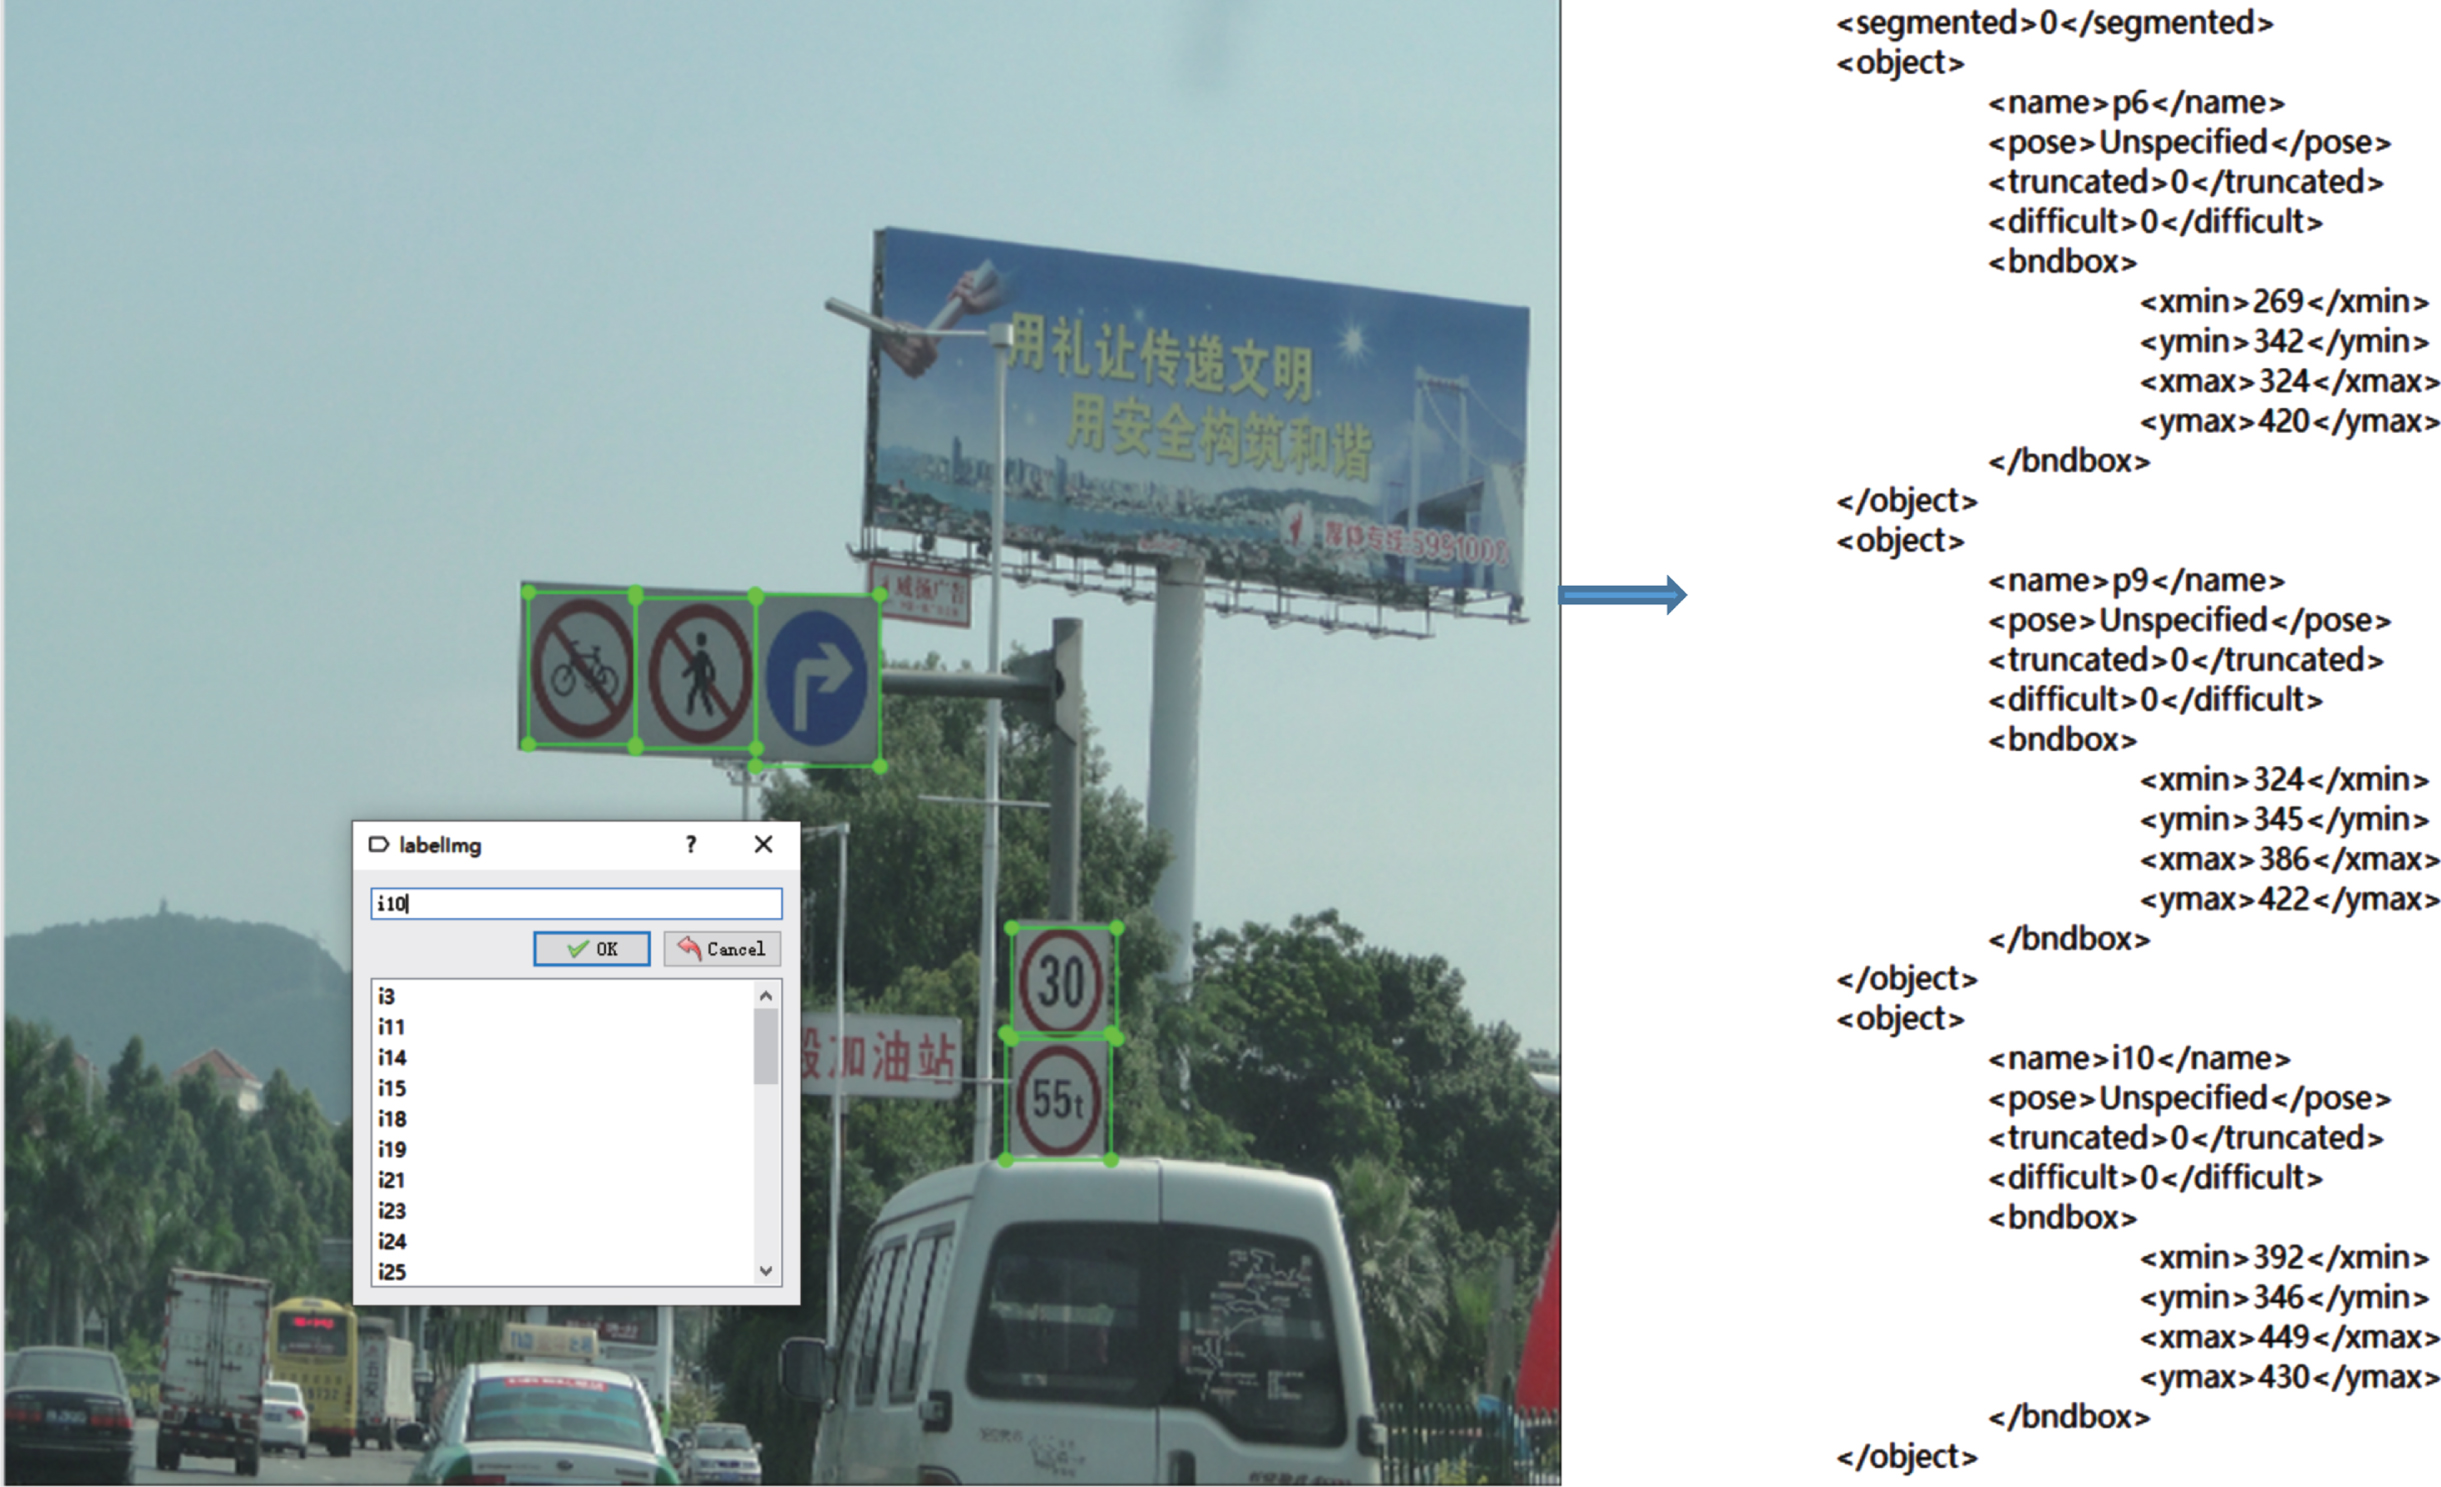
Label information.
After selecting and cropping 120,000 traffic images, the dataset finally consists of 11,000 images containing 15,000 traffic sign instances. The distribution of traffic sign sizes (in pixels) in the dataset is shown in Fig. 4. In this paper, some traffic signs with numbers (e.g., pl50, il60, etc.) in the dataset are considered as a family (pl stands for speed limit signs, it stands for minimum speed signs), and the number of instances of each traffic sign is shown in Fig. 5. It is inevitable that the number of different categories of traffic signs in the dataset varies due to the different distribution of road conditions in reality. For example, the number of road conditions with "continuous curves" signs is less than that with "watch out for pedestrians" signs.
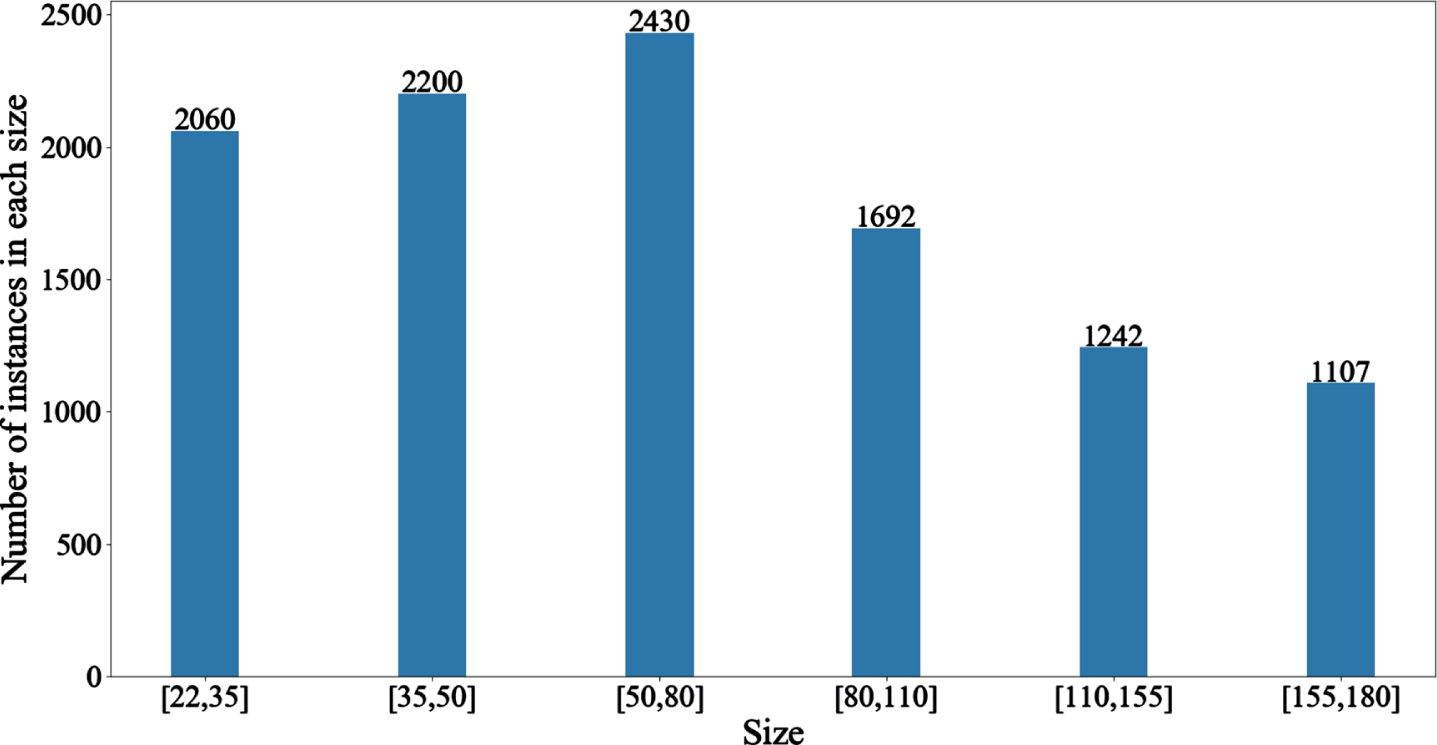
Traffic sign sizes distribution.
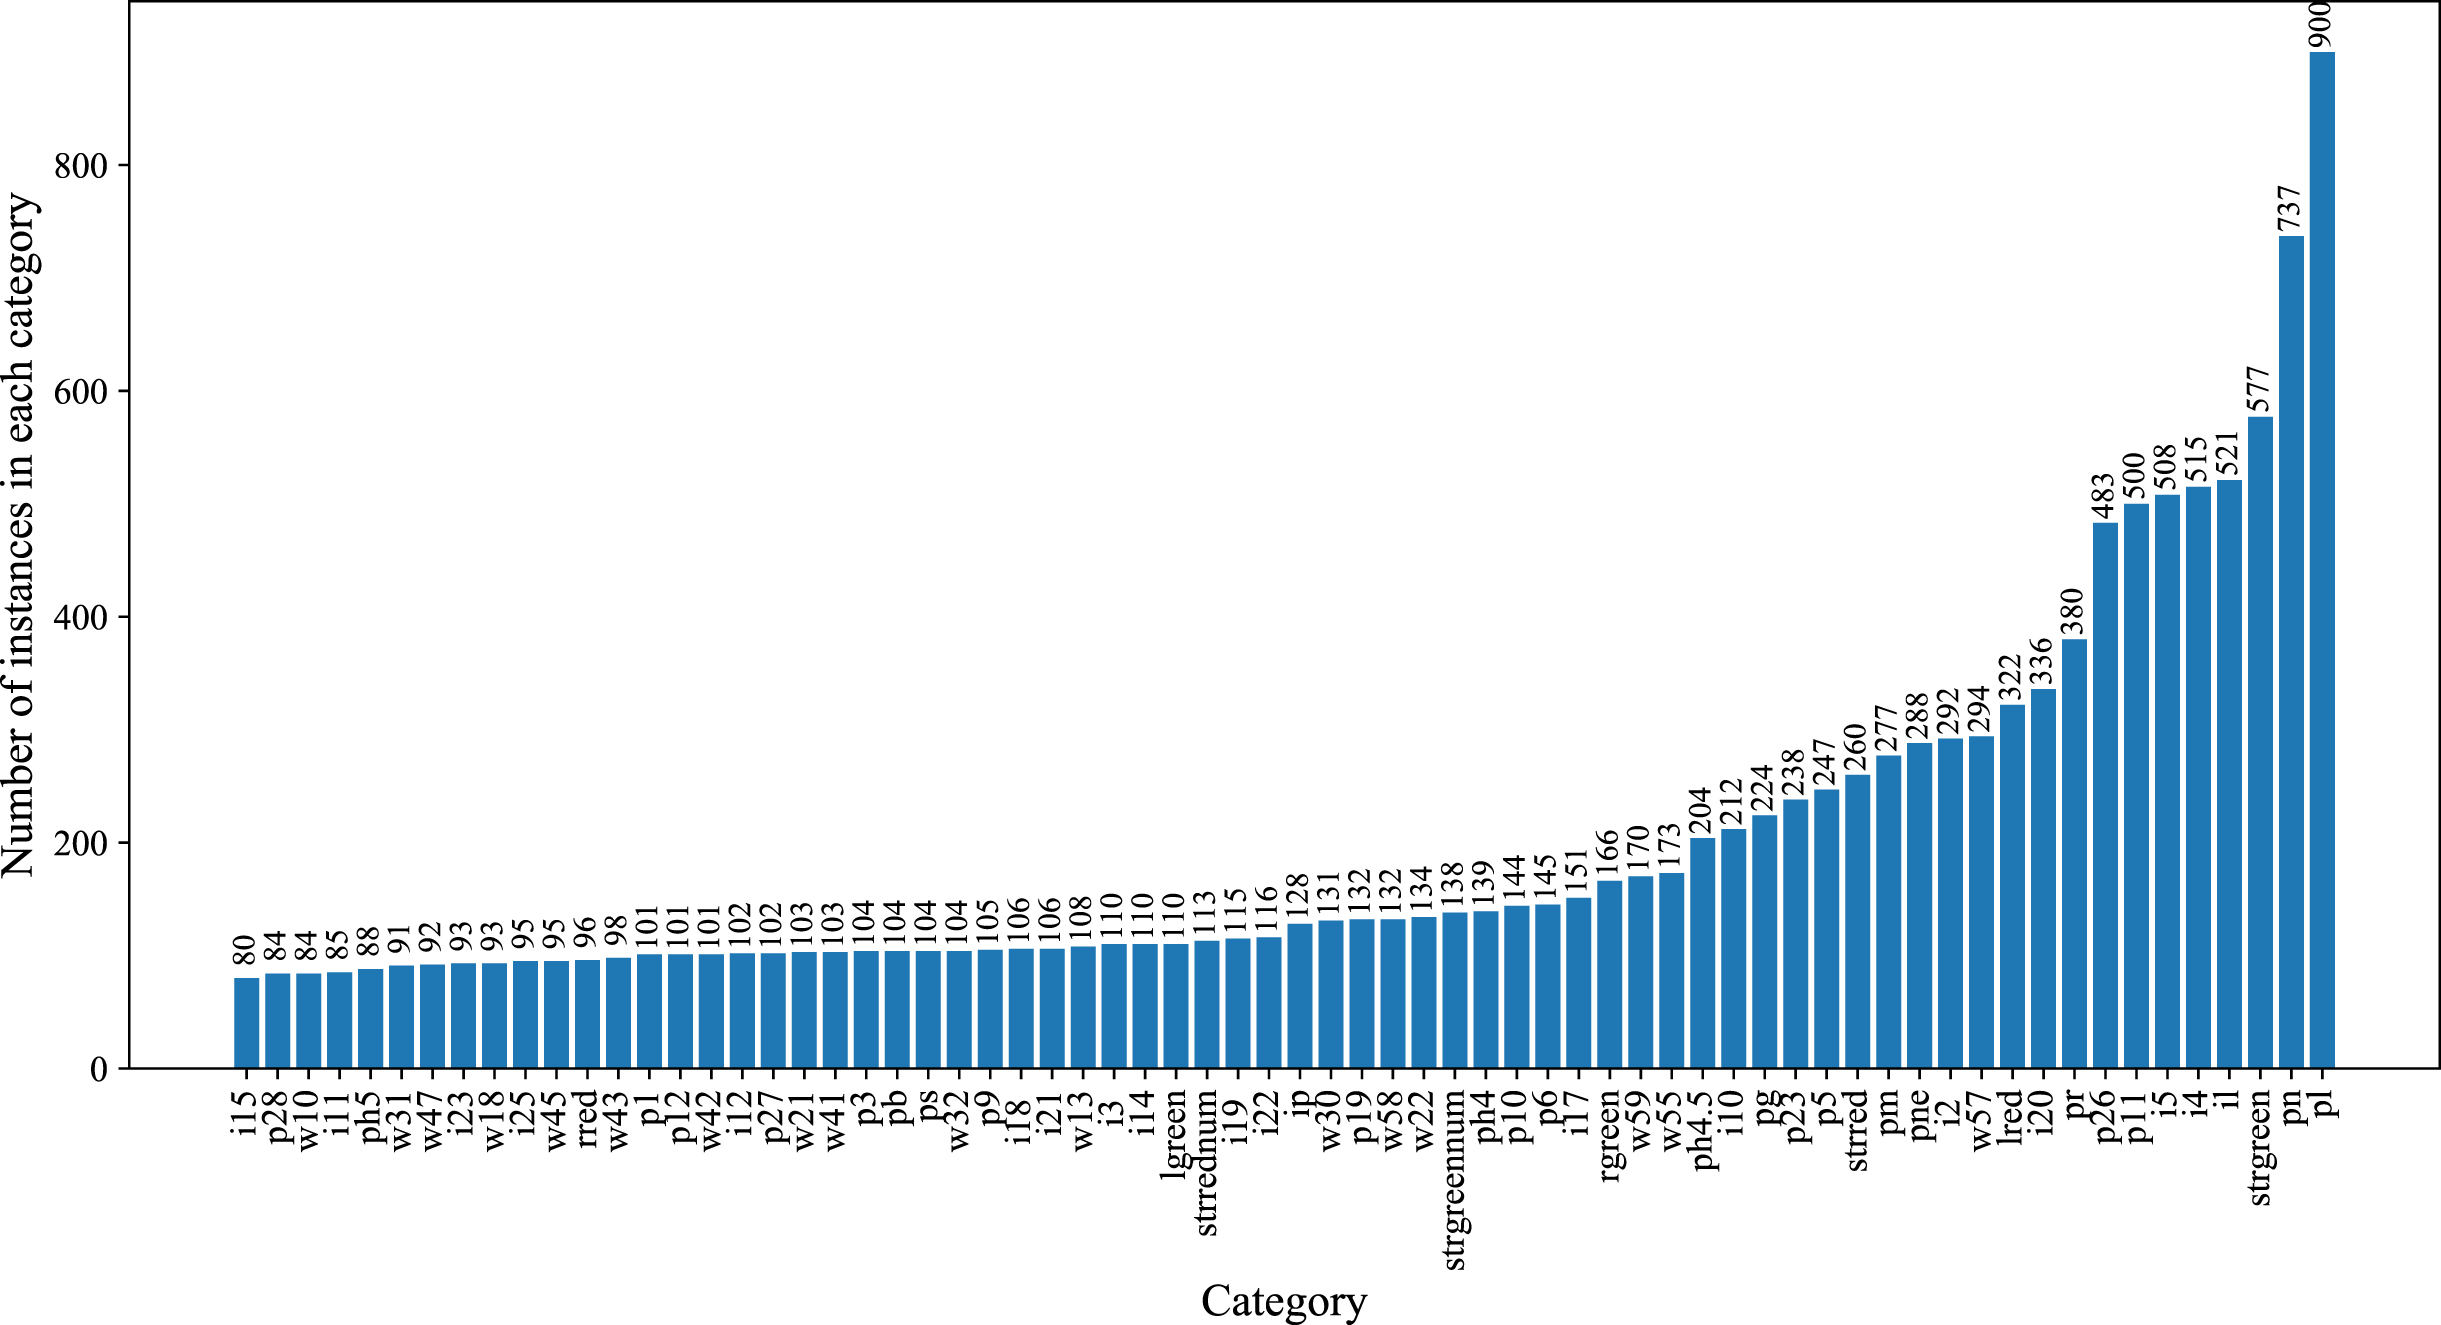
Traffic sign instances distribution.
In general, the data in the newly created dataset are derived from real traffic scene images, and the categories and locations of traffic signs in each image are labeled. The real scenes and detailed label information are consistent with the research on traffic sign detection and recognition in this paper.
Through experiments, the YOLOv4 algorithm doesn’t show effectiveness in locating and recognizing traffic signs. For this reason, the method of this paper is to improve the YOLOv4 algorithm in the context of the problems existing in traffic sign detection and recognition. The improved algorithm in this paper is called ME-YOLOv4, and the structure of YOLOv4 and ME-YOLOv4 are introduced in the following two sections, respectively.
YOLOv4 structure
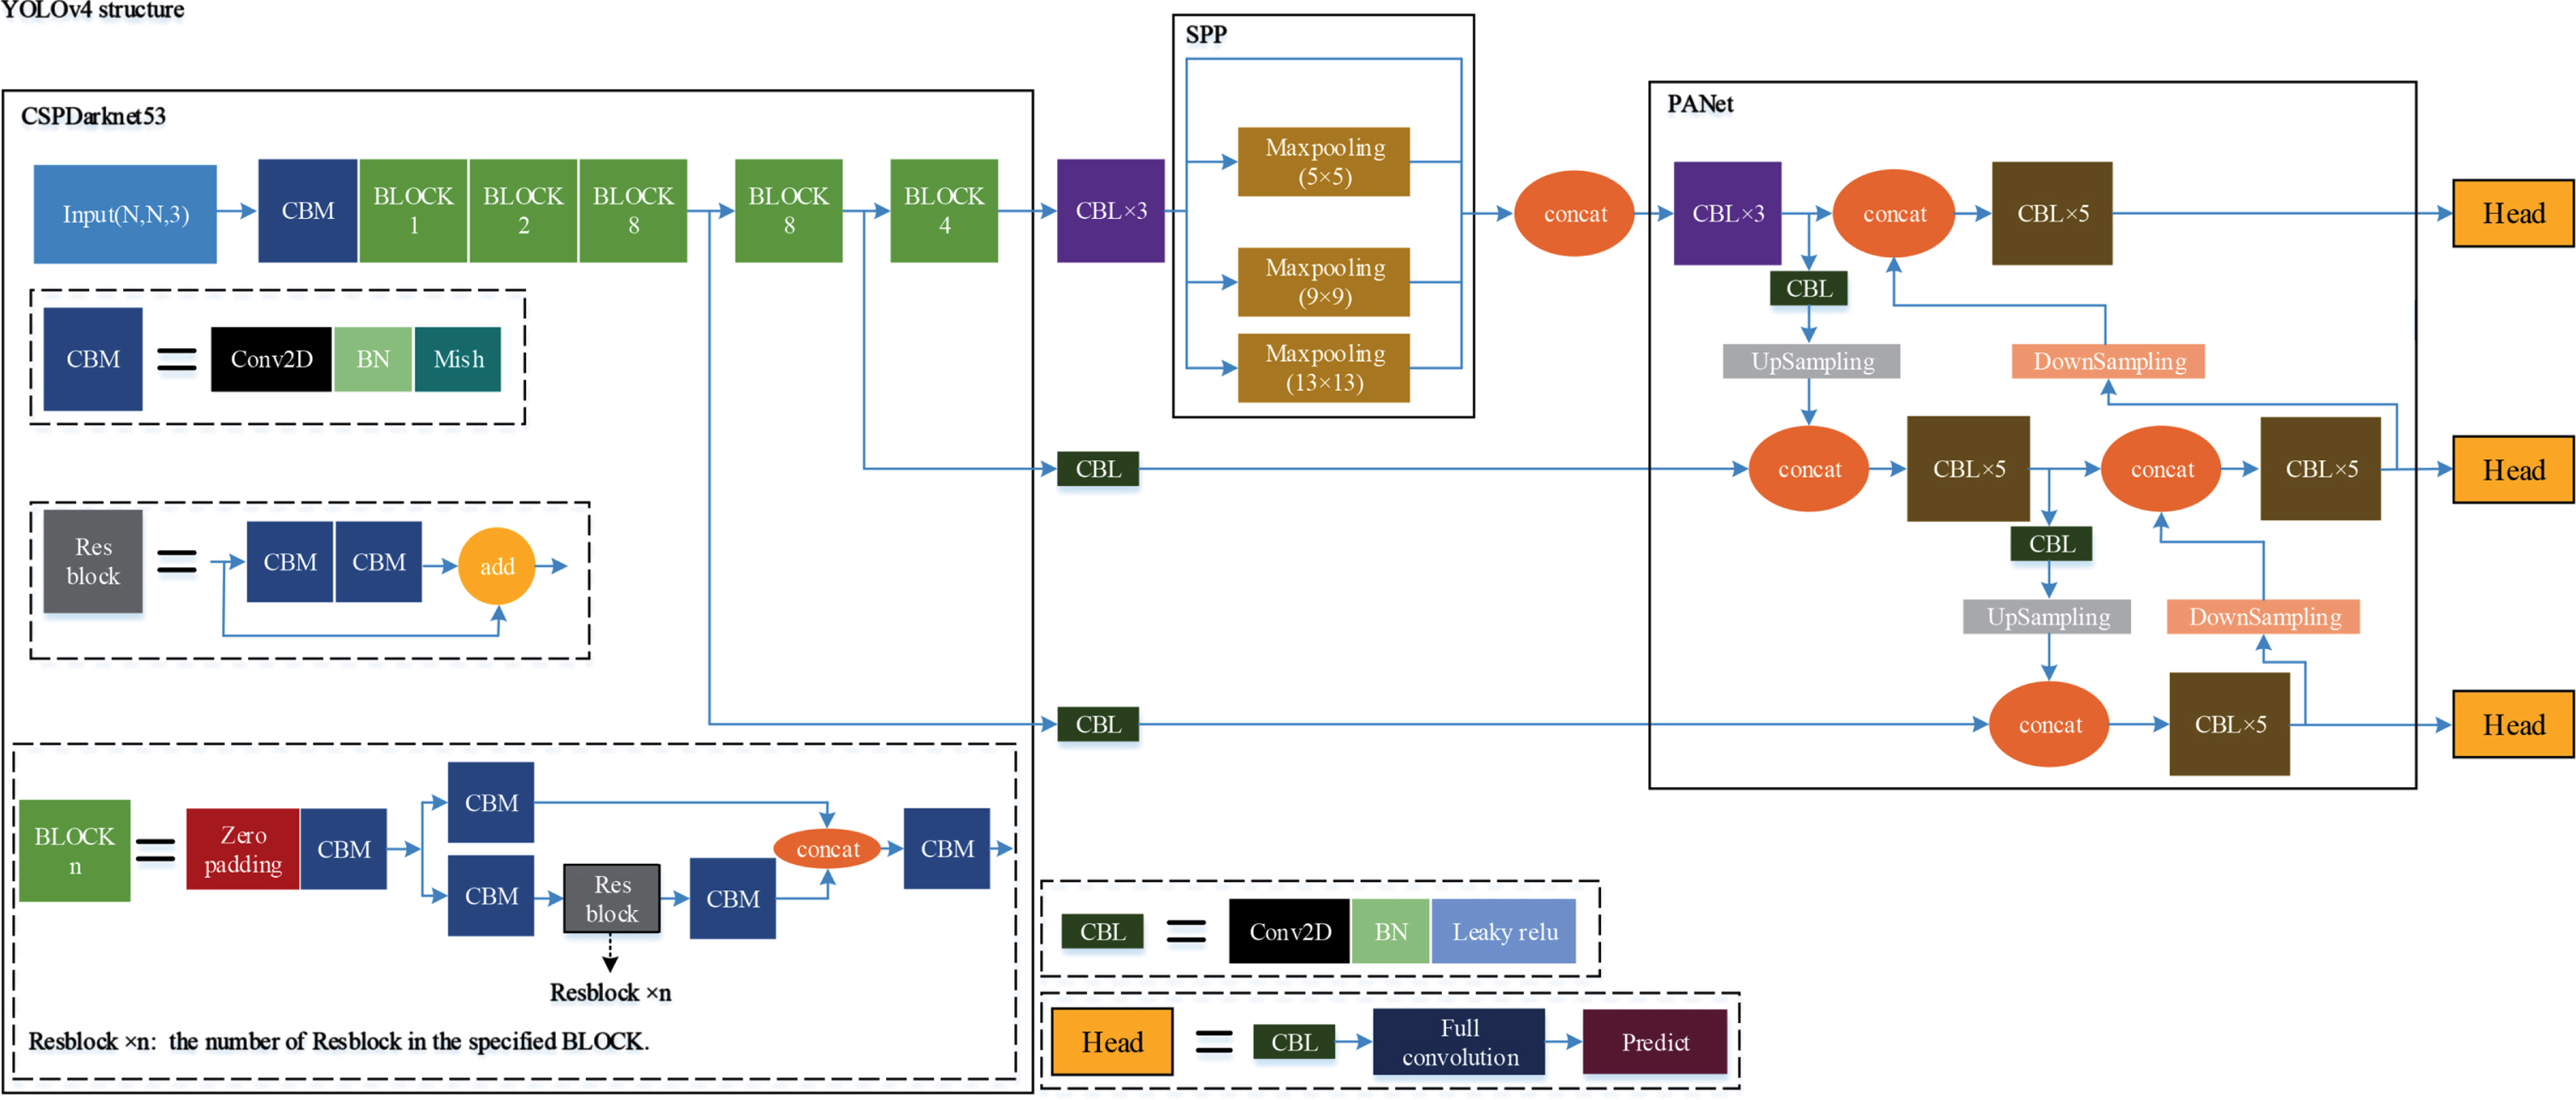
The structure of YOLOv4 is described below. CSPDarknet53 as the base network; SPP [36] as the additional module of the neck; PANet as the feature fusion module of the neck; Head of YOLOv3 as the head.
The specific structure of YOLOv4 is shown in Fig. 6. As the base network in YOLOv4, CSPDarknet53 is the CSP [37] added to each large residual block of Darknet53 [29], which finally consists of a convolution module and five BLOCKS. The convolution module is composed of a Conv2D layer, a BN layer, and a Mish activation function. Each BLOCK contains several Resblock and convolution modules. As an additional module in the neck, the SPP module performs MaxPooling of different sizes on the feature map extracted by CSPDarknet53, which aims to increase the perceptual field of the network. As the feature fusion module in the neck, PANet performs the downsampling operation after the upsampling operation of FPN to increase the location semantic information from the lower layer. The head of YOLOv4 continues to follow the head structure of YOLOv3. In this structure, it first performs feature extraction on the down-sampled feature map using the convolution module, followed by a full convolution operation [30] on the feature map after feature extraction to obtain the final prediction results. The convolution module in the neck and head structure is composed of a Conv2D layer, a BN layer, and a Leaky relu activation function.
YOLOv4 structure.
ME-YOLOv4 is an algorithm that can effectively locate and recognize traffic signs obtained by making several improvements on the basis of YOLOv4, which are as follows.
Due to the different shooting angles, there are large differences in the sizes of different traffic signs in the traffic scene images. When constructing the feature extraction network, if the network uses only one size of convolution kernel for each layer of feature extraction, the extracted feature map cannot fully and effectively contain the feature semantic information of different size traffic signs in the upper layer feature map. Inspired by the inception network [38], this paper designs the multi-size feature extraction module (MsFEM) and uses it in the feature extraction network. The specific structure of MsFEM is shown in Fig. 7, which uses two different sizes of convolution kernel to extract features from the upper layer images. MsFEM uses different sizes of convolution kernel, which means that different sizes of perceptual fields are used to extract the semantic information of traffic signs of different sizes. MsFEM concatenates the extracted feature maps together in order to transfer the semantic information of traffic signs of different sizes in the image to the deeper layers of the feature extraction network.
The background of the traffic scene image is complex, and there are many other signs that are similar to the traffic signs in color or shape. The feature extraction network also extracts the semantic information of these signs when extracting features, and the wrong semantic information of these signs will interfere with the network during training. If these signs can be effectively removed when the network extracts feature, the extracted feature map will be more representative, which will lead to better training results. The traffic signs in this paper can be divided into mandatory signs, prohibitory signs, warning signs and traffic signal. The warning signs are mostly yellow triangles with black borders. The prohibitory signs are mostly white circles with red borders. The mandatory signs are mostly circles or rectangles with blue backgrounds. The traffic signal is rectangular boxes with different color circles or arrows. According to the feature extraction invariance of CNN, the above features of traffic signs will be extracted completely when feature extraction is performed by the feature extraction network on the traffic scene images. Therefore, a series of MaxPooling operations with different sizes and step size of 1 are appropriately performed on the extracted feature map, which can make the feature semantic information of other signs in this feature map except traffic signs be reduced. In this paper, the above trick is used to remove the interference factors from the traffic scene images. The size of the feature map in the feature extraction network decreases with the process of downsampling, and the smaller the size of the feature map represents a larger perceptual field. In order to adapt this change, this paper uses different sizes of MaxPooling for different sizes of feature maps, and each MaxPooling occurs in one downsampling process. The specific process is shown in Fig. 9.
In FPN, with the purpose of allowing the feature semantic information at the higher layer to compensate for the feature semantic information not extracted at the lower layer, the feature semantic information at the higher layer is fused with the feature semantic information at the lower layer by upsampling. This trick can enrich the feature semantic information of each size feature map, but there are also limitations. In the process of downsampling, the feature extraction network scales down the size of the feature map, so that a pixel in the feature map is equivalent to a perceptual field, which maps a region of the original image and the size of the region is determined by the downsampling multiplier. When the size of the detected object in the image is smaller than the current downsampling multiplier, the feature semantic information of the detected object is lost with the downsampling process. In this case, the upsampling operation cannot achieve the fusion of feature semantic information between the high and low layers for those object s in the image that are lost due to their small size. The result of this situation is that the network has poor detection capability for small objects. In order to solve the above mentioned problems and improve the overall detection capability of the network for traffic signs in the dataset, this paper designs the enhanced feature fusion module (EFFM), and the specific structure is shown in Fig. 8. Firstly, before the feature fusion between the high-layer feature map and the low-layer feature map, the EFFM uses the convolution module to extract the features from the low-layer feature map, in order to further extract the effective feature semantic information from the feature map, especially for the smaller size objects. Then, EFFM fuses the feature map extracted by the convolution module in the lower layer with the feature map from the higher layer, and the feature map after feature fusion is compressed by using a convolution module. Finally, in order to maintain the location semantic information in the low-layer feature map, EFFM concatenates the unconvolved feature map in the low layer with the feature map after feature compression by shortcut. With the EFFM structure, the feature map obtained from the lower layer is enriched with both the original feature semantic information and the feature semantic information from the higher layer.

MsFEM structure.
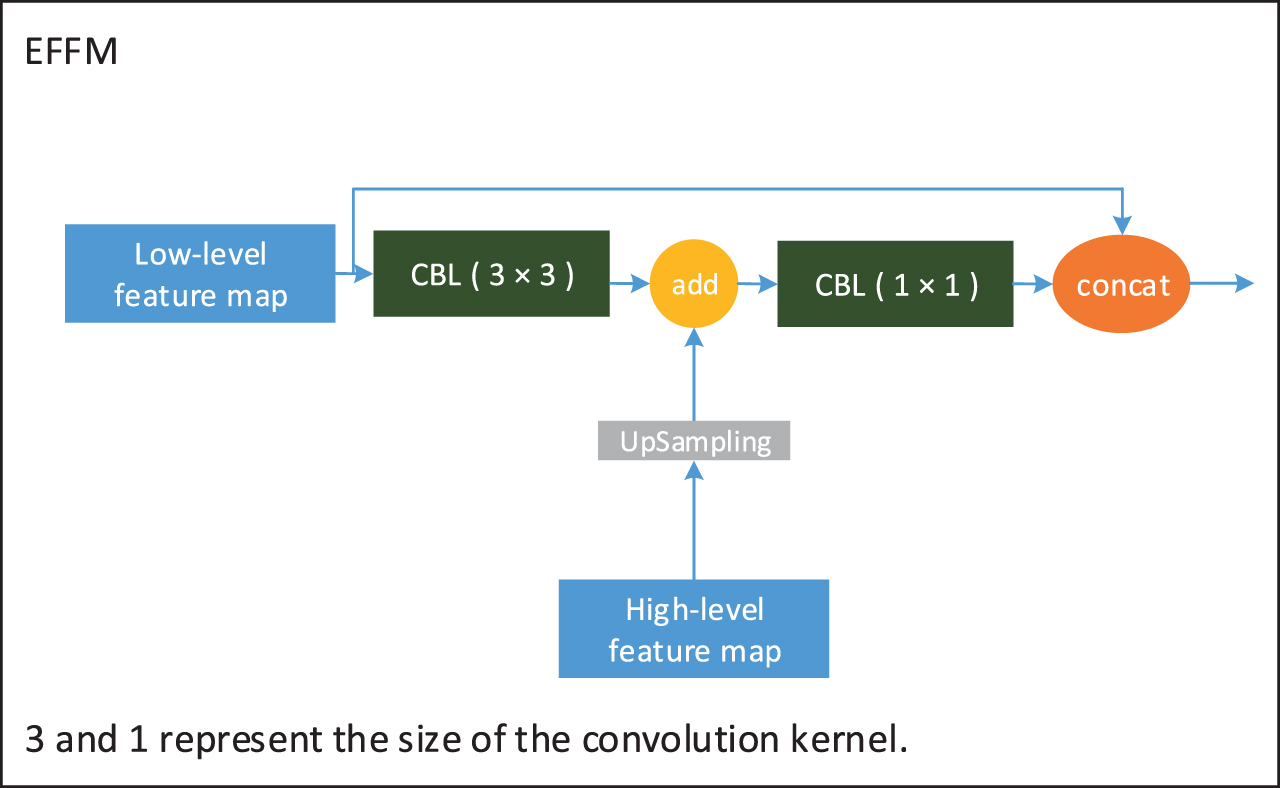
EFFM structure.
After adding the above improvements to the YOLOv4 structure, the structure of ME-YOLOv4 is shown in Fig. 9. The size of the convolution kernel in MsFEM and the MaxPooling are adapted to the size of the traffic signs in the newly created dataset. Besides, other parts of the network continue to use parts of YOLOv4.
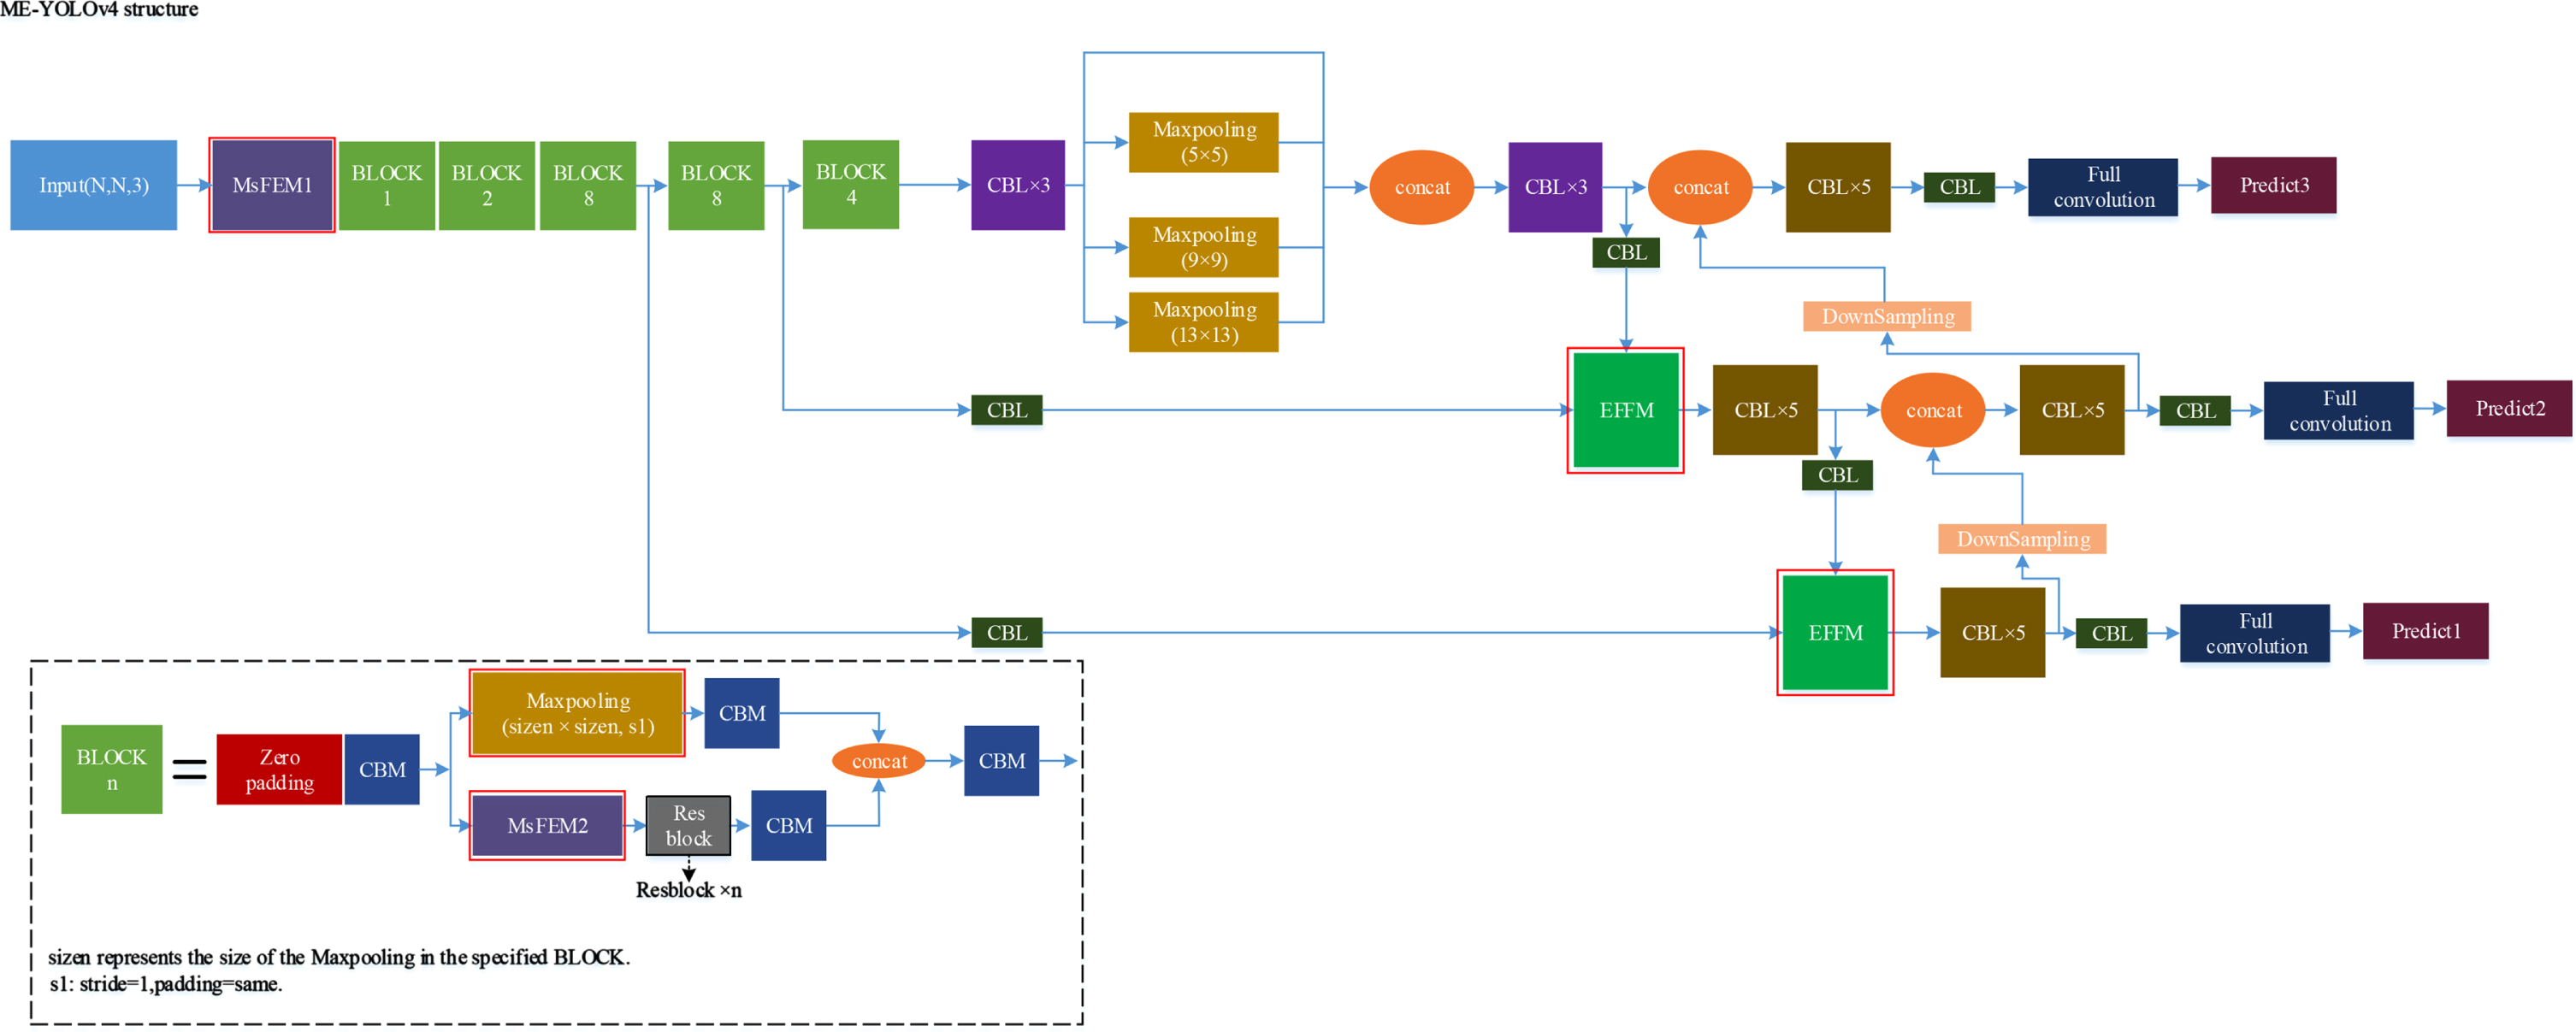
ME-YOLOv4 structure (The red solid box is the improvement of this paper).
Training
The newly created dataset provides the complete label information of the traffic sign category and location in image, so our all experiments are conducted on this dataset and the dataset is divided into a training set and a test set in the ratio of 8:2. In addition, the mosaic [32] trick is used to enhance the data for the categories with small sample size in the dataset, so that each category can be trained a certain number of times in one iteration.
In order to verify the effectiveness of the improved method, SSD, YOLOv3, YOLOv4 and Faster R-CNN are selected from typical algorithms in the object detection field, and a set of comparison experiments are set up with these selected algorithms and ME-YOLOv4. In addition, several different sets of parameters are set for experiments on MsFEM1, MsFEM2 and Maxpooling (sizen×sizen) modules in ME-YOLOv4, with the aim of determining a set of parameters that perform better on the dataset. These parameters are set by adapting the size of the traffic signs in the newly created dataset, and the specific parameter settings for each group are shown in Table 1. For training, each group of algorithms uses the same hyperparameter setting: The initial learning rate is set to 0.001; The Adam optimizer with default parameters is used; The validation set is divided from the training set in the ratio of 7:3 to monitor the whole training process. All experiments are run on a Linux server with an Intel Xeon(R) Silver 4210 CPU, 128GB of RAM, and two NVIDIA TITAN RTX GPUs and using the Tensorflow deep learning framework.
Parameters setting
Parameters setting
During training, we set 1000 epochs for each algorithm, and at the end of each epoch, the weights obtained from training are tested on the validation set in order to calculate the value of the loss function. The loss function value obtained on the validation set will become the monitor that monitors the whole training process, if the loss function value decreases, the weights recorded in the previous epoch will be overwritten. In the training process, if the loss function value does not decrease within 50 consecutive epochs, the learning rate will be adjusted to 0.1 times of the original one; if the loss function does not decrease within 100 consecutive epochs, the training process will be terminated and the weights recorded at the lowest value of the loss function will become the weights we finally obtain. By the above training strategy, the SSD, YOLOv3 and YOLOv4 terminate training process after 705, 735 and 720 epochs, respectively, while our improved algorithm terminates training process after 680 epochs. The test set is examined with the training weights of each group of algorithms mentioned above and the evaluation metrics of the PASCAL VOC are used to evaluate the results obtained by each group of algorithms on the test set. The mean average precision (mAP) values obtained by each group of algorithms on the dataset are shown in Table 2 and the average precision (AP) values obtained by each group of algorithms on each category in the dataset are shown in Table 3.
The mAP values obtained by each group of algorithms on the new dataset
The mAP values obtained by each group of algorithms on the new dataset
AP values obtained by each group of algorithms on the new dataset
According to Table 3, on all categories, the minimum AP values obtained by the four algorithms with the settings of Table 1 are 0.34, 0.36, 0.40, and 0.40, respectively, and the minimum AP values obtained by SSD, YOLOv3, YOLOv4, and Faster R-CNN are 0.23, 0.29, 0.35, and 0.26, respectively. In addition, the categories with AP values greater than 0.7 obtained by the four algorithms with the settings of Table 1 are 82%, 83%, 85%, and 90% of the total categories, respectively, and the categories with AP values greater than 0.7 obtained by SSD, YOLOv3, YOLOv4, and Faster R-CNN are 73%, 74%, 77%, and 73% of the total categories, respectively. According to Table 2, on the dataset, the mAP values obtained by the four algorithms with the settings of Table 1 are 82.55%, 82.9%, 83.63%, and 83.48%, respectively, and the mAP values obtained by SSD, YOLOv3, YOLOv4, and Faster R-CNN are 76.22%, 75.72%, 80.37%, and 77.13%, respectively. The best mAP values obtained by the four algorithms with the settings of Table 1 are 7.41%, 7.91%, 3.26%, and 6.5% higher than those obtained by SSD, YOLOv3, YOLOv4, and Faster R-CNN, respectively. Through the experimental results, it verifies that the method proposed in this paper really improve the ability of YOLOv4 algorithm to locate and recognize traffic signs simultaneously, and also verifies that MsFEM can effectively help feature extraction networks to extract feature semantic information of traffic signs of different sizes in images and EFFM can effectively retain and enhance feature semantic information of small size objects in multi-scale prediction. The experimental results also show that the ME-YOLOv4 III algorithm outperforms other algorithms for traffic sign detection and recognition, and the algorithm can be used to detect and recognize traffic signs in realistic traffic scene images.
To better verify the effectiveness of our improved algorithm, we compare the experimental results obtained by ME-YOLOv4 III on the GTSDB with the recent research results, as shown in Table 4. Through the comparison, our improved algorithm shows some competitiveness.
Performance of each group of algorithms on the GTSDB
To solve the problems in the field of traffic sign detection, this paper creates a new traffic sign dataset, and based on the YOLOv4 algorithm, designs a multi-size feature extraction module and an enhanced feature fusion module. On the new dataset, it experimentally verifies that the improved method proposed in this paper can effectively improve the ability of YOLOv4 algorithm to locate and classify traffic signs simultaneously. In future research, we will continue to expand the categories and numbers of traffic signs in the dataset, and continue to investigate how to improve the algorithm’s ability to locate and recognize traffic signs with large size differences in traffic images with complex backgrounds.
Footnotes
Acknowledgments
This work is supported in part by the Anhui Provincial Key R&D Program of China under Grant 202004- a05020040, and in part by the National Key Research and Development Program of China under Grant 2018YFC0604404.