
Abstract
The paper constructs a research model mainly based on the Deng’s correlation analysis model on the convergence level measurement, the GM (1,1) coordinated development prediction model and PLS-Structural Equation Model (PLS-SEM) analysis model on the influencing factors. The data about China’s digital economy and real economy from 2005 to 2019 (totaled 2,250) is adopted to conduct an empirical analysis of the convergence level from 2005 to 2019 and predict the development trend from 2020 to 2029. The paper could further analyze the influencing factors of convergence, in an attempt to put forward relevant development suggestions. We hope the study could provide an objective reference and theoretical basis for improving the convergence level in China in some extent.
Keywords
Introduction
Since the 21st century, the digital technology has entered a new round of accelerated development. The 5 G, Big Data, Artificial Intelligence, Internet of Things, Cloud Computing, Blockchain and other technologies have reconstructed the material foundation of the Information Age as well as could be found widely into various industries. The world has entered a new era characterized by emerging smart, data-driven and learning economy [1]. In general, it is considered that the digital economy is a series of economic activities with digital knowledge and information as the key production factors, modern information network as a crucial carrier and the effective use of digital technology as an important driving force for efficiency improvement and economic structure optimization [2–5]. For the real economy, the main advantages are relatively mature technical capabilities, product systems and industrial foundations while the disadvantages comparing with the digital economy mainly include the lack of innovation capabilities and new production factors(e.g. data), which need further optimization and improvement on the transaction costs and operational efficiency. Meanwhile, the main advantage of the digital economy is that it could extend the industrial boundaries through network effects, platform effects, economies of scope and scale effects as well as the data in the digital economy could continuously drive the innovation of technology. However the disadvantage is mainly that it has strong asset-light attributes and has the risks of bubblization. Generally speaking, The digital economy has subverted the original logic of cost, price and quantity, creating an associated profit source beyond the products, which brings the economy of scope to the extreme as well as new development opportunities for the real economy [6].
Although academia has done more research on issues related to inter-industry convergence, there are relatively few studies on the convergence of the digital economy and real economy. Most scholars have mainly carried out research on the convergence of specific industries in the context of the digital economy [7–12]. For example, Cao studied the convergence process of different industries within the manufacturing industry as well as the influences of the convergence on the industrial structure and performance [13]; Yang and Liu analyzed the basis and process of the integration between manufacturing industry and productive service industry [14]; Wen and Chen explored the path of the digital economy to promote the convergence of rural industries [15]. Furthermore, some scholars have focused on the research on the relationship between the digital economy and the real economy in recent years. For example, Zhang et al. put forward some policy suggestions to tackle the problems in the course of China’s digital economy and real economy deeply integrated, which was based on the analysis of Zhejiang province’s digital economy development experiences combined with a large quantity of interviews including enterprises and governments [16]. Prokopenko et al. discussed the possibility of digital technology to improve the efficiency of business processes as well as the advantages of the digital transformation of business from the perspective of enterprises [17]. Ma and Ning applied the mediating effect model to investigate the effect of digital economy on the quality upgrading of manufacturing industry and found that digital economy could significantly promote the quality upgrading of manufacturing industry [18]. Jiang and Sun utilized the weighted least squares,quantile regression and cross-secction threshold regression to demonstrate the overall effect, conditionality and stage characteristics of the digital economy’s impact on the real economy, which was found that it presented the characteristics of first “promotion effect” and then “crowding out effect” [19]. Xu et al. used the adjusted Logistic model to conduct an empirical study on the internal mechanism of the convergence between China’s digital economy and real economy from 2005 to 2019 as well as predict the overall trend of the co-evoluation under seven evolution modes [20].
It could identified that the mechanism of the co-evolution of China’s digital economy and the real economy has been already explored in some extent, however, there is a lack of objective and reliable empirical research on the convergence level and influencing factors of the two economies. Therefore, we attempt to conduct research in the following aspects: observing the the convergence level from 2005 to 2019 to find the convergence law; predicting the co-evolution trend of the two economies in the next 10 years; and studying the influencing factors that affect the level of co-evolution. Consequently, it could possibly make up for the insufficiency of existing researches through a quantitative analysis method to explore the convergence level and the influencing factors. Moreover, it may provide some decision-making references for government departments at all levels when they formulating digital economy policies to effectively promote the coordinated development of the digital economy and real economy. Besides, the research process is shown in the following Fig. 1.
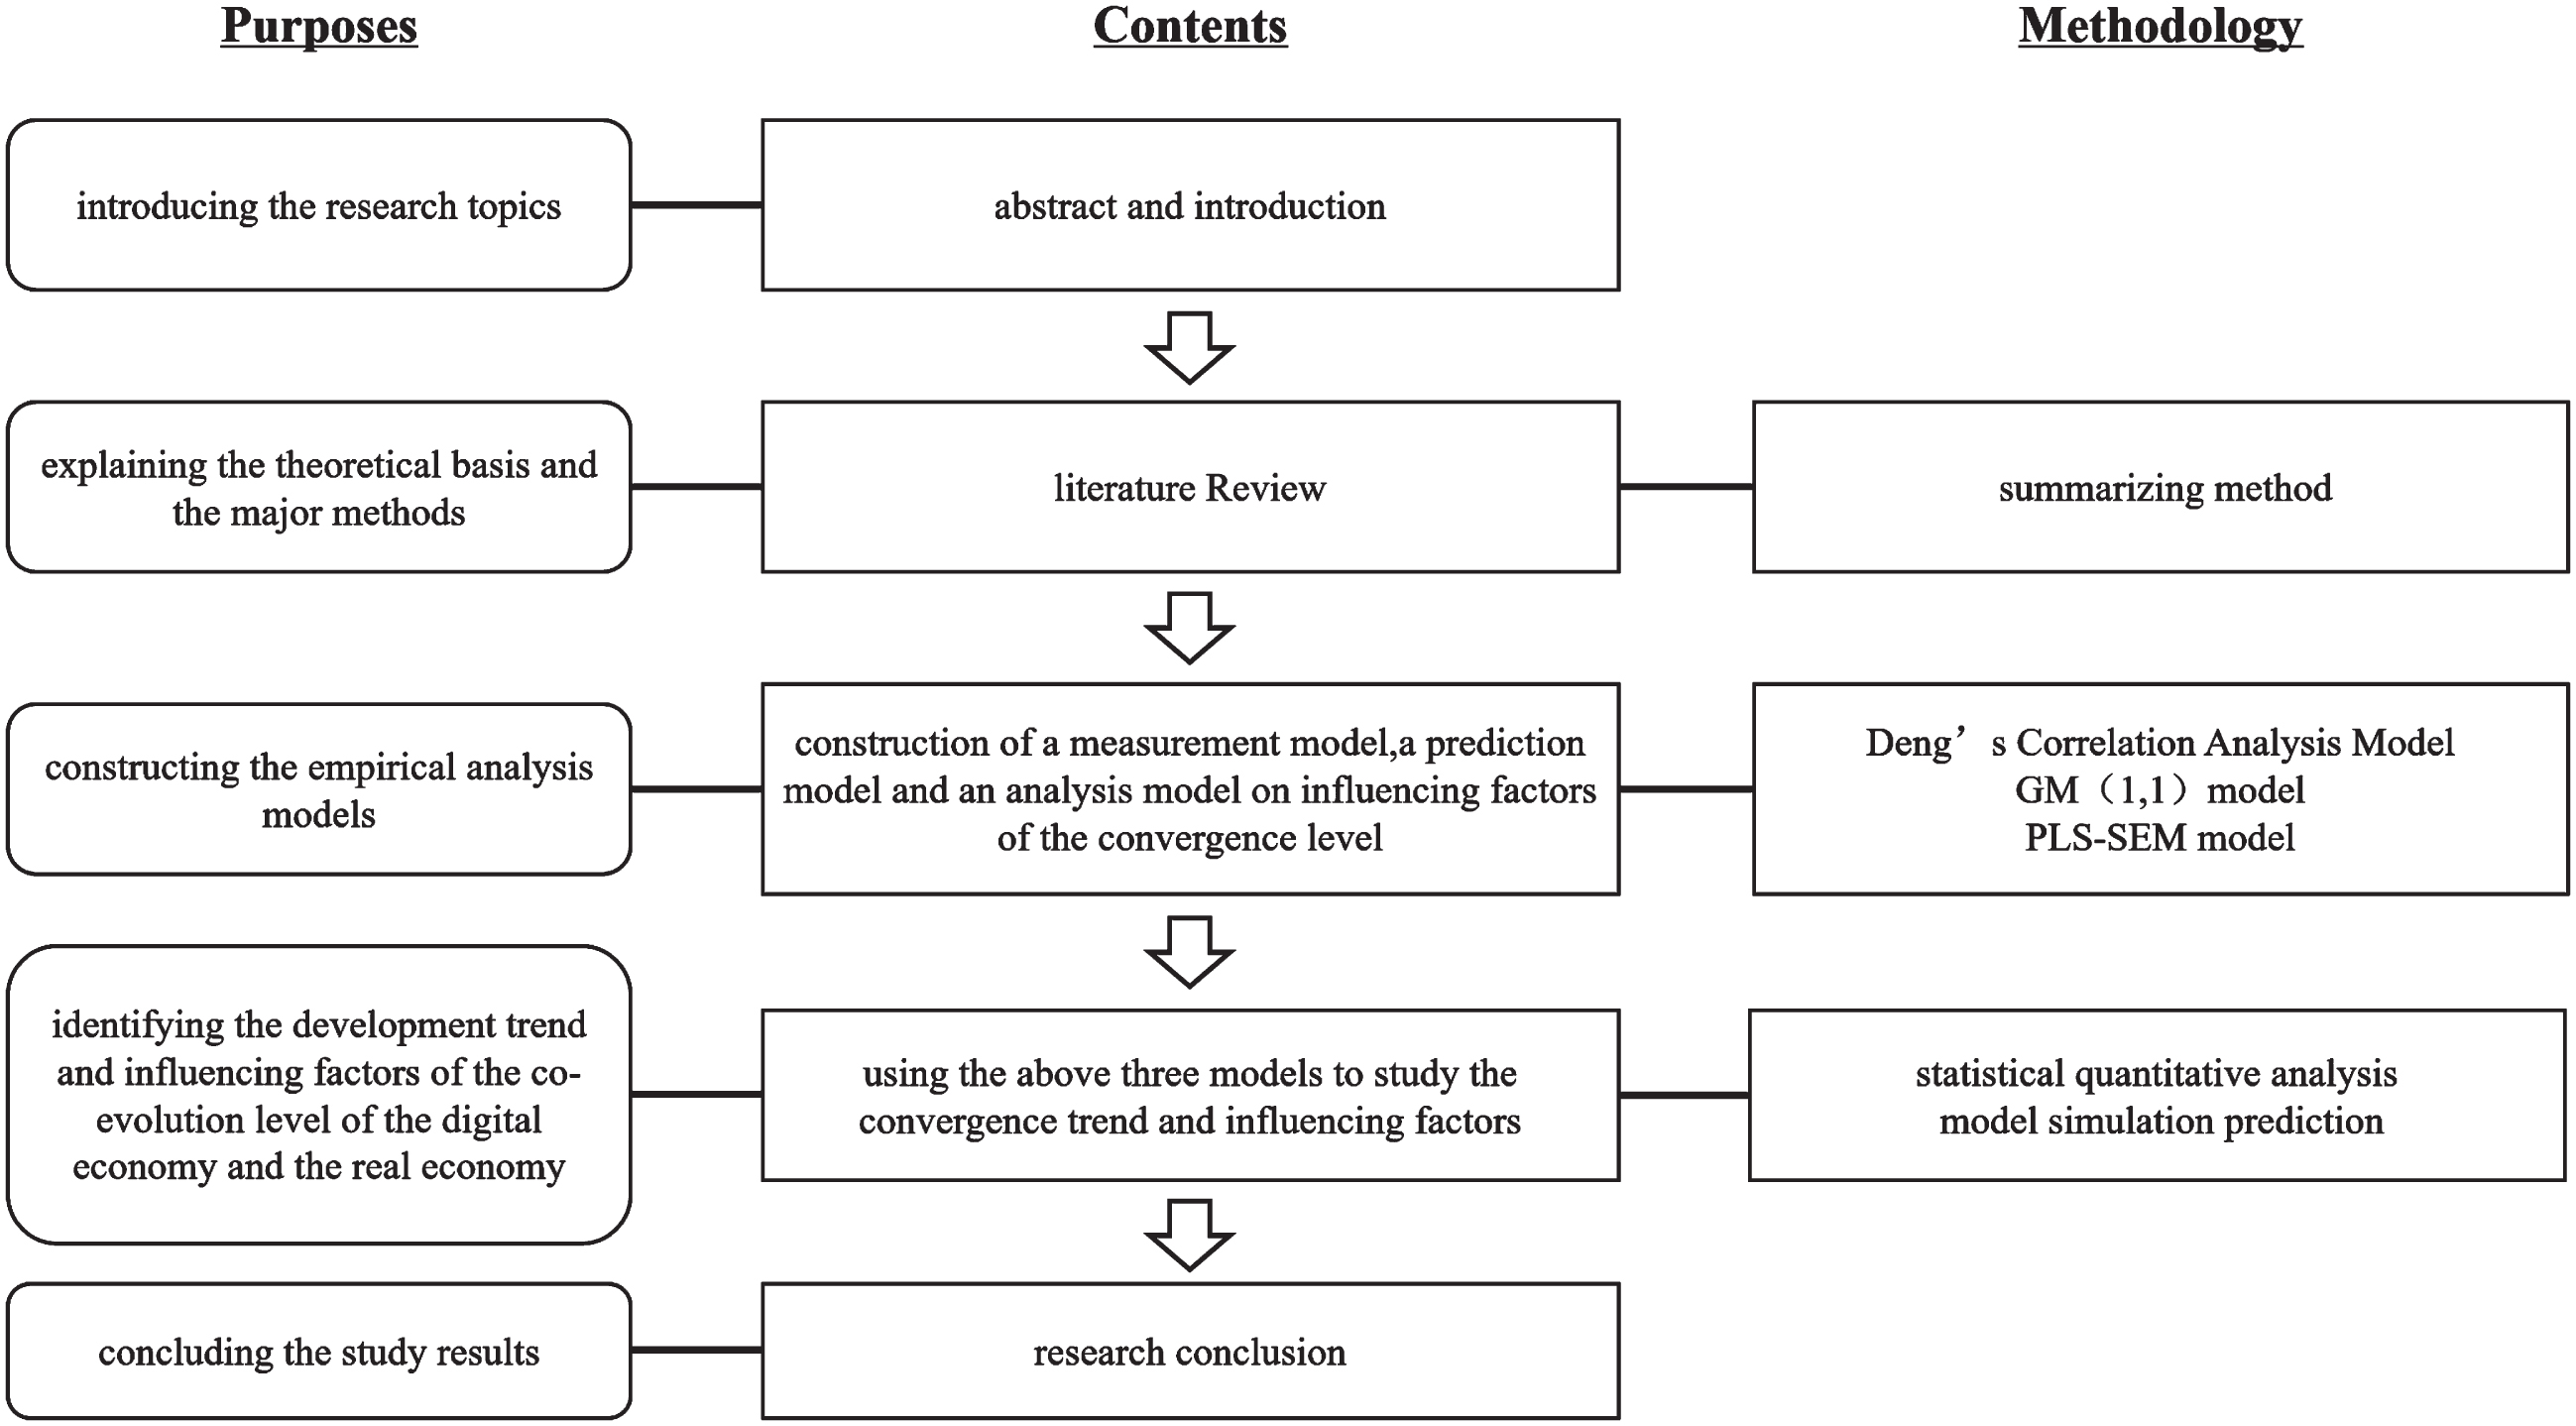
Flow chart of the research design.
Connotation of industrial convergence
Types of industrial convergence
Summary of theoretical research
Grey relational analysis
Grey relational analysis (GRA) is an important part of Grey system theory, which is suitable for solving problems with complicated interrelationships between multiple factors and variables [32]. Compared with regression analysis, variance analysis, principal component analysis and other methods, GRA is suitable for small sample and irregular sample analysis. It has been widely used in industry, economy, management and other fields [33–36]. Furthermore, the major advantage of GRA is that it can handle both incomplete information and unclear problems very precisely [37]. In recent years, Deng’s correlation model has been widely used in the disease control, decision making of asset allocation and analysis of influential factors of housing prices [38–40].This paper focuses on Deng’s correlation model of GRA:
In view of the above assumptions, Deng’s correlation analysis model is as follows: Step 1: Selecting a method to perform non-dimensional processing on X0k and Xik. In general, the most frequently used methods are initialization, mean generating and intervalization. This paper will focus on sorting out the methods, specifically: Initialization:
Mean generating:
Intervalization:
Step 2: calculating the correlation coefficient according to the non-dimensional sequences of
Step 3: calculating the overall correlation between the sequences:
Deng’s correlation model focuses on holistic analysis. When the system has singular values, the resolution coefficient could be smaller to weaken the influence of singular values.
Grey Model (GM) is mainly used for predictive analysis of Grey systems that contain known and unknown information, in which the general expression is GM (X, N). GM (X, N) means to use X-order differential equations to model and analyze N variables. Furthermore, the most widely used Grey scale analysis model is GM (1,1) on basis of the first-order linear differential equation. After initial processing is performed by accumulated generating operation (AGO), inverse accumulated generating operation (IAGO), mean generating and class ratio generating of discrete data scattered on the time axis, which could weaken the influence of unknown factors in the Grey system and strengthen the influence of known factors. It is suitable for studying uncertain problem with less data and poor information [41–43]. This paper will focus on summarizing the GM (1, 1) modeling to provide a theoretical basis for the subsequent analysis.
Assuming x(0) = (x(0) (1) , x(0) (2) , …, x(0) (n)) is the original sequence to be predicted, the GM(1,1) modeling process is as follows: 1-AGO: Supposing x(1) is an accumulated generation sequence of x(0), and z(1) is the generated mean sequence of x(1), while z(1) (k) is the mean value of adjacent data, namely:
in which z(1) = (z(1) (2) , z(1) (3) , …, z(1) (n)). Establishing GM(1,1) first-order linear differential equation:
Constructing data matrix B and Y:
Finding sequence of parameters μ (μ = (a, b) T) The GM (1, 1) equation can be written as Y = Bμ and the estimated value of μ can be solved using the least square method:
Evaluating the whitening response of GM (1, 1) First, the whitening equation of GM (1,1) is
Then, substituting We have
Checking model accuracy
In order to determine whether we need a residual error model to modify the GM(1,1) model or use other model, we adopt two most frequently used methods to test accuracy of the prediction model, i.e., residual error checking and after-test residual checking (i.e., Variance ratio test and Error probability test), as described below [44, 45]:
A. Residual error checking (
Supposing
Then, the average relative residual value is:
B. After-test residual checking
After-test residual checking is a test on statistical character in accordance with residual’s distribution. We firstly get the variance ration from the mean and mean square error and then calculate the residual probability accordingly: Variance Ratio Test (C) Based on the above assumptions, the variance values of the original sequence and the residual sequence are:
Then the variance ratio is:
Error probability test (p)
Finally, we could calculate the error probability:
Furthermore, it would indicate the different model accuracy varying with value ranges of
GM (1, 1) model accuracy test
If the accuracy of the GM(1,1) model cannot reach the test standard, the residual sequence model can be established to modify the original one to improve the accuracy.
Currently, academia mainly adopts three methods to assign weights to raw data: subjective weighting, objective weighting and combination weighting [46, 47]. This paper focuses on the entropy weight method of objective weighting:
Step 1: Data standardization processing:
Supposing k-type index (X1, X2, …, Xk), where Xi ={ x1, x2, …, xn } standardize as Y1, Y2, …, Yk and
Step 2: Finding the information entropy value of each indicator.
The entropy of the jth index is:
Step 3: Determining the weight of each index:
Calculating the weight of each indicator
Structural Equation Modeling (SEM) is a multivariate statistical model proposed by Swedish statisticians such as Joreskog in the 1970 s on the basis of statistical theory [48]. The model is a comprehensive application and improvement of statistical methods, for example, exploratory factor analysis, confirmatory factor analysis, path analysis, multiple regression analysis and analysis of variance. Comparative speaking, SEM allows consideration of simultaneous equations with many endogenous variables, measurement error in the exogenous and endogenous variables as well as multiple indicators of latent constructs and estimation of reliability and validity, while it permits more general measurement models than traditional factor analytic structures to specify structural relationships among the latent variables, etc. [49].
In general, SEM variables can be divided into two categories: one is the observable variables (also called “indexes”). The other is the latent variables that need to be inferred from indexes. Moreover, latent variables are further categorized into exogenous latent variables (also called “latent independent variables”) and endogenous latent variables (also called “latent dependent variables”) [50]. Under the premise of the above variable classification, the structural equation analysis process can be roughly divided into five steps: (1) model specification, (2) identification, (3) estimation, (4) testing fit, (5) respecification [49]. Furthermore, the estimation generally has two methods: LISREL (LInear Structural RE-Square) and PLS (Partial Least Square). The comparison of the two methods is as shown in Table 2 [51]:
Comparison of LISREL and PLS modeling methods
Comparison of LISREL and PLS modeling methods
It can be identified that PLS is more focused on explaining variances. There are no strict assumptions on the data distribution and no specific requirements on the sample size. Additionally, PLS has been widely used in knowledge management, hospitality research, Internet research, enterprise performance and other fields in recent years [52–55]. Consequently, this paper will use the PLS-SEM model to analyze the factors affecting the convergence level of the digital economy and real economy [56]. In the process of model construction, it is necessary to check the predictive ability and the validity of model parameter estimation. The predictive ability test method mainly includes the Average Variance Extracted (AVE), the Coefficient of Determination Method (R2) and the Composite Reliability method (Composite reliability), while the main method of checking the validity is Bootstrapping.
After sorting out the possible adopted methods in the paper, it could be found that:
In terms of correlation analysis, the GRA is suitable for the analysis of small or irregular samples while the Deng’s correlation model in the GRA focuses on the holistic analysis. Considering the characteristics of convergence analysis between the digital economy and real economy are lack of large samples, irregular data samples and focusing on overall analysis, therefore, this paper uses Deng’s correlation analysis method to measure the co-evolution level of the digital economy and real economy.
In terms of data prediction, as it could only possibly obtain very limited information in most cases, we have to adopt the Grey Forecasting Model model to carry out prediction research [41]. Moreover, due to the high computational efficiency of GM(1,1), most of the previous researchers have focused their attention on GM(1,1) models in their predictions [43]. Thus, this paper use GM (1, 1) model to predict the development of the digital economy and real economy in the next 10 years, and then obtain the convergence level between the two economics through the Deng’s correlation analysis method.
In terms of influencing factors, PLS-SEM has advantages on focusing on explaining variances, no strict assumptions on the data distribution and no specific requirements on the sample size, comparing with LISREL [50]. Consequently, the PLS-SEM model is more suitable for the research needs of the paper due to the limited amount of data on the digital economy and real economy.
A measurement model of convergence level of digital economy and real economy based on the Deng’s correlation analysis model
On account of hypotheses 1 to 6, considering the need for an overall analysis of the convergence level, the paper uses Deng’s correlation analysis method, entropy weight method and other methods to construct a measurement model of the convergence level of the digital economy and real economy. The specific modeling process is as follows:
(1) Using the Deng’s correlation analysis model to calculate the correlation coefficients (r lh (t) and r uv (t)) between the indexes in the digital economy subsystem (r lh (t)) and real economy subsystem (r uv (t)).
First, generating the mean of the original index sequences:
Then, after the meaning generating process, the calculation of the correlation coefficient between the indexes in the two subsystems is:
(2) Calculating the convergence sequence relative to its own index in each subsystem respectively (i.e. digital economy subsystem –B
d
(t); real economy subsystem –B
s
(t))
(3) Using the entropy weight method to calculate the internal index weights of each subsystem respectively, then obtaining the comprehensive development value sequence of the digital economy subsystem
(4) Calculating the correlation coefficient (R
ds
(t)) between the two subsystems.
(5) Calculating the convergence degree (B
ds
(t)) between the two subsystems.
Since the coordination coefficient is a 1 × t matrix, the convergence degree between the two subsystems is the same as the correlation coefficient.
(6) Considering the impacts of indexes, constructing a D (t) model on account of B
d
(t), B
s
(t) and B
ds
(t) to measure the level of coordinated development of the digital economy and real economy.
in which D (t) is the comprehensive convergence degree between the digital economy subsystem and real economy subsystem; w
d
and w
s
are based on
(7) Using the methods from steps (1) to (6) to calculate the convergence levels between digital economy and primary, secondary, and tertiary industries respectively.
In accordance with the above hypotheses 1 to 6, after averaging the raw data of various indicators, we establish a GM (1,1) model for the digital economy subsystem and real economy subsystem respectively to obtain the prediction model of each index in the subsystem relative to others, and then verify the effectiveness of each prediction model. The numerical values of the various indexes in the next 10 years are simulated under the premise that the prediction model is reliable. Further, the convergence level measurement model constructed in this paper is used to predict the convergence level of the digital economy and real economy in the next 10 years. The process is as follows: Using Equations (21) and (22) to generate the mean of the original sequence of the indexes to obtain the dimensionless sequences of the digital economy subsystem Referring to Equation (6) to generate an accumulation of Referring to Equations (8) to (13) to establish a GM (1,1) prediction model between the internal indexes of the two subsystems. Taking Constructing the adjacent mean generation sequences of Then, constructing the GM(1,1) first-order linear equations of And constructing the data matrices of After IAGO of Using Equations (14) to (18) and Table 1 to analyze the accuracy of the prediction model to determine whether the model has reached a qualified state. For models that do not meet the requirements, we need to construct a residual error modified GM(1,1) model and then perform the accuracy verification again. Moreover, the prediction model of other indexes is constructed to obtain the prediction sequence of all indexes in the next 10 years. Re-using Equations (21) to (28) to predict the convergence level of the digital economy and real economy in the next 10 years. Repeating the above (1)–(4) to predict respectively the convergence levels of the digital economy and primary, secondary, and tertiary industries in the next 10 years.
The key to construct the analysis model is to make scientific and reasonable hypotheses, and then verify whether the hypotheses meets the requirements of the predictive ability and the validity through empirical analysis. Therefore, this paper proposes the following hypotheses in terms of the impactingfactors:
Hypotheses of internal factors
Innovation is the core driving force to encourage high-quality social and economic development and the process of innovation is the integration of academic knowledge and empirical knowledge [57]. The widespread use of digital technologies such as the World Wide Web provides a mechanism for sharing large volumes of information and enriches the sources of knowledge, which effectively enables the knowledge transfer between various sections of society [58]. Meanwhile, open innovation with knowledge diffusion as the main feature can achieve a substantial shortening of the innovation cycle and time [59]. Thus the widespread application of digital technology has made digitization a key element in the economic development environment, exerting a positive impact on the innovation efficiency of the real economy. To sum up, in terms of endogenous factors, the following hypotheses are proposed:
Hypotheses of direct factors
The main goal of the transformation and upgrading of manufacturing industry is to get out of the trap at the low end of the value chain as well as shift the industry to the R&D and sales links at both ends of the “smile curve” [60]. In the process of expanding into the manufacturing sector, the digital economy have solved many pain points in the transformation and upgrading of China’s manufacturing industry,for example: cracking the bottleneck of innovation chain, improving the quality of manufacturing chain, optimizing the efficiency of supply chain and expanding the service space, etc. [61]. In other words, as the demand side of the digital economy, the real economy’s innovative capabilities will affect the development efficiency of the digital economy; while the digital economy improves the convergence level between the two economies by improving the development quality of the real economy. In conclusion, the direct factors hypotheses are proposed:
Hypotheses of environmental factors
It was reported that more than 75% of OECD countries have developed and published an explicit regulatory policy by the end of 2015, while for the countries without an explicit regulatory have also quickly started to develop the strategies or policies in certain specific areas to effectively promote their digital development [62]. Moreover, the basic environment such as the level of Internet penetration and the accumulation of data are the key basic conditions for facilitating the high-quality development of the digital economy while the development level is the core driving force that directly enhances the high-quality development of the real economy. Therefore, the hypotheses about environmental factors are as follows:
In short, the relationship between the above 8 hypotheses is illustrated in Fig. 2.
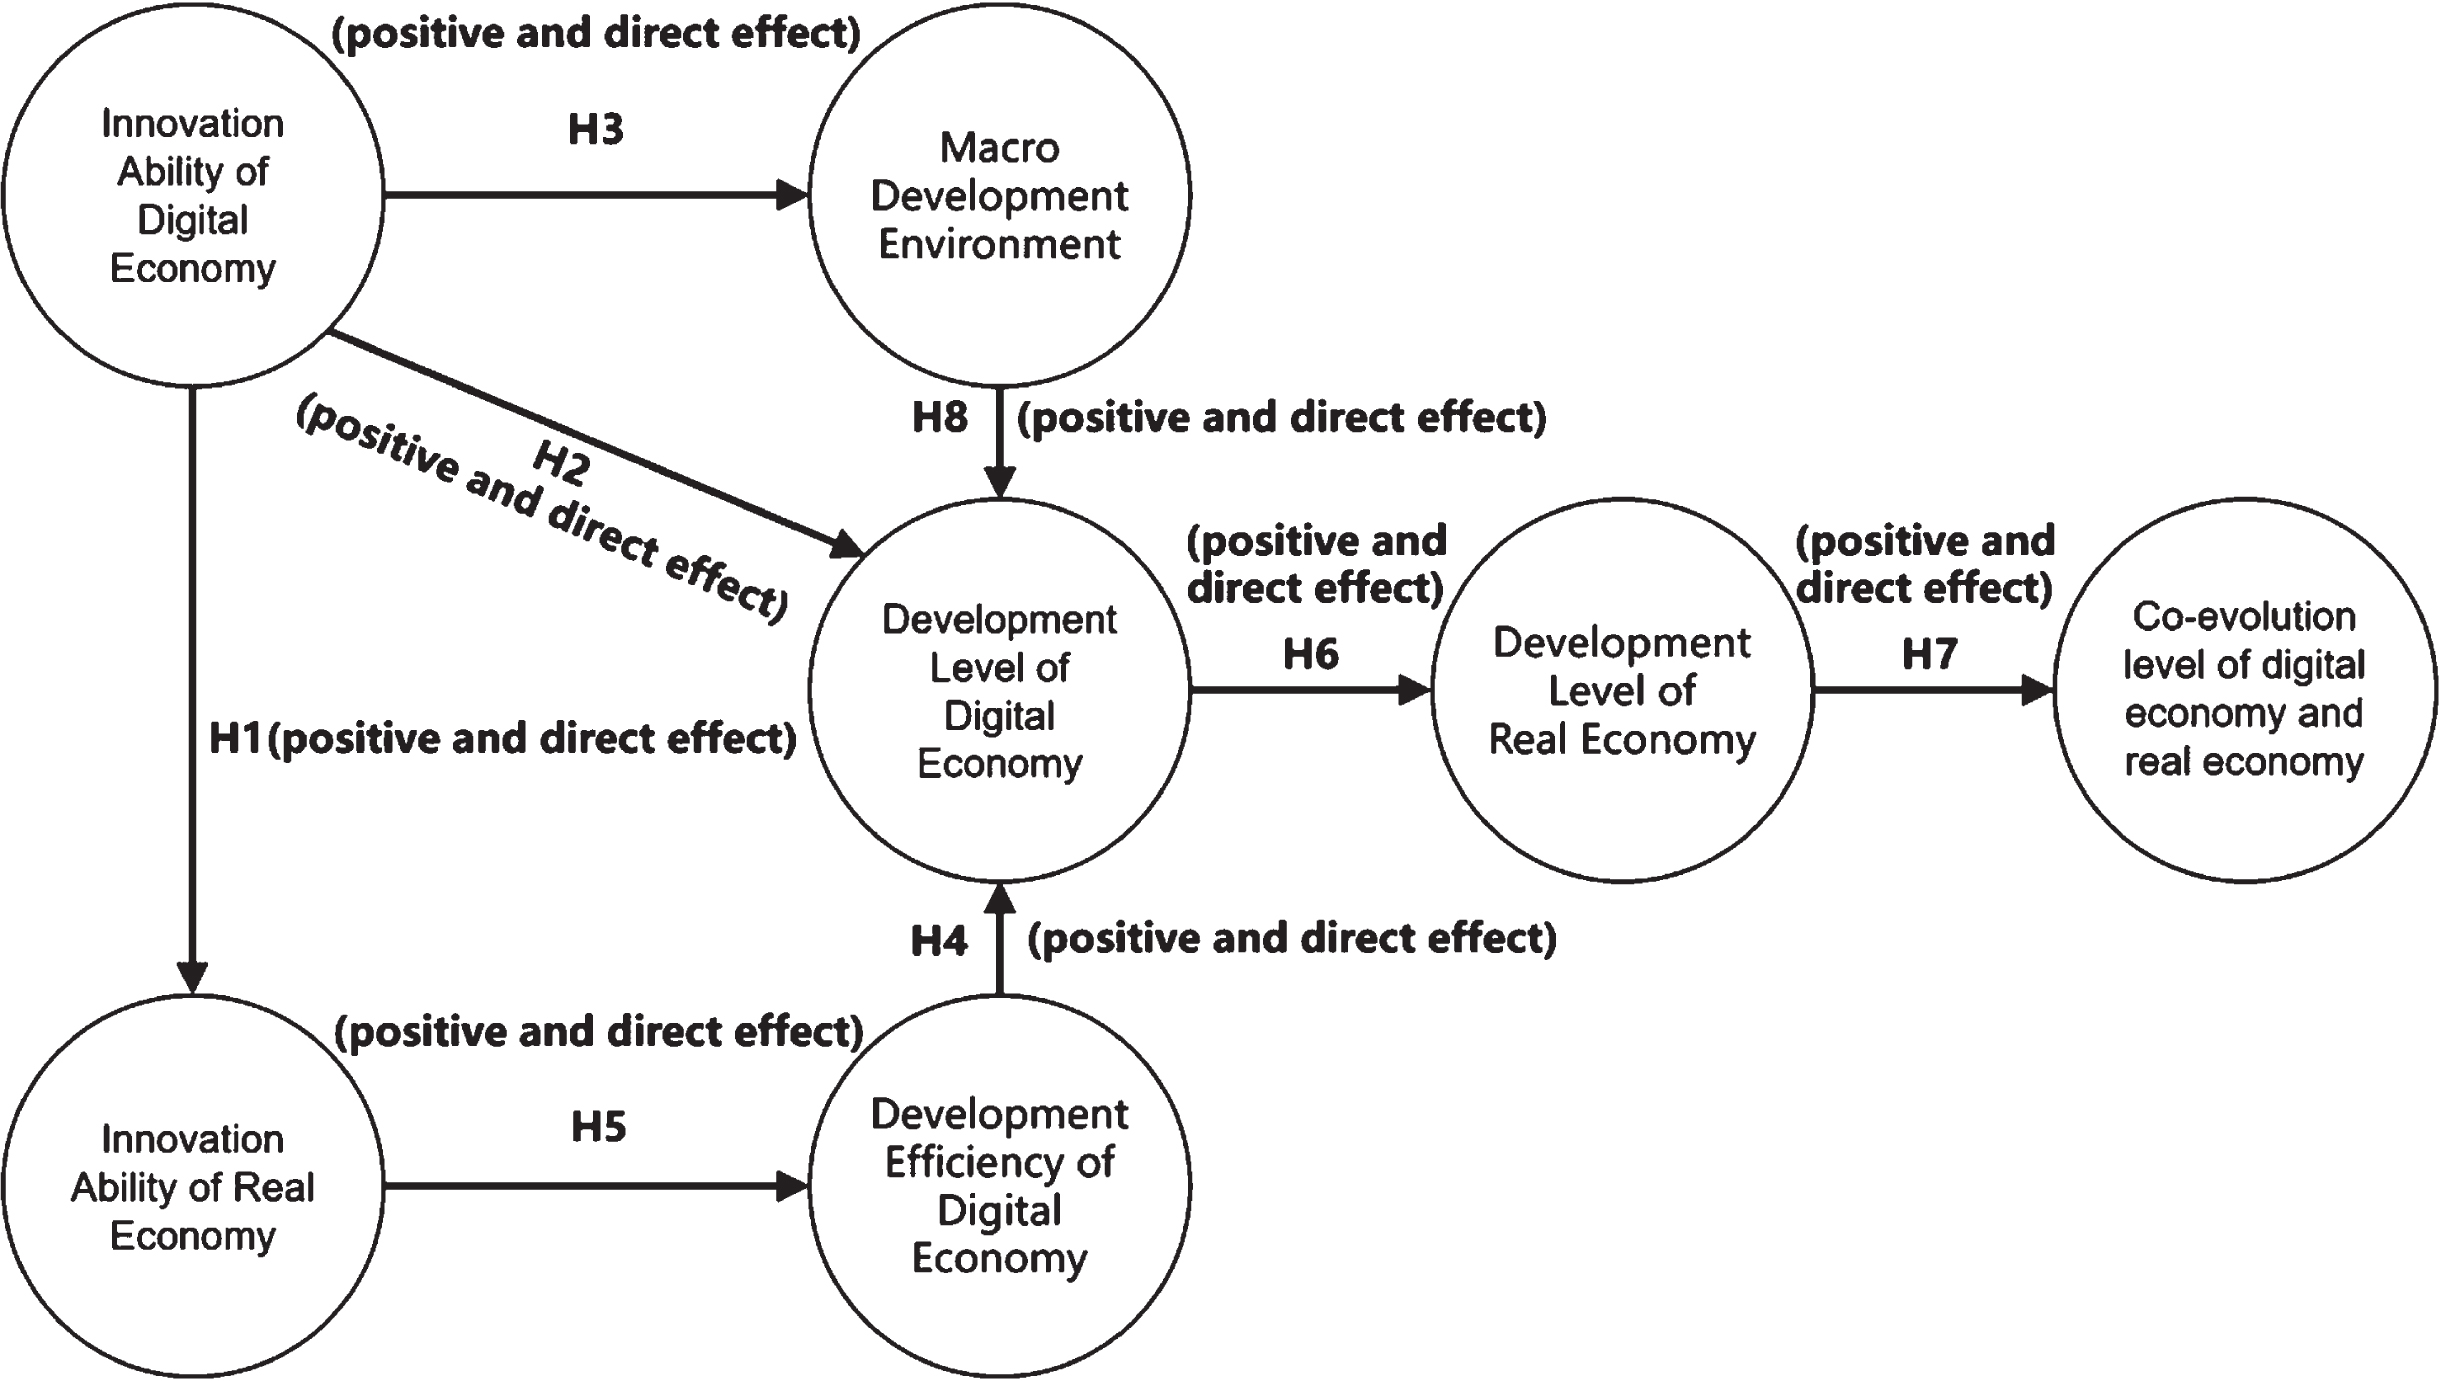
The analysis model of factors affecting convergence of the digital economy and real economy.
The paper will consider the corresponding observable variables as well as analyze whether the hypotheses are significantly effective by using actual data in following empirical analysis.
Measurement of convergence level of digital economy and real economy
Index selection
At the regional level, considering the timeliness and availability of data, this paper limits the scope to Mainland China. At the data dimension level, current academics often use data on economic benefits, social benefits, growth potential and innovation vitality within an economy or industry as indexes of industrial development characteristics [63–66]. Hence the paper constructs the original data sequence of development indexes of the digital economy and real economy (refined to the primary, secondary and tertiary industries) on the basis of the above four dimensions in accordance with the principles of scientificity, systematicness and availability. Then the secondary data indexes in each dimension are as shown in Table 3.
The system of the digital economy and real economy development indexes
The system of the digital economy and real economy development indexes
On the selected indexes, this paper comprehensively sorts out the concepts and analysis in the “G20 Digital Economy Development and Cooperation Initiative” issued by the G20 Hangzhou Summit in 2016, the “Defining and Measuring the Digital Economy” issued by the US Department of Commerce (BEA) in 2018, the definition of the digital economy by the British Economic and Social Research Institute, the “Digital Economy Plan” announced by Russia in 2017 and the definition of digital economy by Chinese scholars, combined with China’s latest “National Economic Industry Classification” (GB/T4754-2017). The paper defines the boundaries of the digital economy and the three industries as follows [67–70]: The statistics of the digital economy include C39 (computer, communication and other electronic equipment manufacturing) and I63 I65 (information transmission, software and information technology service industry). The statistics of the real economy statistics include:
For the primary industry, it includes agriculture, forestry, animal husbandry and fishery (A01 A05).
For the secondary industry, it includes mining (B06 B10, B12), manufacturing (C13 C38, C40 C42), electricity, heat, popularity and water production and supply (D44 D46), and construction (E47 E50).
For the tertiary industry, it includes agricultural and sideline product processing (A06), mining professional and auxiliary activities (B11), metal products, machinery and equipment repair industry (C43), wholesale and retail industry (F51, F52), transportation, storage and postal industry (G53 G60), accommodation and catering industry (H61, H62), financial industry (J66 J69), real estate industry (K70), leasing and business service industry (L71, L72), scientific research and technical service industry (M73 M75), water conservancy, environment and public facilities management industry (N76 N79), resident service, repair and other service industry (O80 O82), culture, sports and entertainment industry (R86 R90), public management, social security and social organizations(S91 S96).
In pursuance of the above industry classifications, the data in the paper is basically from the 2005–2019 China Statistical Yearbook, 2005–2019 China National Economic and Social Development Statistical Bulletin, the 1st to 4th National Economic Census Communiqu
When analyzing the convergence level, we focus on measuring the degree of the convergences of their own and the convergences between economies. Assuming D is the convergence degree between the digital economy and real economy, this index mainly reflects the degree and type of convergence. Moreover, supposing that the convergence degree of the digital economy and the real economy of their own are B d and B s respectively, the ratio of B d /B s will further reflect the convergence relationship. The specific criteria are as shown in Table 4 [74, 75].
Judgment criteria for the convergence of the digital economy and real economy
Judgment criteria for the convergence of the digital economy and real economy
According to the Measurement Model of Convergence Level of Digital Economy and Real Economy Based on the Deng’s Correlation Analysis Model constructed in this paper, the digital economy and the real economy’s own convergence sequences as well as the comprehensive convergence sequences between the economies from 2005 to 2019 were obtained after calculating the original data sequences through using matlab software.
(1) Analysis of the own convergence level of the digital economy and real economy
It could found from Table 5 and Fig. 3, there was obvious similarity on the convergences of China’s digital economy, real economy, primary industry, secondary industry and tertiary industry from 2005 to 2019: Firstly, the co-evolution level of above five economies had remained relatively low from 2005 to 2007. Secondly, it had risen year by year and reached a peak from 2008 to 2012, indicating that the main driving force in this stage stemmed from the own convergence effect within each economy. Thirdly, although the convergence of some economies began to rebound from 2018 to 2019, the own convergence level generally showed a downward trend year by year from 2012 to 2019, which showed the economic growth dividend that brought from the own convergence effects had tended to be fully released and the new growth momentum of various economies was gradually migrating.
The digital economy and the real economy’s own convergence sequence from 2005 to 2019
The digital economy and the real economy’s own convergence sequence from 2005 to 2019
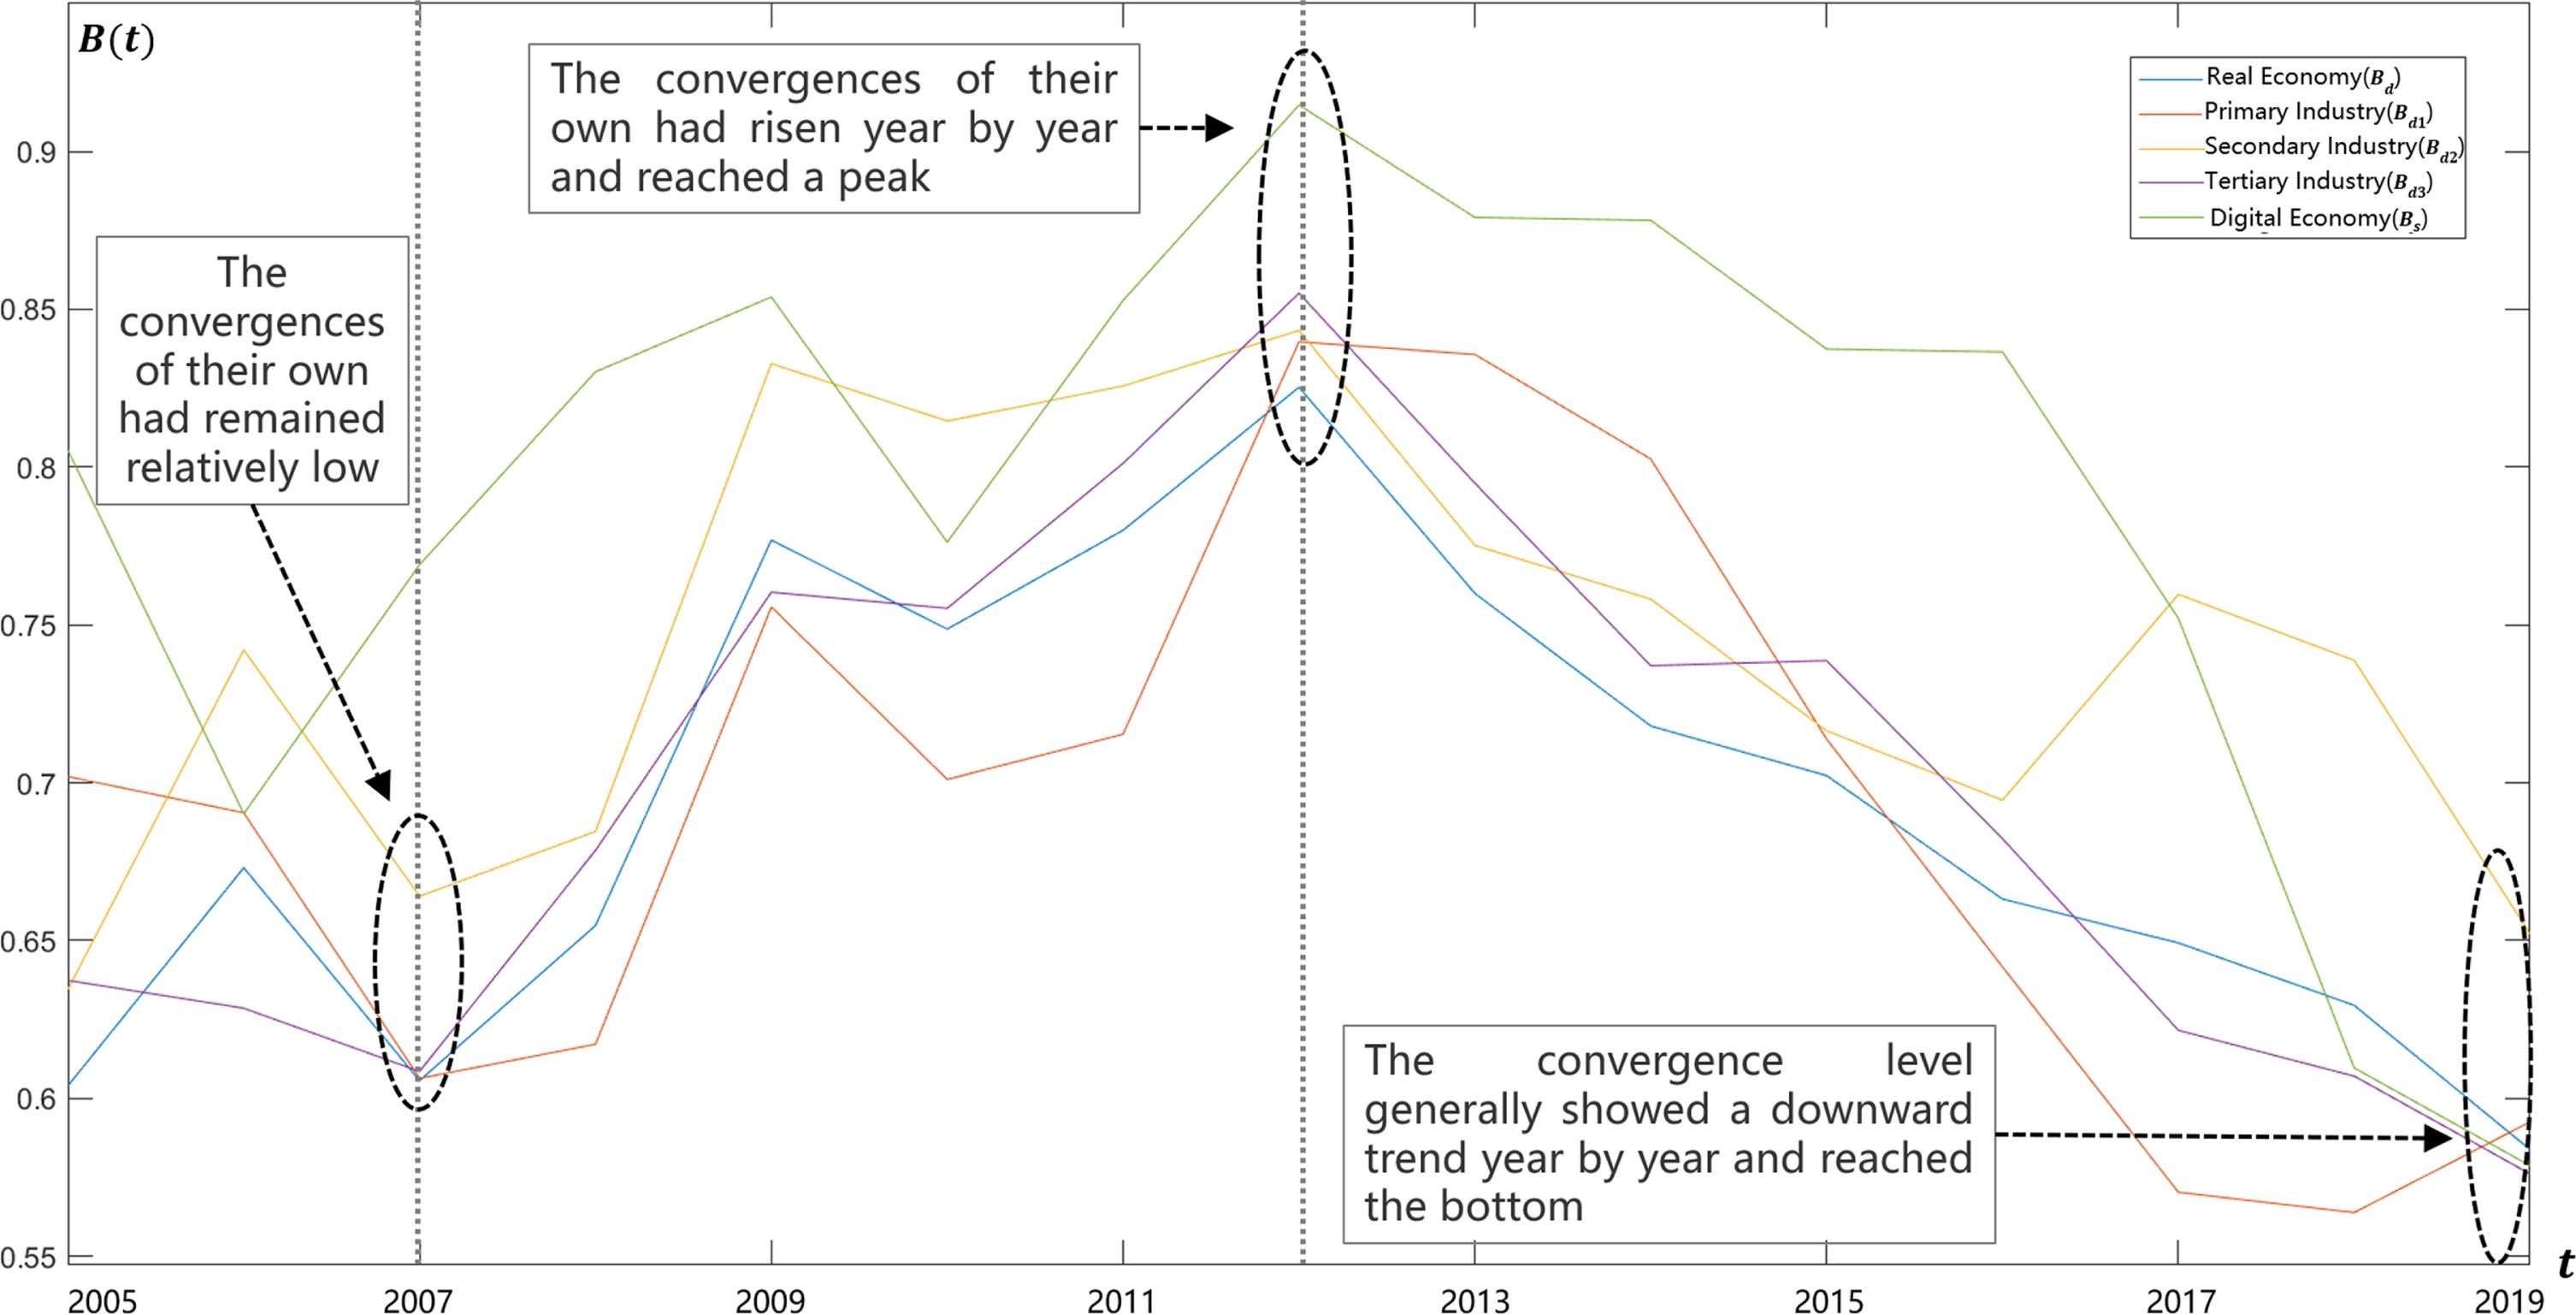
The change trend of the digital economy and real economy’s own convergence sequence from 2005 to 2019.
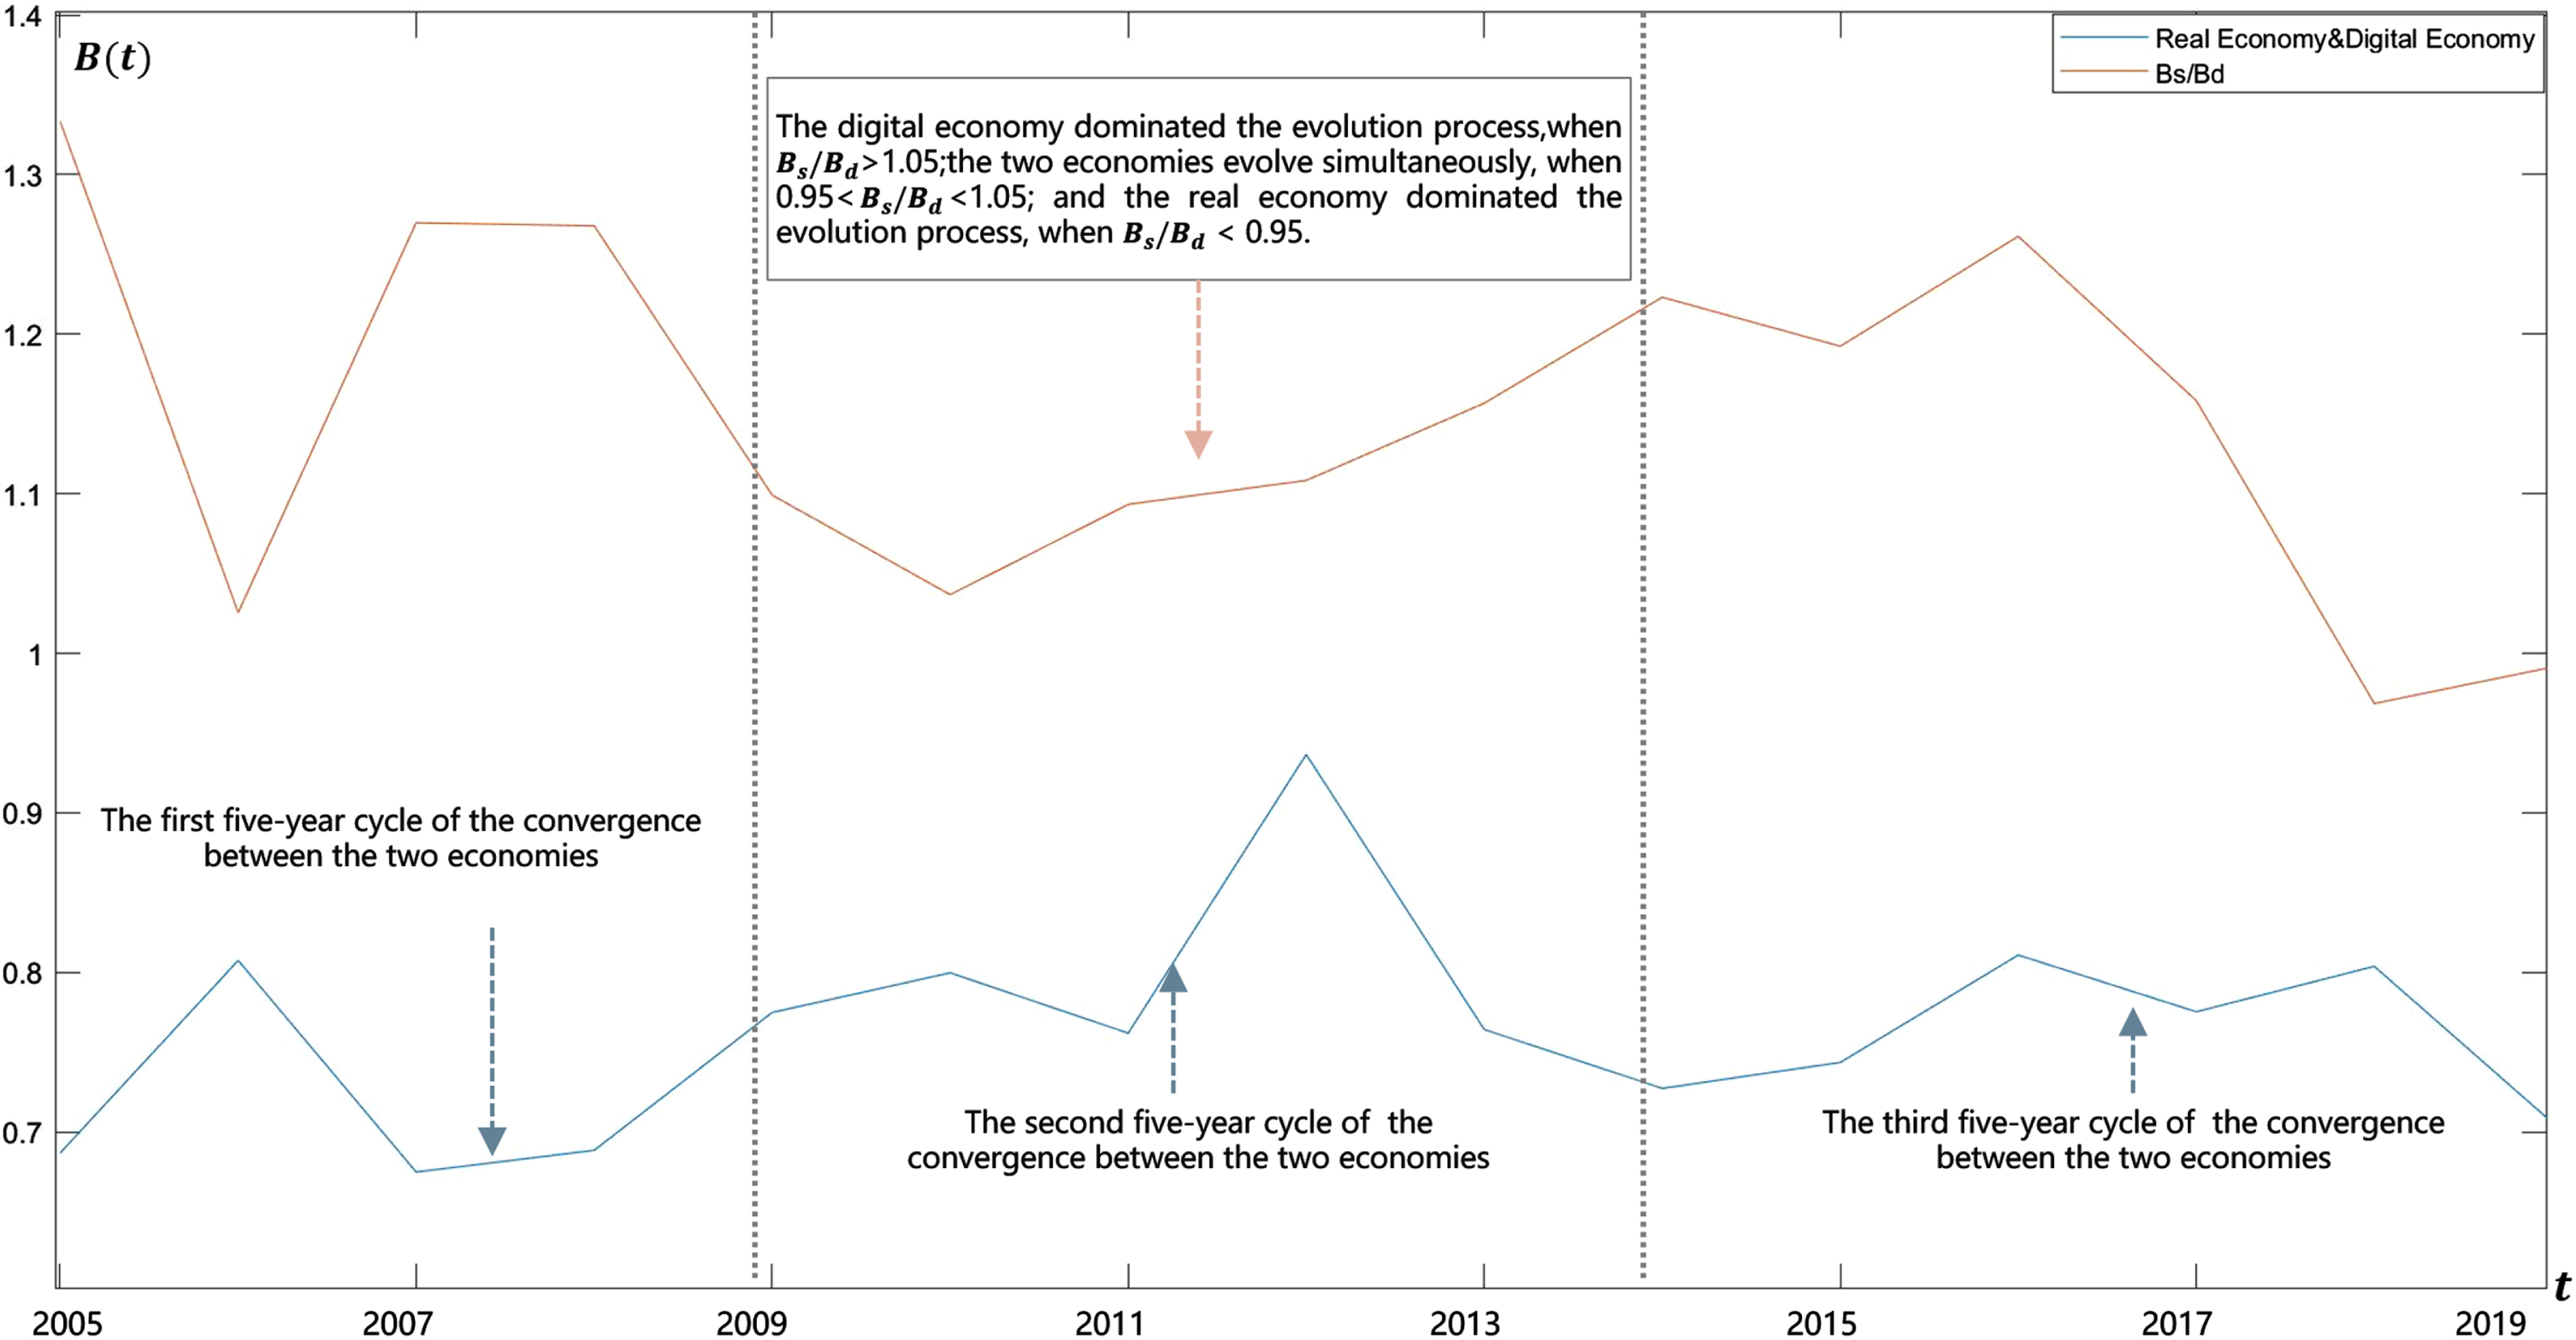
(2) Analysis of the convergence level between the digital economy and real economy (as shown in Tables 6 and 7).
The sequence of comprehensive convergence between the digital economy and real economy from 2005 to 2019
The ratio series of the convergence between digital economy and real economy from 2005 to 2019
It could been observed from Fig. 4 that the convergence level fluctuated between 0.7 and 0.8 and the B d /B s value was basically greater than 1.05 (except for 2006, 2010, 2018 and 2019). The overall level was in the intermediate convergence stage led by the digital economy from 2005 to 2019, which would fluctuate periodically every five years. Taking account of China’s macro policy environment of implementing the “five-year plan”, it could be reflected that the potential correlation between the convergence level and macro policy environment. In addition to the peak of co-evolution in 2012, the average level from the first to the third fluctuation cycles had gradually increased and the convergence degree had continued to strengthen. Moreover, in the context of the gradual decline in the level of the own convergence during the period from 2005 to 2019, it showed that the development momentum of the digital economy and real economy had gradually shifted from the convergence effect of their own within each economy to the convergence effect between the economies.
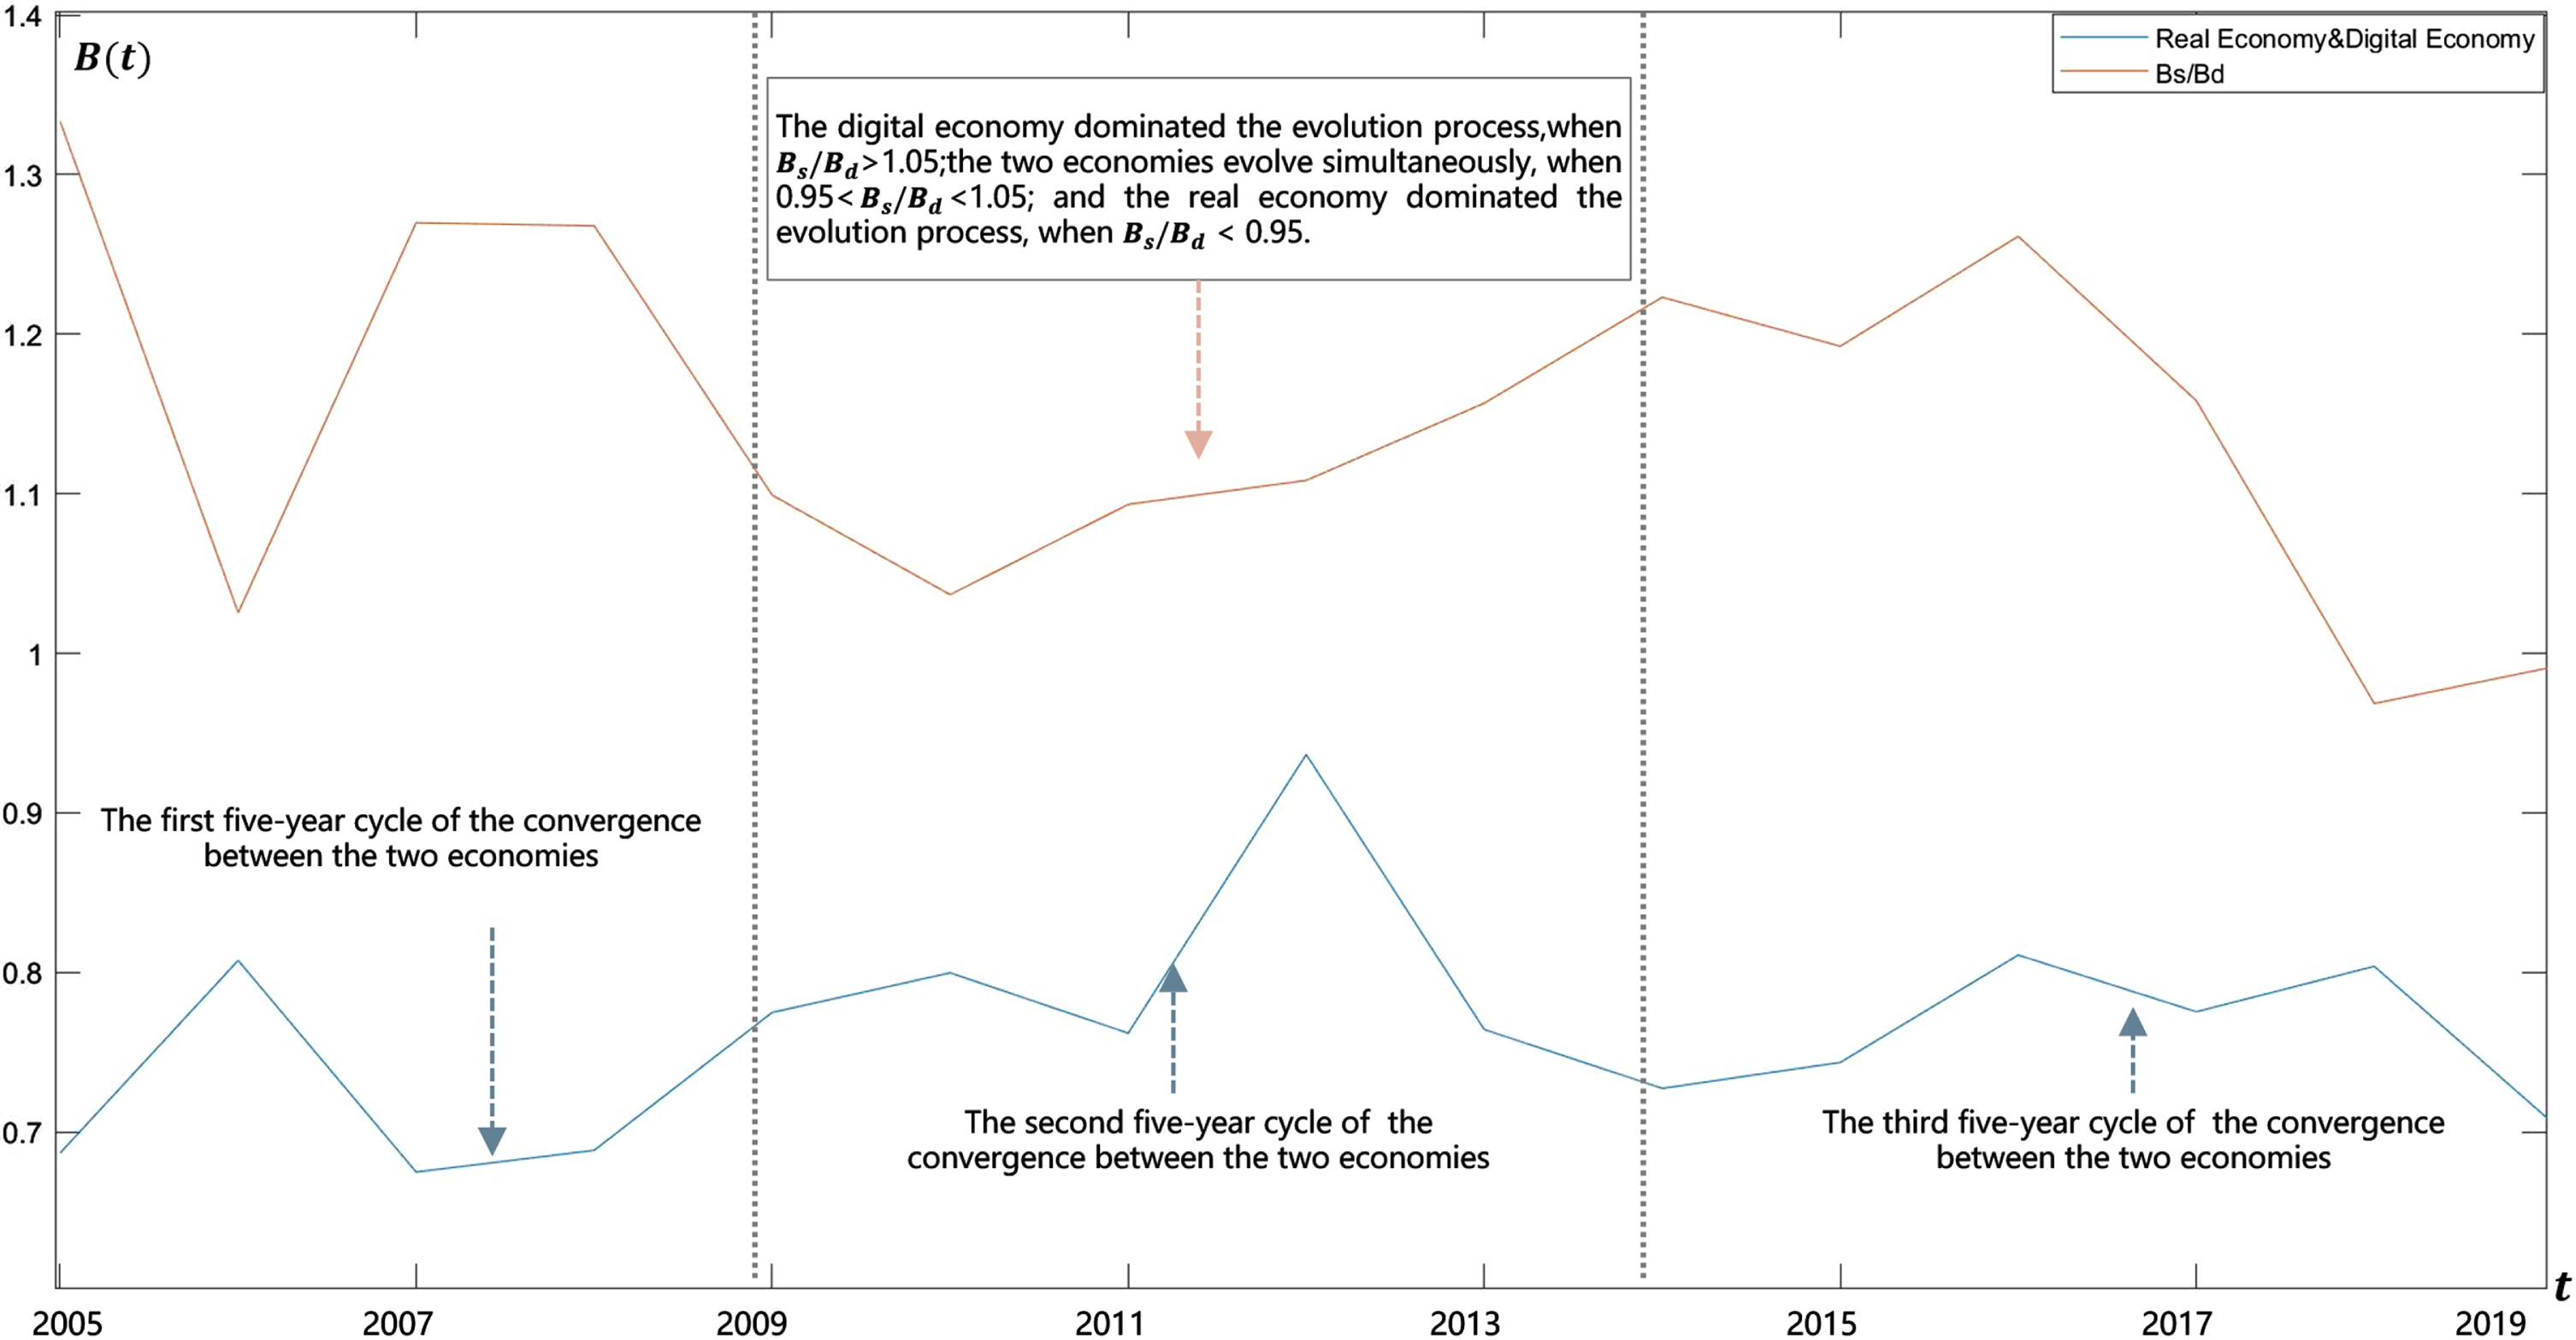
The trend of convergence between the digital economy and real economy from 2005 to 2019.
Figure 5 shows that from 2005 to 2019, the convergence level between the digital economy and primary industry fluctuated between 0.5 and 0.8 and the B d /Bs1 value was basically greater than 1.05 (except for 2006 and 2009). Furthermore, the convergence type had evolved from a good collaborative digital economy-led type to a primary collaborative digital economy-led type, which had a periodic fluctuation in about 5 years, indicating that there was a potential correlation between the co-evolution level and macro policy environment. Comparing the three fluctuation cycles, it can be concluded that the overall convergence level between the digital economy and primary industry showed a gradual decrease. According to the above-mentioned “Analysis of the own convergence level of the digital economy and real economy”, the convergence level of the primary industry was also a gradual decline from 2005 to 2019. Therefore, a preliminary conclusion can be drawn considering the annual slowdown in the primary industry’s growth rate and fixed investment growth rate from 2005 to 2019 that under the premise that the convergences of the digital economy and the primary industry respectively as well as the convergence between the primary industry and digital economy are gradually decreasing, the development momentum of the primary industry continued to weaken, which had an adverse impact on the development of the primary industry.
The convergence trend of the digital economy and primary industry from 2005 to 2019.
It could be found from Fig. 6 that the convergence level between digital economy and secondary industry fluctuated roughly between 0.5 and 0.8. The B d /Bs2 value was less than 0.95 in 2006, 2018, and 2019 that were primary and intermediate convergence types led by the secondary industry. In 2009, 2010, and 2011, the B d /Bs2 was between 0.95 and 1.05 that were primary and intermediate collaborative synchronous development types. The B d /Bs2 of the remaining years were greater than 1.05 that were primary and intermediate collaborative digital economy-led types. Furthermore, the convergence between the digital economy and secondary industry had undergone a change process of “steady growth-rapid decline-strong rebound”. With the rise of the “consumer Internet”, a good convergence effect was formed between the digital economy and secondary industry from 2005 to 2012, which promoted the transformation and upgrading of the secondary industry with its own convergence effect. However,during the period from 2013 to 2015, with the gradual release of the “consumer Internet” technology dividend, the process of the digital economy’s deep penetration into the industry had found many disruptive innovation formats that tried to “substitute” or “subvert” the traditional secondary industry, while the convergence level of the secondary industry was still high. Therefore, they led to a rapid decline in the convergence level between the digital economy and secondary industry in the short term. Moreover, the penetration path of the digital economy into secondary industry had evolved from “substitution” and “subversion” to “empowerment” and “transformation” from 2015 to 2019. Additionally, the secondary industry’s own convergence level continued to decrease during this period and the convergence level between the digital economy and secondary industry had entered a stage of rapid recovery. To conclude, it may bring new development momentum of the secondary industry that there is the good convergence between the digital economy and secondary industry on the premise that their own convergences continues to decrease.
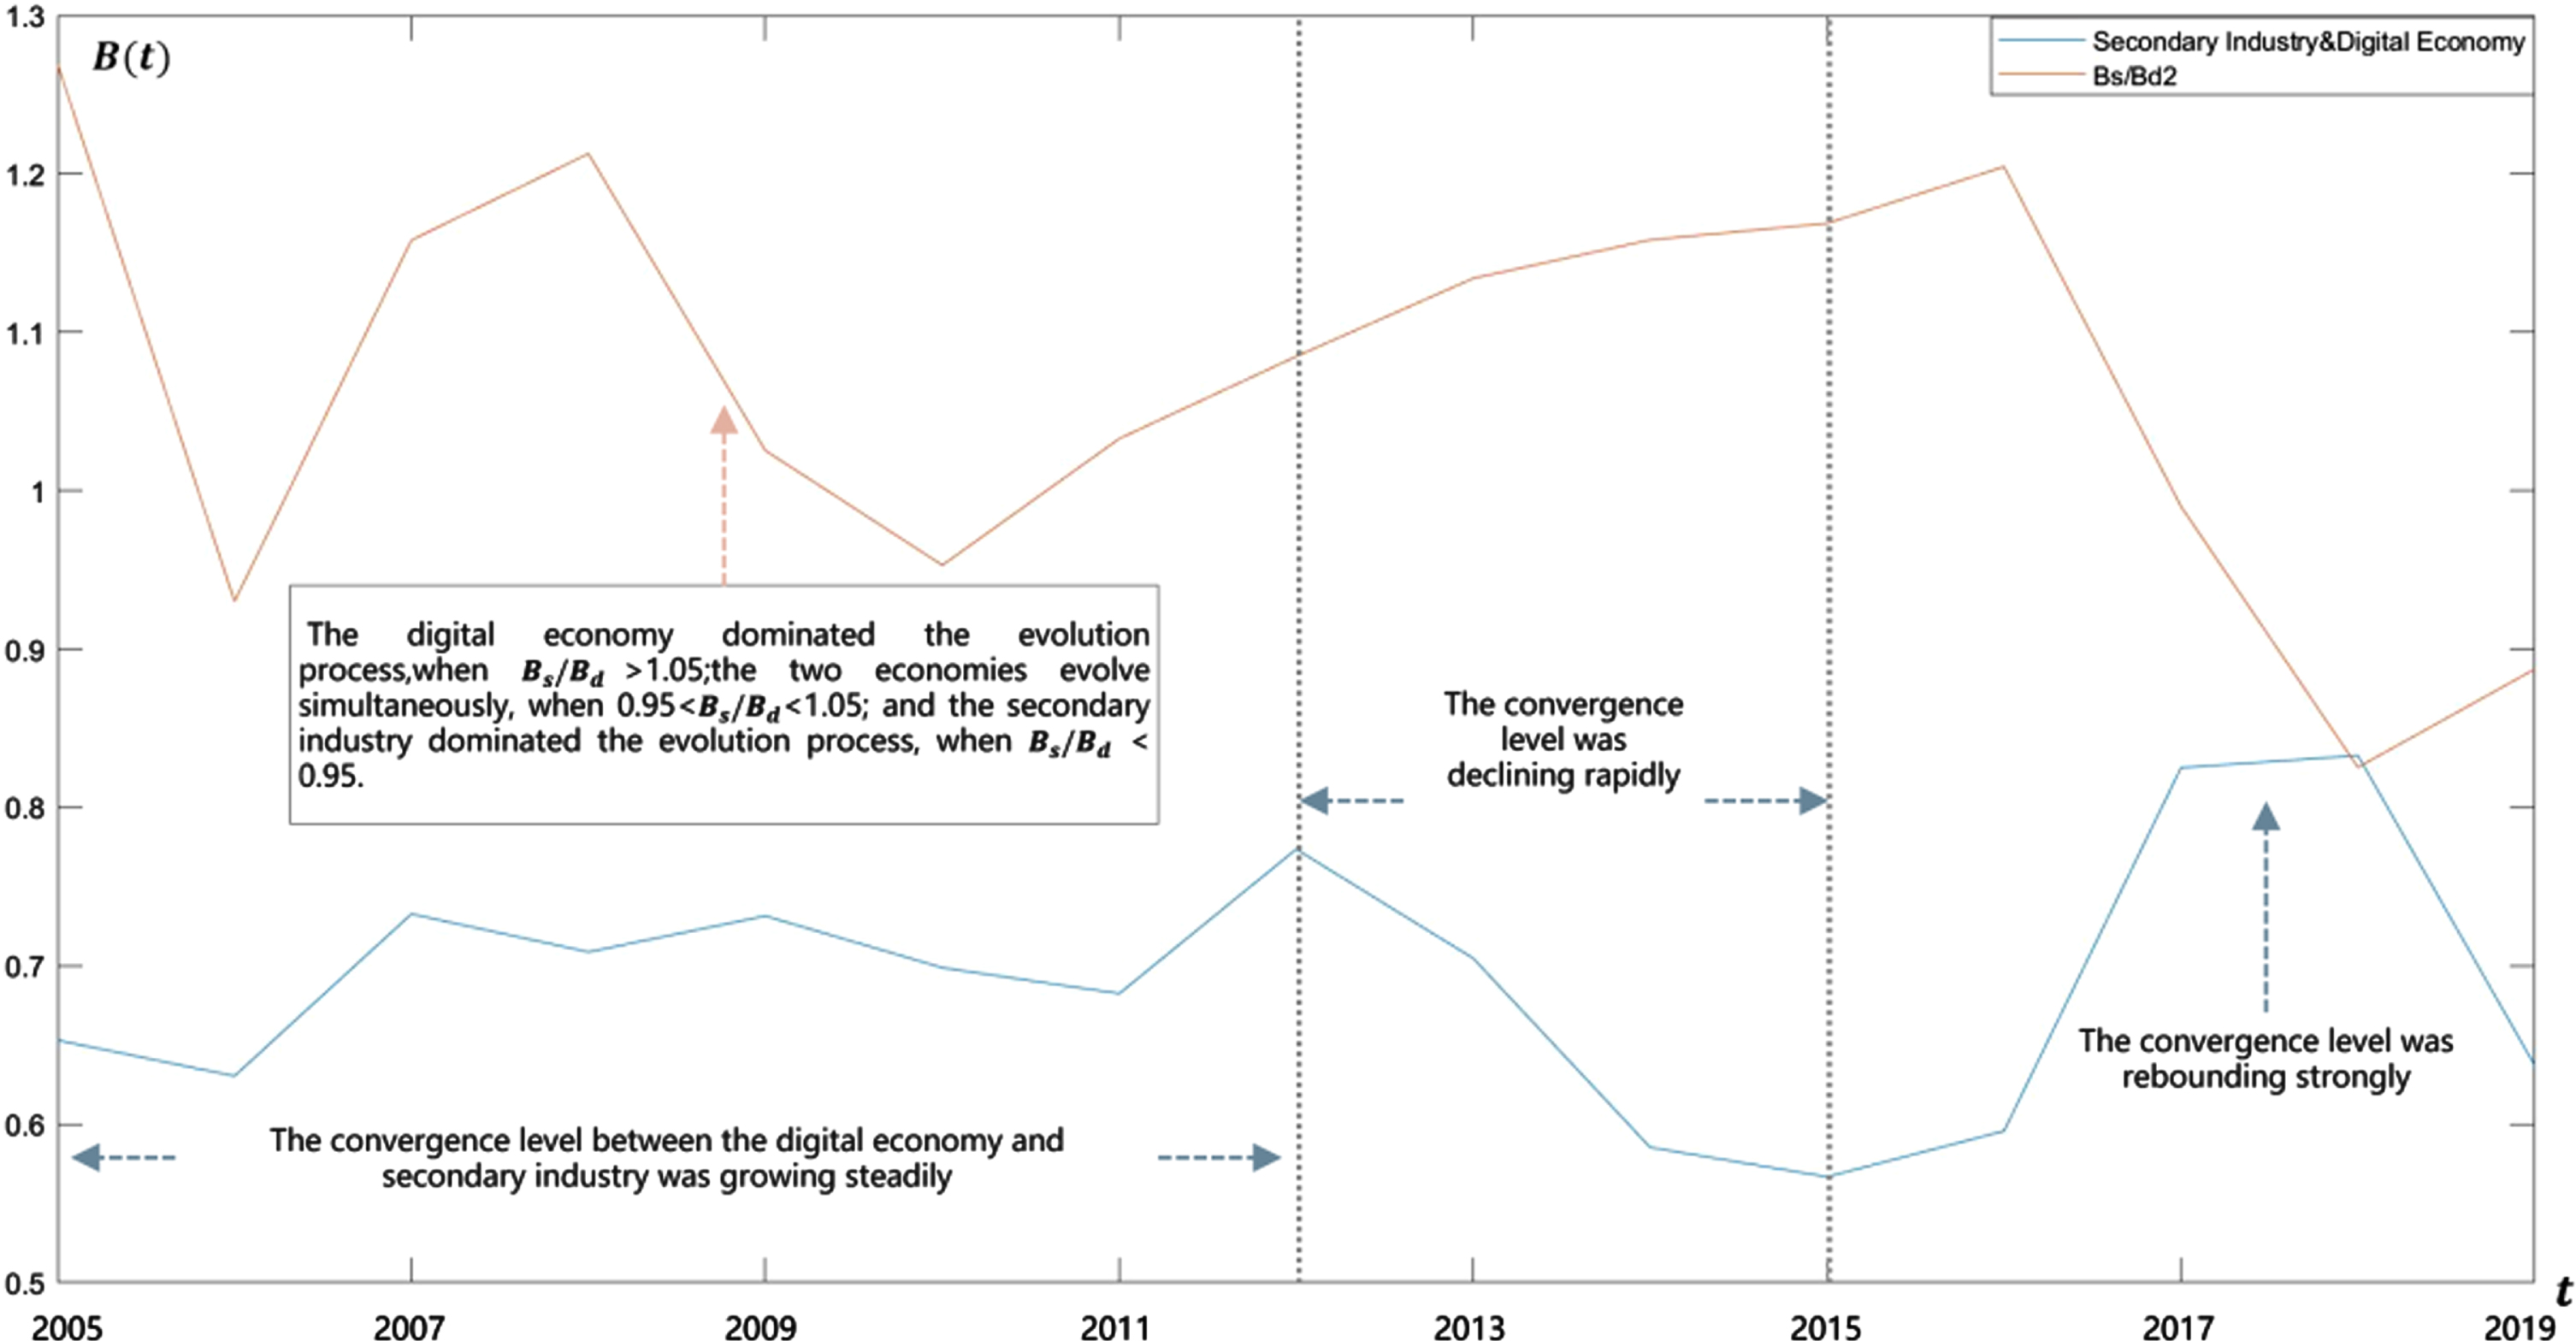
The convergence trend of the digital economy and secondary industry from 2005 to 2019.
As illustrated in Fig. 7 the convergence level between the digital economy and tertiary industry fluctuated between 0.6 and 0.8 and the B d /Bs3 value was basically greater than 1.05 from 2005 to 2019 (except in 2018 and 2019), which was mainly embodied in the primary and intermediate convergence types led by the digital economy. The convergence level would fluctuate cyclically approximately every 7 years, which had been potentially relevant with the implementation of the China’s “five-year plan”. Specifically, in the first 7-year cycle, the convergence level was at a relatively low level from 2006 to 2009. With the rapid rise of the “consumer Internet”, the convergence degree continued to increase rapidly in 2009–2012 and reached a peak in 2012. In the second 7-year cycle, the “consumer Internet” technology dividend was gradually released from 2013 to 2015 and the convergence level fell rapidly to the lowest point. Furthermore, the convergence level had rebounded again and continued to enhance from 2015 to 2019, while the growth rates of added value and fixed investment of the tertiary industry in the second 7-year cycle remained at a high level. A preliminary conclusion could be drawn: under the premise that the own convergences of the digital economy and tertiary industry respectively continued to decrease, it could bring new development momentum to the tertiary industry in case of the good convergence between the economies.
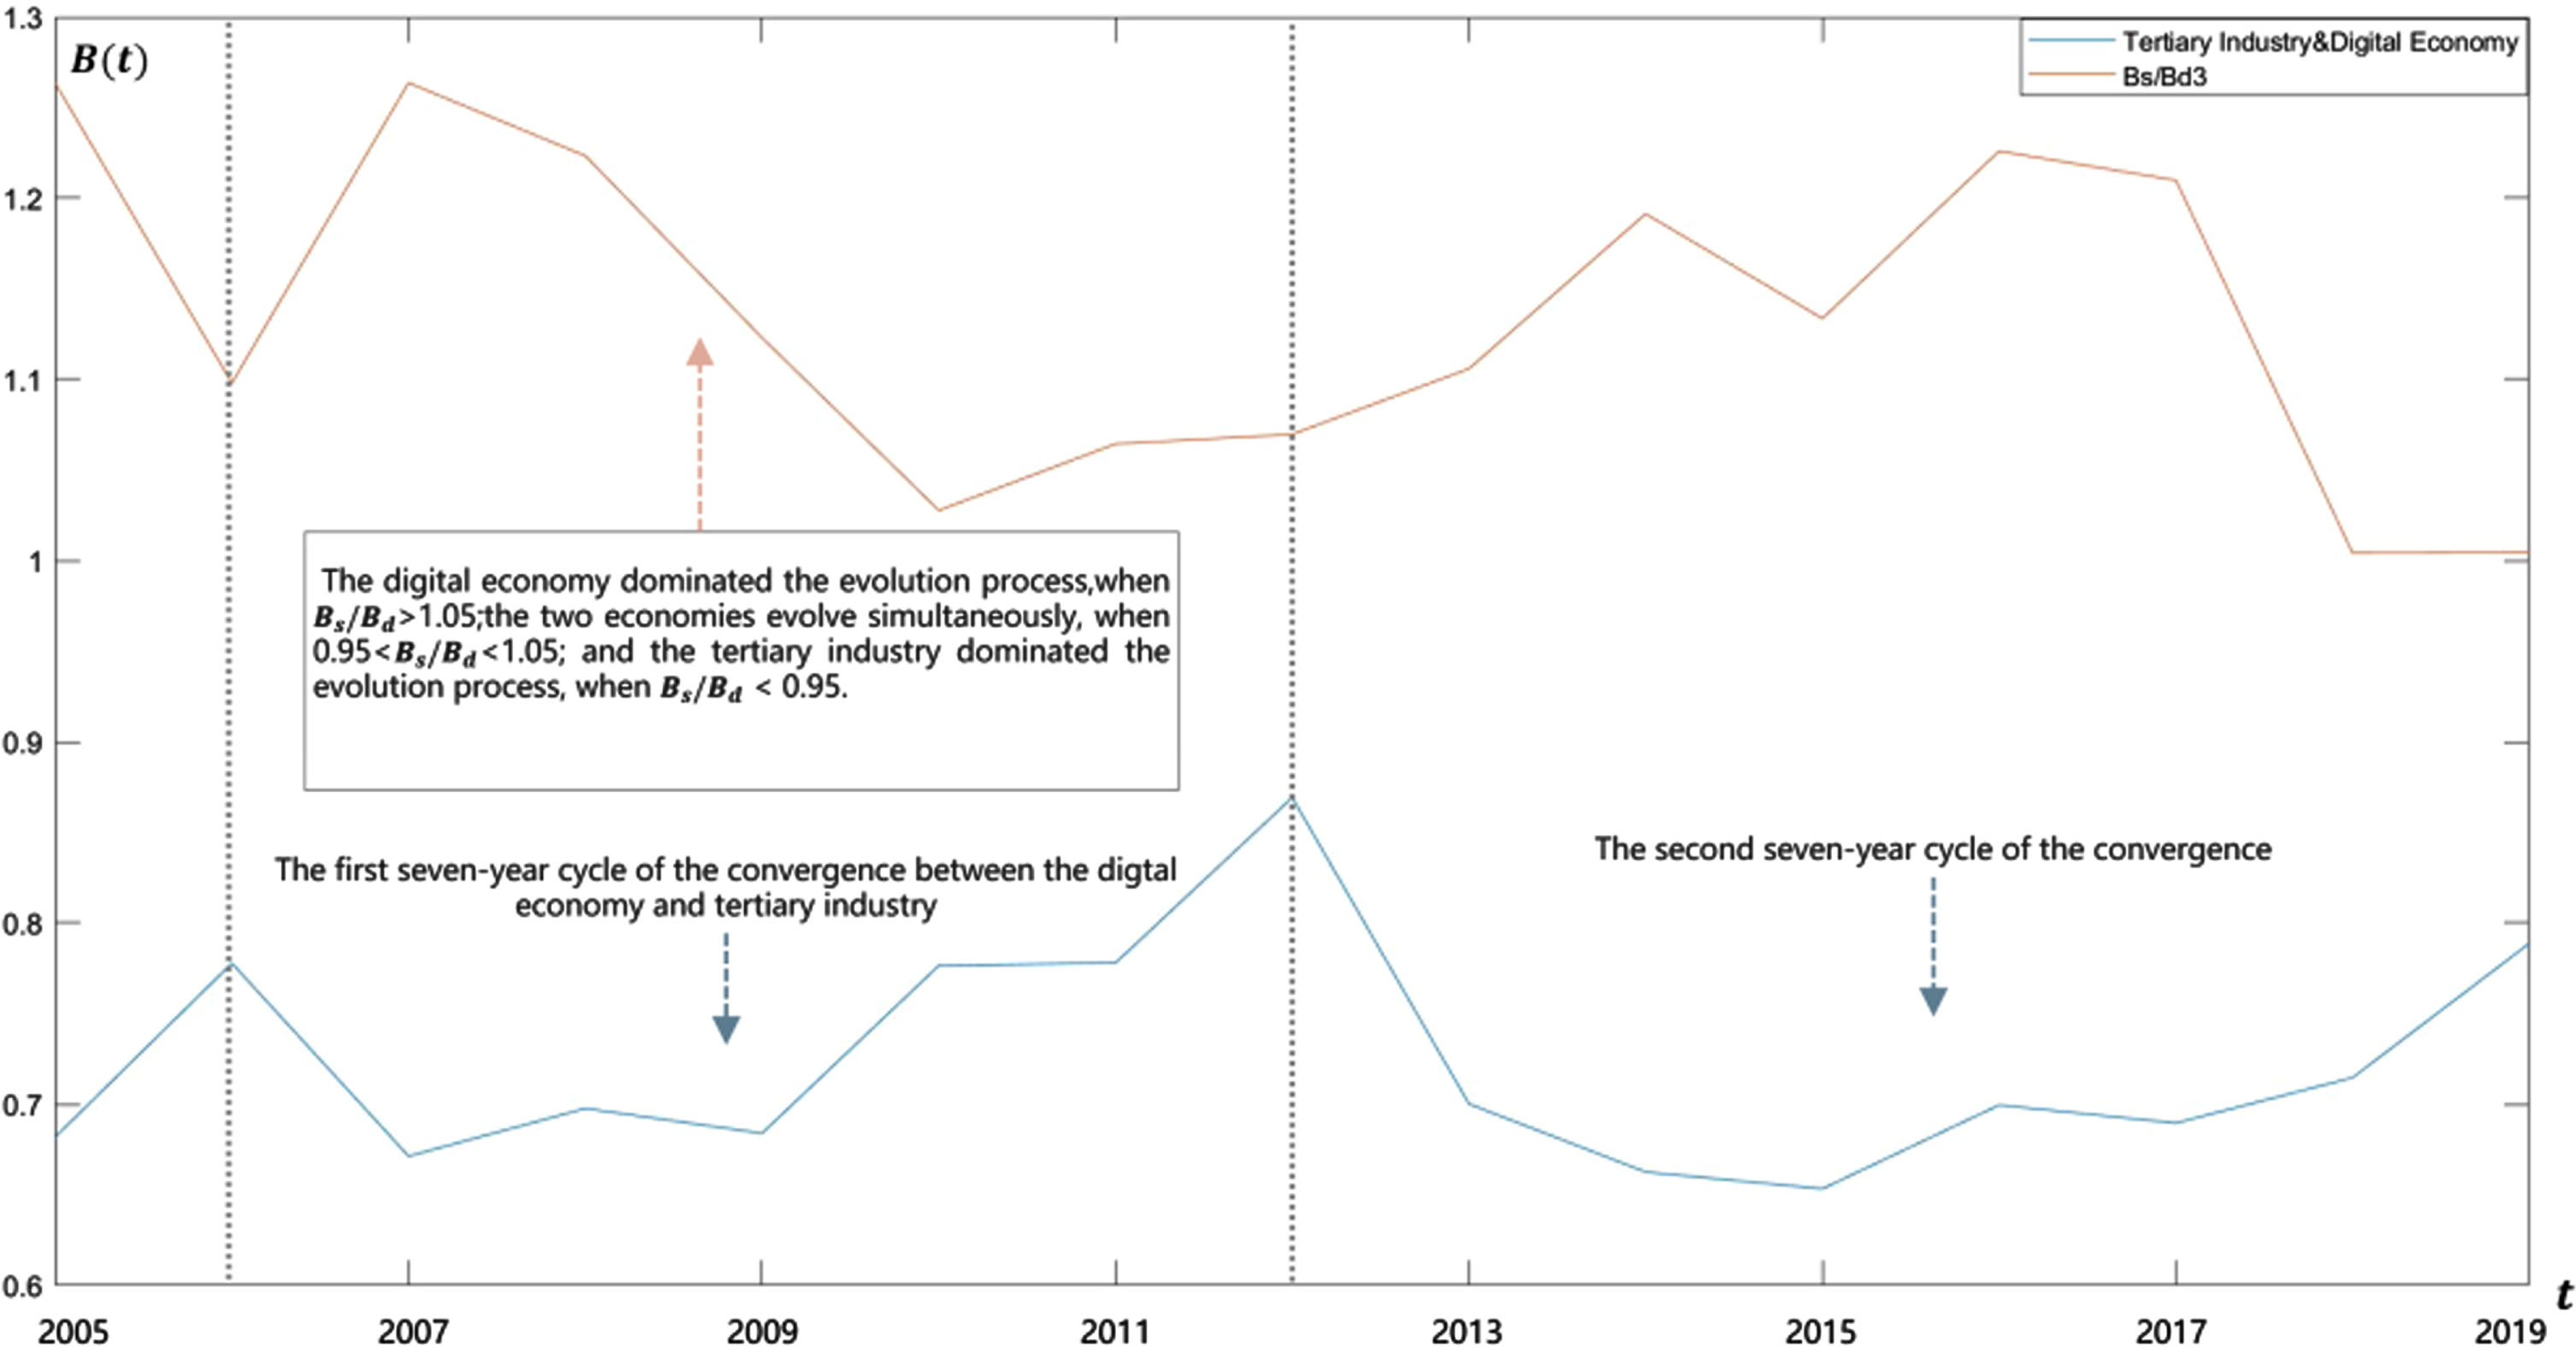
The change trend of comprehensive convergence sequences of the digital economy and tertiary industry from 2005 to 2019.
Indexes selection
In order to ensure the consistency of the prediction results with the previous empirical analysis, the selection of indexes is consistent with the “Measurement of Convergence Level of Digital Economy and Real Economy”.
Indexes prediction
Prediction indexes in the digital economy system and real economy subsystem Using “Forecasting Model of Convergence of Digital Economy and Real Economy Based on GM (1,1)” to predict the indexes (mean values) in the digital economy, real economy, primary industry, secondary industry and tertiary industry subsystems. The proportion of the fixed investment in each subsystem and the growth rate of added value can be indirectly calculated by the predicted values of other indexes; thus the prediction data of the each subsystem is as shown in Table 8. Prediction of the convergence level of the digital economy and real economy in 2020–2029 Prediction of the own convergence level of the digital economy and the real economy It can be observed from Table 9 and Fig. 8 that the own convergence levels of China’s digital economy, real economy, primary industry, secondary industry and tertiary industry would be similar with each other from 2020 to 2029. Specifically, the convergence levels of the five types of economies would continue to rise from a relatively low level to a peak from 2020 to 2025. However, the convergence level will show a downward trend year by year from 2026 to 2029, indicating that the economic growth dividends brought about by the own convergences effects will once again tend to be fully released and then the growth momentum within the each economy will gradually slow down. Prediction of the convergence level between digital economy and real economy
Predicted values of development indexes in each subsystem of the real economy and digital economy (mean generating)
Predicted values of development indexes in each subsystem of the real economy and digital economy (mean generating)
The own convergence sequence of the digital economy and real economy in 2020–2029
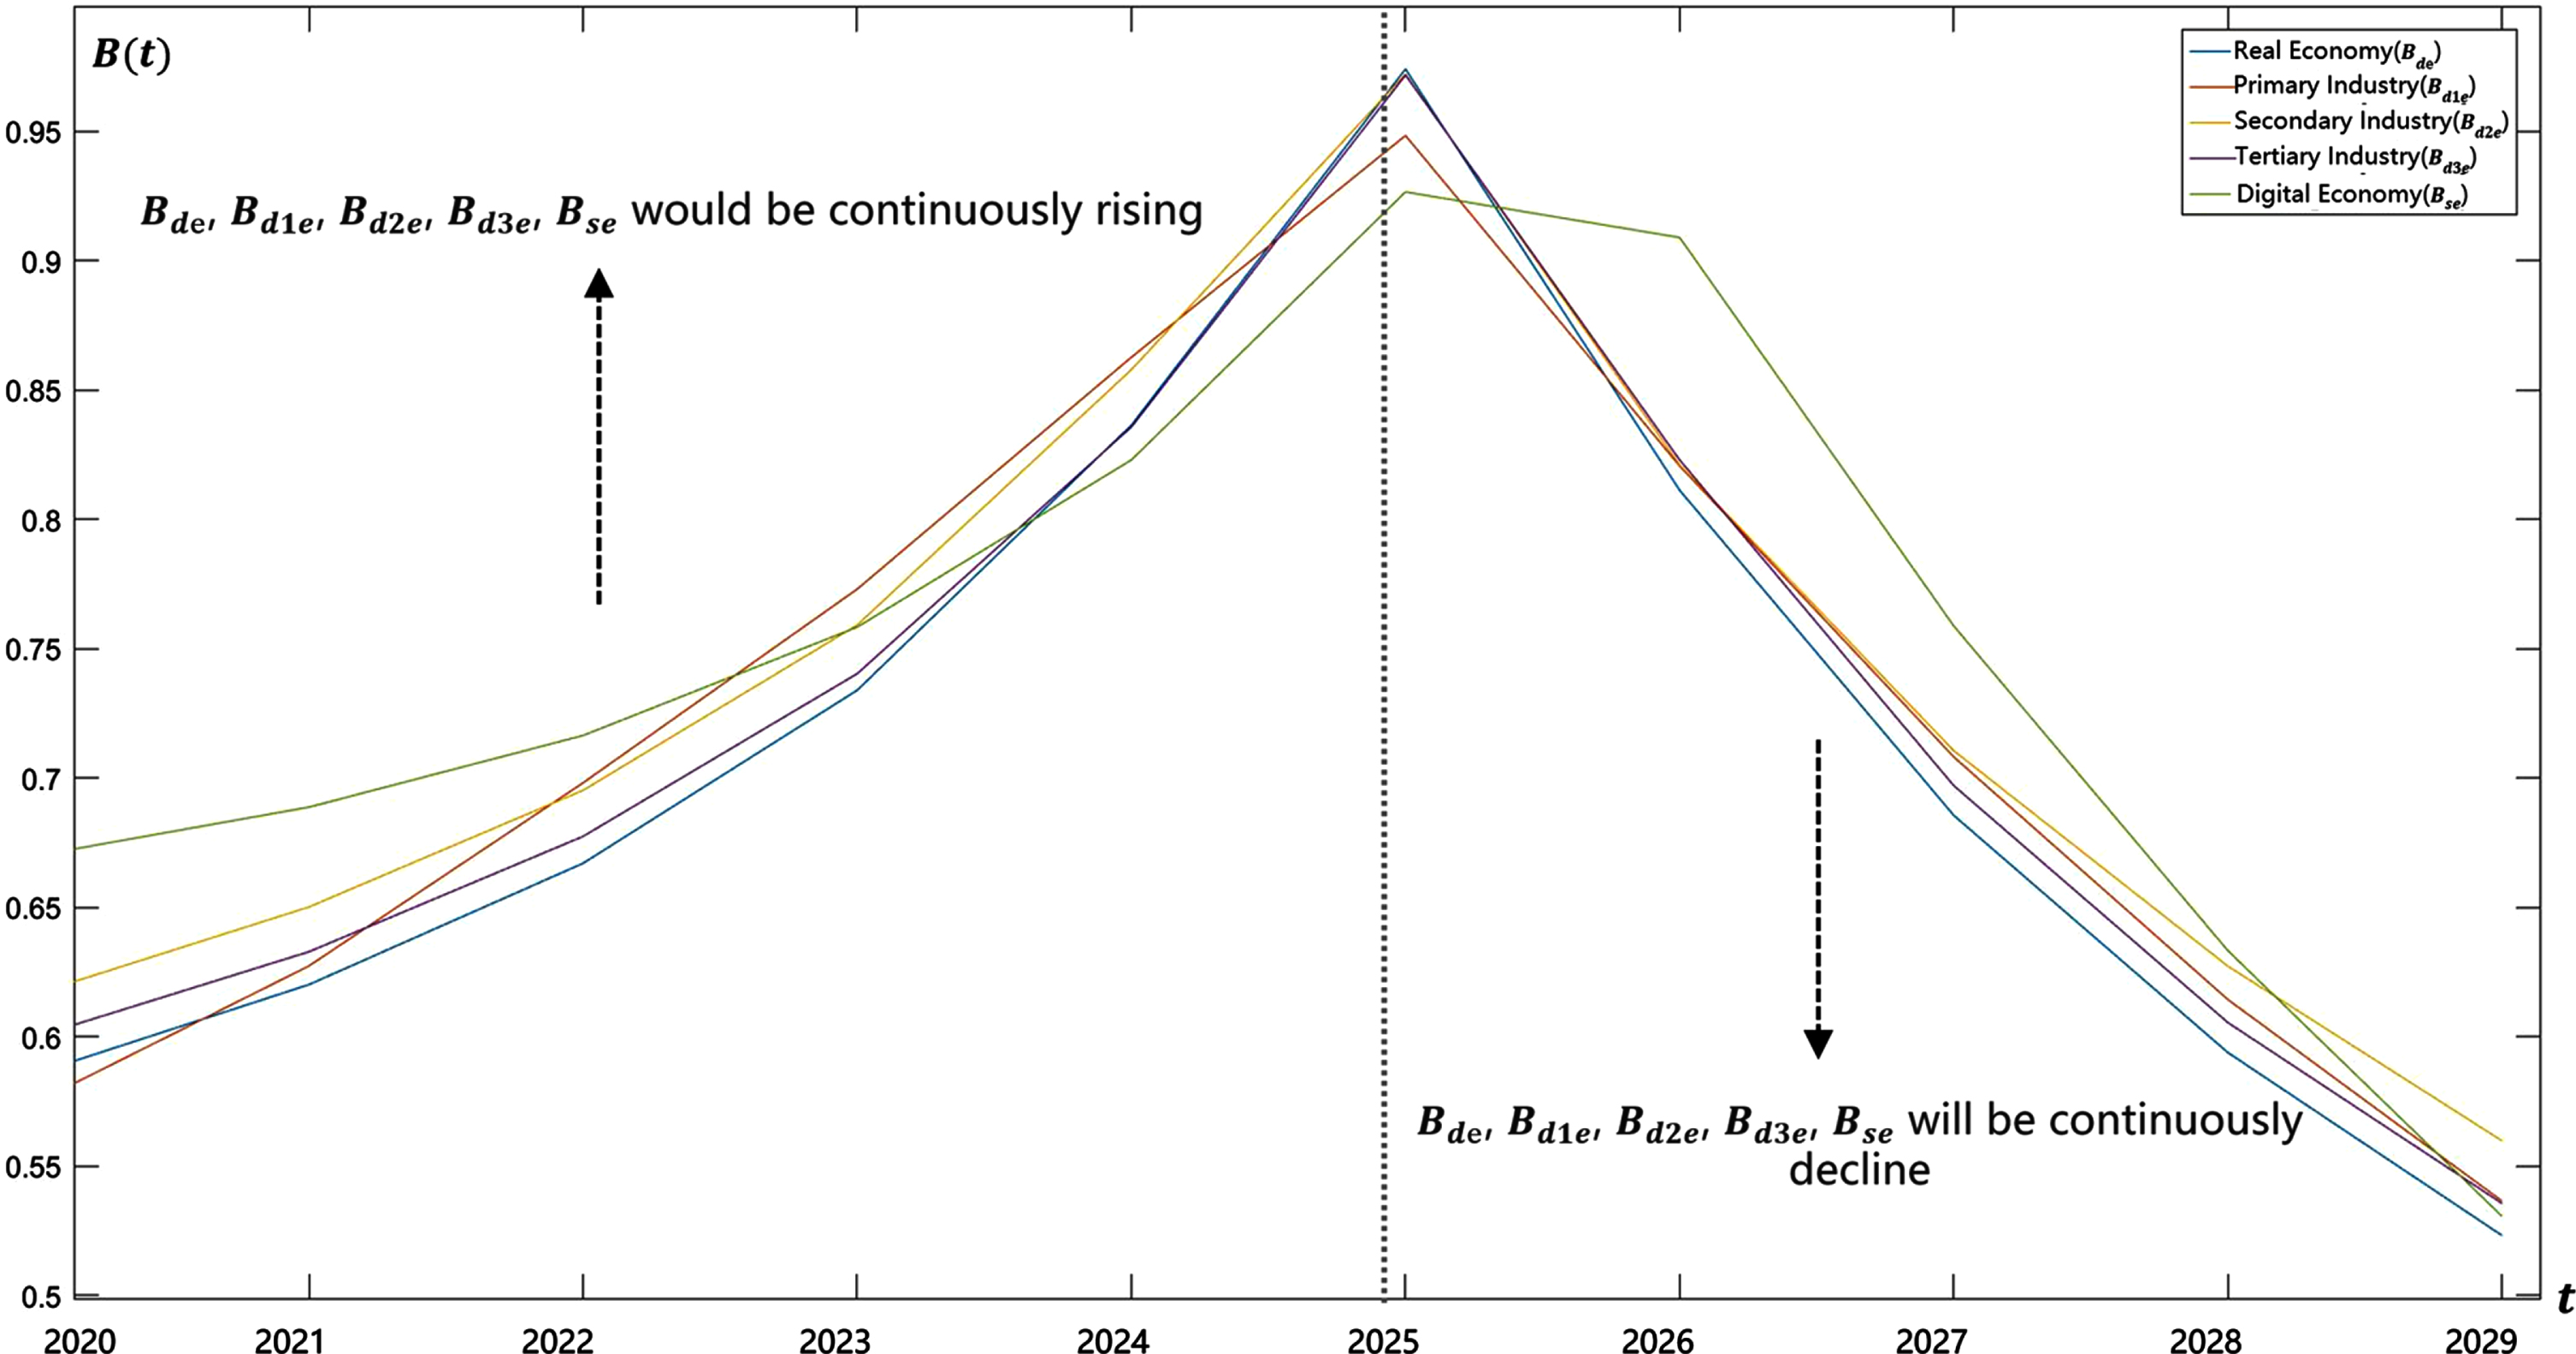
Changes in the own convergence sequence of the digital economy and real economy in 2020–2029.
It is astonishing to identify that from Tables 10, 11 and Figs. 9–12 that the comprehensive convergence coefficient between the digital economy and real economy (also the primary, secondary and tertiary industries) from 2020 to 2029 shows a trend of first increasing and then decreasing, but the overall, there are in the intermediate convergence stage. The ratio of the digital economy own convergence coefficient (B de ) to the real economy (also the primary, secondary and tertiary industries) own convergence coefficients (i.e., B se , Bs1e, Bs2e and Bs3e respectively) is greater than 0.95, showing that the two economies are in a digital economy-led type or a synchronized development type. Furthermore, the comprehensive convergence coefficient of the digital economy and real economy would continue to rise between 0.6 and 0.7, and the overall convergence is in the primary convergence stage led by digital economy from 2020 to 2023. The comprehensive convergence coefficient will grow rapidly between 0.8 and 1 and reach a peak from 2024 to 2025, which is overall in good convergence type led by the digital economy. Correspondingly, the comprehensive convergence coefficient of the digital economy and primary industry (also the secondary and tertiary industries) from 2020 to 2025 continues to rise from the primary convergence to the high-quality convergence, and will reach a peak in 2025.Moreover, the overall convergence coefficient of the digital economy and real economy (also the primary, secondary and tertiary industries) would begin to fall and gradually to the barely coordinated level from 2026 to 2029.
Comprehensive convergence sequence between the digital economy and real economy in 2020–2029
The ratio series of the convergence between the digital economy and real economy in 2020–2029
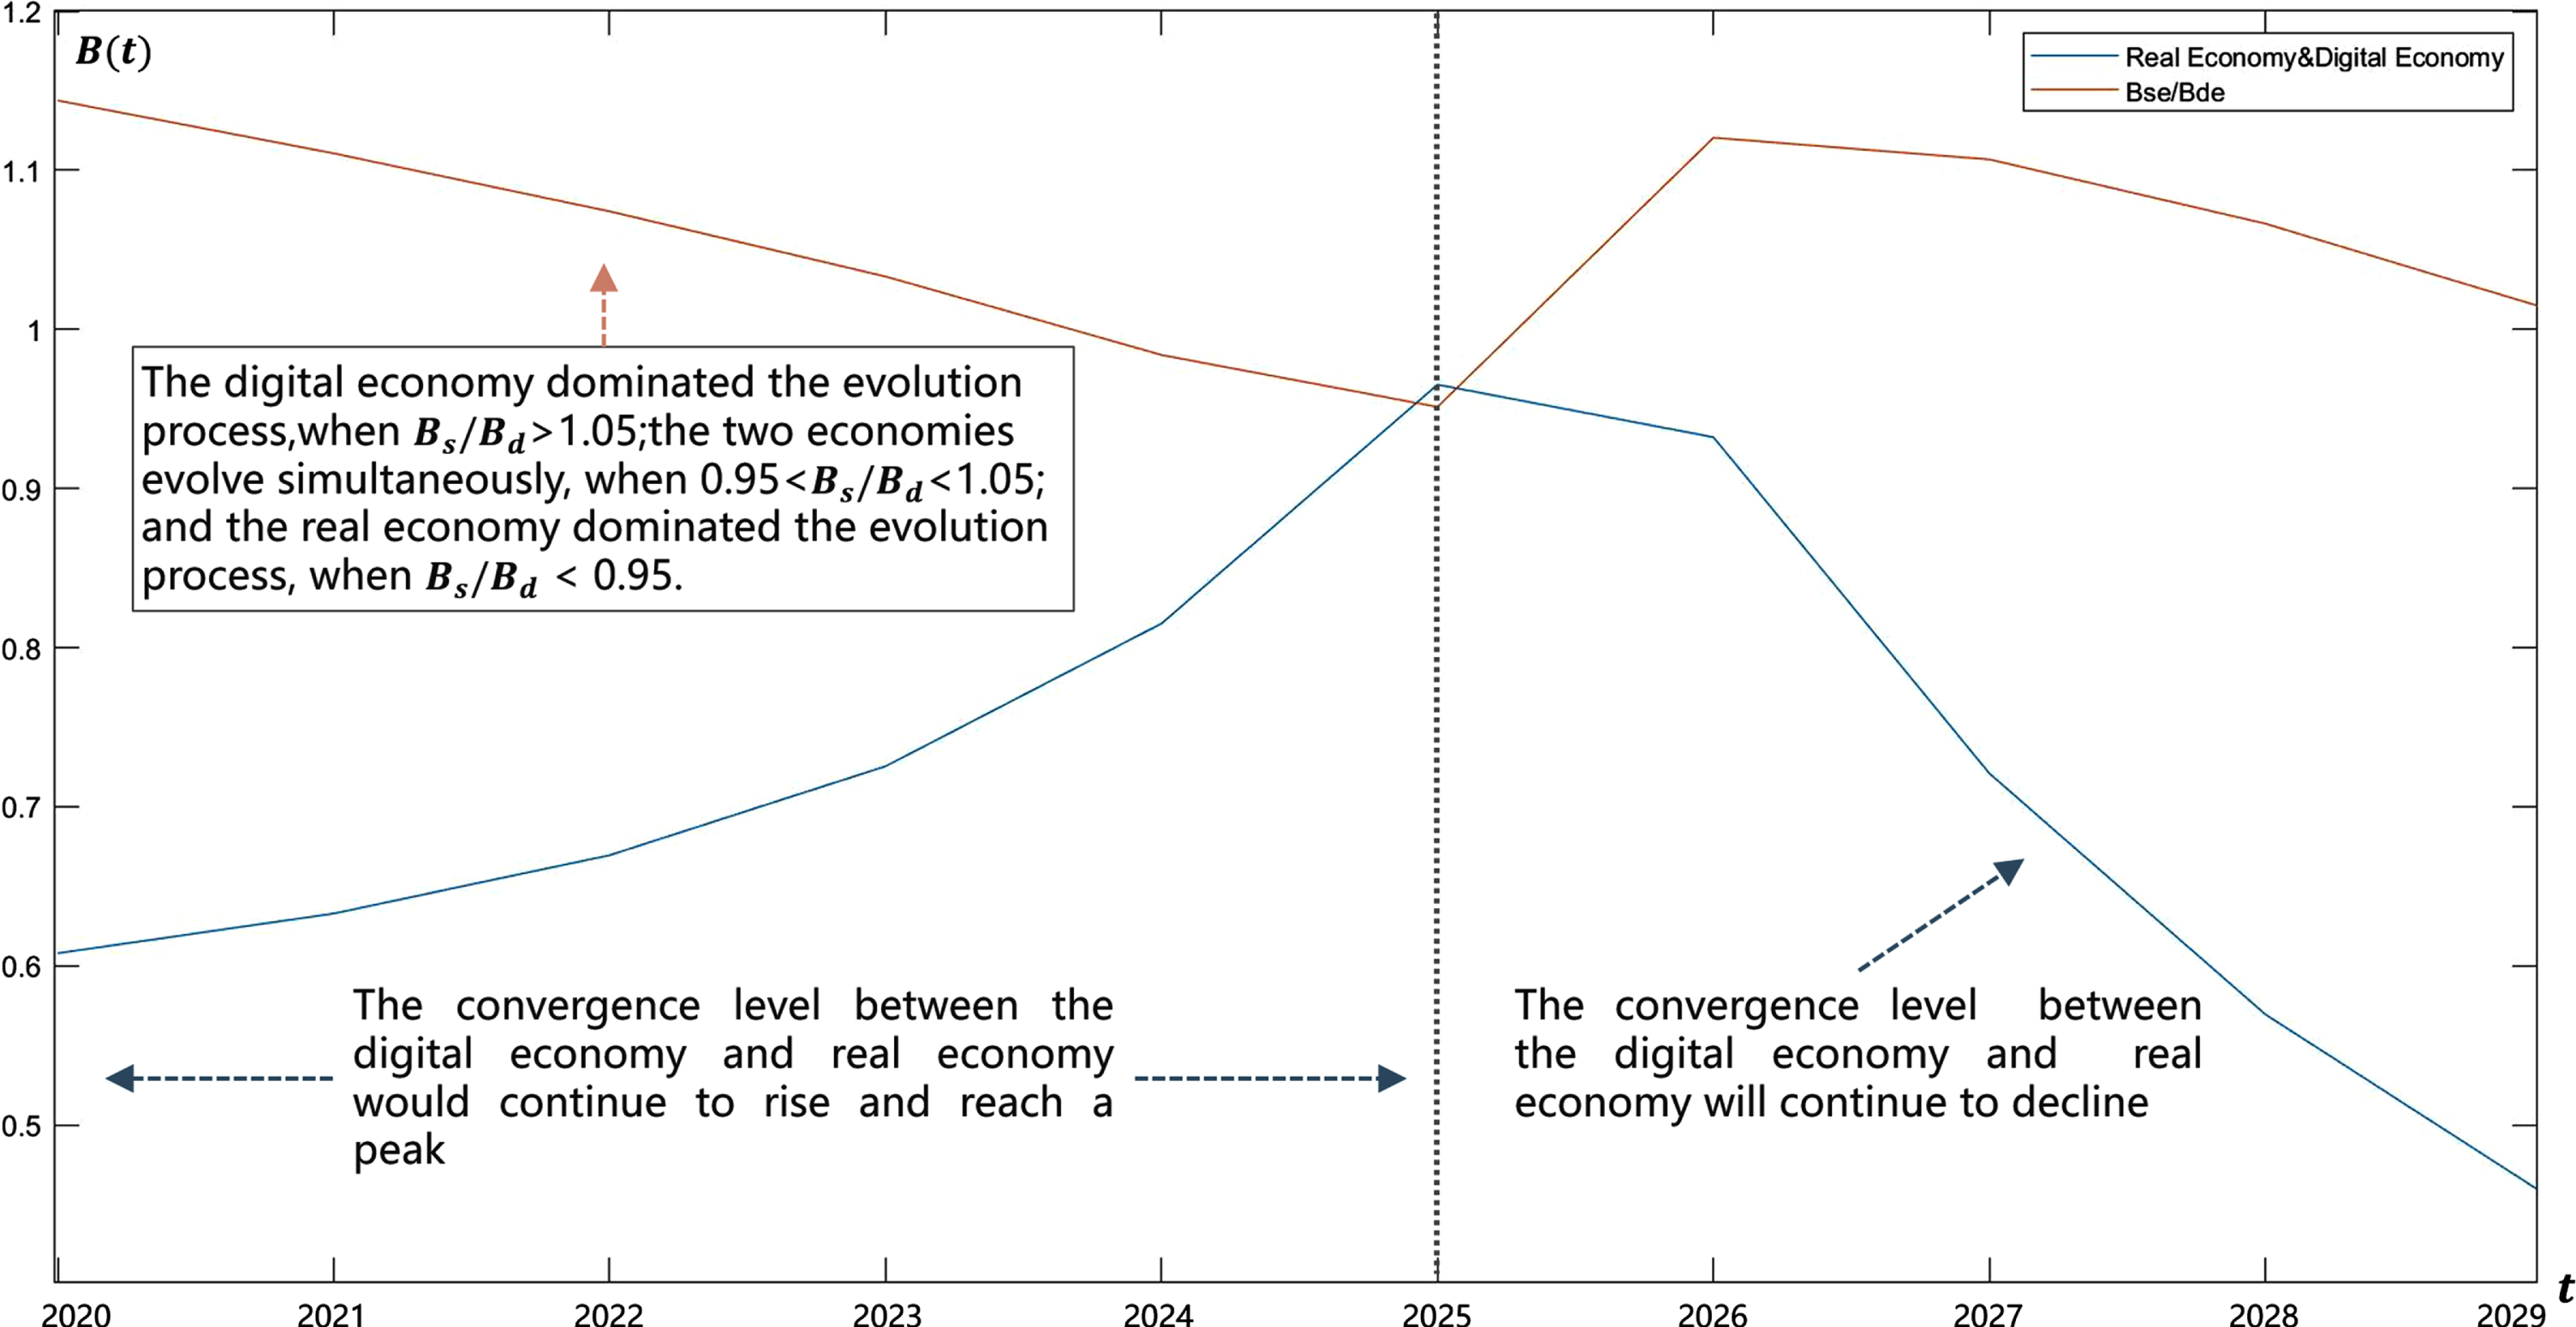
The convergence trend between the digital economy and real economy in 2020–2029.
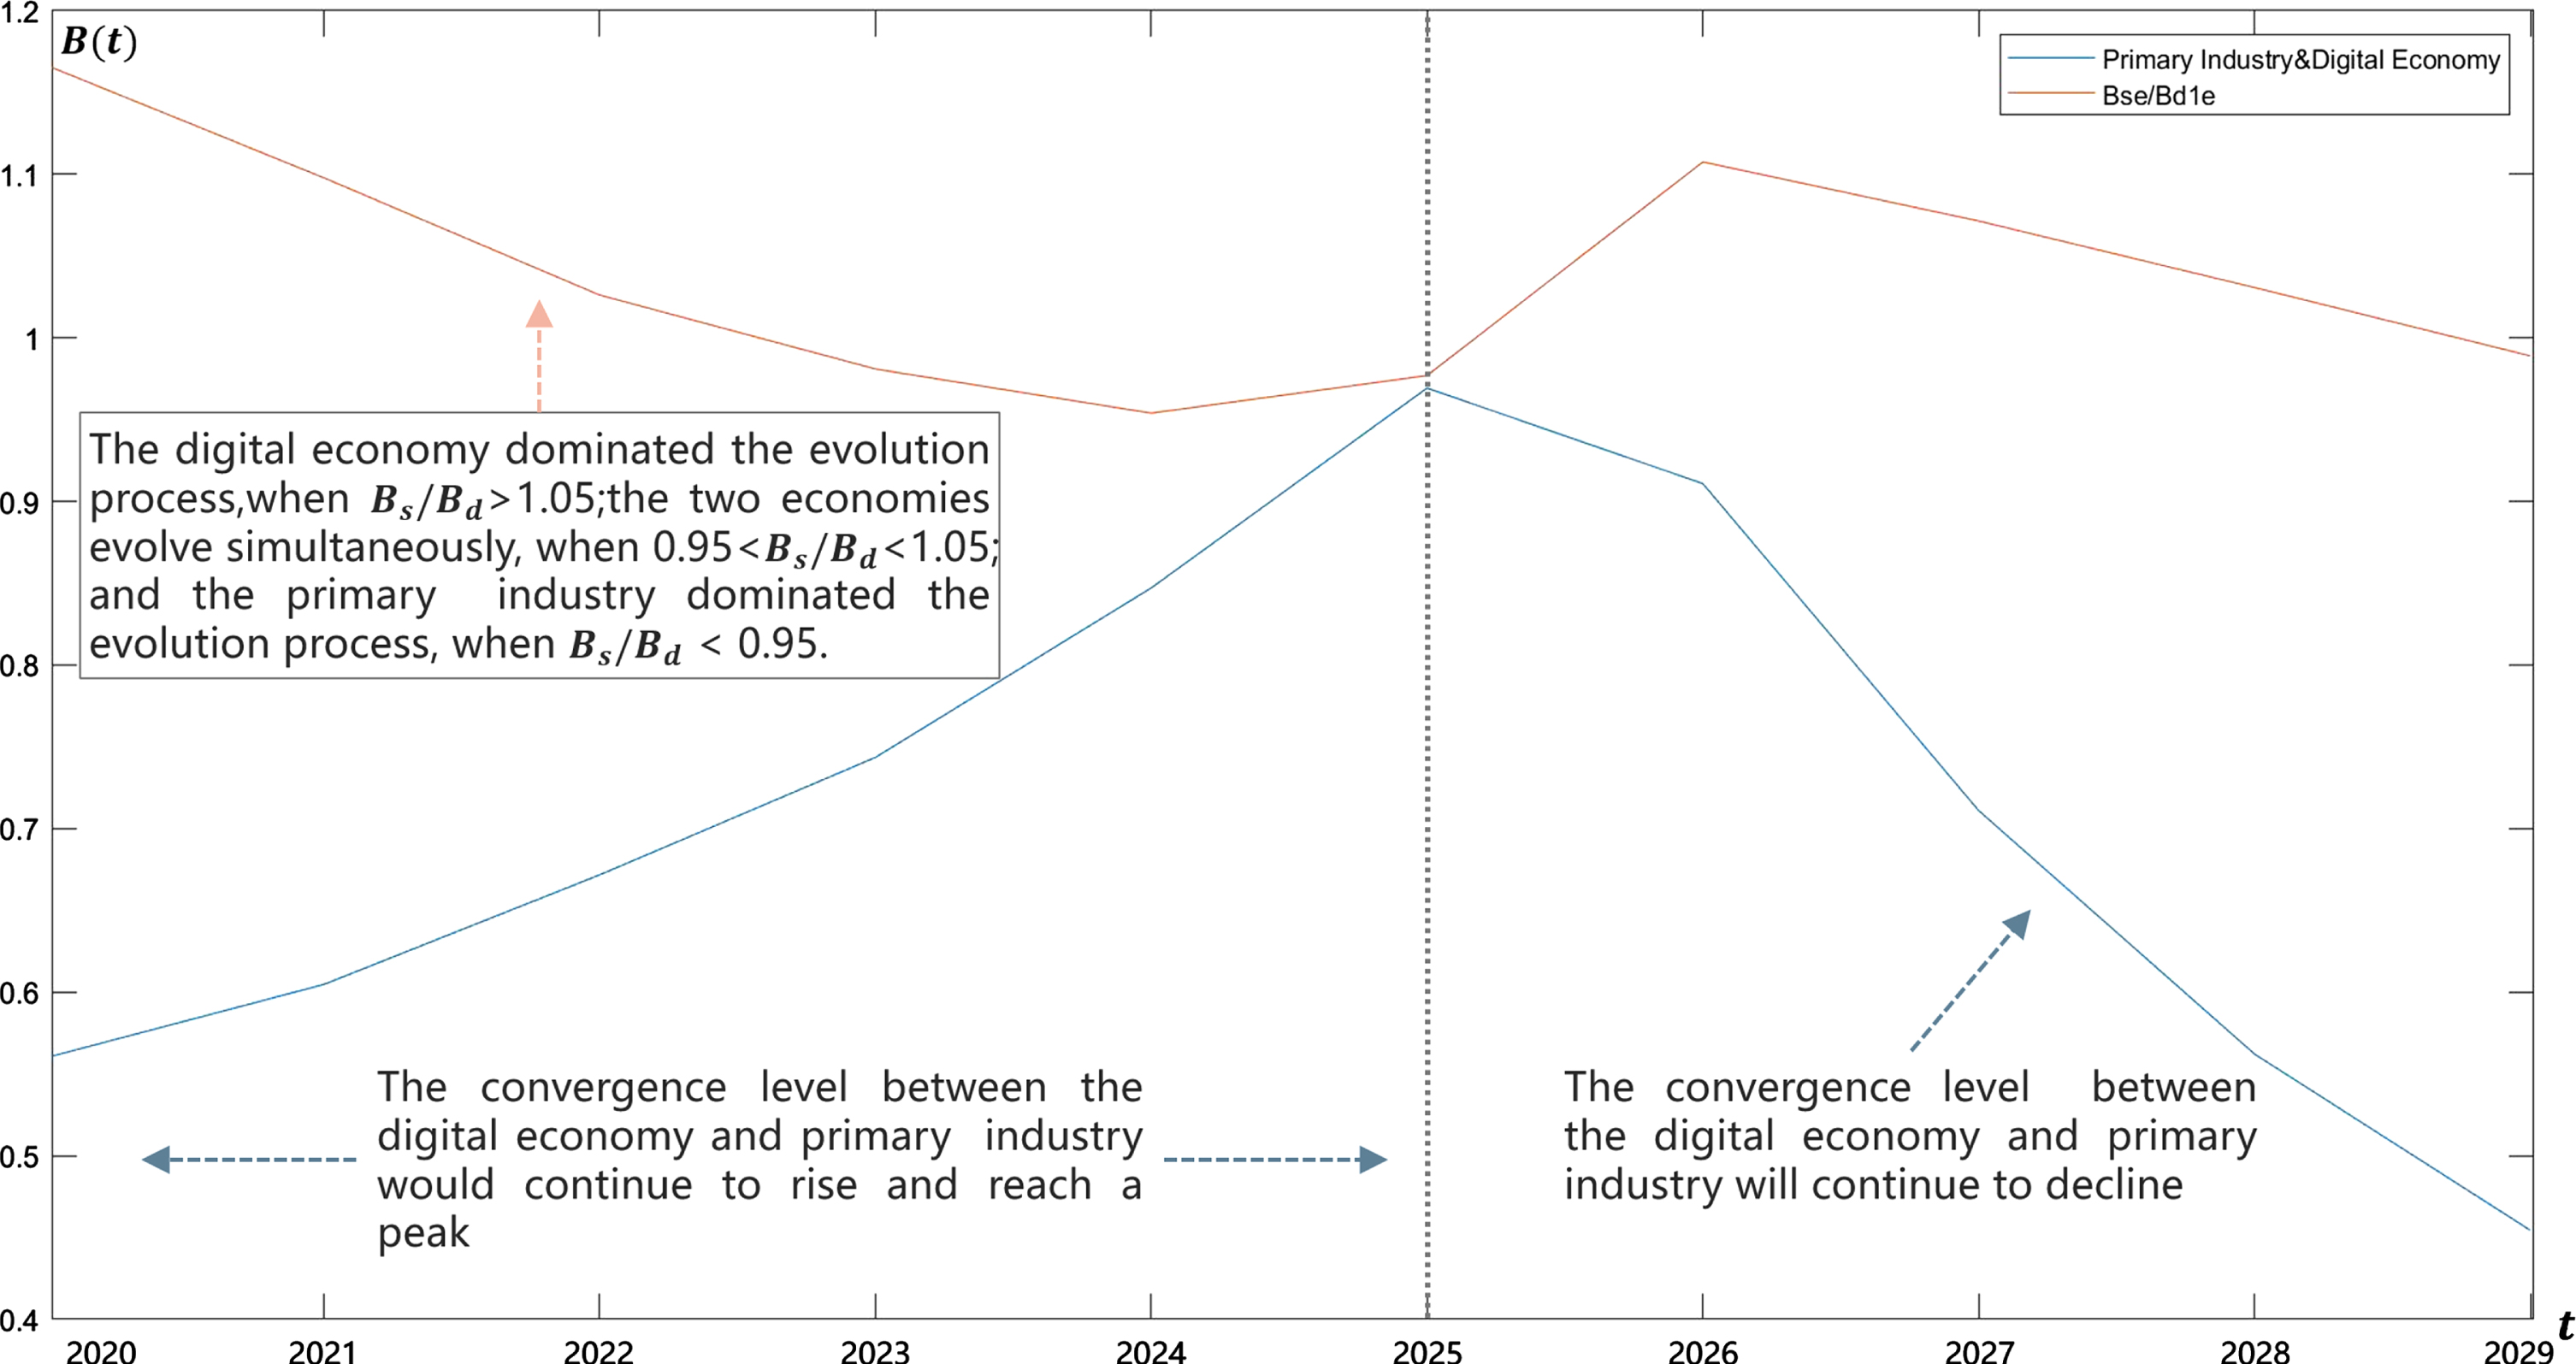
The convergence trend between the digital economy and primary industry from 2020 to 2029.
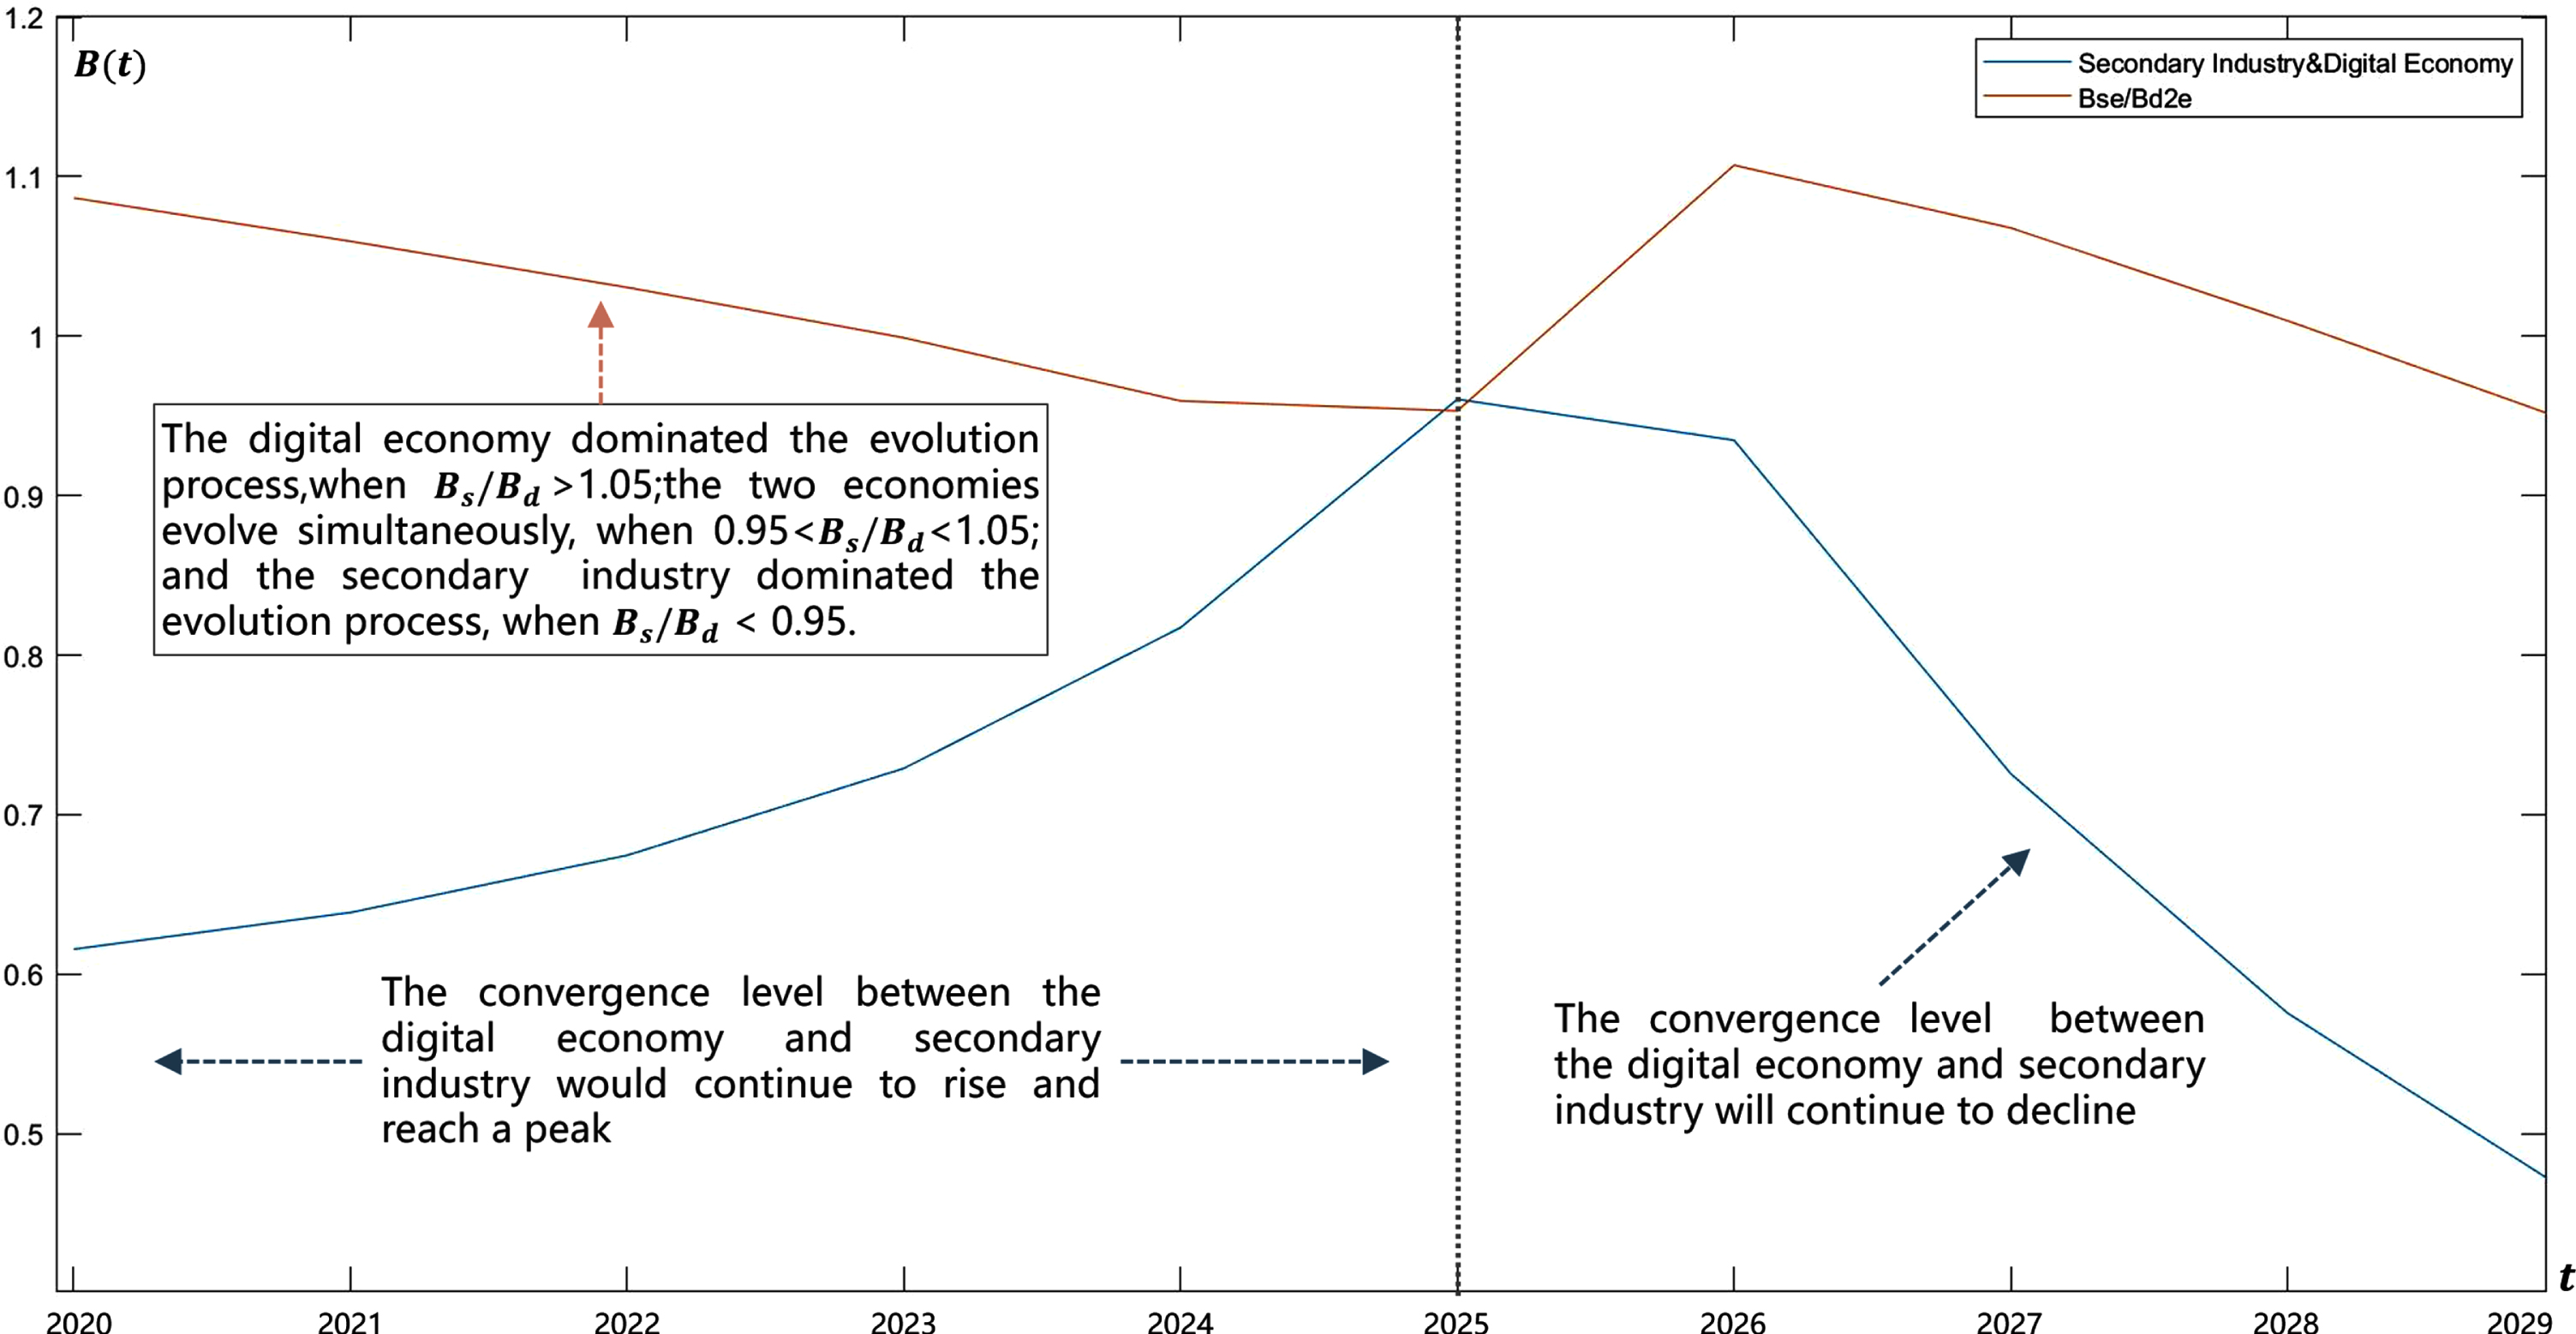
The convergence trend between the digital economy and secondary industry in 2020–2029.
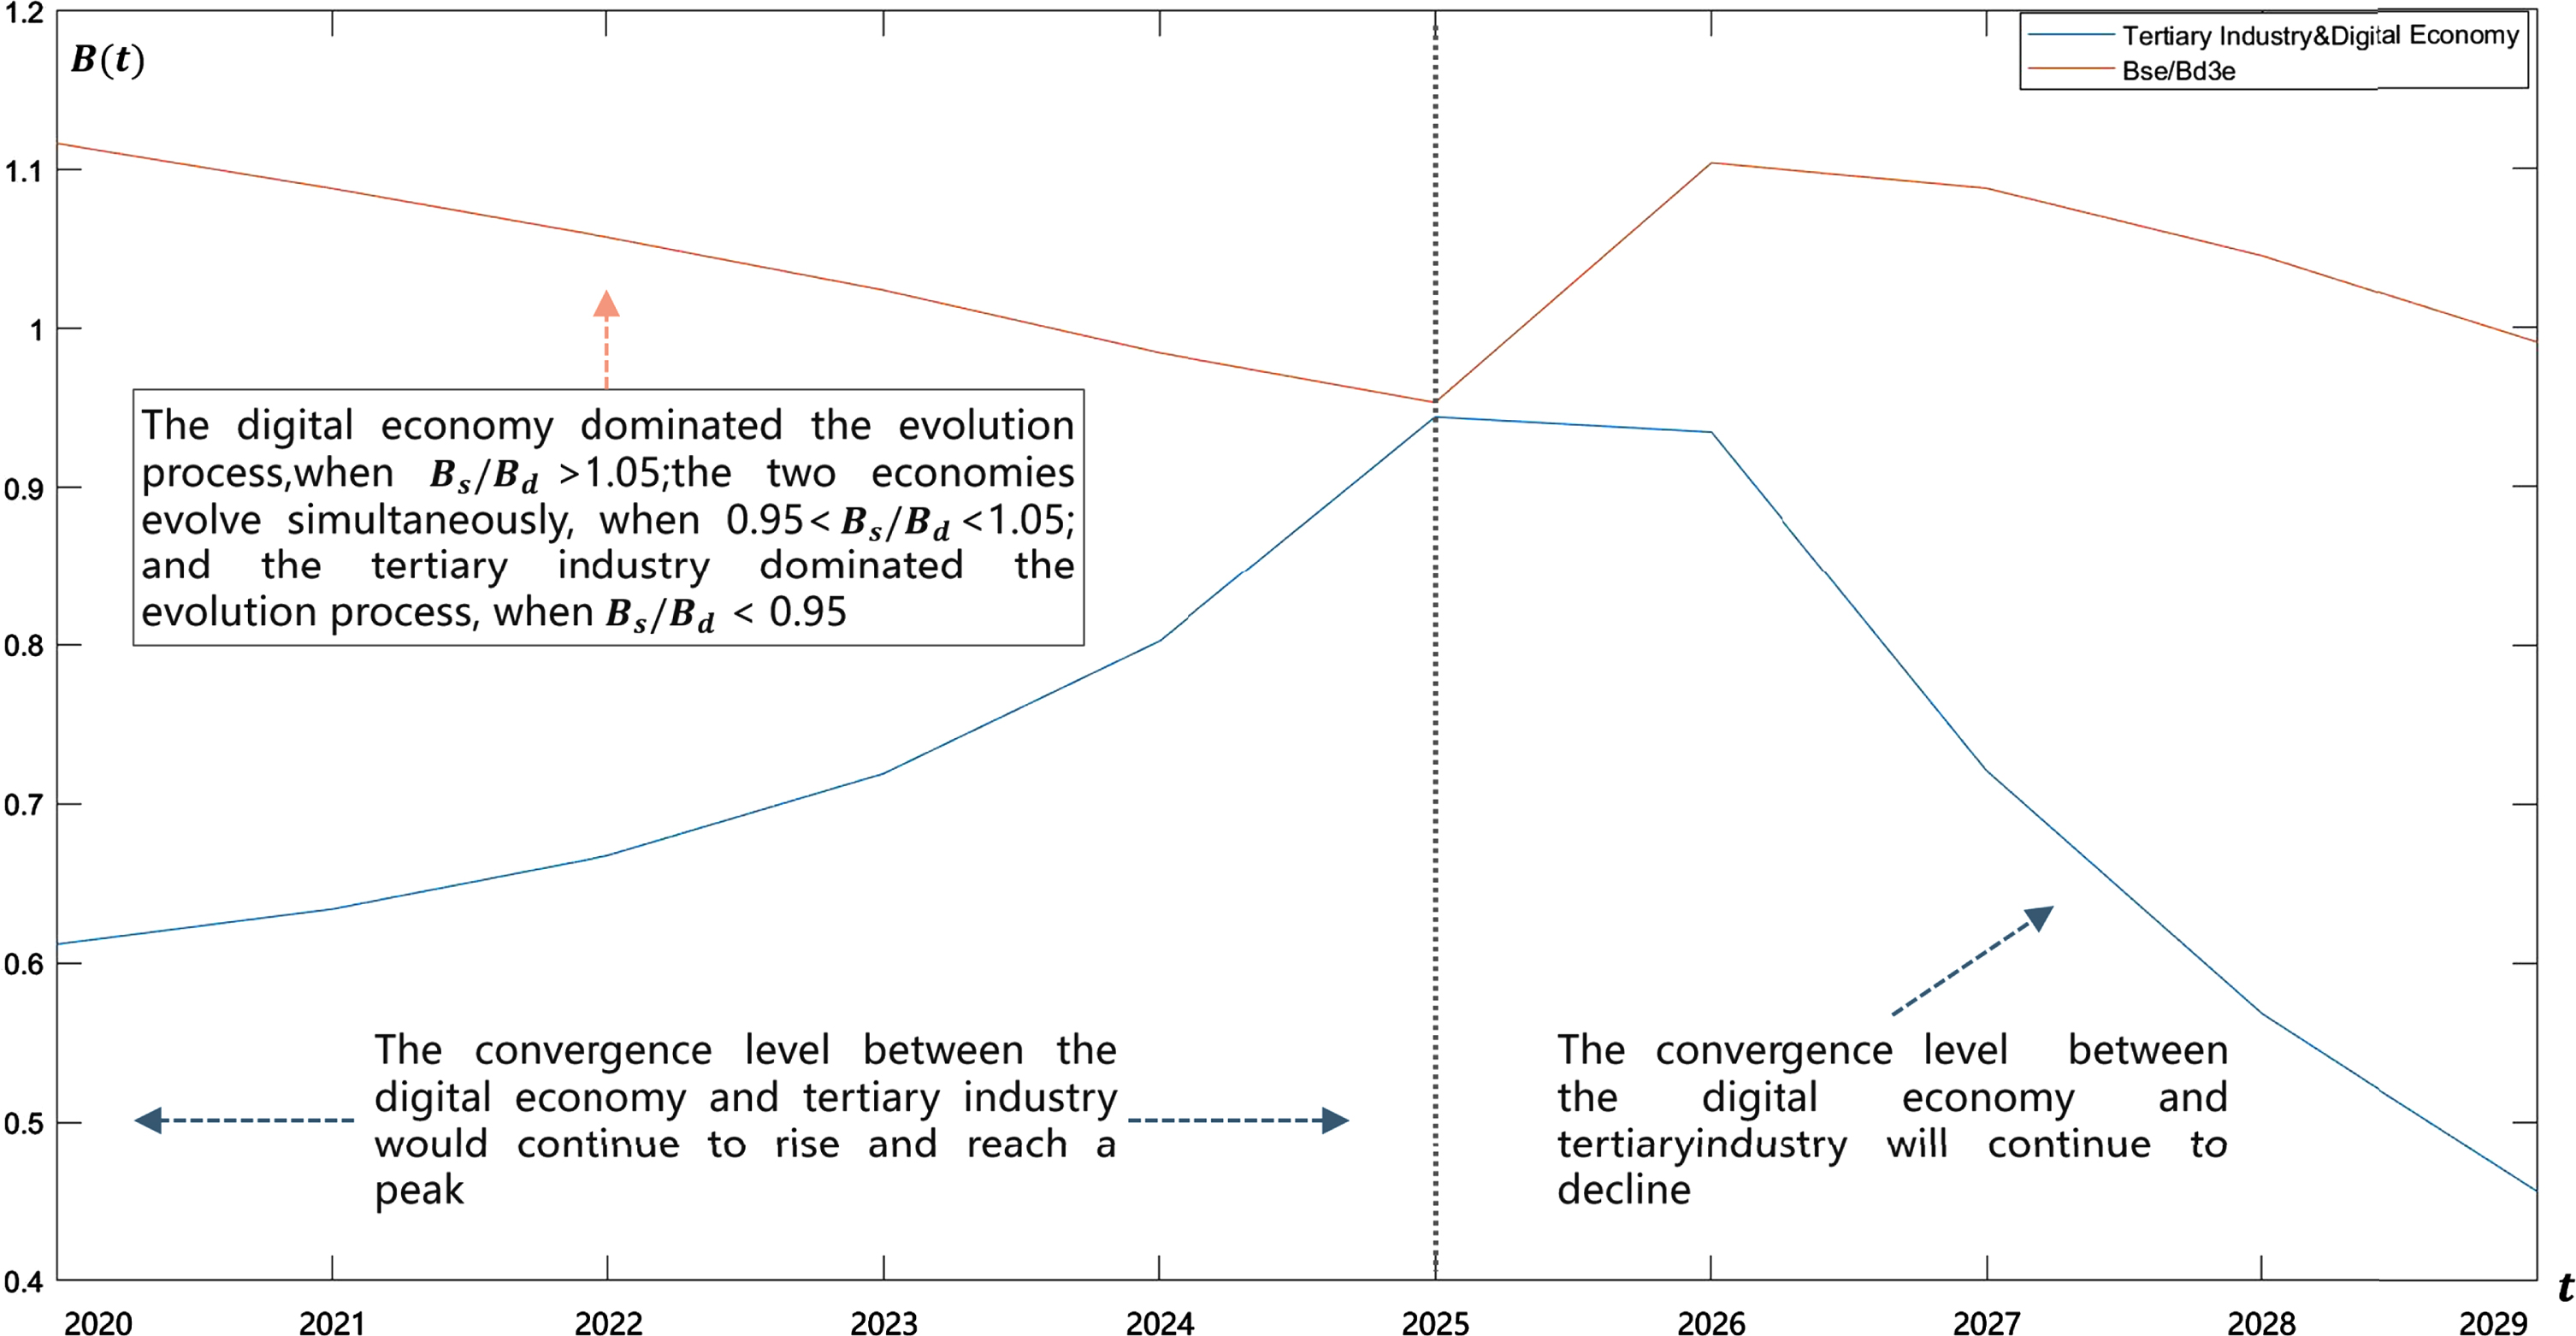
The convergence trend between the digital economy and tertiary industry from 2020 to 2029.
Index selection
There are 7 latent variables in accordance with the “The analysis model of factors affecting convergence of the digital economy and real economy”. Each latent variable needs to correspond to the the index to carry out empirical analysis. On the basis of referring to relevant literature, an observable variable is selected for each latent variable in the paper. The specific indexes are shown in Table 12 [69, 76–78].
Indexes of factors affecting the convergence of the digital economy and real economy
Indexes of factors affecting the convergence of the digital economy and real economy
The paper mainly uses the 2005–2019 China Statistical Yearbook, the 2005–2019 China National Economic and Social Development Statistical Bulletin, the first to fourth National Economic Census Communiqu
Descriptive statistical results of observable variables
Descriptive statistical results of observable variables
Using SmartPLS software to estimate the parameters of the hypotheses, we could obtain the explanatory ability of latent variables for observable variables and test the hypotheses in “3.3 Analysis Model of Factors Affecting Convergence of Digital economy and Real economy based on PLS-SEM”. The specific parameter estimation results are as described in Table 14 andFig. 13.
Estimation of the path coefficients of latent variables in the convergence between the digital economy and real economy
Estimation of the path coefficients of latent variables in the convergence between the digital economy and real economy
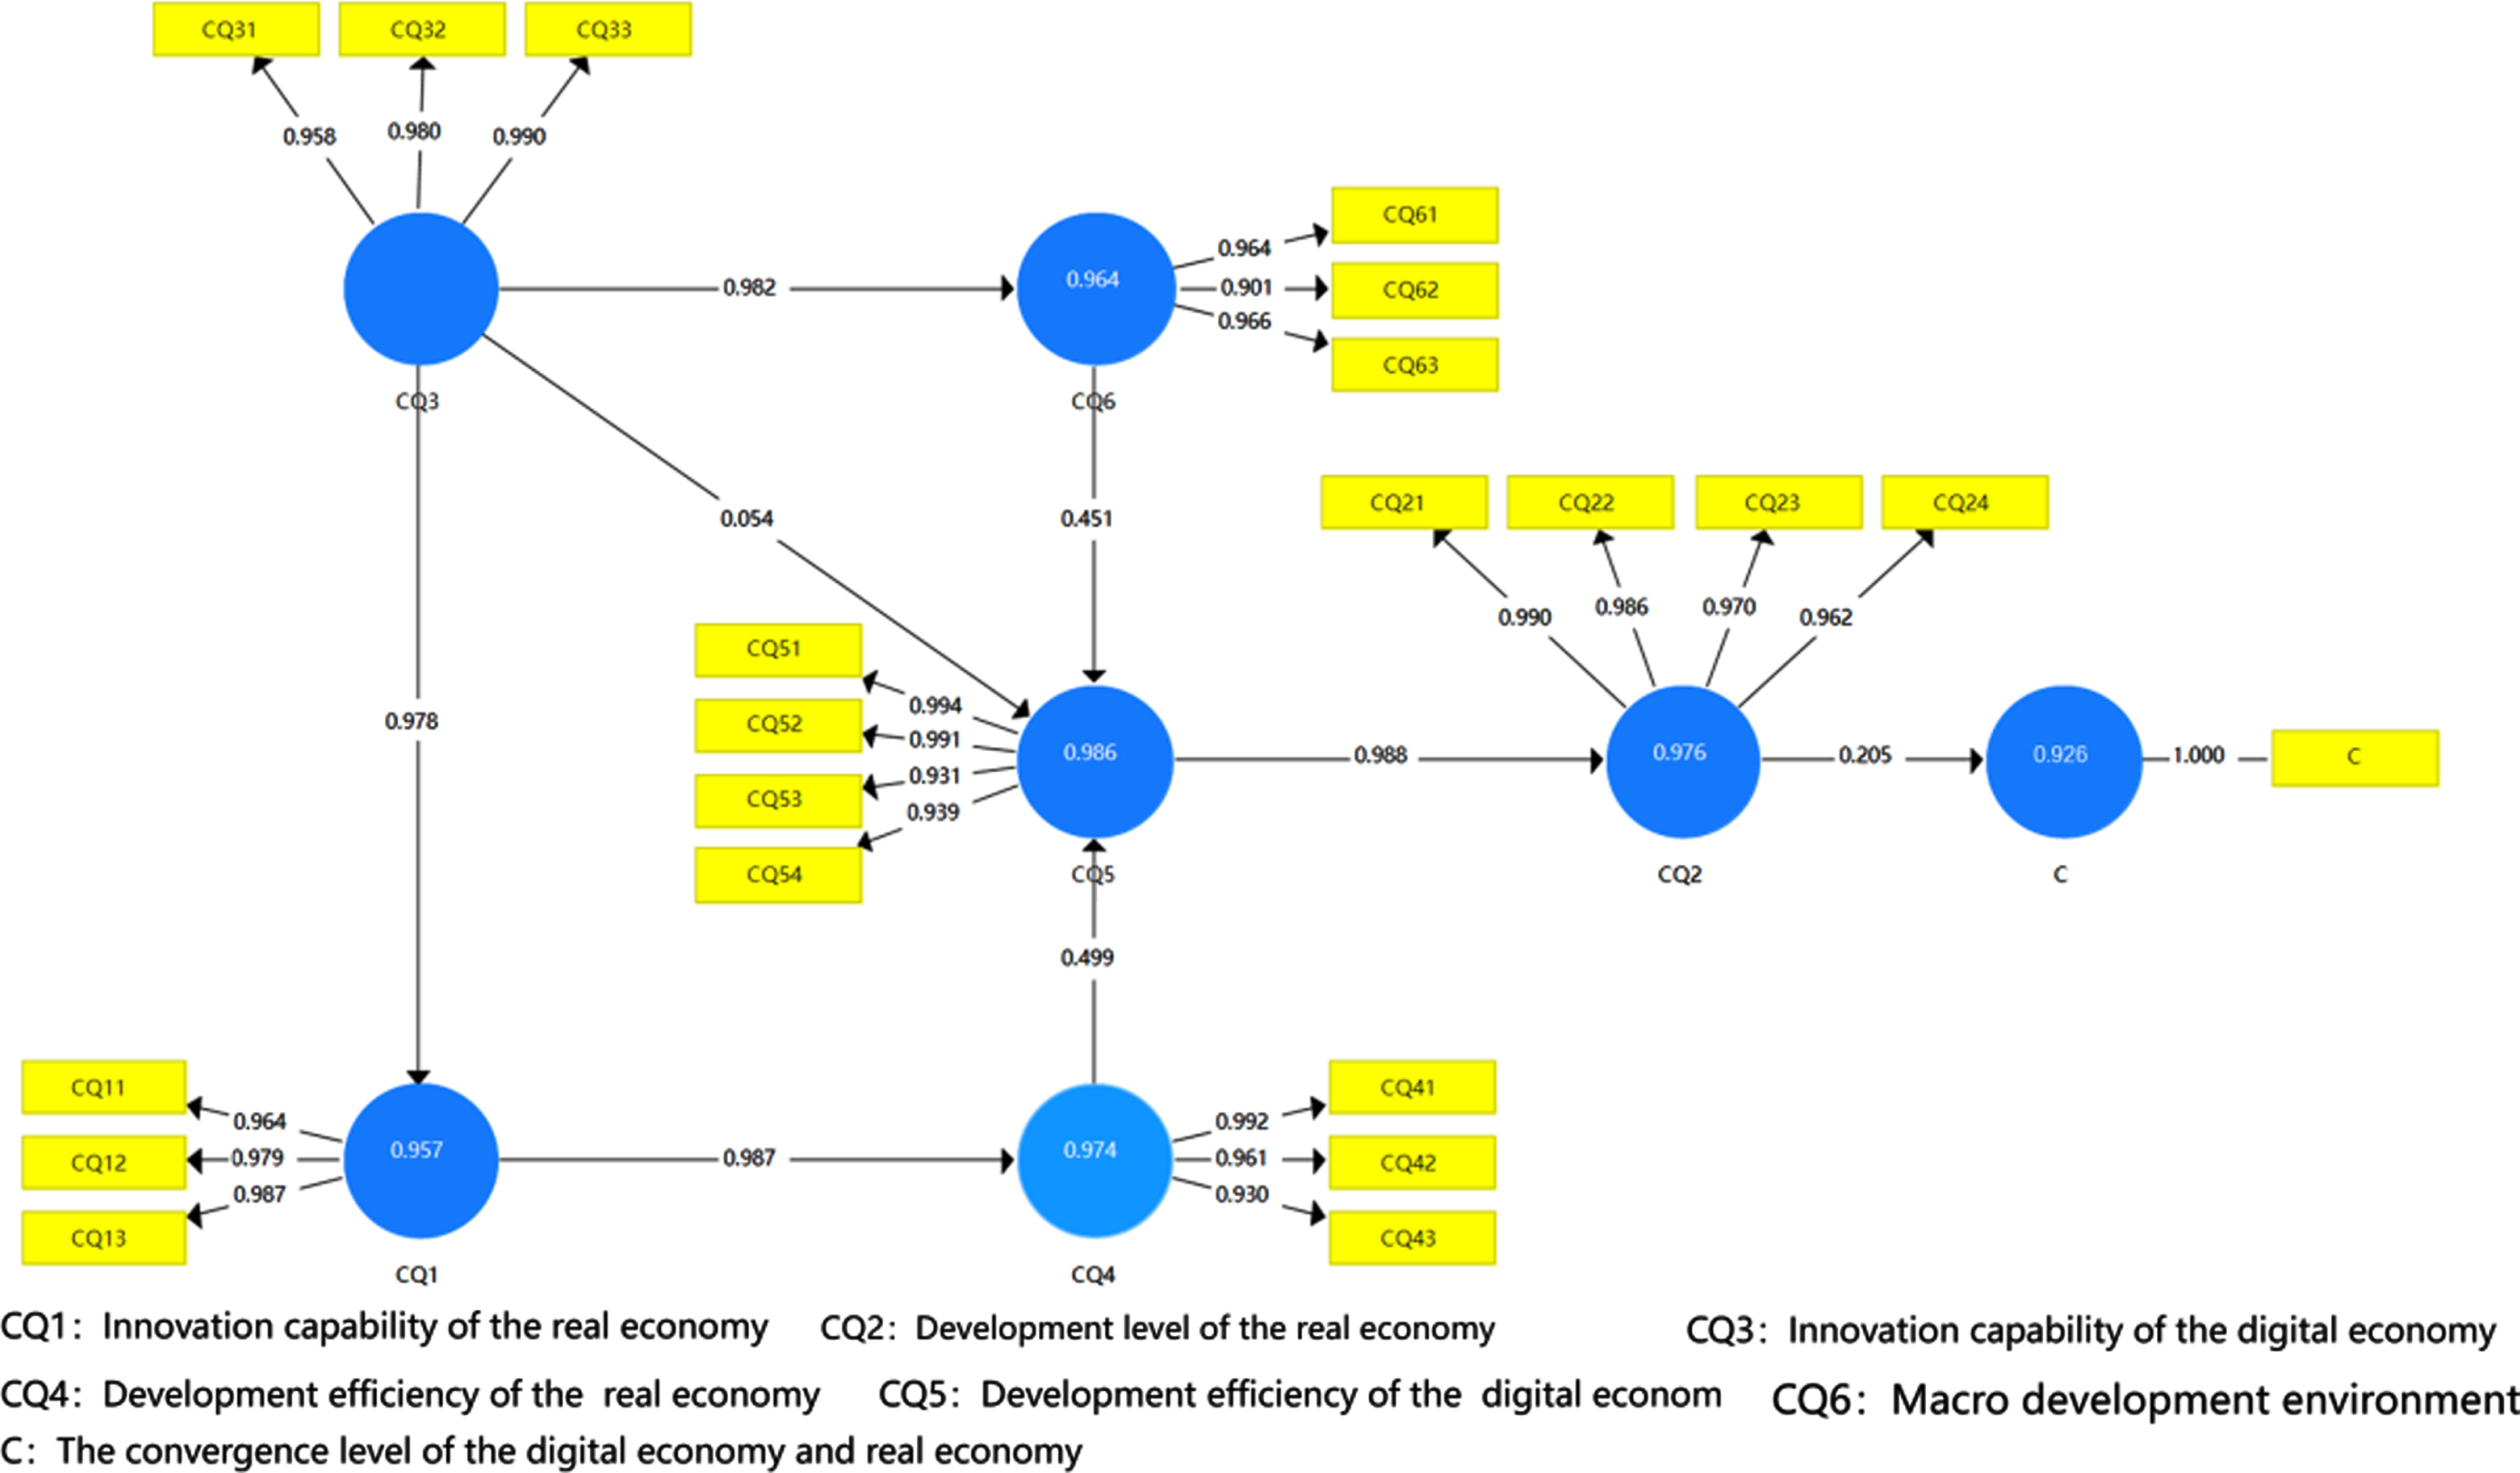
Model path coefficients of factors affecting the convergence between the digital economy and real economy.
When the outer loading is greater than 0.7,latent variables have the ability to explain the internal meaning of observable variables. It can be seen from Fig. 12 that the outer loadings of the 21 observable variables are all greater than 0.7, which can effectively reflect the explanatory ability of latent variables for observable variables and have a good measurement effect.
Predictive ability test We use the AVE, the R2 value and the Composite reliability to test the predictive ability of the model. When the AVE value is greater than 0.5, the R2 value is greater than 0.65 and the composite reliability value is greater than 0.7, the model could be regarded as reliable. The verification of the model is as illustrated in Table 15. It can be seen from Table 15 that the AVE value of each latent variable in the model is greater than 0.5, the R2 value is greater than 0.65 and the composite reliability value is greater than 0.7, indicating that the observable variables are highly effective in prediction. Bootstrapping validity verification The Bootstrapping in the SmartPLS software is adopted to verify the validity of outer loadings and path coefficients in the model. The specific process is: setting the sampling frequency to 1000 times and verifying the path coefficients and outer loadings at significance levels of 1%, 5%, and 10%. A two-tailed T-test would be used to verify the significance of the coefficients, which at least achieve at the level of 10%. The specific verification results are as described in Tables 16 and 17. From the above tables, we can see obviously that the path coefficients have high T statistics and all passed the T-test at least at significance level of 5%, indicating that the overall validity of the hypotheses is in the high level.That is, the above 8 hypotheses in “3.3 Analysis Model of Factors Affecting Convergence of Digital economy and Real economy based on PLS-SEM” are all valid.Furthermore, the outer loadings also have high T statistic and even pass T-test at the level of 1%, which shows that it has a high accuracy and is in significantly good condition. Accordingly, the model is reliable through the above-mentioned predictive ability test and validity test.
Predictive ability test of the analysis model of factors affecting the convergence of the digital economy and real economy
Predictive ability test of the analysis model of factors affecting the convergence of the digital economy and real economy
Bootstrapping verification of model path coefficients
Note: ★★★, ★★, ★ indicate significant statistical levels of 1%, 5%, and 10% respectively.
Bootstrapping verification of outer loadings
Note: ★★★, ★★, ★ indicate significant statistical levels of 1%, 5%, and 10% respectively.
In accordance with the model’s predictive ability test and validity test, the total effects of each latent variable and the outer loadings are further calculated as demonstrated in Tables 18 and 19.
The total effect of latent variables
The total effect of latent variables
The outer loadings of the model
Considering the Tables 14, 18, 19 and the model verification results, the following conclusions could be drawn on the hypotheses of the factors affecting the convergence between the digital economy and real economy: The total effects of the innovation capability of the digital economy on that of the real economy, the macro development environment and the development level of the digital economy are 0.978, 0.982 and 0.978 respectively. Assuming H1, H2, and H3 are verified, it explains that the innovation capability of the digital economy exerts positive influence on the convergence of the digital economy and real economy. In other words, the key to enhance the high-quality developments of the digital economy and real economy is promoting the continuous improvement of innovation capabilities in the digital economy. Additionally, it can be found from Table 19 that the outer loading of innovation capability of the digital economy on the full-time equivalent of R&D personnel, the number of R&D topics and the number of effective invention patents are 0.958, 0.98, and 0.99 respectively, explaining that the technical innovation is the main focus of facilitating the innovation capability of the digital economy. The total effect of the innovation capability of the real economy on the development efficiency of the digital economy is 0.987, the effect of the development efficiency of the digital economy on the development level of the digital economy is 0.499, while the effect of the macro development environment on the development level of the digital economy is 0.451. Assuming H4 and H5 and H8 are verified, it could be concluded that the innovation capability of the real economy has a greater impact on the development efficiency of the digital economy that could further enhance the development level of the digital economy. The real economy is essentially an important “supply-side” factor to improve the efficiency of the digital economy while the macro environment has a relatively smaller influence on the development level of the digital economy. The total effect of the development level of the digital economy on that of the real economy is 0.988 and the effect of the development level of the real economy on the convergence of the digital economy and real economy is 0.205, indicating that the development level of the digital economy has a greater impact on that of the real economy, and then affecting the convergence level between the two economies through the real economy. Meanwhile, although the development level of the real economy has a small absolute value on the convergence of the two economics, it could be identified from Table 18 that the total effects of other latent variables on the convergence level are less than that of the real economy. In other words, the effect on the convergence level are mainly affected by the development level of the real economy (0.205), followed by the development level of the digital economy (0.202) and the innovation capability of the digital economy (0.198), which reflects that the digital economy also has a positive influence on the convergence between the two economies. In addition to the H1-H8 hypotheses, other crucial factors (i.e., the total effects are greater than 0.9) are also identified in the Table 18: The total effect of the innovation capability of the digital economy on the development efficiency of the digital economy is 0.966, reflecting that the innovation capability has a great positive impact on the development efficiency of the digital economy. The effect of the innovation capability of the digital economy on the development level of the real economy is also 0.966, indicating that the innovation capability is the key factor in boosting the development level of the real economy.
This paper aims to explore the convergence level of the digital economy and real economy as well as its influencing factors. The following three main conclusions could be drawn from the empirical research:
First of all, the convergence between the digital economy and real economy (including the three industries) showed cyclical fluctuations in the unit of about 5 years. It could be found that the convergences of digital economy and the real economy had continued to decrease, indicating each economy could no longer rely solely on the convergence within its own to achieve sustained and healthy economic developments. Accordingly, the each economy would showed a better development trend if there was good convergence between economies; however, the economy may lag behind in development if the convergence effect was not strong. In a short, the convergence of the digital economy and real economy has become the main driving force for the sustained and healthy development.
Secondly, it could predict that the convergence level between the real economy and digital economy, showing that an upward trend firstly and then a downward trend from 2020 and 2029. To sum up, it demonstrates the convergence of the digital economy and real economy may face the problem of insufficient motivation and would continue to weaken from 2025 considering the current internal and external environments, which would exert negative impacts on the healthy development of two economies.
Finally, the paper constructs an analysis model of factors affecting the convergence based on PLS-SEM. It could be identified that the convergence level is impacted positively to varying degrees by the innovation capabilities of the two economies, the development efficiency of the digital economy, the macro development environment as well as the development level of the two economies. Therefore, the paper puts forward suggestion on boosting the convergence level, i.e., effectively enhancing the knowledge diffusion of innovative activities to achieve innovation convergence, creating a good macro development environment, regarding the real economy as a key supply factor and foothold for the convergence as well as improving the efficiency of innovation convergence, for instance: organizational convergence innovation, technology convergence innovation and business model convergence innovation.