
Abstract
The detection as well as analysis of faults in Induction Motor (IM) is prominent in the industrial process in recent decades, since it has been a demanding issue in industries to confirm the safe and reliable operations of IM. Though the electrical faults, mechanical faults and environmental faults cause damages in IM, as per Electric Power Research Institute (EPRI) statistical studies, the faults due to (i) rotor mass unbalance and (ii) rotor shaft bending substantially contribute 8-9% of the total motor fault. This present research work focuses on the issue of detecting and analysing the faults by studying the current and vibration data obtained from the three-phase squirrel cage IM under healthy and faulty conditions using the experimental workbench. It also depicts the development of a fault detection model for IM which comprises the integrated approach of Principal Component Analysis (PCA) and Fuzzy Interference System (FIS) and two level decision fuzzy measures. Besides, fuzzy integral data fusion technique has been used in this work for the improvement of diagnosing accuracy. The data acquired from the workbench system are first investigated through the PCA to extricate the appropriate features that provide the major information of collected data without reducing its dimensions. The projected data space using the principal components is non-deterministic for further synthesis process of fault classification. Hence, to classify the faults in IM, the obtained feature vectors from PCA are fed into FIS as an input and the classification performance is compared finally. The work experiment has been carried out under the healthy and different faulty conditions of motor and the proposed integrated approach is executed by using MATLAB.
Keywords
Introduction
Induction motors are normally used as prime movers, due to their reliable and robust characteristics. There are reductions in the tolerance of the machine performance and they demand the necessity to detect and identify the faults at the earliest, due to the increase in complexity as well as the expense of the systems used in the industry [1]. The degradation of motors occurs due to their operation time, heat and moisture in the working environment. In order to avoid downtime in operation and to minimize the breakdown, early detection of failure is to be prioritized [2]. The predictive maintenance and monitoring the condition of motor provide a solution to diagnose various faults in Induction Motor and pave ways for the development of various algorithms and techniques for monitoring and fault diagnosis. The Induction motor fault is classified majorly into Electrical and Mechanical faults and in which approximately 40% of machine failures occur due to mechanical faults [3]. These faults are categorized as stator faults, rotor winding fault, eccentricity fault, end ring fault, faults due to shaft bend and failures in bearing and gearbox [4]. The winding faults are the results of overheating of coils due to failed cooling system, inter-turn short circuit and insulation failure. The most prevalent faults that demand special attention are air gap irregularities, shaft bend and cooling system failure, which result in symptoms like increased torque pulsations and excessive heating [5]. Various types of faults that are created in the Induction motor due to the stator, rotor, air gap eccentricity, shaft bend, bearing and gearbox failure are addressed [6]. Indications like unbalanced voltages, torque pulsations and excessive heating are generated due to faults. Various diagnostic techniques namely Motor-Current Signature Analysis (MCSA), infrared recognition, noise and vibration monitoring can be performed to diagnose such faults. The importance of condition monitoring techniques used to find internal electrical and mechanical faults along with the monitoring of inverters, load and transmission systems has been studied [7].
The commonly used condition monitoring methods of Induction motors with single and multiple input signals have been reviewed [8]. The limitation of the existing methods has been addressed by developing an intelligent learning model namely Fuzzy Min-Max- Random Forest Ensemble (FMM-RFE) and it is utilized to test with a set of explanatory rules extracted from the above model for its performance in both noise-free and noisy environments. The authors have studied the triaxial detection method which has been developed based on radial, axial and tangential vibration signatures of the Induction machine for multiple faults in vector control induction motor drive [9]. Dual Tree Complex Wavelet Transform (DTCWT) based method has been proved to be a better one compared to the traditional DWT-Discrete Wavelet Transform for detecting faults. For feature extraction, the performance of the Support Vector Machine based model is compared with the k-nearest neighbour for its efficient representation of input space. To extract features from signals, Principal Component Analysis and Independent Component Analysis have been implemented. The classification algorithms like Support Vector Machine, Fuzzy k-Nearest Neighbour, adaptive resonance theory-Kohonen Neural Network and Parzen Probabilistic Neural Network are compared [10]. An intelligent maintenance system for machinery has been developed with data extracted from current and vibration signals. Machine Fault Simulator is used to simulate faults from bearing defects at inner race, outer race, ball and at cages. The machine unbalanced condition, mis alignment, looseness cases have been reviewed and used to train the self-organizing map (SOM). Artificial neural network technique based classifier results have provided good accuracy [11]. The authors have implemented PCA method to select the effective signal features for classifying the machine bearing defects [12]. In three types of rolling bearings, a PCA-based approach has been developed for selecting the most representative features for the classification of defective components and defect severity.
In industrial control systems, fuzzy set approach is used to find the precise solution in a situation where data are vague or deficient. The authors have quoted that fuzzy set theory or fuzzy information systems are used in a heuristic way where the system or model cannot be defined by a simple or deterministic way. A fuzzy set approach for solving the challenges which comprise unsettled variables has been discussed in tutorial. In this study, fuzzy based system has been developed for the classification of fault in IM and it is a prominent requirement in industrial applications. The authors have indicated that faulty classification is an important topic in industries and various types of classification methods have been developed by the researchers in recent years [13]. Important methods of classifications are: 1) Wavelet transforms technique 2) Neural network technique and 3) Fuzzy based technique. Though all the above techniques are efficient and broadly used in fault identification problems, in tutorial its convinced that fuzzy logic systems are easy in nature compared to other two methods in view of their complex nature of computations [14]. Also, the advantage of this system over the conventional system is to perform the simulation using the software.
The proposed approach presents the application of Fuzzy Information System (FIS) for mechanical fault classification and it has permitted to ascertain the nature of the fault in IM [15]. The authors have mentioned FIS into Complete fuzzy system, Sugeno’s fuzzy system and fuzzifier and defuzzifier fuzzy system. In the proposed fuzzy system, multiple inputs and outputs are used with simple fuzzy rules and membership functions to derive the output precisely. One of the main advantages of the FIS is that it considers the uncertainties and ambiguities associated with measuring trust. In particular, the main advantages are interpretation capability and the ease of encoding a priori knowledge. The projected data cluster obtained through the principal components is considered as the selected feature using PCA for fault identification and the selected feature is fed as inputs to the FIS. Based on the framed fuzzy rules and fuzzy membership functions, the FIS provides the output in the form of defuzzified numerical data which indicate the type of fault in the IM and it is called as a fuzzy classifier. Based on the current and vibration signal feature vectors, two fuzzy classifiers are modelled and each fuzzy classifier offers a classification rate and subsequently, the fuzzy integral fusion technique is used to combine the results of two fuzzy classifiers to obtain the final compromise decision. To validate the efficiency of the FIS, numerous simulation studies have been performed and they are compared using MATLAB by feeding the data derived from various experimental conditions of this study.
This present research paper mainly focuses on the early detection of faults and also diagnosing its classification of faults to limit the downtime in the industry so that, the production can be improved. Further, the Stator Current Signals and Motor Vibration Signals of the Three Phase Induction Motor are captured under three different fault conditions via experimental test conditions. PCA is used to find the sensitivity of various features of the measured current and vibration signals. For proper planning and to carry out maintenance activities in time, a frequency domain analysis has been proposed based on current, voltage and vibration data. The proposed diagnose and classification methodology has been tested with a real-time experimental study. The experimental setup mainly consists of Three Phase Induction Motor, variable frequency drive, Loading system, vibration and current sensors and NI based data acquisition system. In future, soft sensors can be used to access the process variables and the required physical quantities are to be read out as well as the performance indices can be calculated as discussed [16]. The rest of the paper has been organised as follows: the solution methodology for feature selection and fault classification is briefed in section 2 and section 3 presents the test results and observations. Sections 4 and 5 illustrate the feature selection process and fault classification process. Finally, the conclusion of this research is summarized in section 6.
Experimental setup and test results
Data acquisition system
In this work, the feature selection and fault classification of the Induction Motor are carried out through the environment of clustered data which are obtained from the experimental setup and it is described as follows. The test bench is designed as shown in Fig. 1 with the key component configuration as shown in Table 1 in a way to analyse all the parameters of three phases of IM where the test motor could be controlled and loaded for recording a set of chosen variables when operated with brake loading arrangement. A National Instrument (NI) Vibration Sensor Suite is used to measure the vibration signals on the stator frame of the motor. NI Suite consists of a Triaxial accelerometer with a sensitivity of 5–100 mV/g and NI 9234 C series DAQ card with 4-Channel, 51.2 kS/s/channel, ±5 V. The Triaxial accelerometer is mounted on the stator top surface and the PCB low noise coaxial cable is used to connect the DAQ. Finally, the DAQ is connected with the PC through the USB connector.
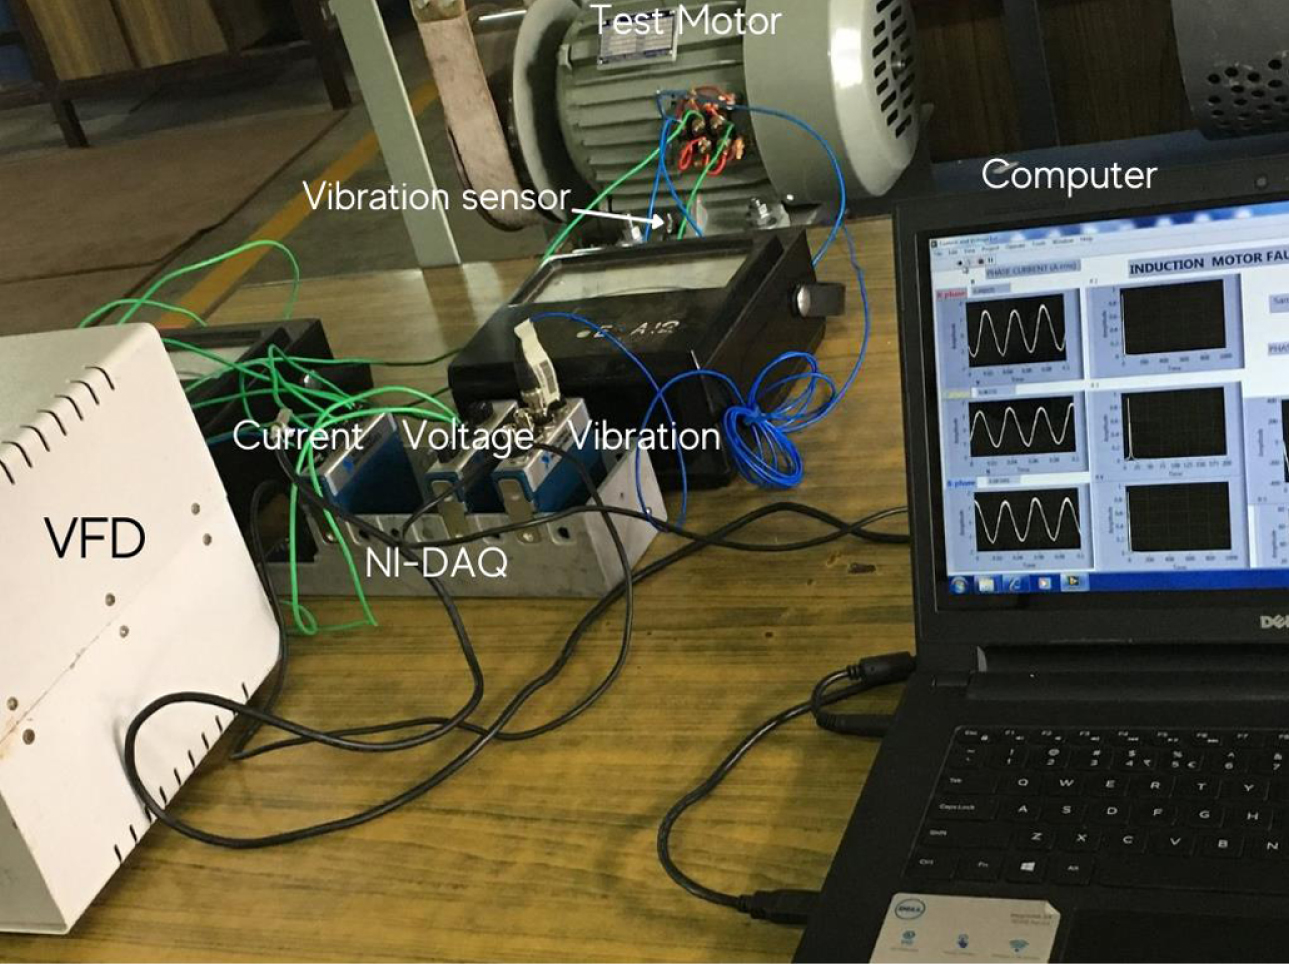
Photographic view of Experimental setup workbench.
Rating of experimental prototype model
In this research work, various data studies have been carried out in the experimental setup with the motor operating at room temperature and normal atmospheric conditions. Various data like input voltage, motor current and motor vibrations can be recorded from the experimental setup through a data acquisition system. The voltage, current and vibration measurement sensor modules are used to acquire the corresponding data samples from the machine under various operating conditions. The current modules provide the measured current signals that are initially sampled in the series time domain and the frequency domain signals are obtained by the means of an algorithm called power spectrum as well as evaluated to predict the slipup frequencies associated with faults.
Initially, numerous experiments have been carried out and various classifications of test signal measurements are made. In this process, the waveforms of current signals, voltage signals and vibration signals are obtained for a healthy machine under no load, 50% and 100% load conditions. Later, IM rotor parts are replaced with the eccentric faulty rotor and shaft bending fault rotor with air gap eccentricity. Moreover, experiments have been carried out for faulty IM with loading conditions similar to healthy motor test loading conditions and the test readings are logged for the data like input voltage, motor current and motor vibrations to analyze the operating condition of the faulty motor. The signals of current data, voltage data and vibration data logging and storing are obtained in Lab VIEW environment and the data evaluation is carried out using MATLAB.
The current and vibration signals under the time and frequency domains are acquired through the experimental setup and they are used for the fault classification mechanism in this model. The feature selection and fault classification tasks are carried out using PCA and FIS approaches in the MATLAB environment. The test data and its observations are described in the following subsections.
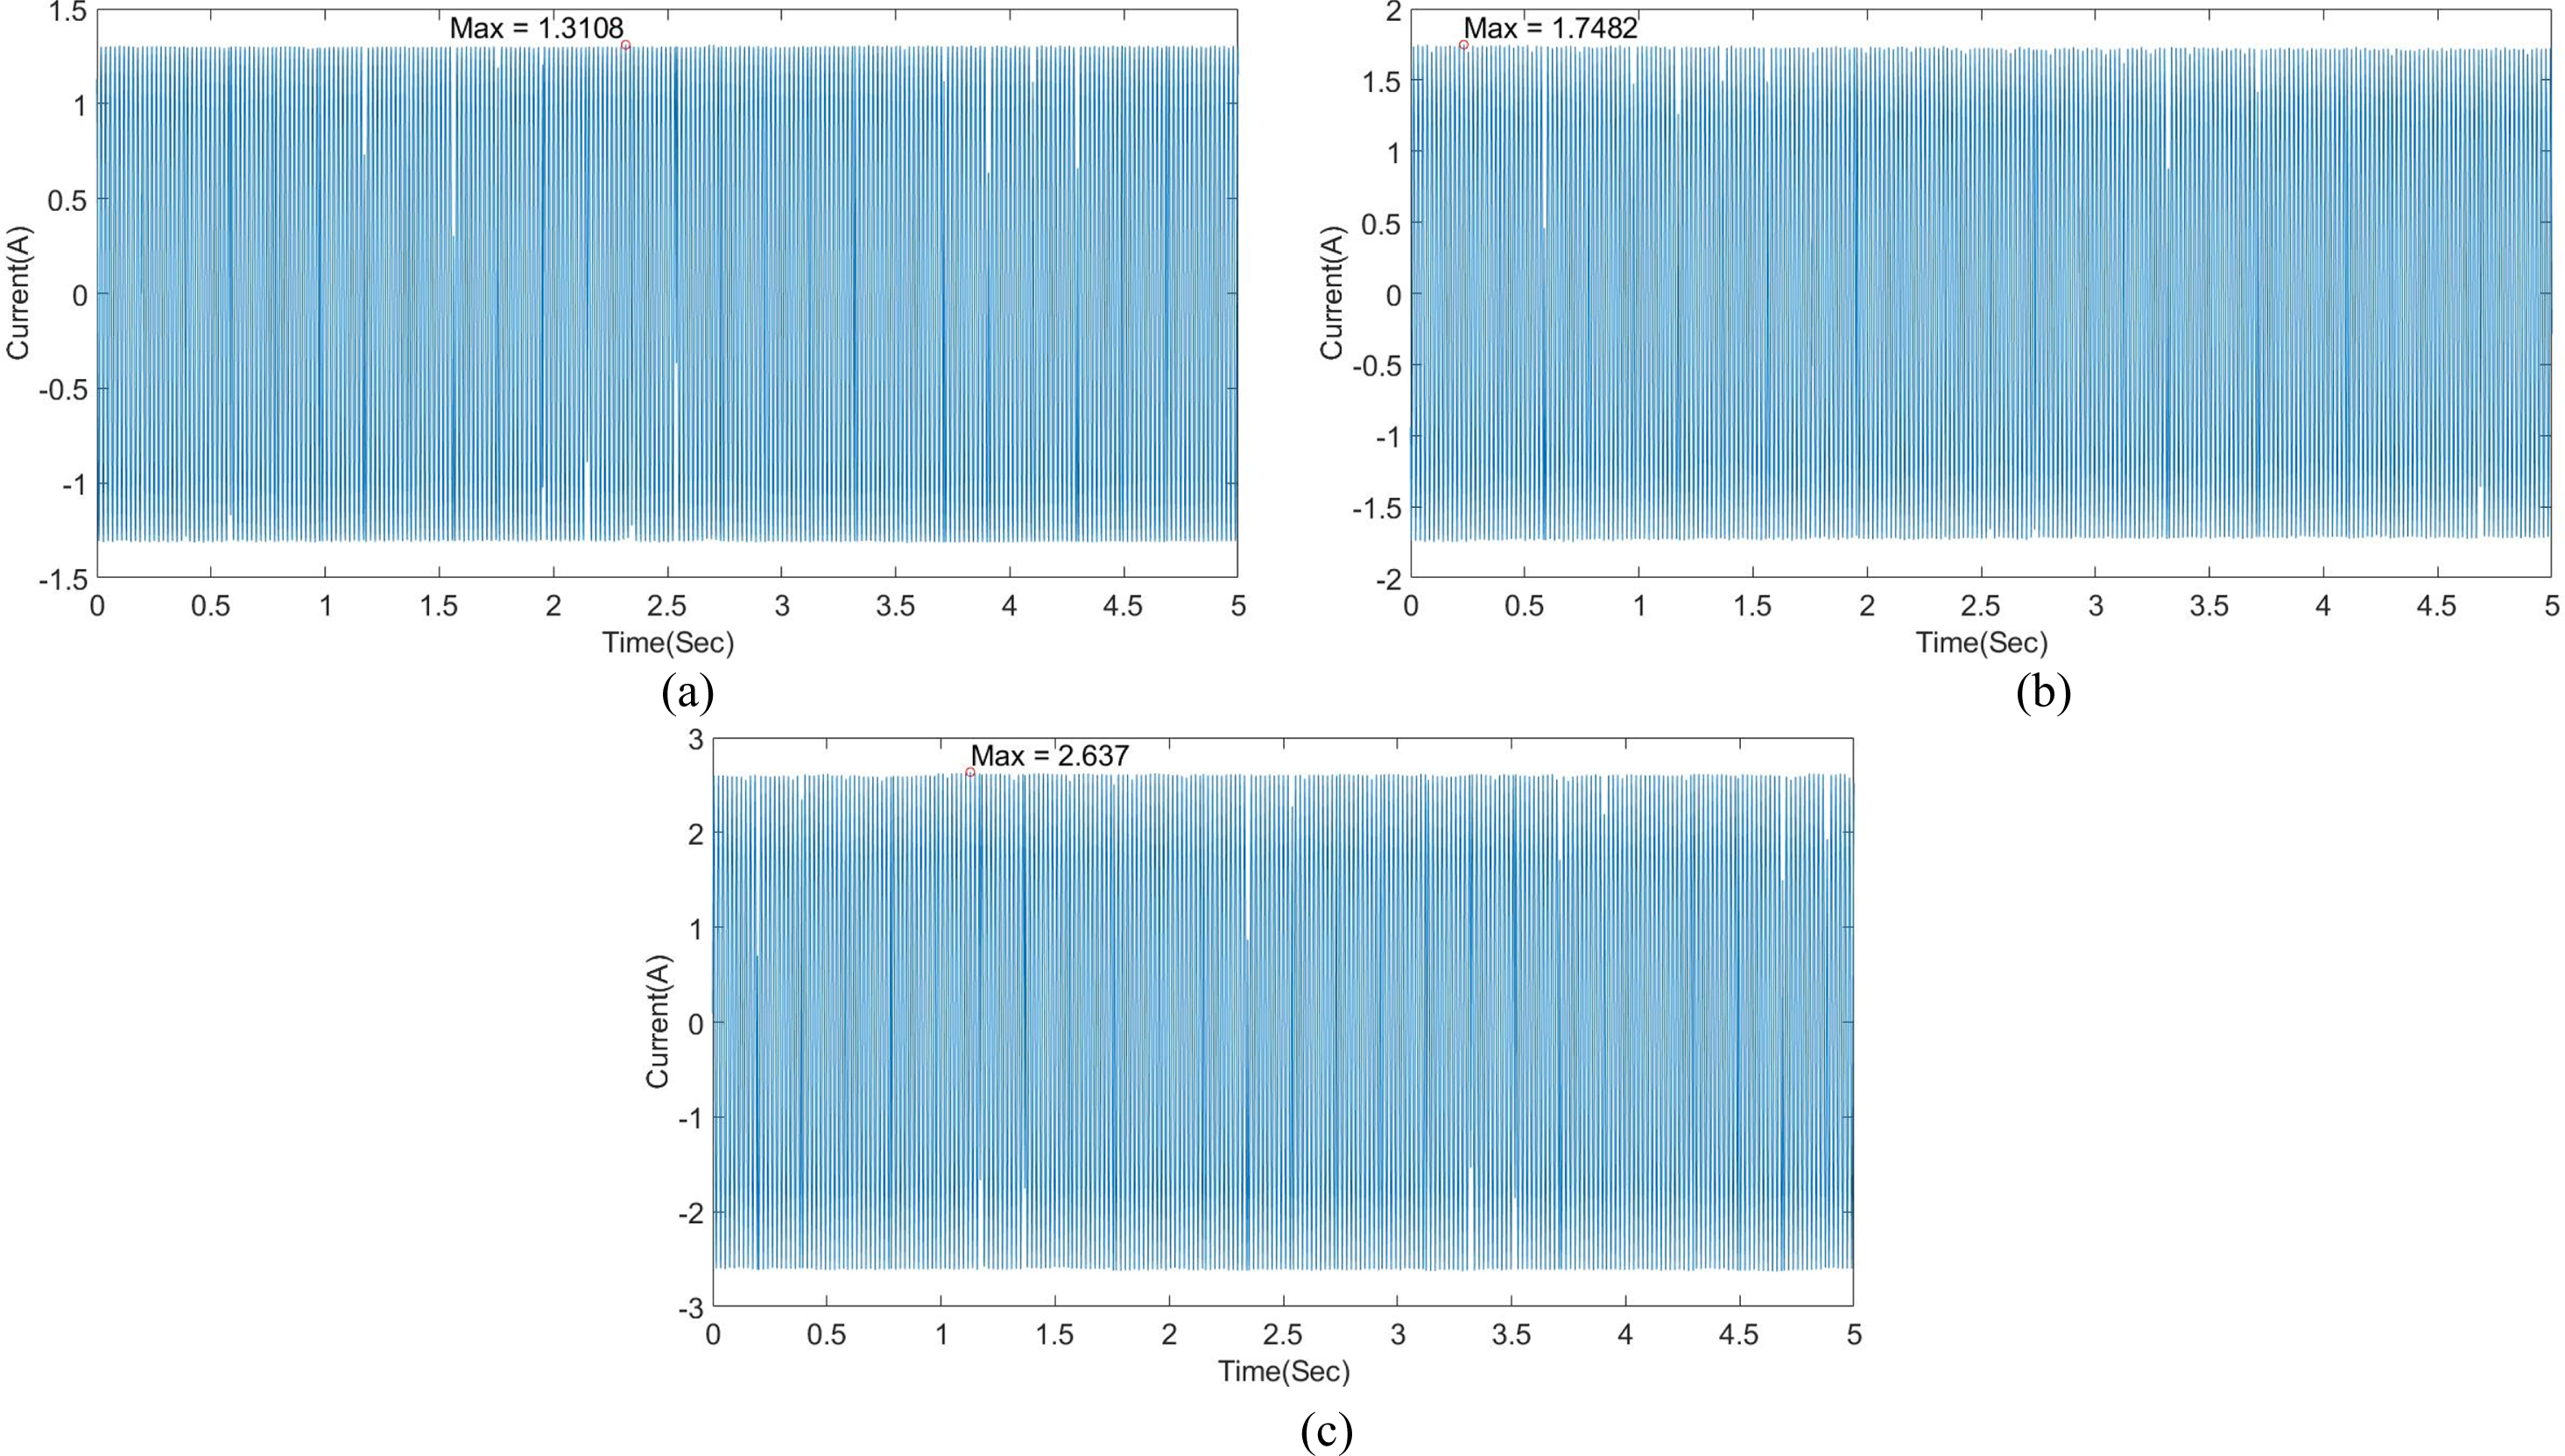
Initially, the healthy motor has been tested and the supply voltage, stator current, stator vibrations signals and thermal image of the motor in two regions of the interest are recorded under no-load and loaded conditions. The current waveform measurements of the healthy motor under No Load, 50 % Load and 100 % Load conditions are shown in Fig. 2. In this study, the signals are recorded under a frequency sample of 20 kHz and the magnitude of the waveform varies by concerning the load condition of only 0.5 sec per phase current signals. From the current waveform plot, it is observed that the waveform varies from 1A at No Load condition to 2.7A at 100% Load condition.
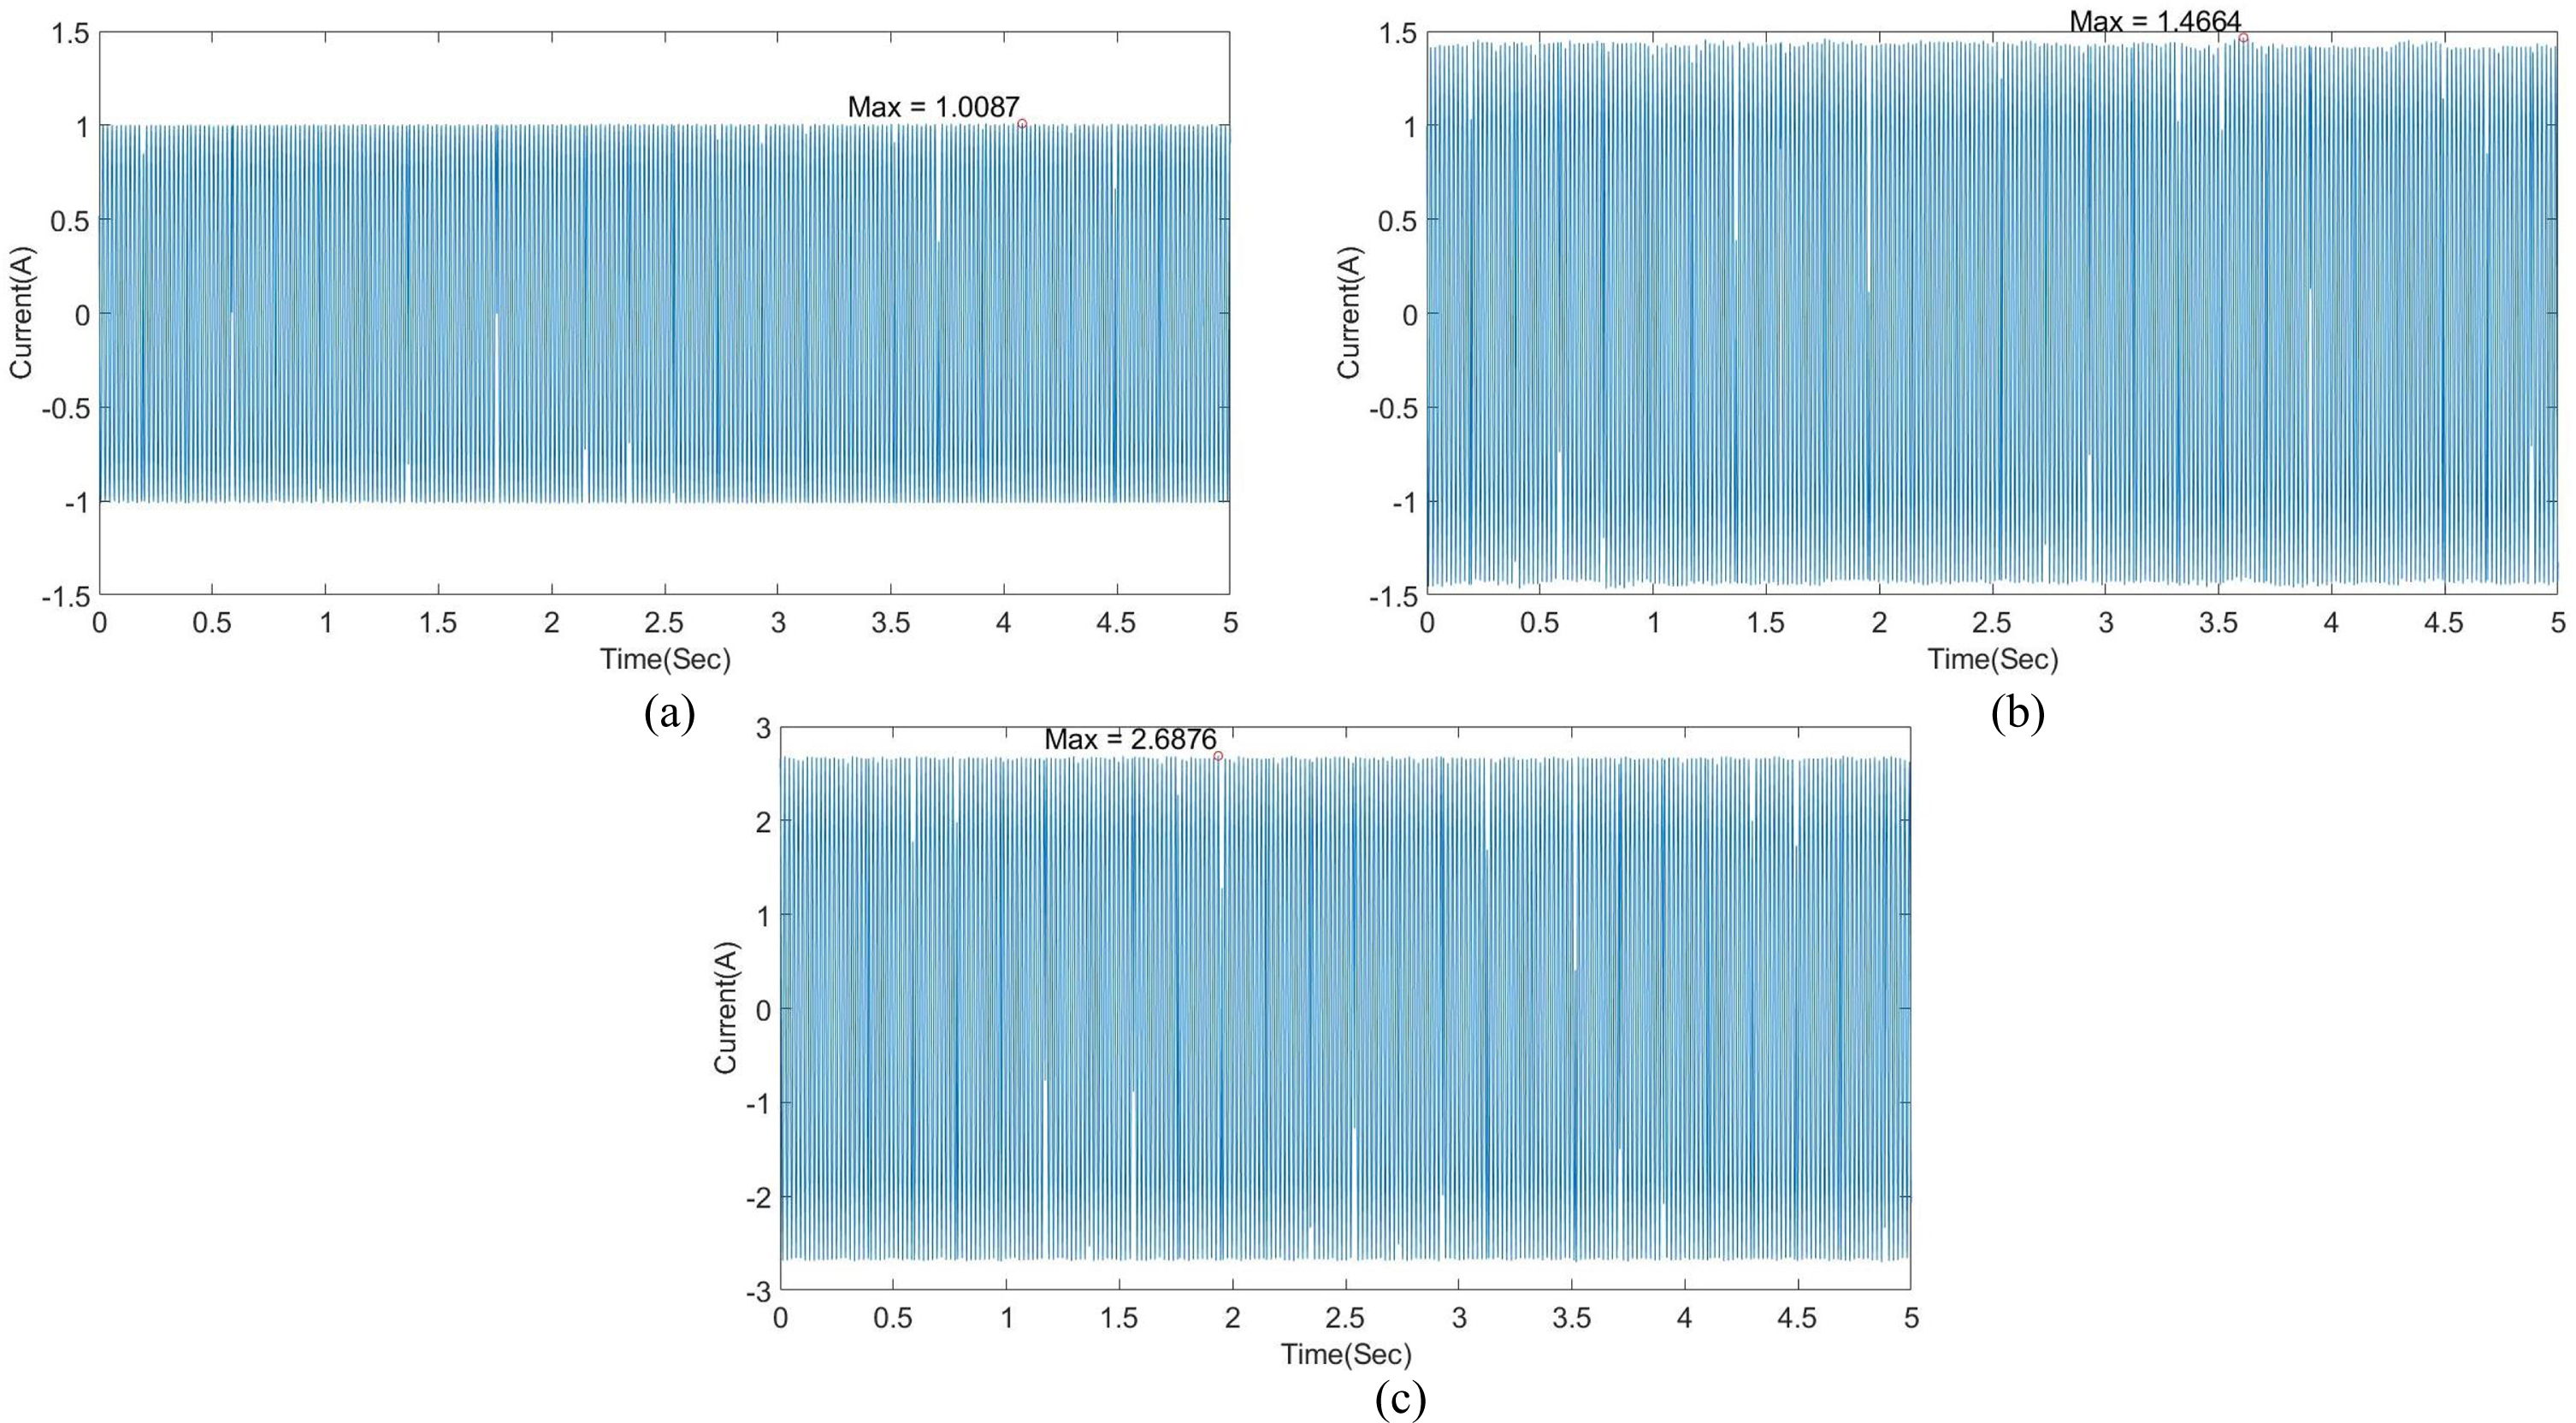
Stator current waveform measurement of the healthy motor per phase under the condition of (a) no-load (b) 50% load (c) 100 % load.
The vibration signal waveform with the magnitude (m/s2) of stator frame is measured simultaneously with stator current waveform along with the same sampling rate. Figure 3 shows the vibration signal waveform of the motor under different load conditions. An average acceleration magnitude is varied from 0.00094 m/s2 at no-load to 0.001 m/s2 at 100% load.

Stator vibrations waveform measurement of the healthy motor under the condition of (a) no-load (b) 50% load (c) 100 % load.
The measurements of the stator current waveform of the air gap eccentricity fault motor under different load conditions are shown in Fig. 4. The magnitude of the waveform varies by concerning load conditions from 1.36 A at no-load condition to 2.7 A at 100% load conditions.
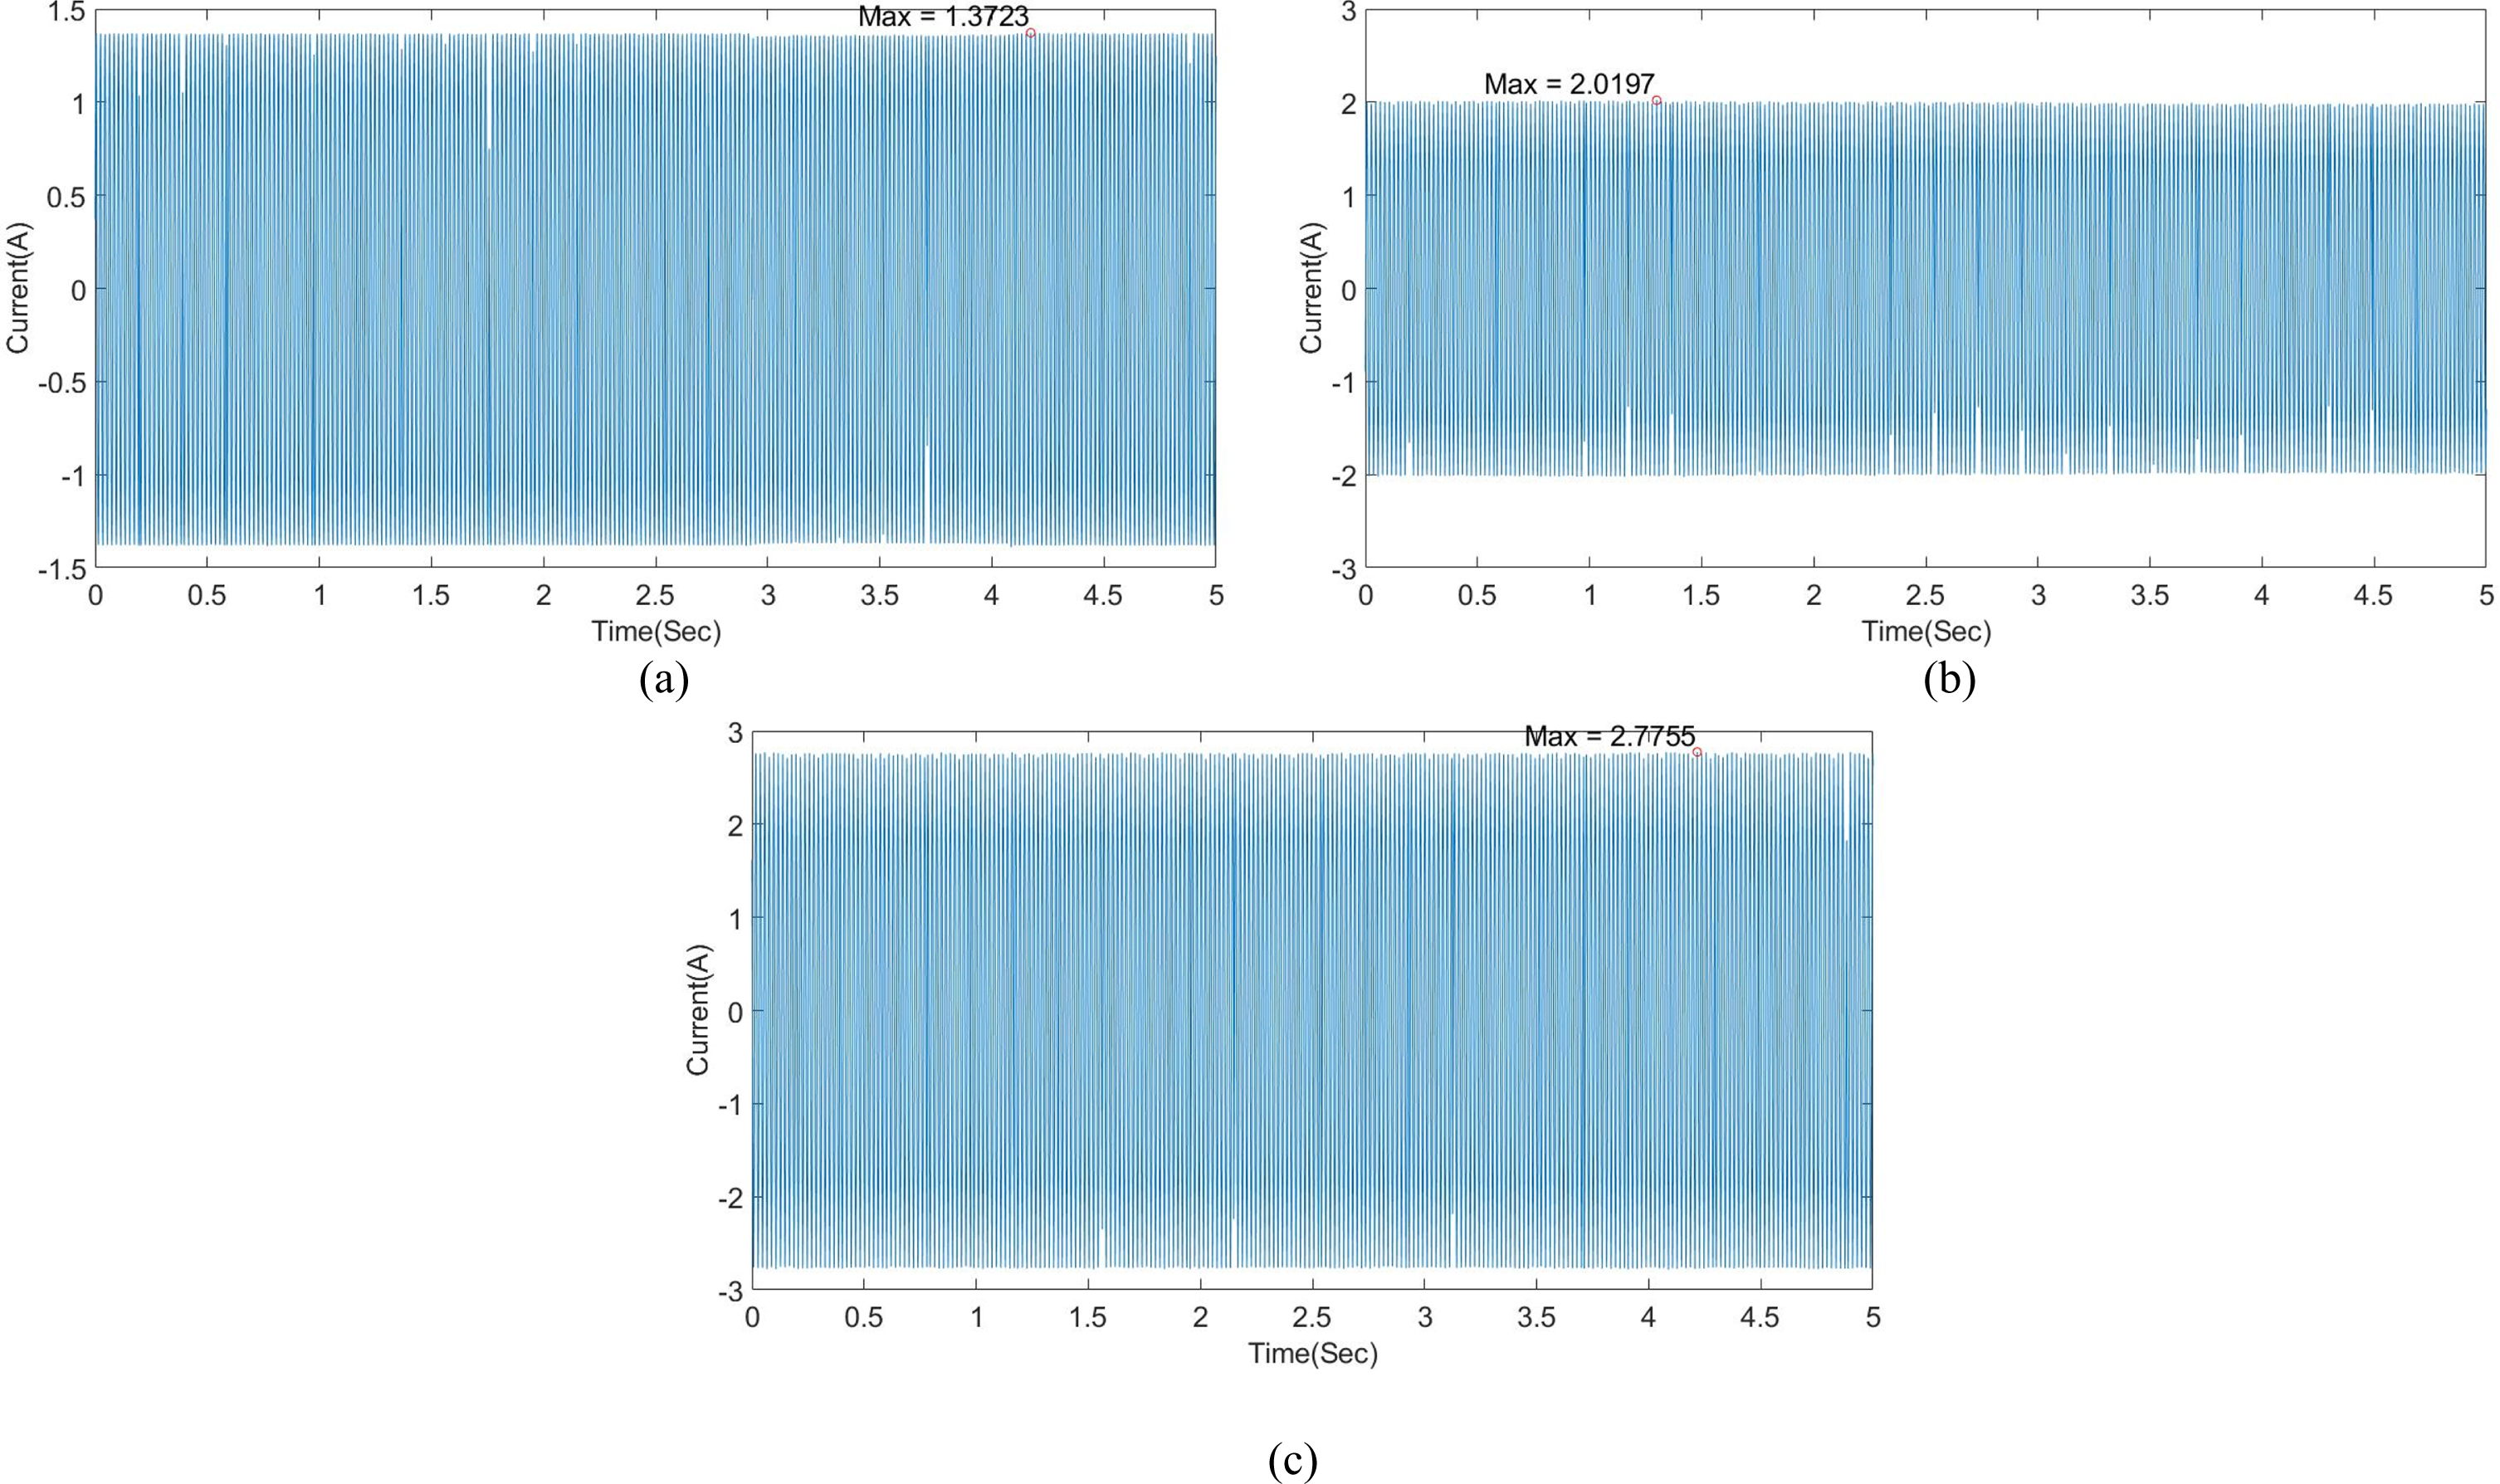
Stator current waveform measurement of the air gap eccentricity fault motor per phase under load condition of (a) no-load (b) 50% load (c) 100 % load.
Figure 5 demonstrates the vibration signal waveform with the air gap eccentricity of fault motor under different load conditions. An average acceleration magnitude varies from 0.003 m/s2 at no-load to 0.007 m/s2 at 100% load.
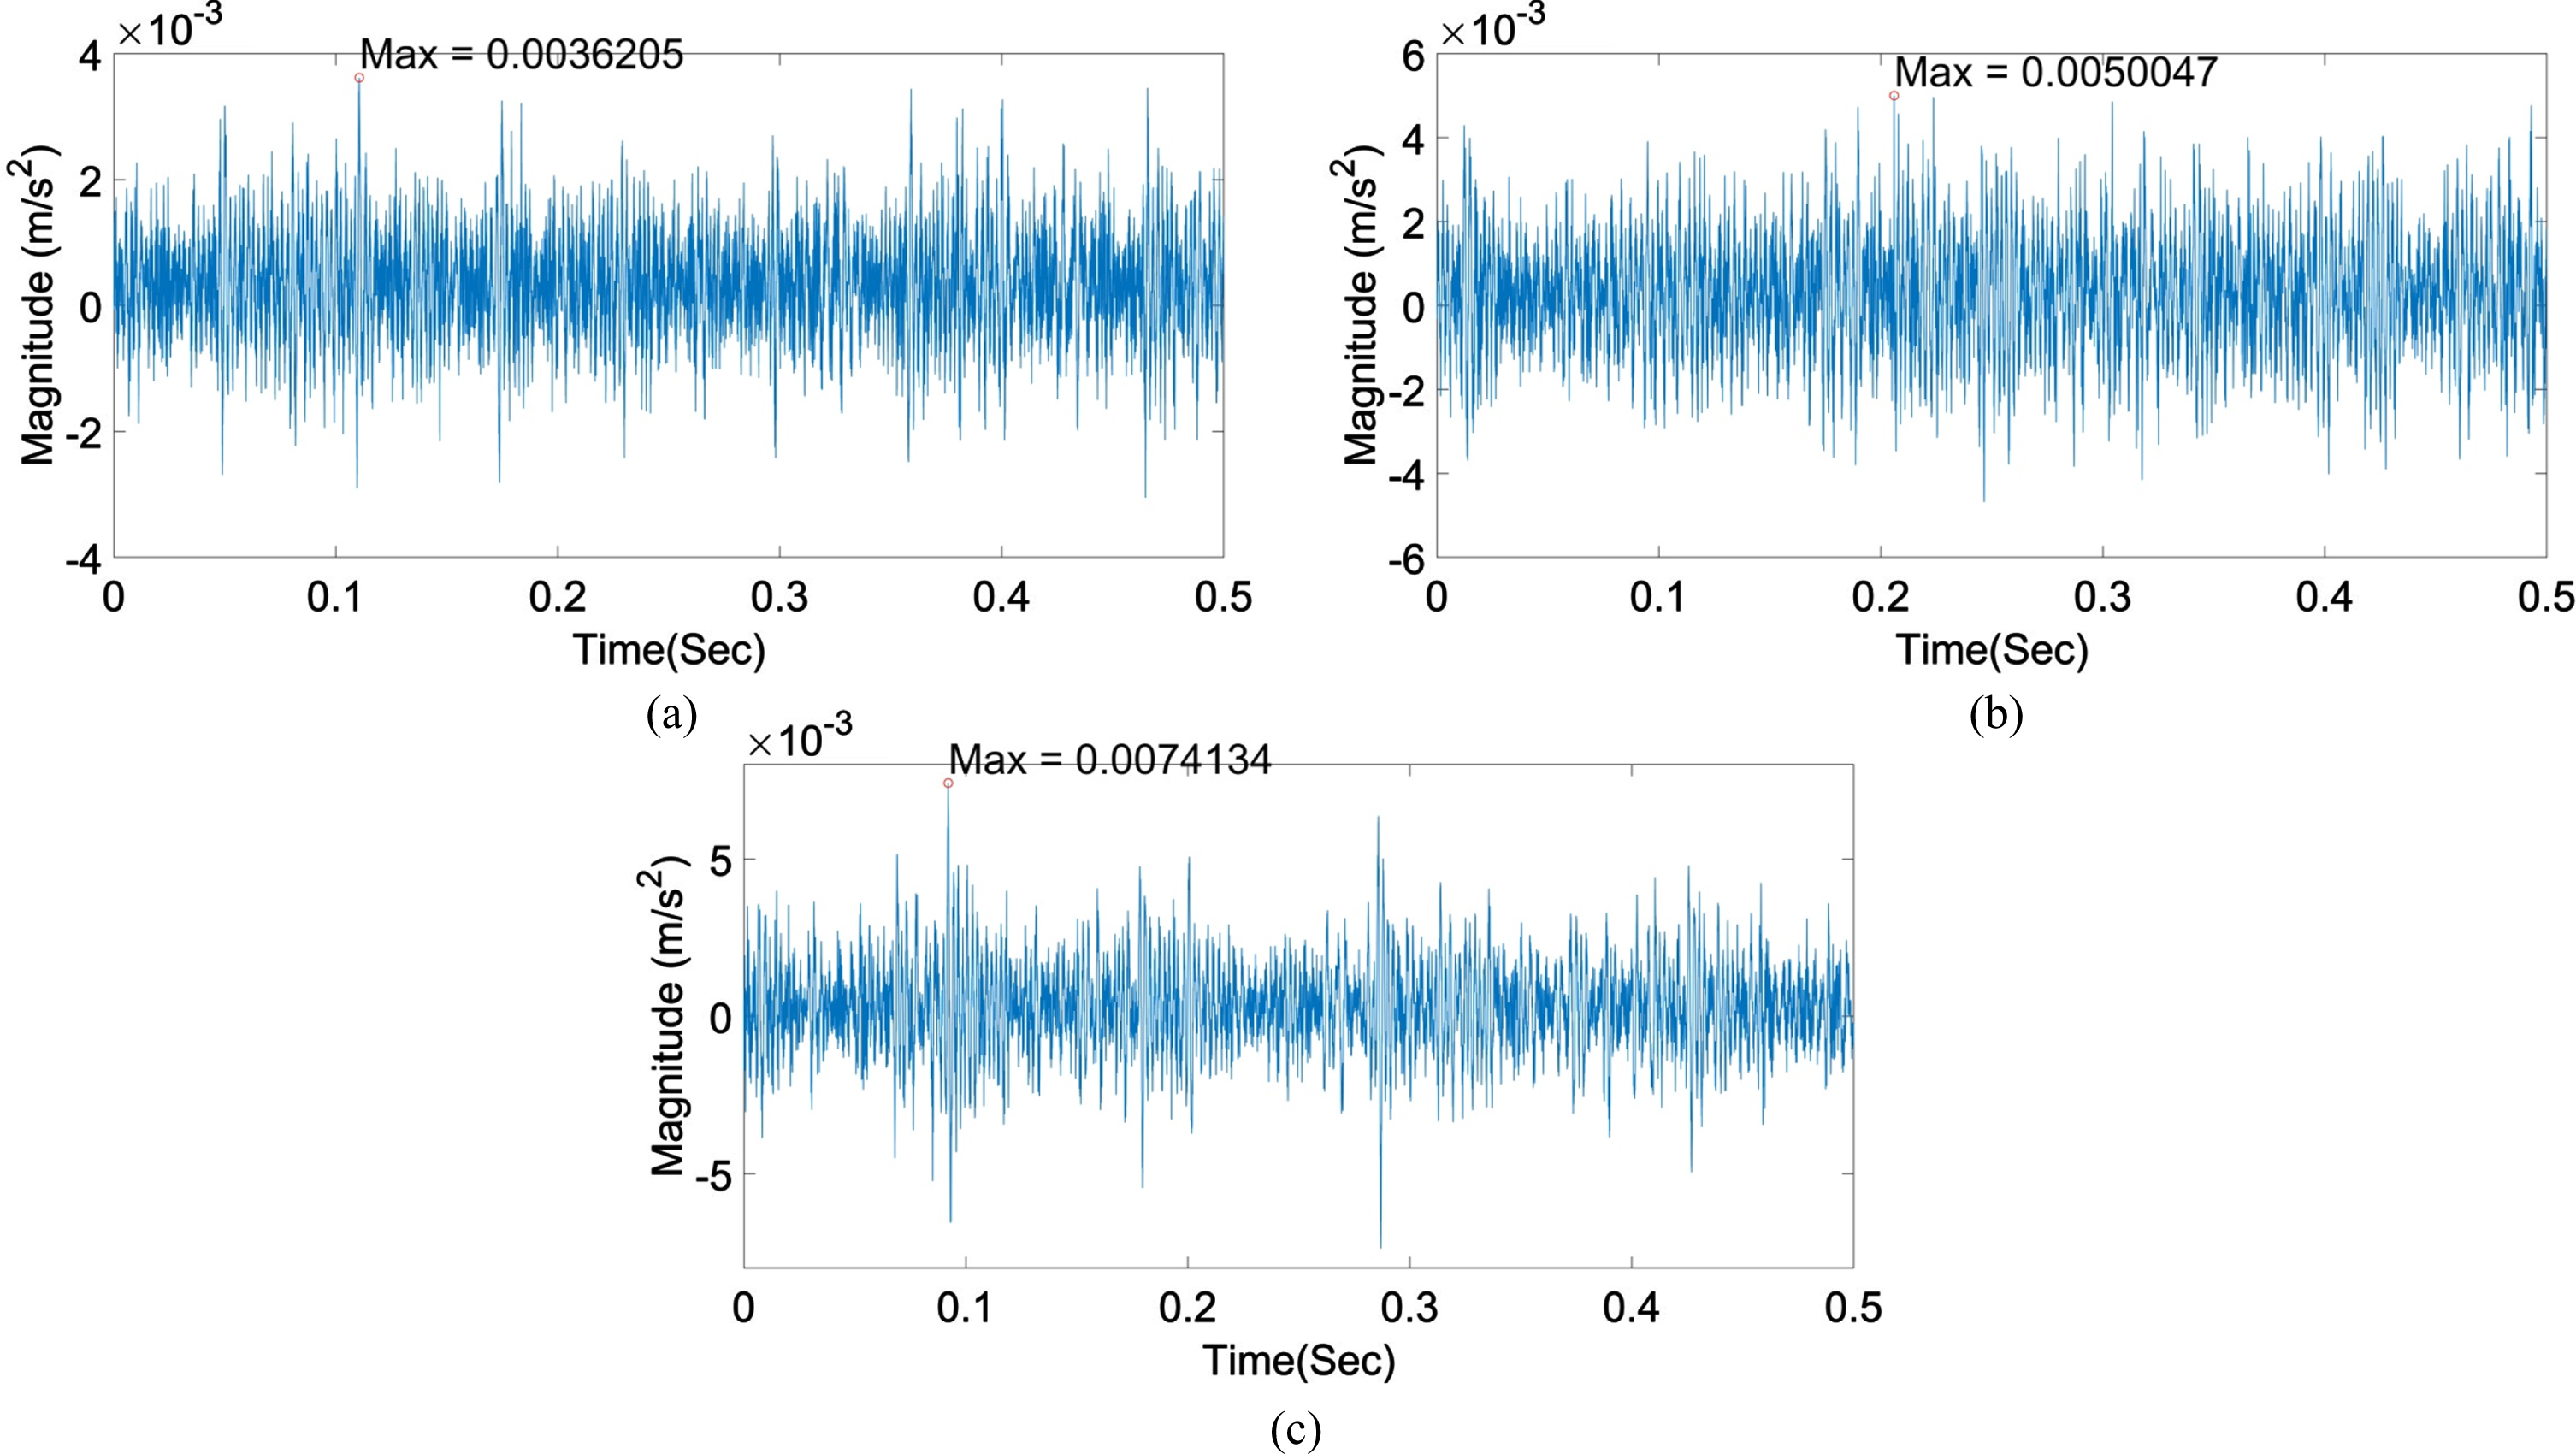
Stator vibrations waveform measurement of the air gap eccentricity fault motor under load condition of (a) no-load (b) 50% load (c) 100 % load.
The measured stator current waveforms of the shaft bending fault rotor under different load conditions are shown in Fig. 6. The magnitude of the waveform varies by concerning load conditions from 1.30 A at the no-load condition to 2.60 A at 100% load condition. The waveform gets distorted at 50% and 100% loads.
Stator current waveform measurement of the Shaft bending fault motor per phase under load condition of (a) no-load (b) 50% load (c) 100 % load.
The signal waveform measurements corresponding to the vibration of the Shaft bending fault motor under different load conditions are shown in Fig. 7. An average acceleration magnitude varies from 0.0029 m/s2 at no-load to 0.007 m/s2 at load of 100%.
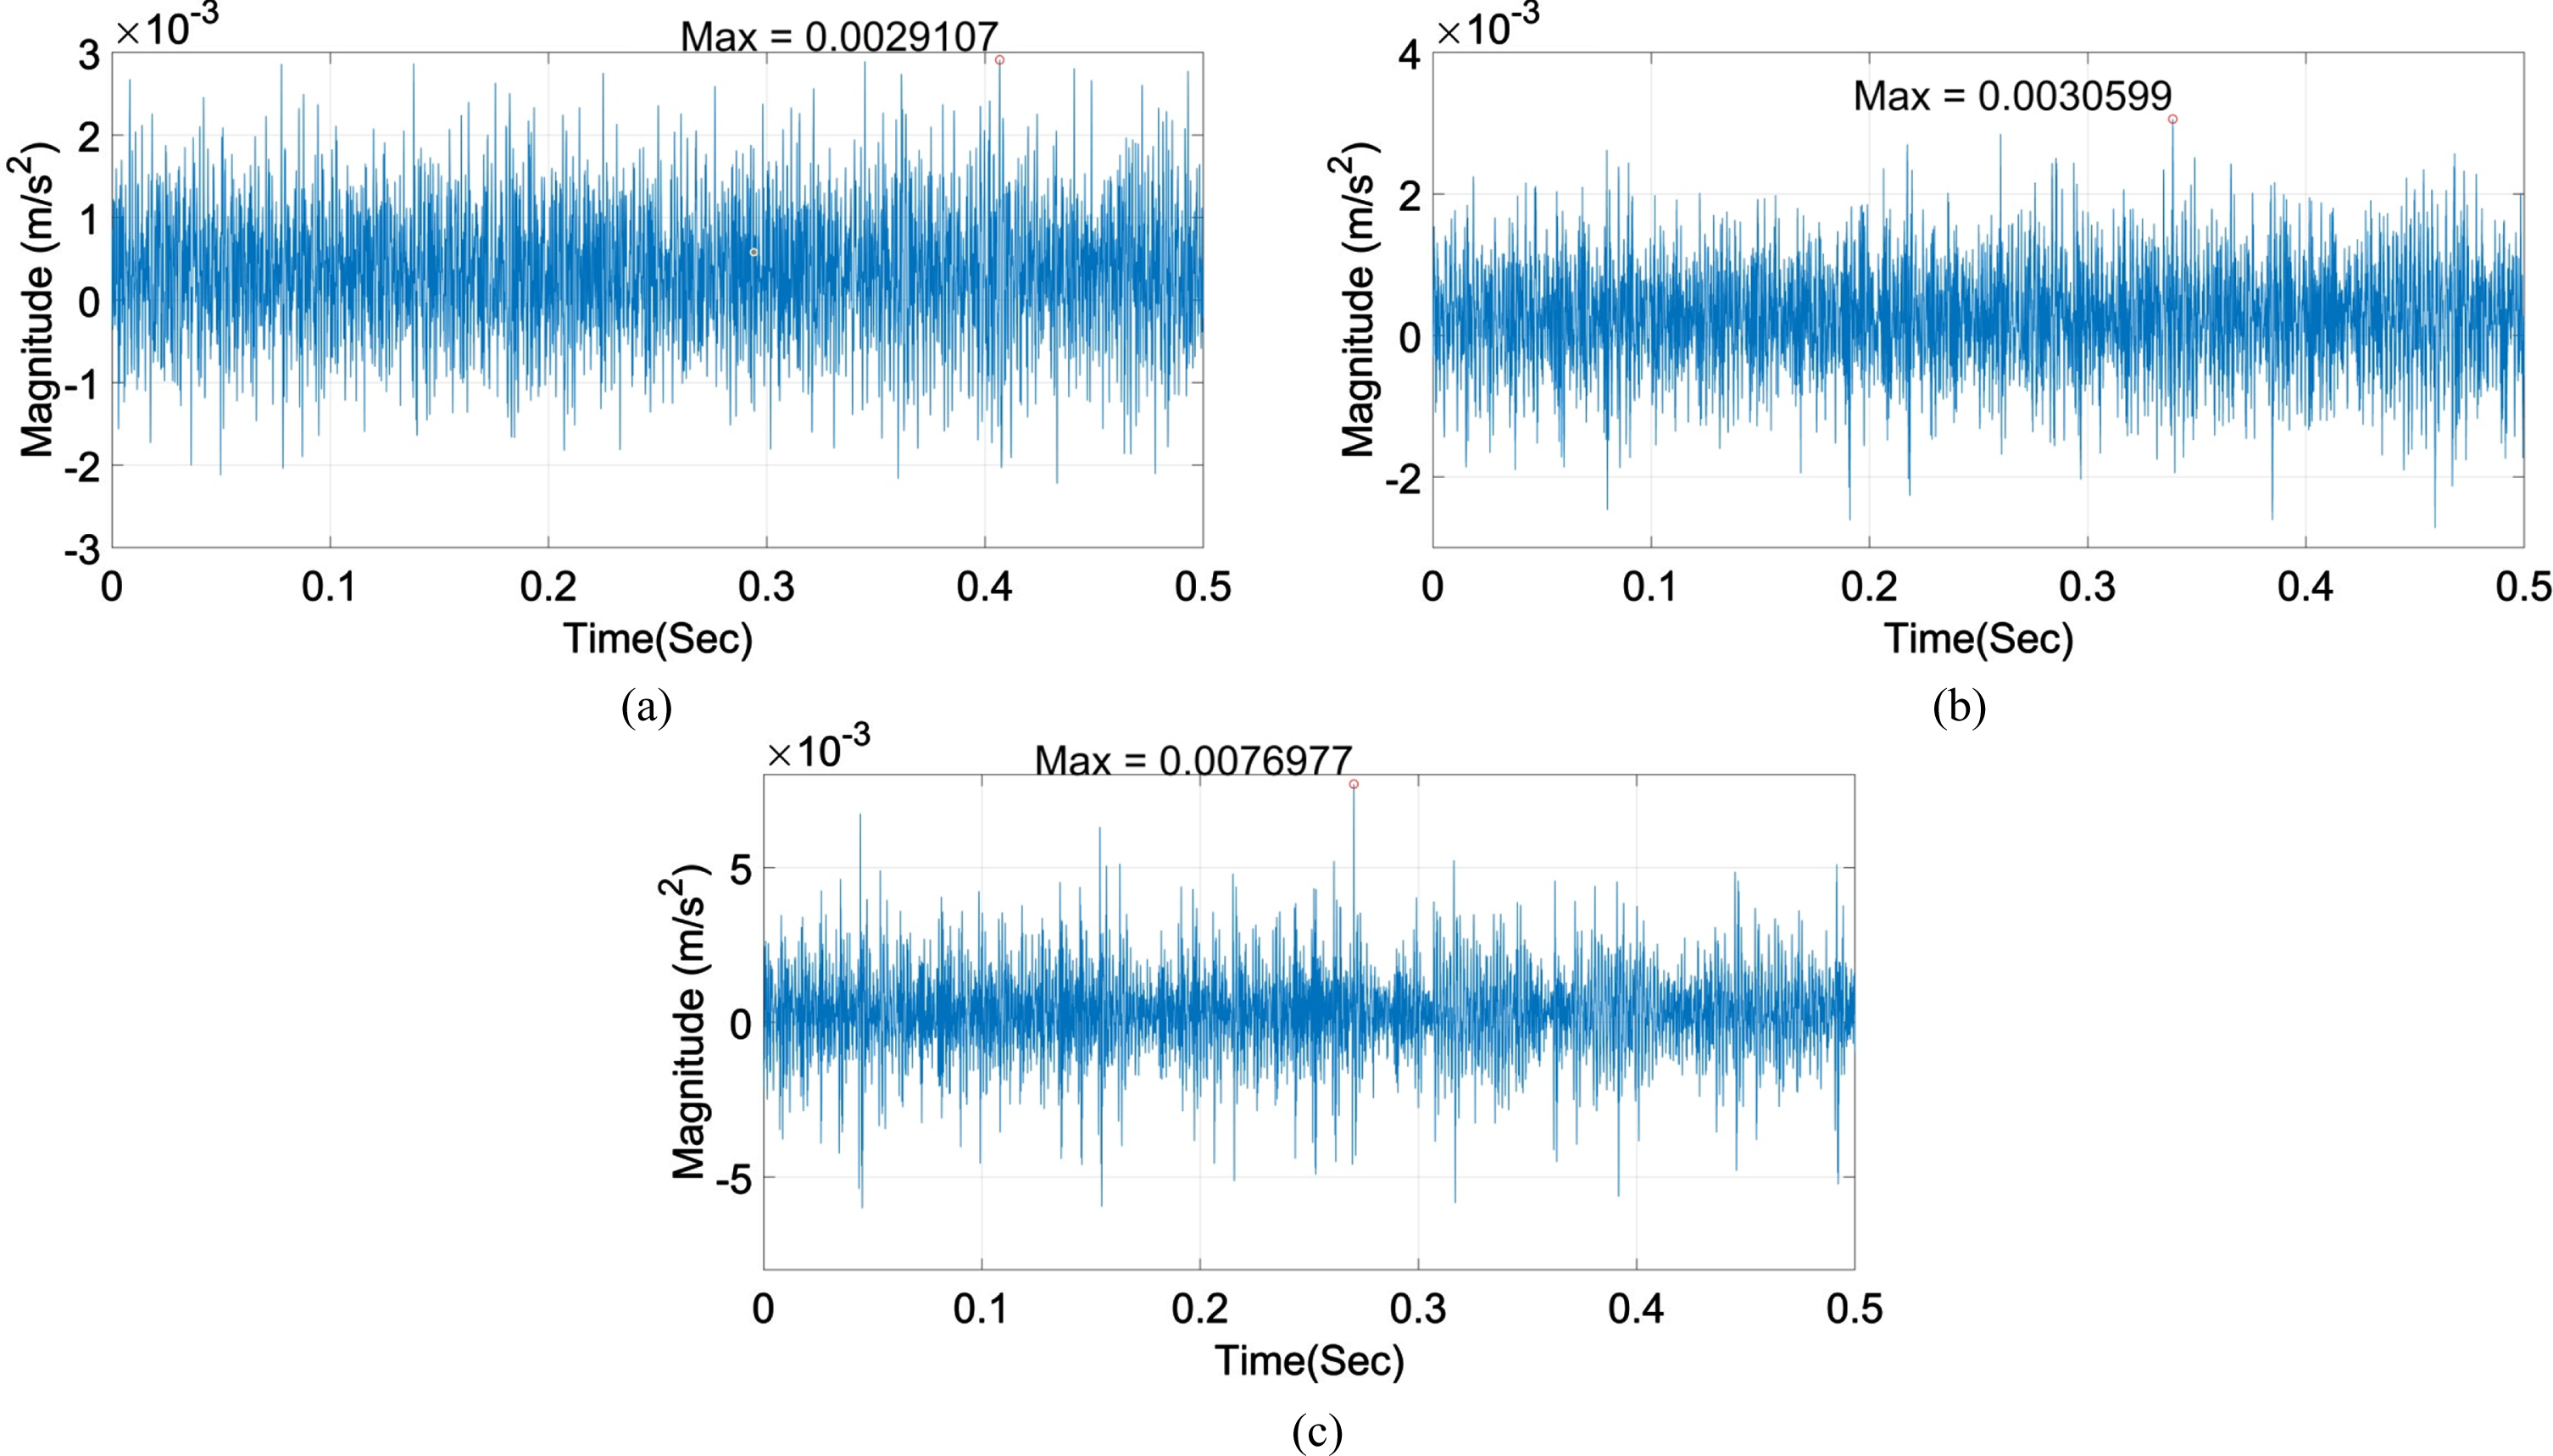
Stator vibrations waveform measurement of the Shaft bending fault motor under load condition of (a) no-load (b) 50% load (c) 100% load.
In the experimental setup of the data acquisition system of the proposed work, parametric features are required to define the characteristics of the data population in order to obtain information from the entire data. The statistical parametric features are used to derive the information using the sample data which are represented from the whole data population. Various features have been used by many researchers in time domain and frequency domain analyses of current and vibration signals which are majorly based on time series. In this study, six parametric features are used in time domain analysis and frequency domain analysis and they are described as follows.
Time domain features
In time-domain feature analysis of current and vibration signals, mean, max, standard deviation, root mean square, kurtosis and crest factor are used as statistical parametric features in this research work. In these features, the minimum and the maximum values of current signals are generally used as parameters for the classification of healthy and faulty motors. Standard deviation (Std) is obtained through square root of the variance parameter and it is used to measure the number of clusters in signal waves. The root mean square (RMS) value is a simple and most general parameter index to measure the overall intensity of a signal and it provides information about the average effect for minimizing any spike in the measured signals. The Kurtosis (Ku) value gives information about the peaks that appear in the measured signals. A Ku value above three indicates a Gaussian distribution peak. If Ku value is greater than 3, then it indicates that relatively sharp peaks are presented in the signals. Crest Factor (CF) provides the information of substantial variations in the signal waveform spread. The following equations are used to calculate the described features.
Mean value of the signal:
Standard deviation of the signal:
Root mean square of the time signal:
Kurtosis value of the signal:
Crest Factor is expressed as:
Where,
n = Number of sample data of signal
x i = amplitude of ith sample data
Discrete Wavelet Transform (DWT) as a powerful tool to study the non-stationary and transient waves has been discussed [17]. DWT has been directed to the advancement of tools to evaluate, extract, and compress various power quality disturbances [18, 19]. Generally, much computational effort is encompassed in the calculation process of wavelet frequencies in signal waves [20]. To avoid this difficulty, the discrete signals are decomposed into series of low pass frequency band (LPF) and high pass frequency band (HPF) using DWT. In the decomposition process, to get the information of LPF and HPF mathematically, the following formulas are used.
The LPF and HPF information can be obtained through the approximation A and D as
Dividing the signal into position and scale copies of a single function in DWT is called initial or mother wavelet and it can be expressed as
In this study, Multi Resolution Signal Decomposition (MRSD) is initially used to derive two main properties in two steps (i) the time-based property, which can be used to spot any change in a characteristic and (ii) the energy of the signals is split into different frequency bands during the time of the disruption, and this will appear as high coefficients. In this work, the current and vibration signals are decomposed into seven levels [21] of detailed components namely D1, D2, D3, D4, D5, D6 and D7 and their respective frequency bands are shown in Table 2. To classify the transient energy existing in the current and vibration signals at the dispersed level of components from D1 to D7, the parametric feature standard deviation (STD-MRA) can be considered, and the values are calculated with zero mean using the equation (equ. 9) for all the detailed components, as a measure of the energy present in the signal with zero mean.
Frequency band of DWT detailed components of signals
where,
d n (j) = Detailed component level
μ n = mean of the vector d n
N n = length of the vector d n
In the calculation of DWT, component D6 is considered as a fundamental component in this work. Further, distortion ratio higher-order frequency (DRHOF) and distortion ratio lower-order frequency (DRLOF) have been computed to understand the leakage of current signals in high frequency distortions. The detailed components D3, D4, and D5 are considered as high frequency components whereas D5, D6, and D7 are considered as low frequency components. The DRHOF is computed using the ratio of STD-MRA values of higher-order frequency components for the fundamental component and DRLOF is computed using the ratio of STD-MRA values of lower-order frequency components for the fundamental component.
PCA technique has been applied by many researchers in this field for better fault classification performance. This technique for the analysis of current and vibration singles in the time domain features and a combined two-stage Bayesian system and PCA has been proposed for diagnosing mechanical and electrical faults in IM using sensor fusion methodology [22, 23]. PCA has been introduced in this research with the objective of linearly transfer the normally correlated current and vibration signal original variables into a new set of variables without changes in its characterised information. It means that the PCA technique is used in such a way that, the ′n × m′ dimensional data space of current and vibration signals in time and frequency domains characterized by the statistical parametric features is reduced to lower-order of ′u × v′ dimensional data space with the reduced number of statistical parametric features without affecting highly influenced information of the ′n × m′ original dimensional space. The PCA technique can be solved through the covariance method or singular value decomposition (SVD) method and the detailed steps of the covariance method are described as follows.
Algorithm: PC calculation using the covariance method
Step 1: Construction of signal matrix (X
T
), where the column represents the number of features and the feature’s samples acquired from different experimental conditions are represented in a number of rows to establish the ′n × m′ dimensional space.
n→ experimental condition in rows
m→ features in columns.
Step 2: Calculate the mean μ of all samples under each feature as follows.
i = 1 to n; j = 1 to m
Step 3: Form the normalization matrix E by subtracting the signal sample data in matrix X by the corresponding column mean value.
Step 4: The covariance matrix C
jj
can be computed using the equation (13),
Step 5: Computation of Eigen value λ
j
and Eigen vectors V
jj
of the covariance matrix C
jj
using the equation (14)
Step 6: Sorting the Eigen values in descending order from the matrix which is used to represent the principal components in the order of PC1, PC2, PCm since it has the most significant energy values in descending order in the signal data cluster and choosing the Eigen vector corresponding to Eigen value order which is used to represent the directional vectors of the principal components.
Step 7: Required number of principal components and its directional vector matrix Z are considered to dimensionally reduce the original signal matrix X to the lower order of matrix Y without losing its information by projecting the normalised matrix E on the selected directional vector matrix Z using equation (15)
Step 8: Identification of significant feature provides the maximum information of data cluster and this process is carried out through plotting the PC1 vectors against the PC2 vector in 2D plot and plotting PC1, PC2 and PC3 vectors in 3D plot. The directional vector has the maximum vector line propagation in each quadrant and it is perpendicular to each other as well as considered as a significant feature for the model.
The fault classification has been carried out by building of FIS with a set of fuzzy rules and membership functions. As discussed earlier, the analysis of fault using the current and vibration data in the time domain and frequency domain and its projected data space using the selected feature as principal components in PCA originate the fuzzy environment to distinguish the faults from each other. The FIS has been developed to handle the fuzzy nature of data structure with multiple inputs and outputs schemes with rules which are formed and extricated from the training data. In this approach, the classification process is majorly based on the significant feature selected from PCA. The features selected for fault identification are termed as μ and ku for time domain analysis and HoF and HoL for frequency domain analysis. The data set derived from the projected data set is developed by projecting the principal component vector on the original data dimensional space and it comprises the conflict range of data in terms of features as well as it is difficult to classify the faults in a deterministic way. Hence, this approach presents the FIS (Fig. 8), where the crisp quantities of input in terms μ and ku for time domain analysis and HoF and HoL for frequency domain are fed into fuzzification interference unit which converts the crisp unit of data into the fuzzy data based on the membership function created. Further, it is processed through the decision-making unit which comprises fuzzy rules for the development of precise fuzzy output. Later, the defuzzification unit converts the fuzzy output quantities into crisp output. The feature set is selected based on the PCA and it is comprised as set of 1 based on the current signal features and set 2 based on the vibration signal features. The following procedures have been adopted to develop the FIS for this model.
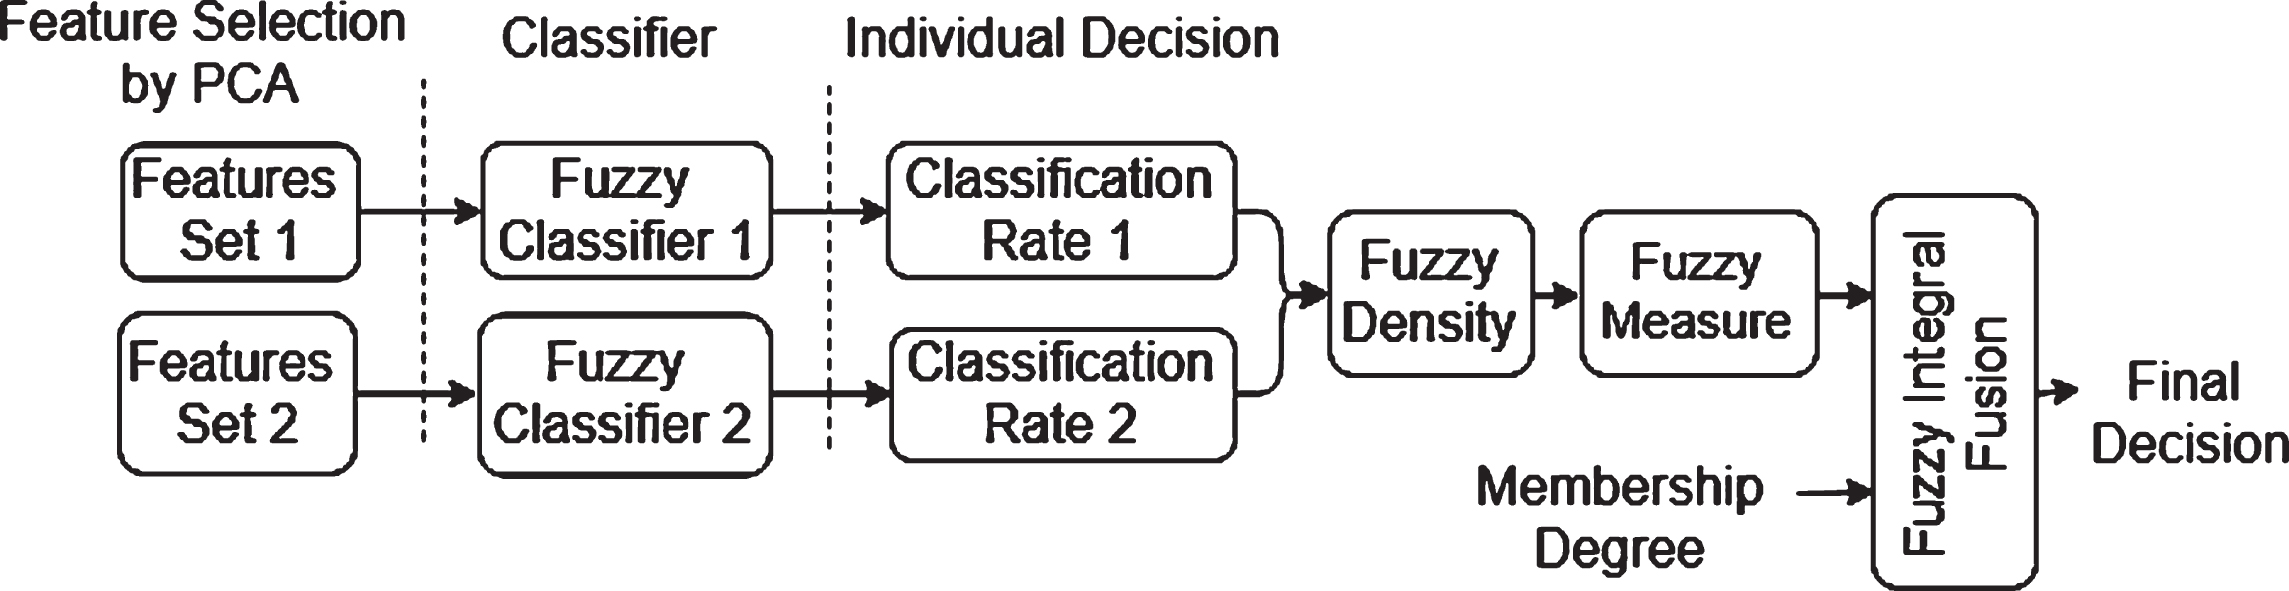
Fuzzy information system for fault diagnosis.
Primarily, the conflicted training data sets belonging to μ and ku for time domain and HoF and HoL for frequency domain are analysed and Triangular membership functions are developed asμ-high; μ -medium; μ -low; ku-high; ku-medium; ku-low; HoF-high; HoF-medium; HoF-low; HoL-high; HoL-medium and HoL-low. This triangular membership function is used to make the input into fuzzy. Secondly, the fuzzy rules are framed based on the membership function combination and using conditional functions. Finally, the output triangular membership functions are framed to derive the precise output to identify the fault. The defuzzied unit converts the fuzzy output into the crisp output which exemplifies the type of fault in the model. g λ fuzzy measures are used to measure the strength of each fuzzy classifier and sugeno fuzzy integral is used for combining the individual fuzzy classifier initial decision.
As discussed in the earlier section, the dimensional space of the acquired data is reduced without losing its significant information by introducing the PCA method. By applying the PCA methodology on the acquired experimental data of current and vibration signals and extracting the significant feature in the time domain and frequency domain provide notable input for better fault classification using FIS and it is described in the following sections.
The measured stator current and vibration signals are stored in the PC through a data acquisition system and their time domain statistical features (mean, max, std, rms, ku and CF) and vibration domain statistical features (D1, D2, D3, D4, D5, D6. D7,DRHOF and DRHOL) are computed using the M-File program which has been written in MATLAB. The computed values of the current and vibration signals by concerning the features are tabulated in Tables 3 and 4 for the healthy, air gap eccentricity fault (F1) and shaft bending fault (F2), respectively and its comparative analyses are presented in Figs. 9 and 10, respectively. The maximum stator current values provide different profile indexes for different types of fault conditions. Though these features can diagnosis the faults, due to its non-deterministic nature, they cannot classify the types of faults with a minimum deviation of the parameters. Consequently, the PCA methodology has been implemented to derive significant fault of the system.
Computed time domain features of the current signals
Computed time domain features of the current signals
Computed frequency domain features of the current signals
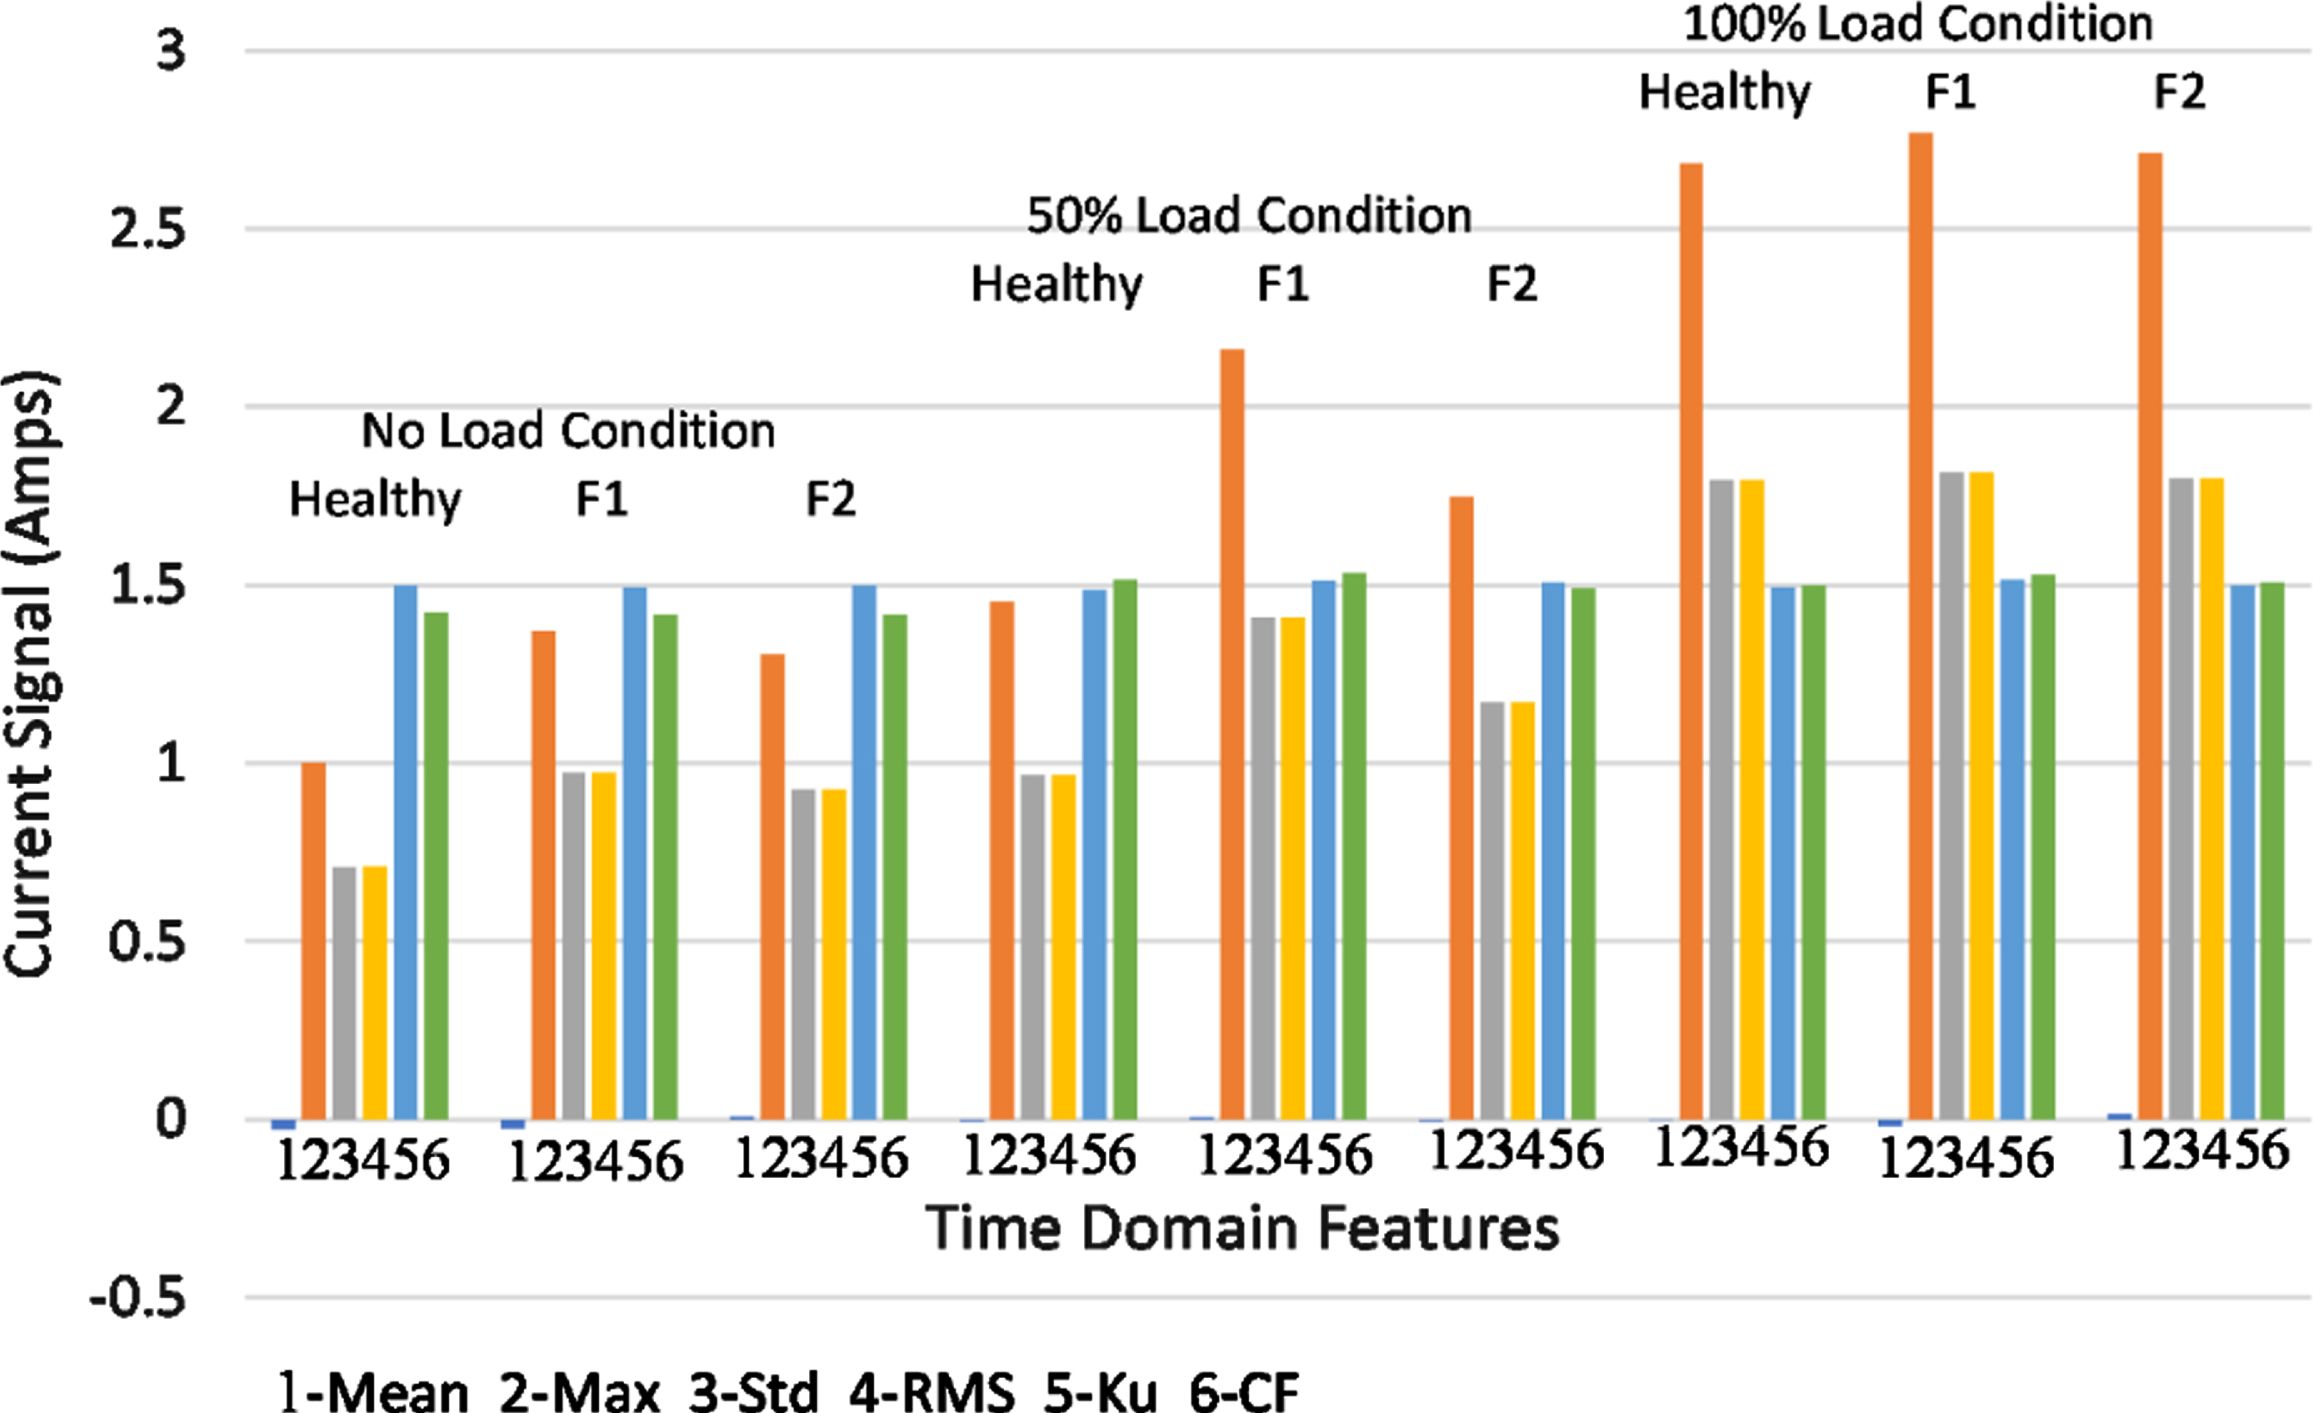
Comparison of the time domain Features of the current signals under different fault conditions.
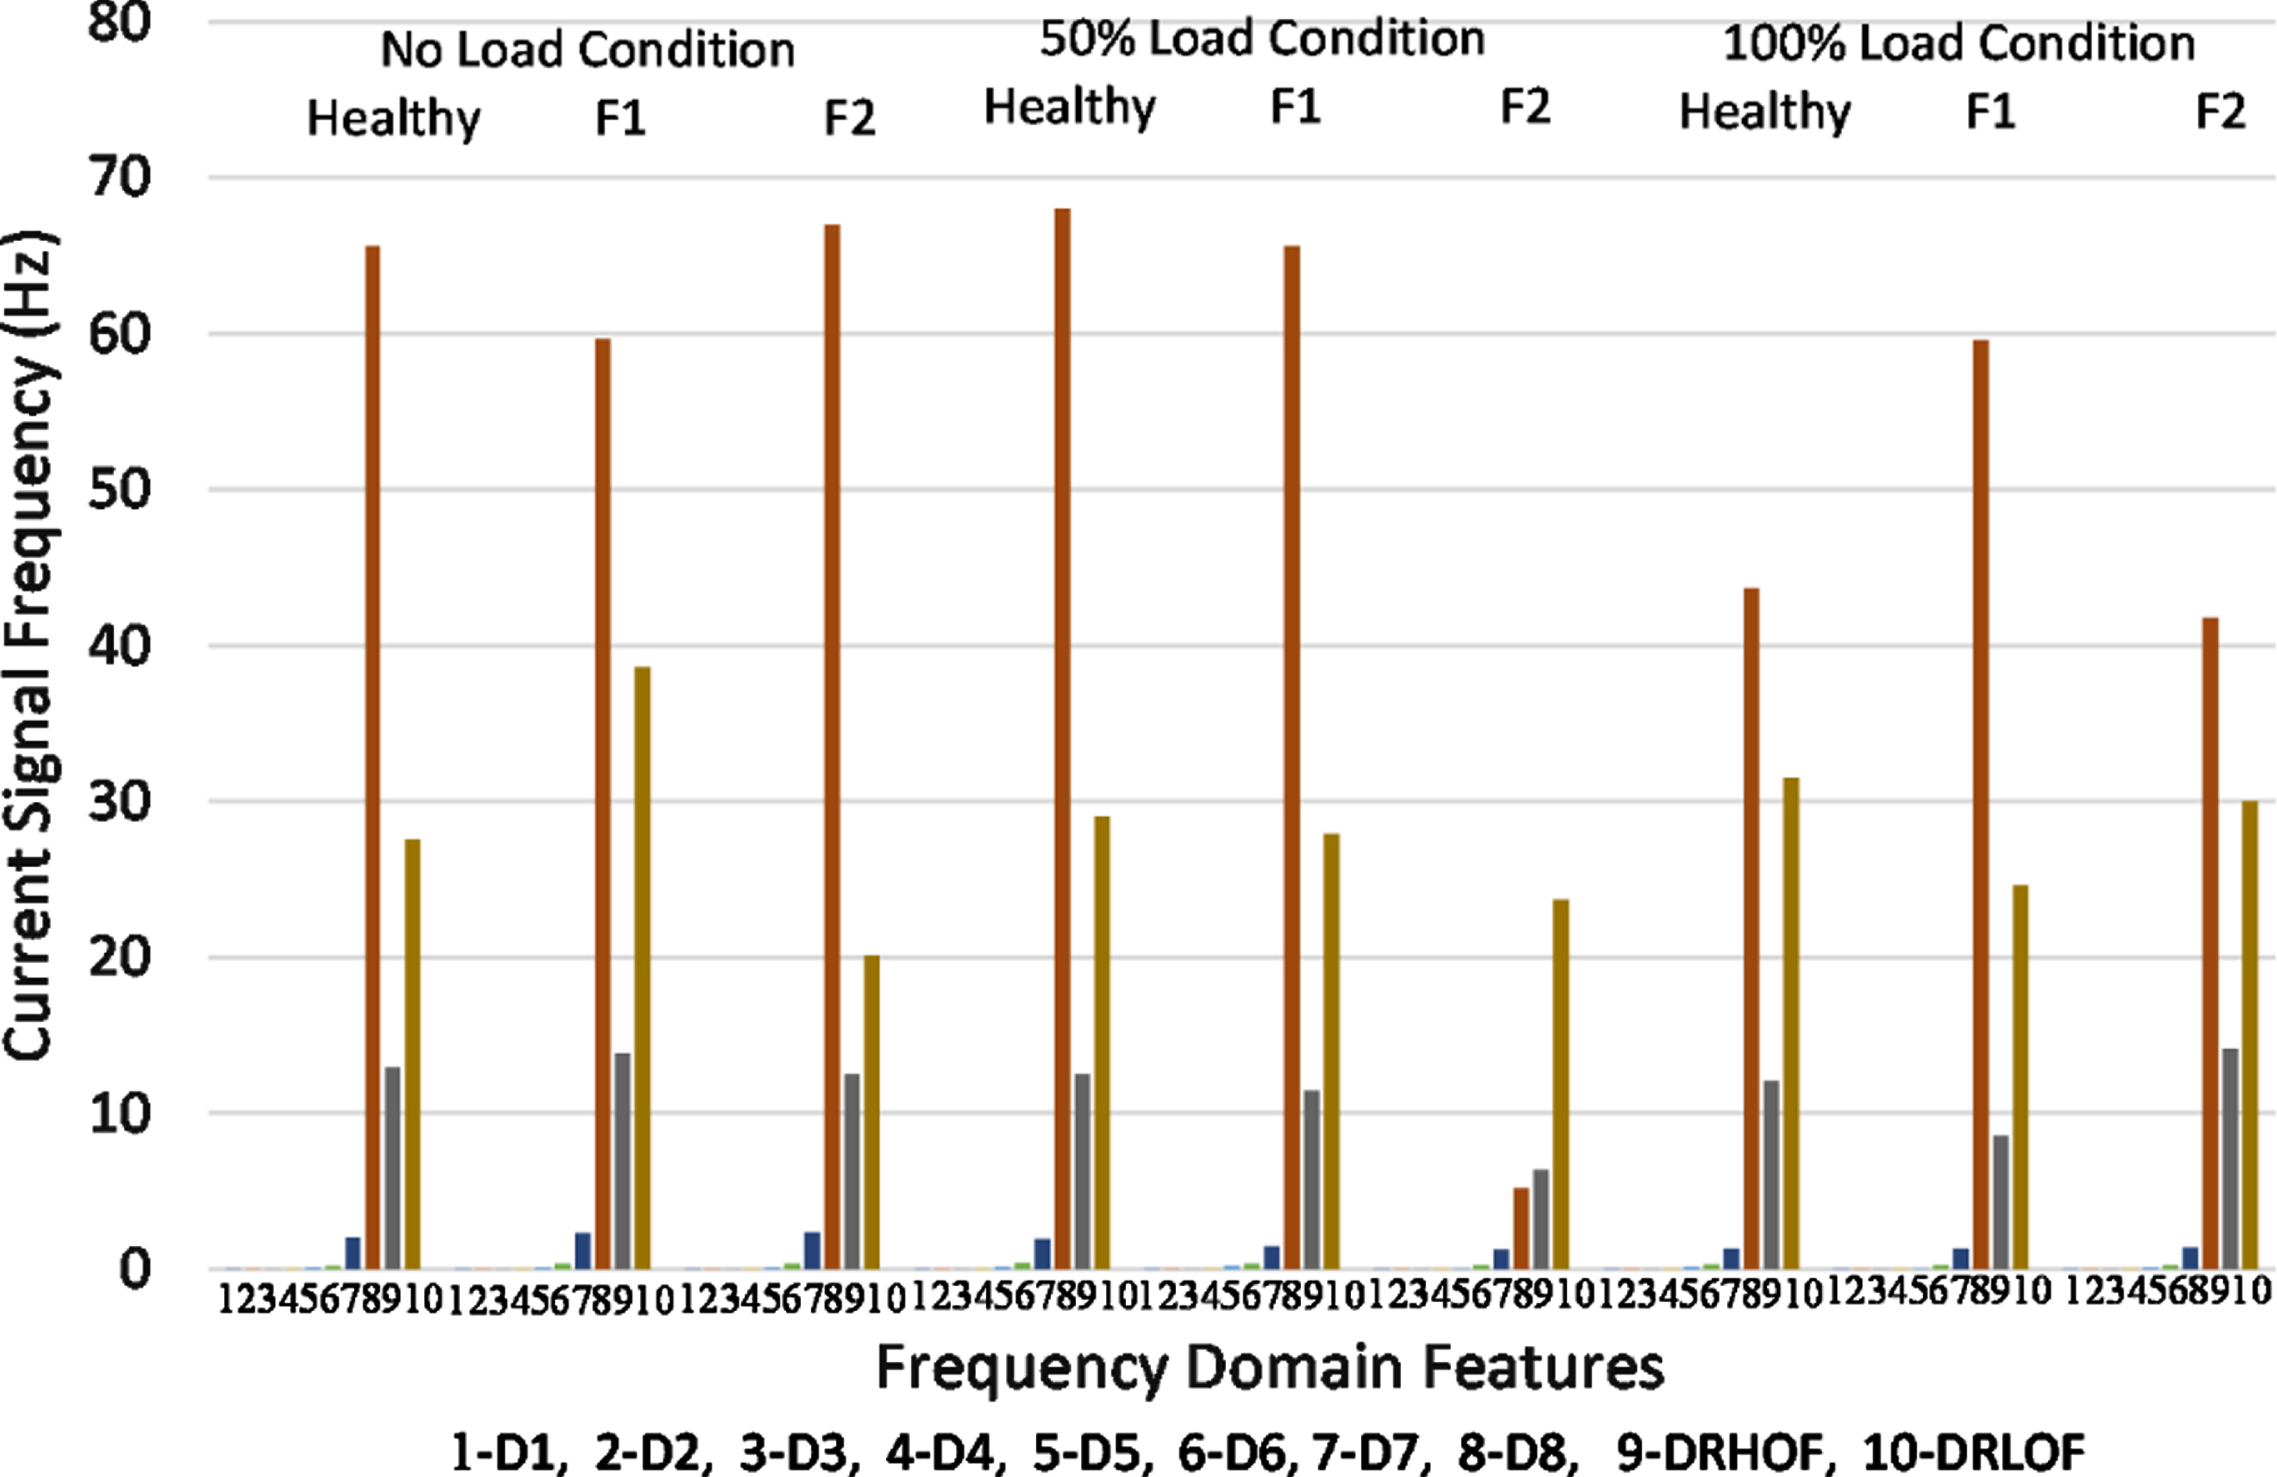
Comparative of the frequency domain features of the current signals under different fault conditions.
The distributions of the computed current signal data under each feature in time domain and frequency domain are presented in Figs. 11 and 12, respectively. These box plots describe the data distribution and skewness through the data quartiles and averages. They also help the reader to identify the mean value and data dispersion as well as skewness sign.
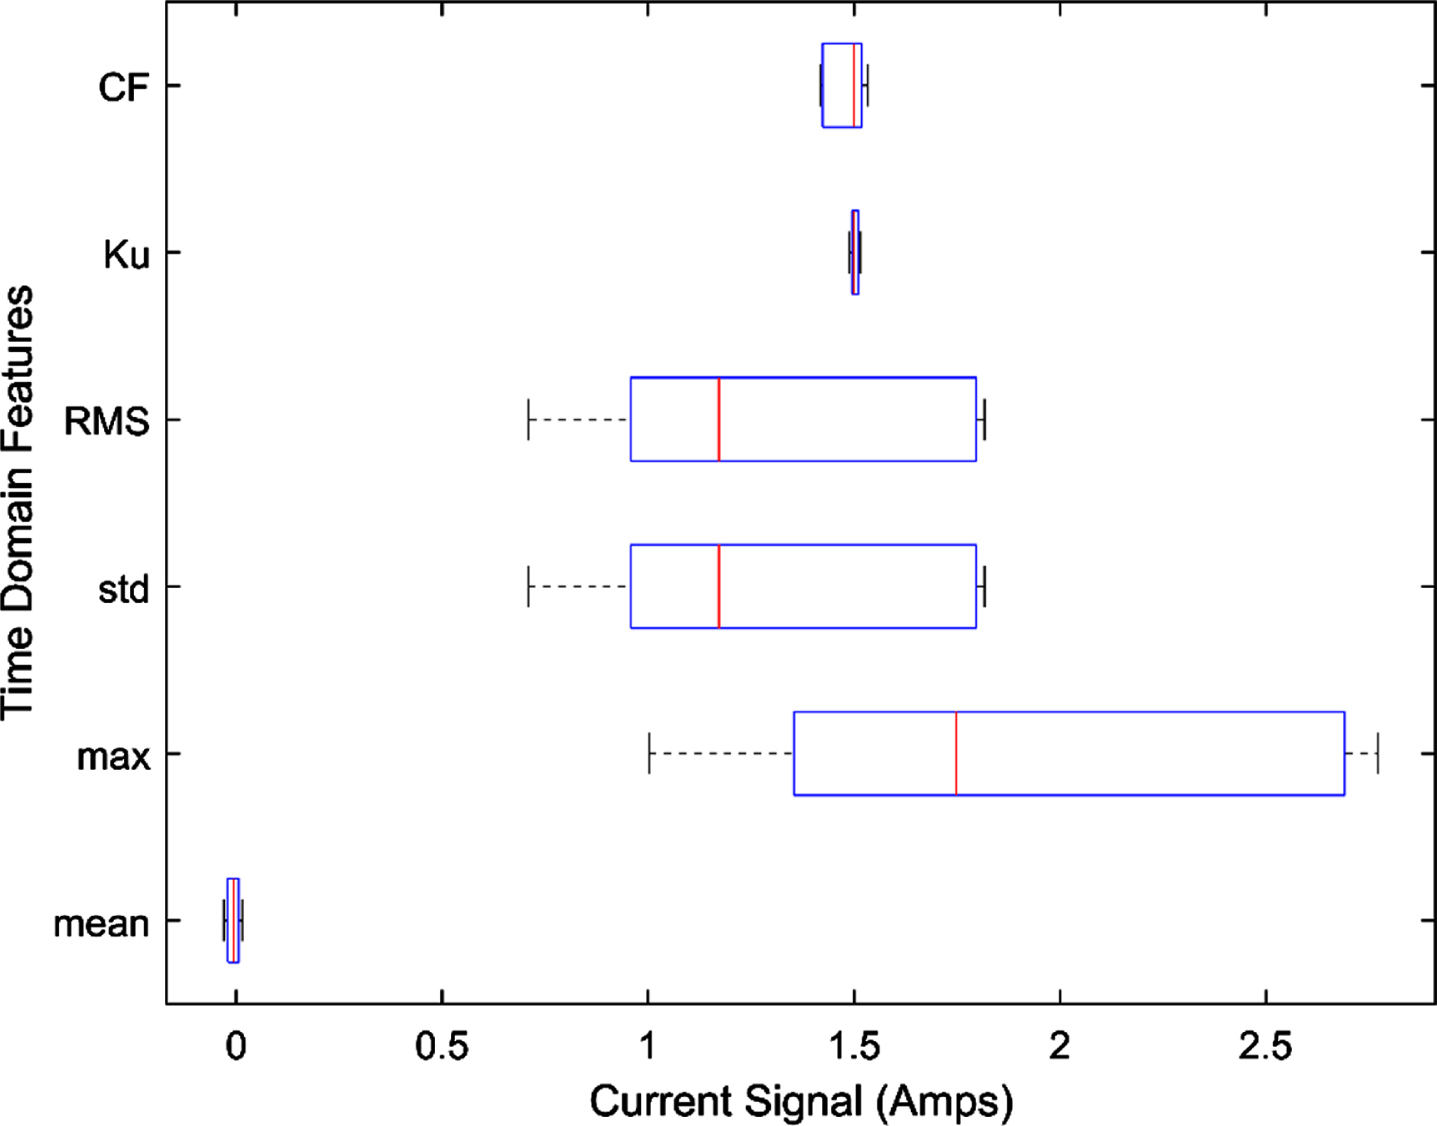
Data set distribution of features in time domain current signal.
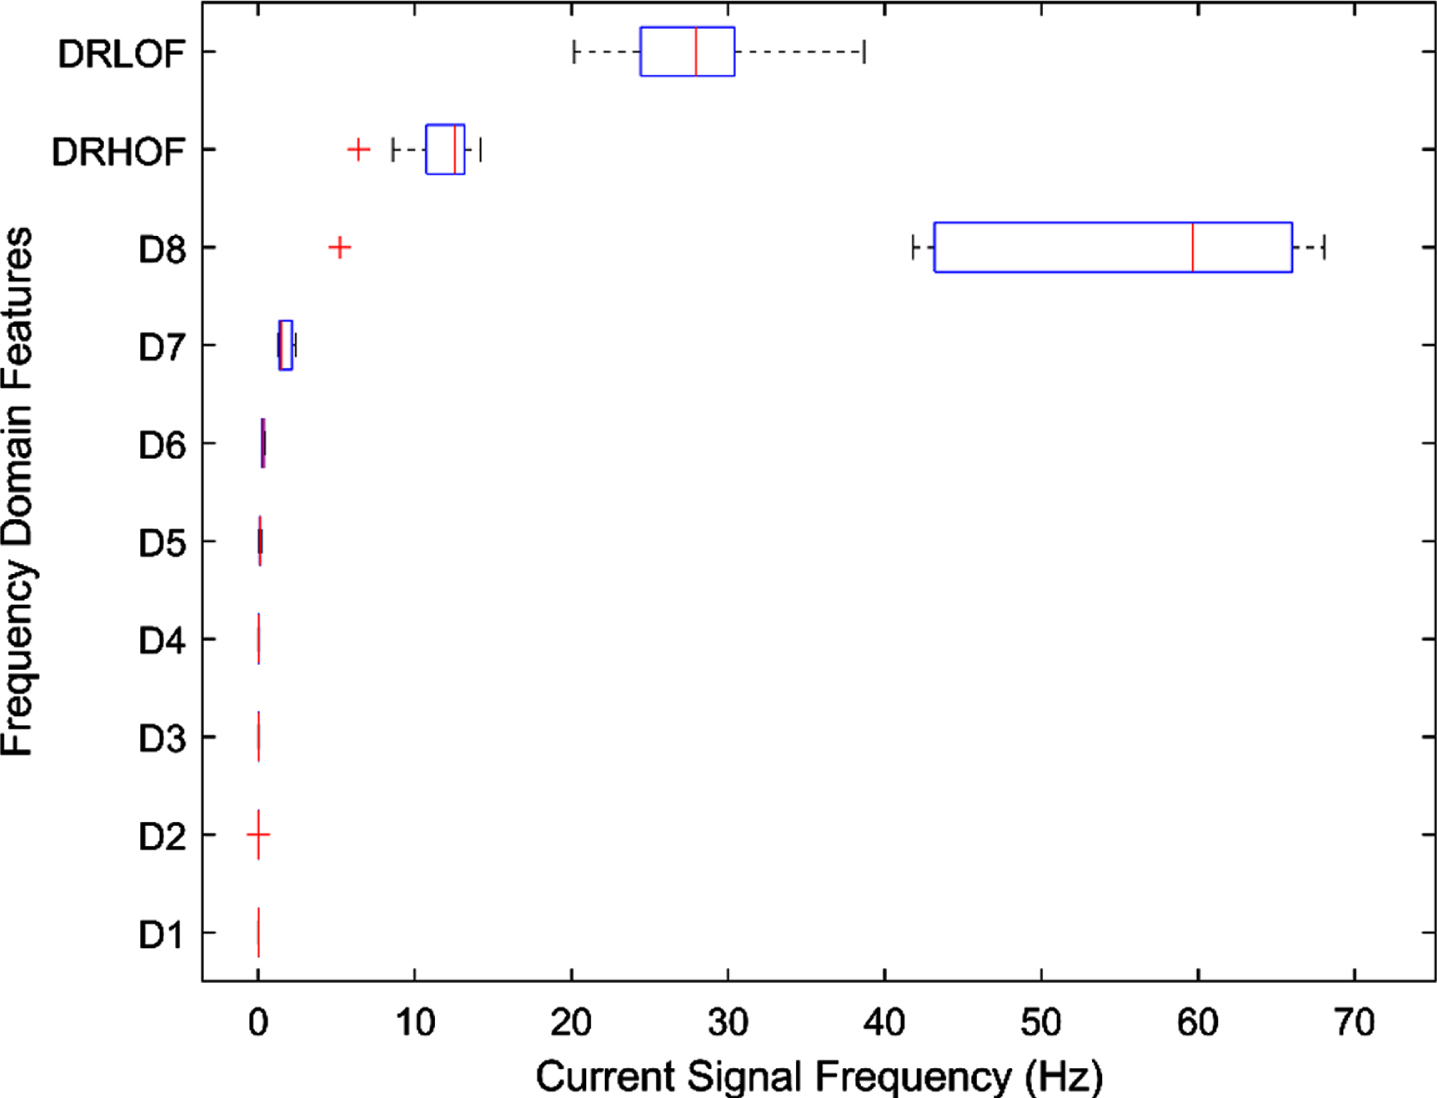
Data set distribution of features in frequency domain current signal.
Based on the PCA methodology explained in the earlier section, the Eigen values λ of the current signal time domain data cluster are derived as [4.0555, 0.9782, 0.5865, 0.3797, 0.0001, 0.0000] and current signal frequency domain data cluster as [5.8968, 1.4313, 1.1584, 0.7533, 0.3361, 0.2981, 0.0997, 0.0264, 0.0000, 0.0000].The Eigen values in the descending order represent the principal components PC1, PC2, ... PCm and the first three largest Eigen values alone are considered in this model for the selection of feature in time domain and frequency domain of the current signal to reduce the original dimension space of the current signal without losing its information. Figures 13 and 14 present the importance of principal components in such a way that in the time domain current signal, the first three principal components encompass the data as PC1-67.5%, PC2-16.3% and PC3-9.7% and in the frequency domain current signal, the first three principal components encompass the data as PC1-58.9%, PC2-14.3% and PC3-11.5%. It means that mostly the first three principal components provide the maximum information of the whole data cluster compared to the other principal components.
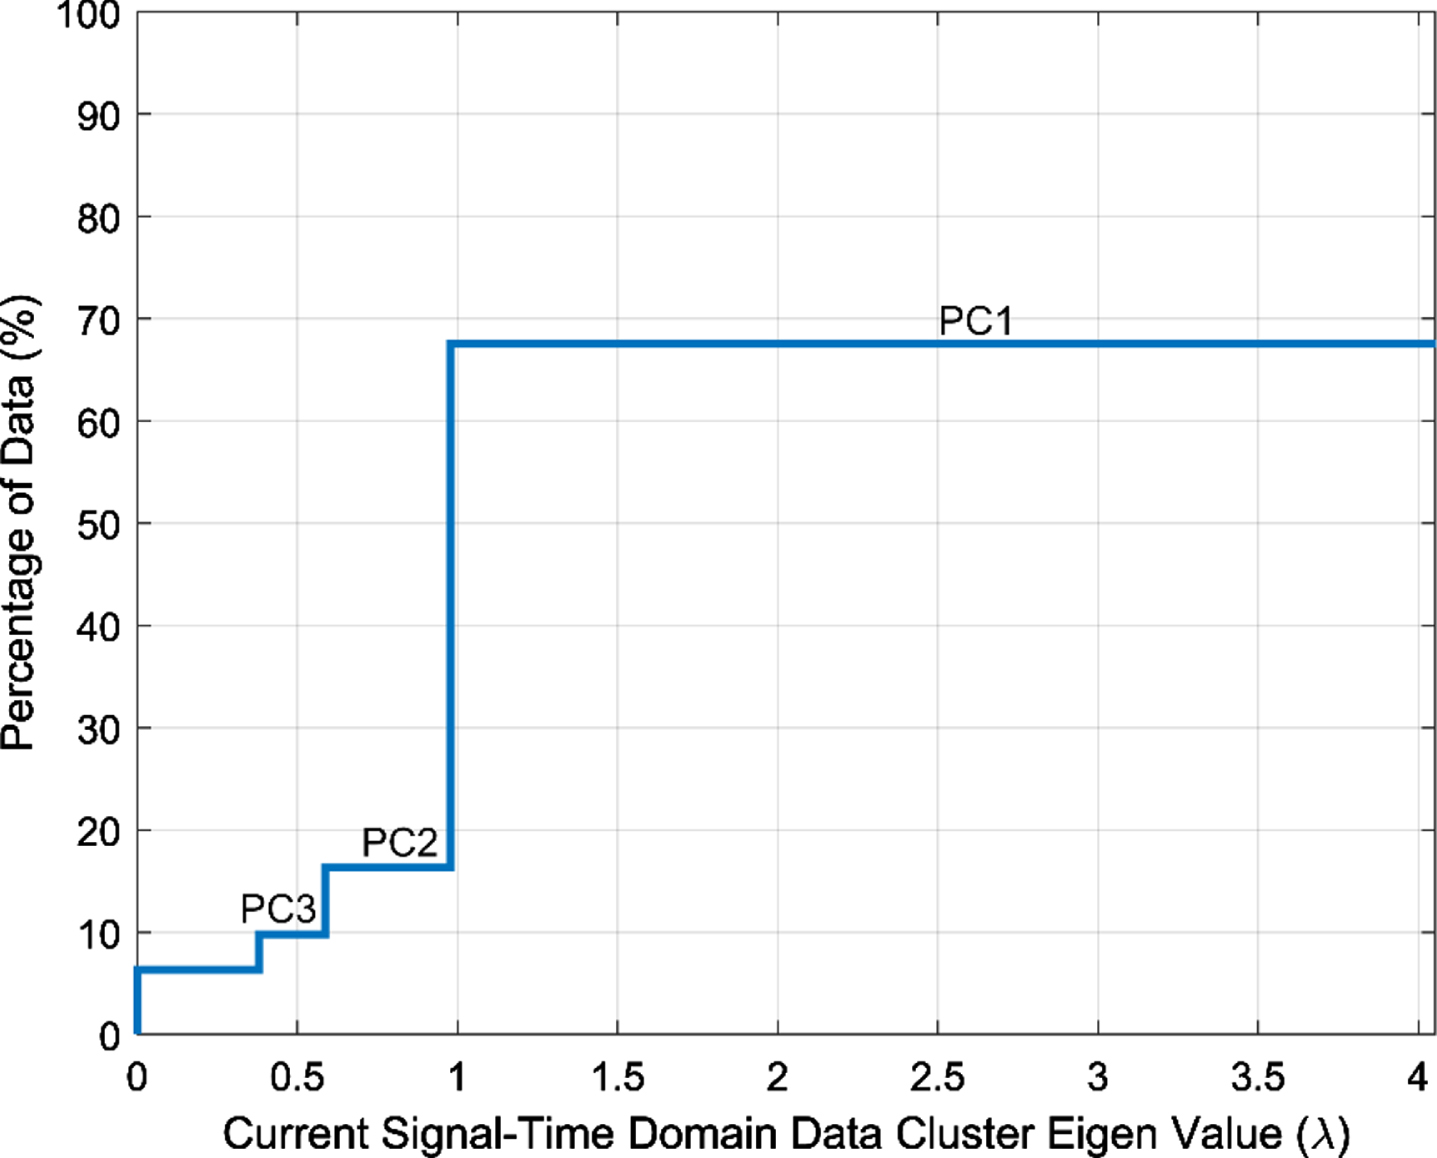
Influential percentage of principal component in time domain current signal.
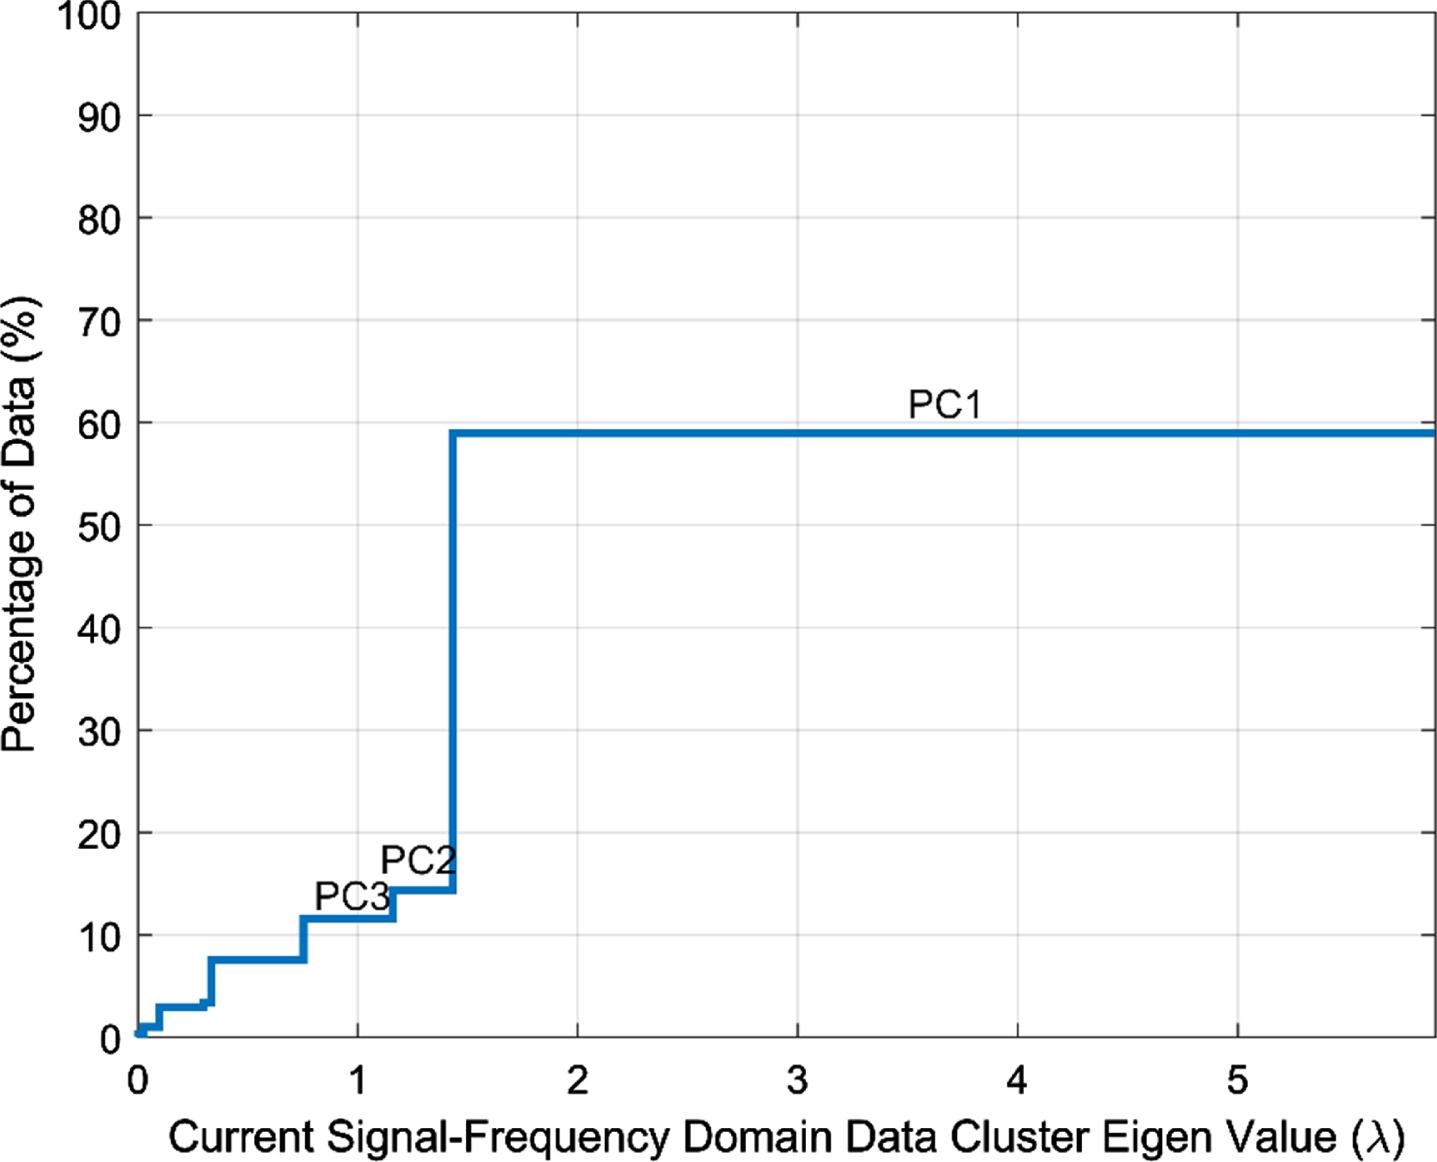
Influential percentage of the principal component in frequency domain current signal.
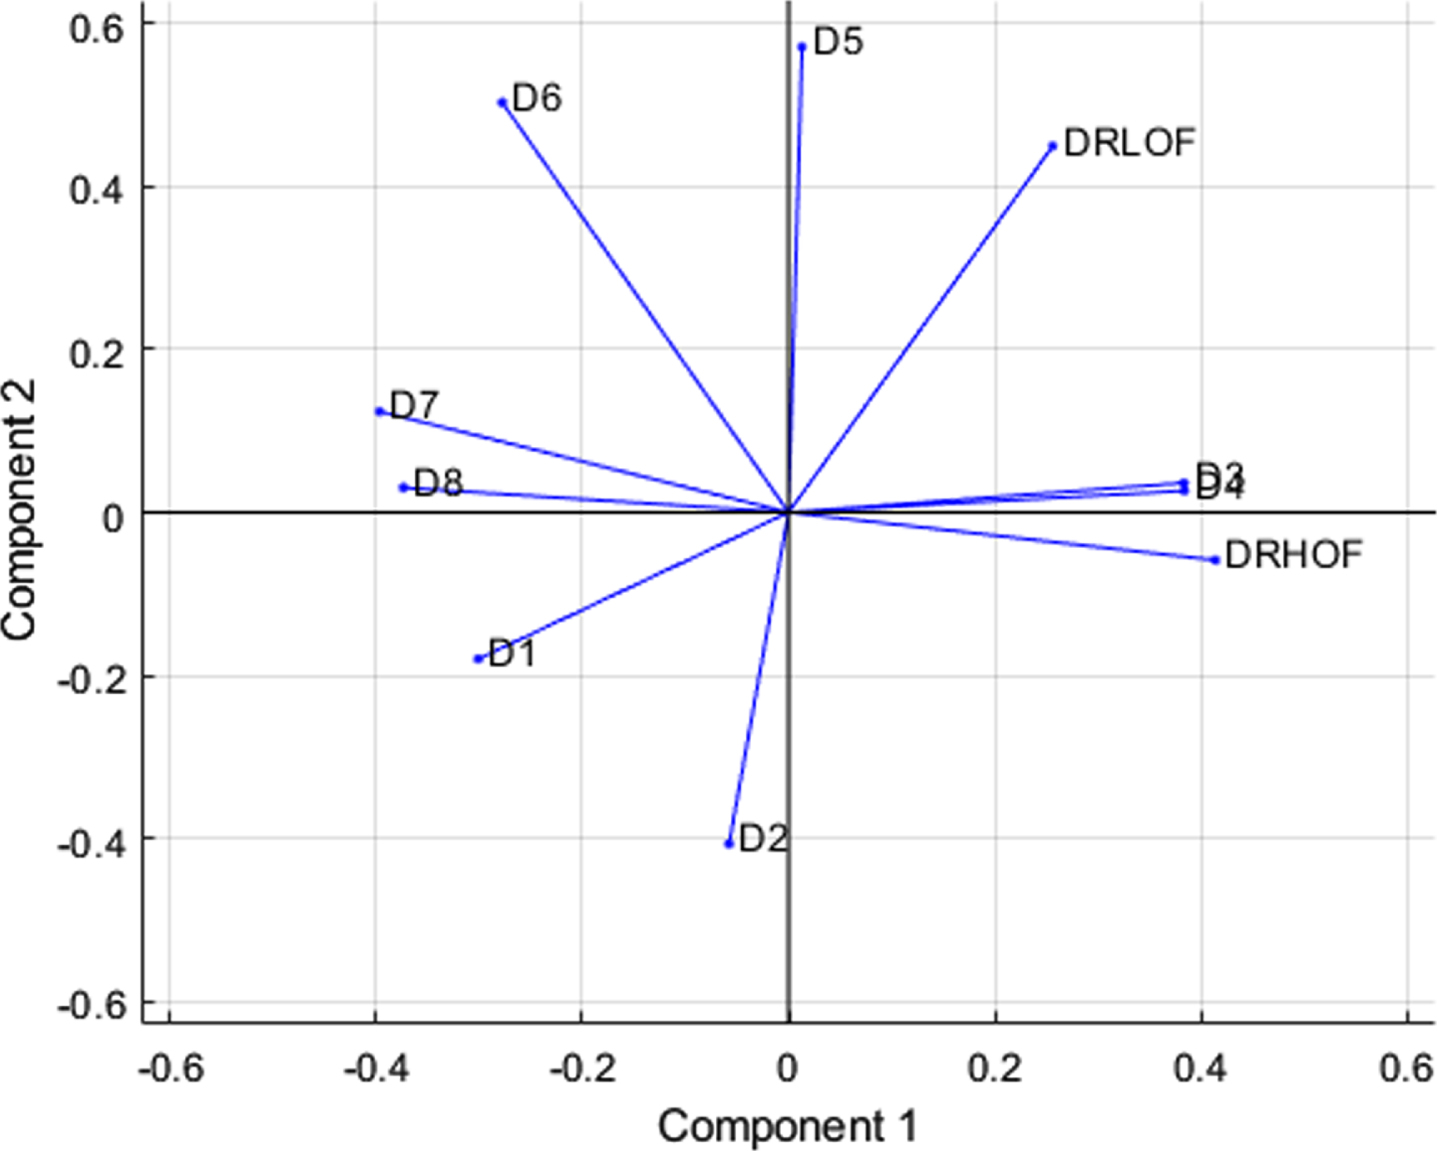
The Eigen vectors corresponding to the Eigen values act as direction vectors in the data cluster and they are used to find highly influential features based on the principal components. The Eigen vectors of the first three Eigen values are plotted using the bi-plot in MATLAB and they are presented for time domain current signal and frequency domain current signal in Figs. 15 and 16, respectively. Figure 15 clearly shows that mean is an influential feature in PC1 and ku is the second influential feature in PC2. Figure 16 clearly depicts that DRHOF is an influential feature in PC1 and DRLOF as an influential feature in PC2.
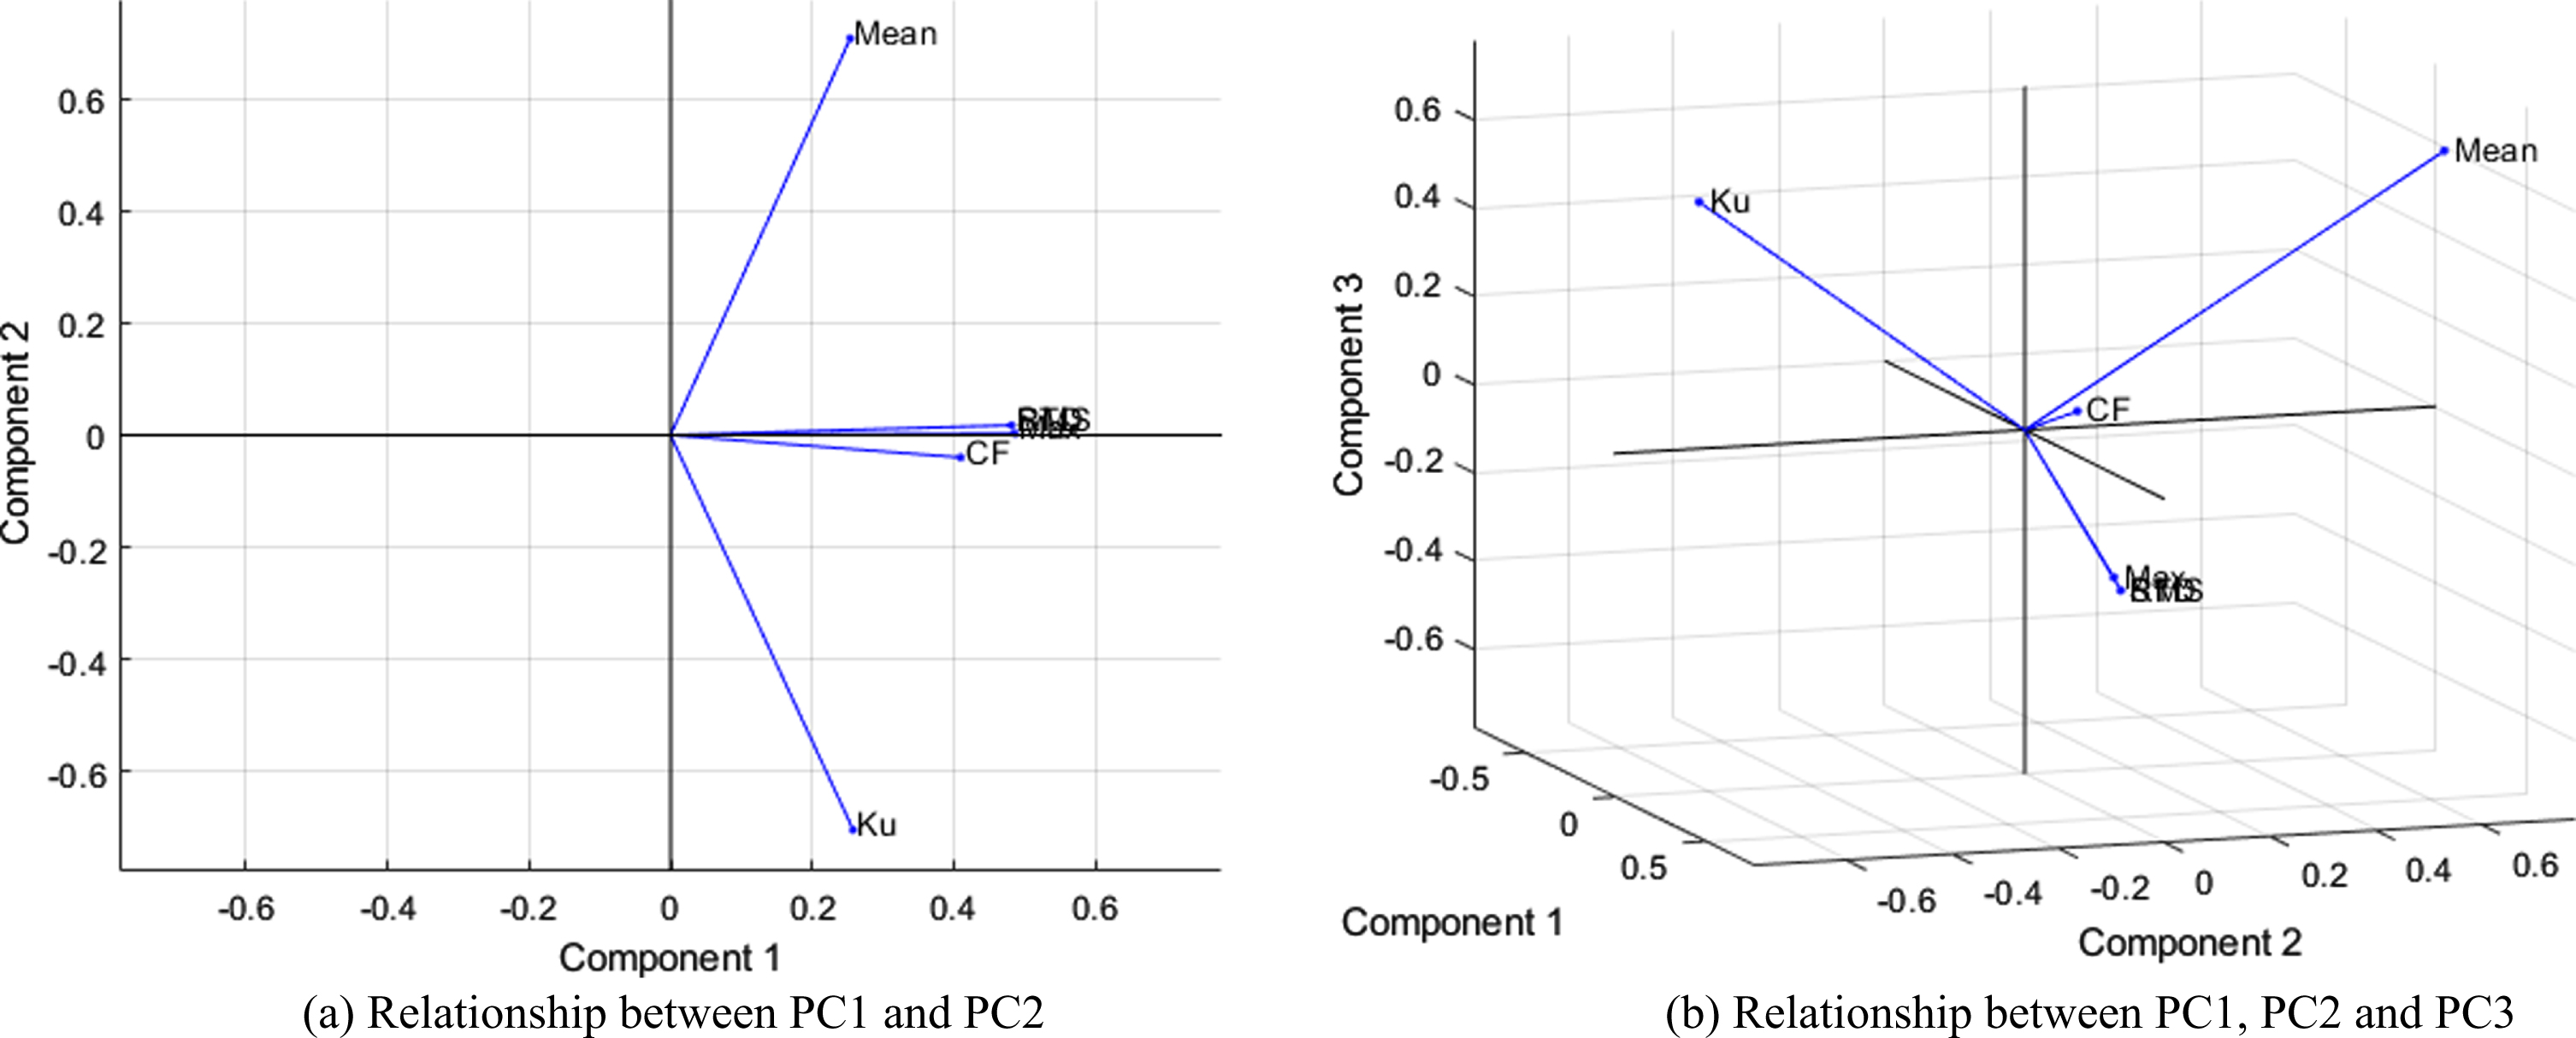
Feature selection in time domain current signal data.
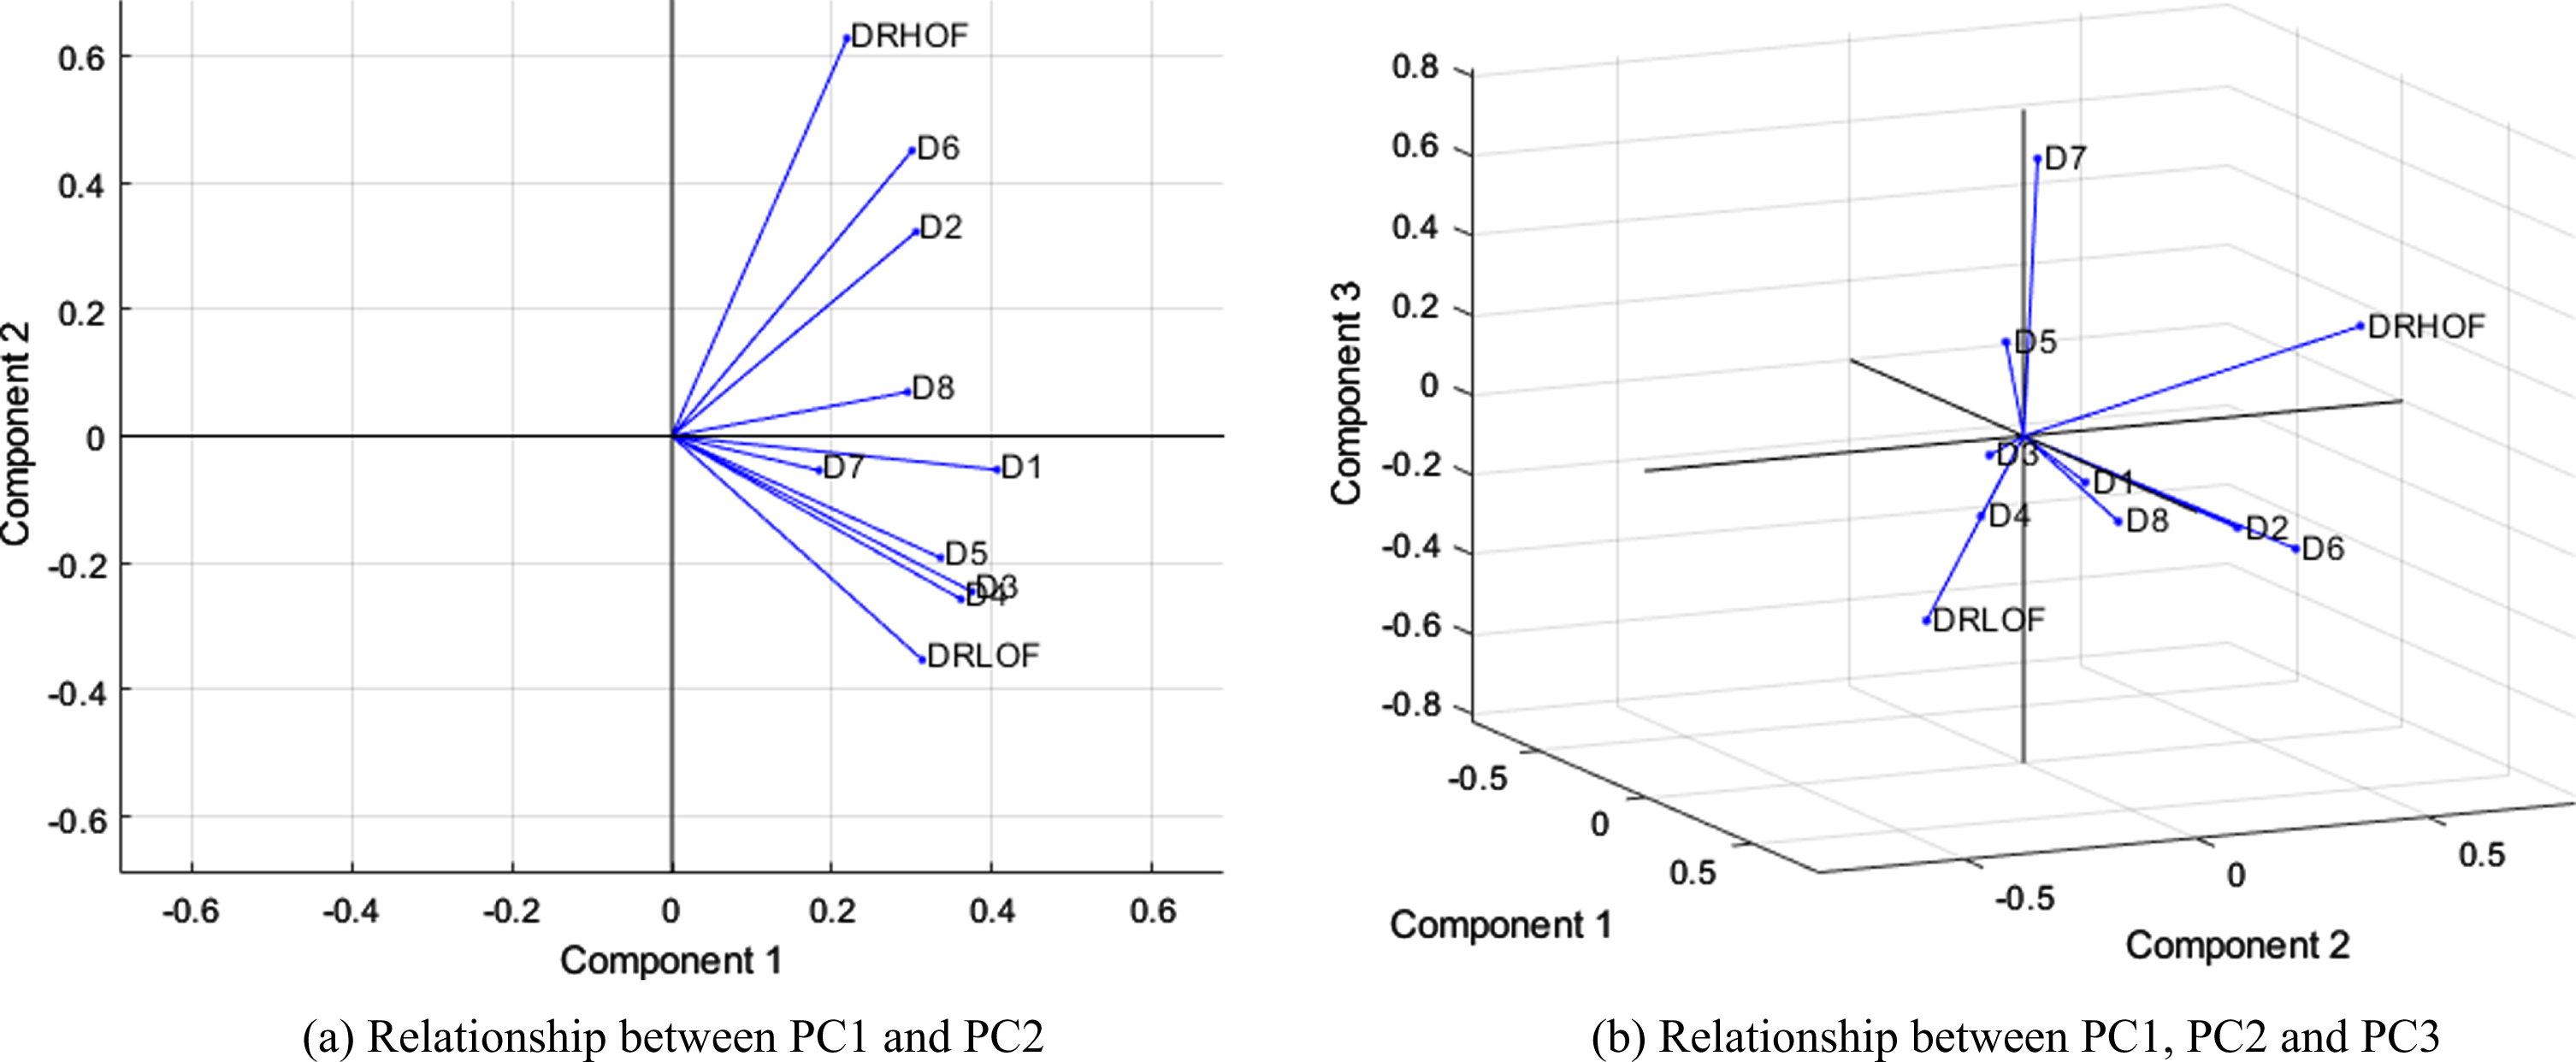
Feature selection in frequency domain current signal data.
The sensitivity of the six time domain current signal feature vectors has been analysed by PCA with respect to motor conditions. The PC weightage of time domain is shown in Fig. 15. With respect to six current feature vectors, mean and ku based classification gives better fault classification accuracy compared other feature vectors. The PC values of frequency domain feature of the current signals are shown in Fig. 16. Based on the PCA, the energy levels in DRHOF and DRLOF features are considered for motor fault classification.
The vibration signal data are acquired through data acquisition system and stored in PC for the computation of statistical parametric feature which is used for time and frequency domain analyses. Similar to the current signal computations, the statistical parameters in vibration signals are computed and presented in Table 5 for Time domain vibration signal and Table 6 for Frequency domain vibration signal, respectively. The vibration statistical parameters can diagnose the types of faults with better accuracy compared to the current signature parameter.
Time domain features of the vibration signals
Frequency domain features of the vibration signals
The PCA methodology has been applied for the vibration signal data similar to the processing of current signal data by using the covariance method of computation to find the Eigen value and Eigen vector. Based on the Eigen values, the principal components PC1, PC2 and PC3 are identified and their corresponding Eigen vectors are used to find the direction of the principal components using bi-plot. They are presented in Figs. 17 and 18. From Fig. 17, the mean and ku features are identified as the most significant features for fault classification under PC1 and PC2 compared to other features in time domain and Fig. 18 shows that DRHOF and DRLOF features are significant features for fault classification under PC1 and PC2 in vibration signal frequency domain analysis.
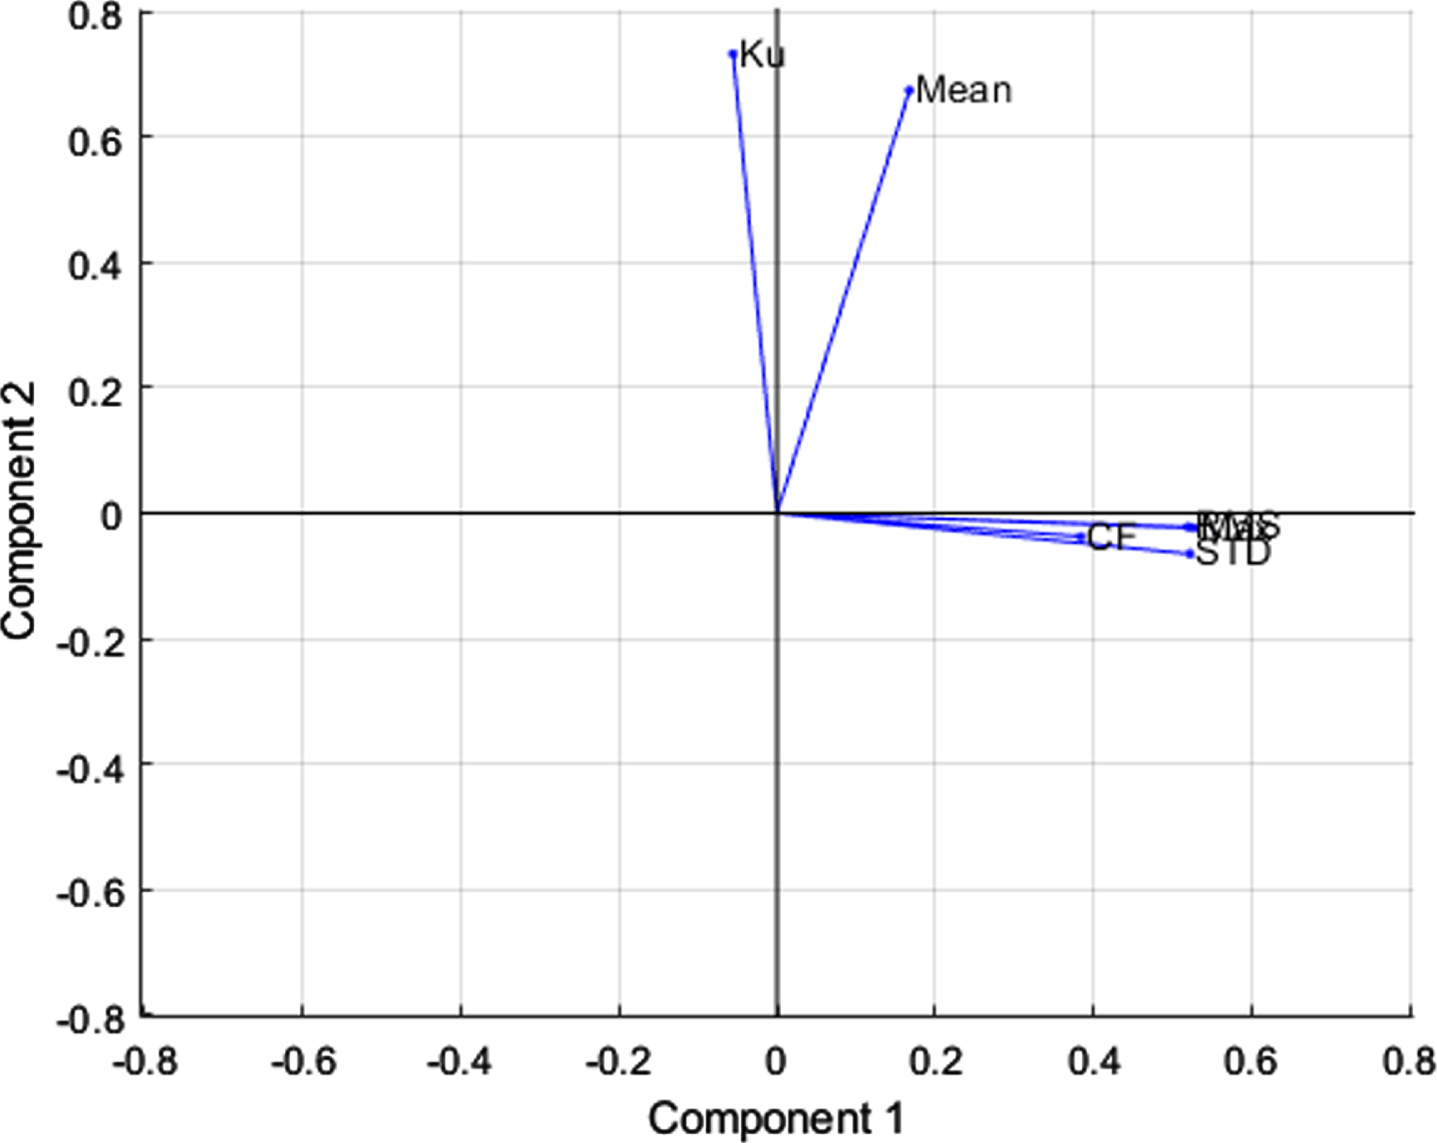
Feature selection in time domain vibration signal.
Feature selection in frequency domain vibration signal.
Upon selection of significant statistical parametric features in current and vibration signals under time and frequency domain analyses, the projected data clusters for current and vibration signals are established by the procedure explained in step 7 of PCA methodology. As per the PCA theory, these projected data clusters are dimensionally reduced in size without losing its information. The segregated data from the projected data dimension based on feature selection are presented in Table 7 for the current signal and Table 8 for the vibration signal.
Trained data set based on feature selection in the current signal
Trained data set based on feature selection in the current signal
Trained data set based on feature selection in vibration signal
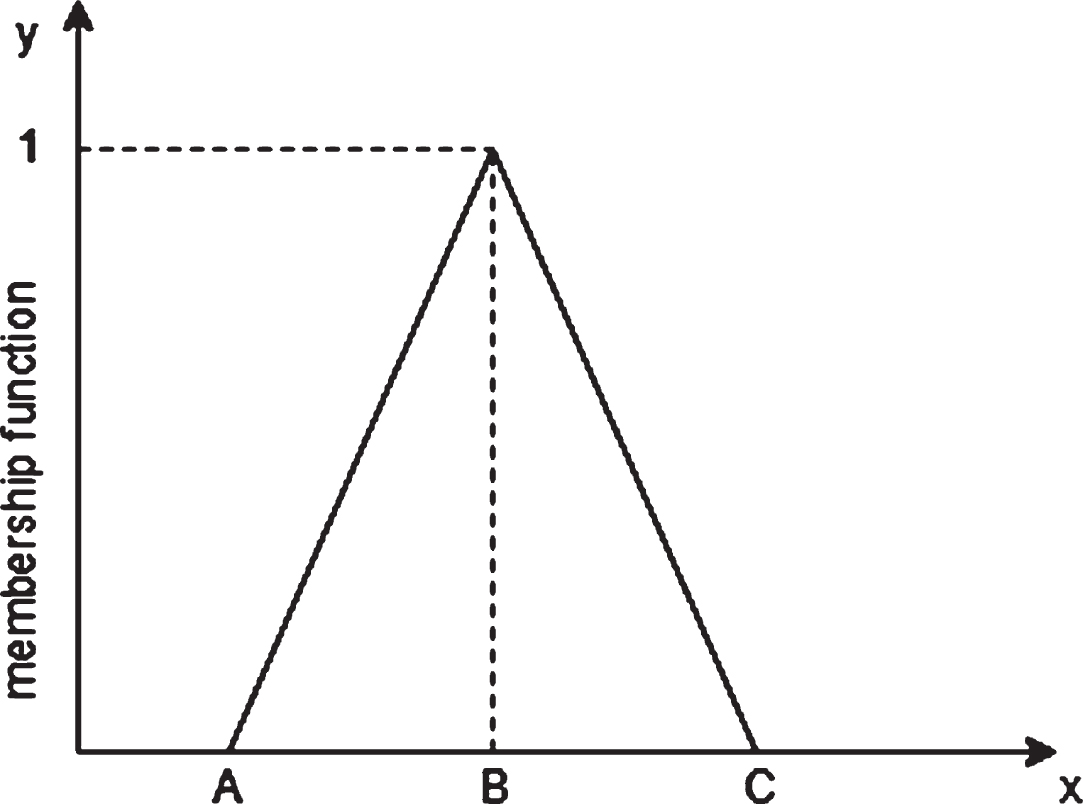
The derived data clusters are considered as trained data sets and their range values in each condition are in fuzzy nature. These non-deterministic value ranges in each selected feature are difficult to make the decision in fault classification and to overcome these difficulties, triangular membership functions as shown in Fig. 19 have been used to characterize the input and output variables. Mendel (1995) has referred these triangular membership functions as triplets and it can be defined with reference points A, B and C as shown in Fig. 19. The membership value of 0.00 is assigned to points A and C and the membership value 1.0 is assigned to point B in this study.
Triangular fuzzy membership function.
This triangular membership function technique has been used to frame the membership functions for antecedent and the resulting variables are used for designing fuzzy information system in order to extract precise output for the fault classification. The framed membership functions corresponding to the input variables in time domain analysis and frequency domain analysis and for the output variables are presented in Tables 9, 10 and 11, respectively.
Fuzzy membership function for the selected feature in time domain
Fuzzy membership function for the selected feature in frequency domain
Fuzzy membership function for fault classification variables
The selected features from the trained dataset are represented by the triangular fuzzy membership function in FIS and based on the fuzzy membership functions, the following fuzzy rules have been developed to present as output variables for the fault classification.
Fuzzy rule for healthy motor classification in current signal: If μ is μ-low, ku isku-medium, HoF is HoF-high and HoL is HoL-medium, then IM is Healthy. If μ is μ-high, ku isku-low, HoF is HoF-medium and HoL is HoL-high, then IM is F1 fault If μ is μ-medium, ku is ku-high, HoF is HoF-low and HoL is HoL-low, then IM is F2 fault
Fuzzy rule for healthy motor classification in vibration signal: If μ is μ-low, ku isku-low, HoF is HoF-low and HoL is HoL-medium, then IM is Healthy. If μ is μ-high, ku isku-high, HoF is HoF-medium and HoL is HoL-low, then IM is F1 fault If μ is μ-medium, ku is ku-medium, HoF is HoF-high and HoL is HoL-high, then IM is F2 fault
In this work, separate FISs have been developed for current signal and vibration signal feature study. In FIS, the crisp form of the features μ, ku, HoF and HoL are fed as input and they are fuzzified in fuzzy interference system. Further, based on the membership function and fuzzy rules, fuzzy output is provided. The fuzzy output is defuzzified by defuzzification unit to get the crisp form of the output to represent the fault classification. To implement the developed FIS models for current signal and for vibration signal, “Fuzzy Logic Designer” from MATLAB has been used in this study.
The proposed integrated PCA-FIS model has been validated by simulation studies along with the same experimental setup with 25% and 75% load conditions. The data of current signal and vibration signal have been acquired through data acquisition system under the above said load conditions and stored in PC as well as the statistical parametric feature has been computed using m-files. The PCA has been applied as discussed earlier. The PC1 and PC2 are derived for current signal and vibration signal under time domain analysis and frequency domain analysis as mean as PC1 and ku as PC2 in current signal and vibration signal under time domain analysis and DRHOF as PC1 and DRHOL as PC2 in current and vibration signal under frequency domain analysis. The projected data matrices are derived using the PCA methodology for current and vibration signals in time domain frequency domain analysis under selected parametric features. The derived datasets using the PCA methodology under the experimental conditions of 25% and 50% loads for healthy, F1 fault and F2 faulty motor are fed as input variables for the developed FIS current signal model and FIS vibration signal model which have been developed by using the earlier trained dataset. From the simulation studies presented in Table 12, it can be noted that the defuzzified output variables in crisp form represent the fault classification based on the fault classification membership variables as illustrated in Table 13.
Simulation results for fault classification using fuzzy classifier 1
Simulation results for fault classification using fuzzy classifier 1
Simulation results for fault classification using fuzzy classifier 2
Table 14 represents the initial classification rate of the induction motor faults. The fuzzy classifier offers different classification rates for different faults conditions. Current signal feature based fuzzy classifier provides better classification rate for healthy conditions and vibration signal feature based fuzzy classifier depict better classification rate for fault 2 (shaft bending). The sugeno fuzzy integral fusion technique has been used to make the final decision. The fuzzy classifier gives the fuzzy measure with an initial classification rate as the input to the fuzzy integral fusion algorithm. The strength of the membership expresses the current induction motor faults and the classification rate shows the historical classification information. The classification rate is used as the fuzzy density to compute g λ fuzzy measure values as shown in Table 15.
Initial classification accuracy rate of fuzzy classifier
g λ fuzzy measures values of fuzzy classifier
The fuzzy integral fusion optimizes the initial individual decision of the fuzzy classifier and the final decision results are shown in Table 16. Under fault1 conditions, the fuzzy classifier 1 decision is wrongly made but the combined fuzzy classifier results by fuzzy integral fusion provide accurate results with a good decision. Moreover under fault 2 condition, the first classifier has again identified as a fault1 and finally, the fuzzy fusion output gives an accurate diagnosis of induction motor mechanical faults.
The final output of the FIS diagnosing system
In this paper, FIS system based induction motor mechanical faults diagnosis system has been proposed based on the fuzzy measure and fuzzy integral fusion techniques. The proposed system covers the current and vibration signal features selection by PCA. The experimental workbench has been created with help of the NI-DAQ and Lab view software. The mechanical faults such as air gap eccentricity and shaft bending fault are created in the induction motor rotor. The test case has been performed and the corresponding current and vibration signals are captured with different sampling frequencies. The recorded signals are used for developing FIS fault diagnosis system. The time domain feature vectors are measured by both current and vibration signals and frequency information features are measured by the discrete wavelet transform. The appropriate feature vectors have been selected by PCA and the selected feature vectors are used to train and test the FIS fault diagnosing system. The individual fuzzy classifier initial decision has been confirmed by the fuzzy integral fusion technique as a second decision. The fuzzy integral fusion integrated system provides a better classification rate than an individual classification rate.
Footnotes
Acknowledgments
The author would like to thank the Department of Science and Technology (DST) – New Delhi, India for providing financial support under the FIST-(DST-FIST(SR/FST/college-235/2014) and thank the Department of Electrical and Electronics Engineering, K.S.Rangasamy College of technology for providing permission to carry out the research.