
Abstract
BACKGROUND:
Classification of action intention understanding is extremely important for human computer interaction. Many studies on the action intention understanding classification mainly focus on binary classification, while the classification accuracy is often unsatisfactory, not to mention multi-class classification.
METHOD:
To complete the multi-class classification task of action intention understanding brain signals effectively, we propose a novel feature extraction procedure based on thresholding graph metric.
RESULTS:
Both the alpha frequency band and full-band obtained considerable classification accuracies. Compared with other methods, the novel method has better classification accuracy.
CONCLUSIONS:
Brain activity of action intention understanding is closely related to the alpha band. The new feature extraction procedure is an effective method for the multi-class classification of action intention understanding brain signals.
Introduction
Action intention understanding refers to observers judging the real purposes behind other people’s action behaviours by observing others’ action behaviours [1, 2]. It is important for many human activities, e.g., social interaction, mental development and language learning [3, 4]. In recent years, many researchers have taken part in the study of action intention understanding [5–13]. Some researchers have carried out neuromechanism analysis of the action intention understanding [5–7], and other researchers have carried out classification tasks of the action intention understanding brain signals [7–13]. In this study, we mainly focus on the latter. A high classification accuracy of the action intention understanding brain signals is crucial to enhancing the user-experience in many real applications, e.g., the brain-computer interface (BCI) exoskeleton assistive stroke rehabilitation framework and recommendation system [8, 12].
To classify the brain signals of action intention understanding effectively, many researchers have proposed some state-of-the-art techniques [7–13]. These techniques mainly aim to solve the problem that binary classification accuracies are very low in action intention understanding brain signals. However, the classification accuracies of these techniques are still unsatisfactory and are often less than 65% [7, 13]. Multi-class classification system is more complex than the binary classification system. Hence, it is more difficult to implement the multi-class classification task of action intention understanding brain signals [13]. In real applications, three or more stimulation conditions often exist. Therefore, carrying out a multi-class classification study of action intention understanding brain signals has great practical significance and long-term development for humansociety.
According to previous studies on the classification of action intention understanding, we find that people mainly focus on feature extraction, and the different feature extraction methods have different efficiencies [7–9, 13]. For instance, Zhang et al. use binarized brain network metrics as the classification feature and the brain network constructed by PLV and Pearson correlation [12], which obtain average classification accuracy of 58.2%; Liu et al. direct use the time series signals as the classification features, which obtain average multi-class classification accuracy of 48% [13]; Xiong et al. use weighted brain network metrics as the classification features that achieve the highest average classification accuracy of 76.67% [8]; fusing features from both EEG and fNIRS complex brain networks resulted in a classification accuracy of 72.7% in Ge et al.’s study [26]. In this work, we propose a novel feature extraction procedure that based on thresholding graph metrics. In the procedure, we first carry out a data preprocessing task for the electroencephalogram (EEG) signals. Then, we transform the preprocessed data into source space by sLORETA [14] to obtain accurate time series in whole brain regions and different frequency sub-bands. And then, we use two famous algorithms, the phase lag index (PLI) [15] and weighted phase lag index (WPLI) [16], to construct functional connectivity matrices on 5 frequency bands and 63 micro time windows. Additionally, we calculate some graph metrics on these functional connectivity matrices and use these graph metrics as the initial classification features. After that, we use variance analysis to select the most useful classification features. Finally, we apply three kinds of classifiers, support vector machine (SVM), multilayer perceptron (MLP), line discriminate analysis (LDA), to implement multi-class classification tasks of the action intention understanding brain signals on the 5 frequency bands.
The main contribution of this study is that we propose a new feature extraction and selection procedure for the multi-class classification of action intention understanding, which obtains an average classification accuracy over 80% for a specific of action intention understanding EEG signals. Additionally, we found that the brain activity on action intention understanding is closely related to the alpha frequency band. With our new method, the multi-class classification task of action intention understanding EEG signals can be completed effectively in a certain extent. The novel method has an exceedingly classification efficiency, which can obtain satisfactory experimental result by only a few top features.
Materials and method
In this section, we present out the details of the materials used in this study and novel method. Our materials are shown in the following subsection 2.1–2.4, and the novel method is mainly demonstrated in the following subsections 2.5–2.8.
Subjects
In this study, we totally recruited 30 subjects (8 females, 22 males; aged 19–25 years, mean±SD: 23.0±2.4; no mental illnesses or physiological diseases; right-handed) who were all college students from Southeast University. Before formal EEG signal sampling, all the students were informed to read the experimental content and sign a contract. After completing the task, each person obtained a certain amount of compensation. This research was approved by the Ethics Committee of the School of Biological Sciences and Medical Engineering, Southeast University, China.
Experimental paradigm and data sampling
Our experimental paradigm originated from the research of Ortigue et al. [2]. Figure 1 shows the stimulus conditions and presentation schedule of the EEG data sampling experiment. In the subfigure A, Nc represents a cup without any context, which is used to improve the coherent sense of the observer. Ug, Tg and Sc denote the intention of a hand holding a cup to drink, a hand grasping a cup to move it, and a hand touching a cup but without any obvious aim, respectively.
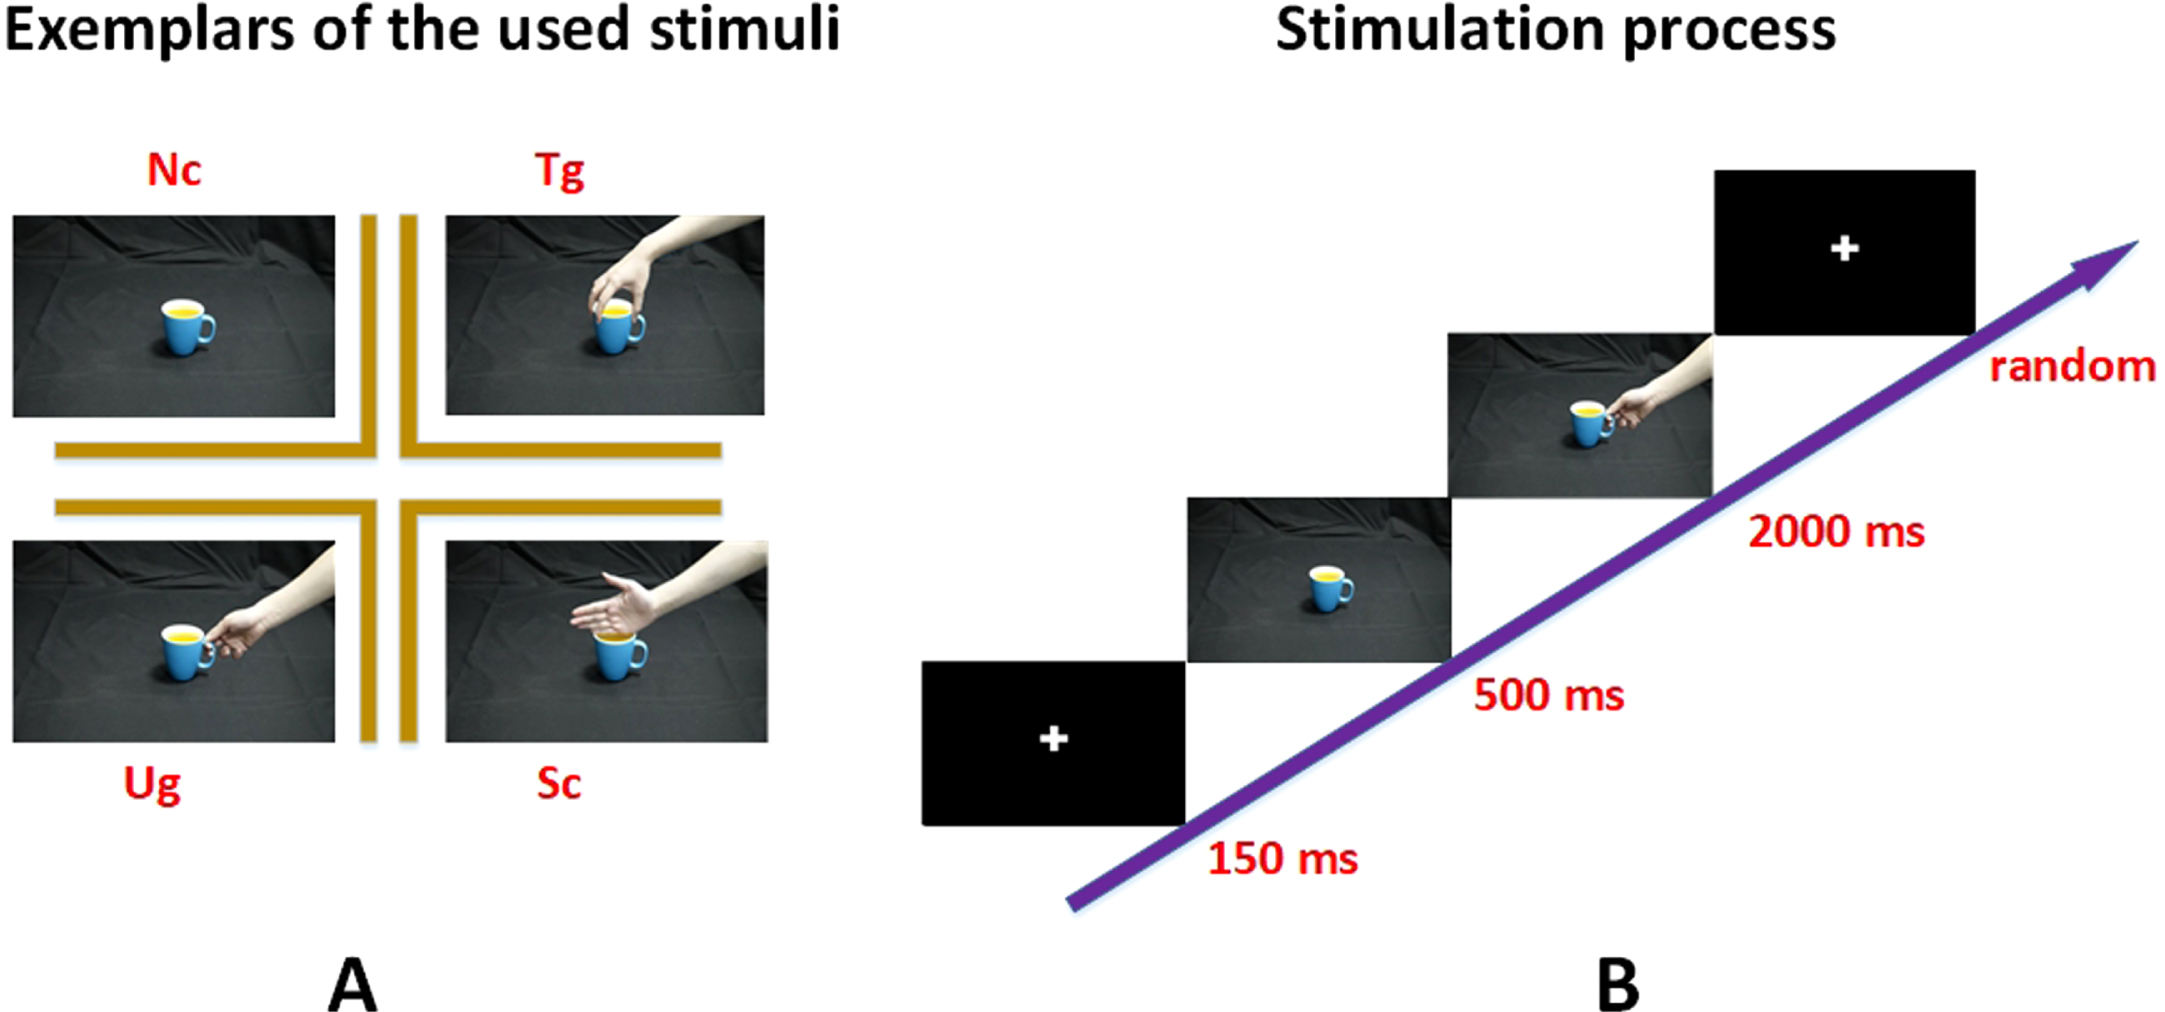
Experimental paradigm. Subfigure A shows the stimulus conditions that are adopted in the EEG data sampling experiment, and Subfigure B is the stimulus presentation schedule.
Subfigure B shows out the stimulation process in a single trial, which is presented sequentially along the time course. The red words (time) denote that how long do the pictures last. In the experiment, a white cross first appeared on the center of the screen and lasted 150 ms. Then, a cup was shown on the screen and lasted 500 ms. When the cup disappeared, a picture of a hand-cup interaction stimulus was immediately displayed on the screen and lasted 2000 ms. When the hand-cup interaction appeared on the screen, the subject was ordered to judge the intention of the performer. Before the start of the next trial, the cross was presented again for a random time that changed from 1000 to 2000 ms. The random time was used as the interval between any two sequential trials. In the process of EEG signals recording, every subject sits in front of a computer and he or she only needs to discriminate the purpose of the stimulus figure on the screen. More details about this experimental paradigm can be found in references [7–9, 13].
In data sampling, we applied 64 AgCl electrodes (Neuroscan acquisition equipment, version 4.3, international 10–20 system, 500 Hz sampling rate) to record EEG signals. Each action intention stimulus condition contained 98 trials. Therefore, every subject had 294 trials in this study.
After browsing the EEG waveforms of the 30 subjects on Letswave software, we removed 5 subjects whose channels were contaminated by head movement. For the remaining 25 subjects, we first carried out ocular processing and re-referencing with the Neuroscan. Considering that previous experimental experiences, it still difficulty obtain clean data that were implemented ICA on EEGLAB [17], we carried out ocular processing on the Neuroscan instead of the ICA that was conducted using EEGLAB. A host of re-reference methods have been proposed, in view of mastoid reference is active and effective in somatosensory evoked potentials, we converted the unilateral mastoid electrode (M1) reference into bilateral mastoid electrodes (M1, M2) re-reference. Next, we used the EEGLAB to implement channel selection (a total of 60 electrodes were retained in this study). Next, we used the Basic FIR filter in EEGLAB to extract the 1–30 Hz data, i.e., full frequency band in this study. Then, we segmented the full frequency band with event types in time windows (–0.65 s to 2.5 s) and removed the baseline by setting the baseline at –0.65 s. And then, we rejected artifacts that numerical values were not in a scope from –75 to 75. On average, 267 trials were reserved for each subject. Finally, we transformed the clean EEG data of 25 subjects into source space by sLORETA to obtain the time series in 84 regions of interest (ROIs) in 5 frequency bands (1–4 Hz, 4–8 Hz, 8–13 Hz, 13–30 Hz and 1–30 Hz, i.e., delta, theta, alpha, beta and full-band).
Functional connectivity matrix construction
When obtaining the time series in the source space, we used two classical algorithms, PLI and WPLI, to construct functional connectivity matrices. The mathematical formulas of these two algorithms are as follows:
Phase lag index
We adopt nine kinds of graph property metrics as the classification features in this research. They are Shannon graph complexity [18], efficiency complexity [19], graph density [18], graph index complexity [19], characteristic path length [20], average neighbor degree [21], clustering coefficient [22], global efficiency [23] and small-world [24, 25].
Sample reconstruction
We retained 25 subjects in the data preprocessing. Therefore, the three stimulus conditions (Ug, Tg, Sc) contained 75 initial samples. However, we used the latest approach [9] to reconstruct the samples in this study. For each subject, we computed two kinds of matrices (one is from PLI, another is from WPLI) under the same stimulus condition. The chief purpose of this study is to classify the brain signals that are from the three stimulus conditions, hence, for the same action intention stimulus condition, the data that come from the PLI and WPLI were viewed as two samples. With the idea of the latest approach, we obtained 150 samples on each frequency band.
Feature extraction
It is noteworthy that the functional connectivity matrices are calculated in 63 microstate time windows (each time window is 50 ms) and 5 frequency bands (delta, theta, alpha, beta and full-band). Because nine kinds of graph metrics are calculated on these matrices, the graph metrics can capture the time and frequency information to some extent. In this study, we use the nine kinds of graph metrics in the 63 microstate windows as the classification features. Therefore, each frequency band contains 567 classification features. To effectively classify brain signals related to action intention understanding, we used the variance analysis method to filter features. For a given dataset (row is sample, column denotes feature), we first calculated the variance value of each column, then sorted the variance values from large to small and recorded their index numbers, and then reorganized the dataset in descending order, and finally extracted the specific proportion quantity features with the highest variance ranking in the dataset, i.e., the top r (e.g., the threshold is r = 10%, 20%, . . . , 100%) features in the reorganized dataset.
Classification
After extracting the feature dataset, we used the SVM, MLP and LDA classifiers to carry out the multi-class classification task on the 5 frequency bands. To effectively train the classification model and obtain reliable average classification accuracy, we adopted 5-fold cross validation to train the classifier model. Figure 2 shows the whole procedure of the new approach that was used to complete the multi-class classification task of the action intention understanding brain signals.

Overview of the novel method.
Classification accuracies
To determine whether the features that are extracted by the novel procedure are effective, we carried out classification tasks on different dimensions of feature datasets. Figure 3, Fig. 4 and Fig. 5 show that the average classification accuracies change with the different sizes of the feature dataset.

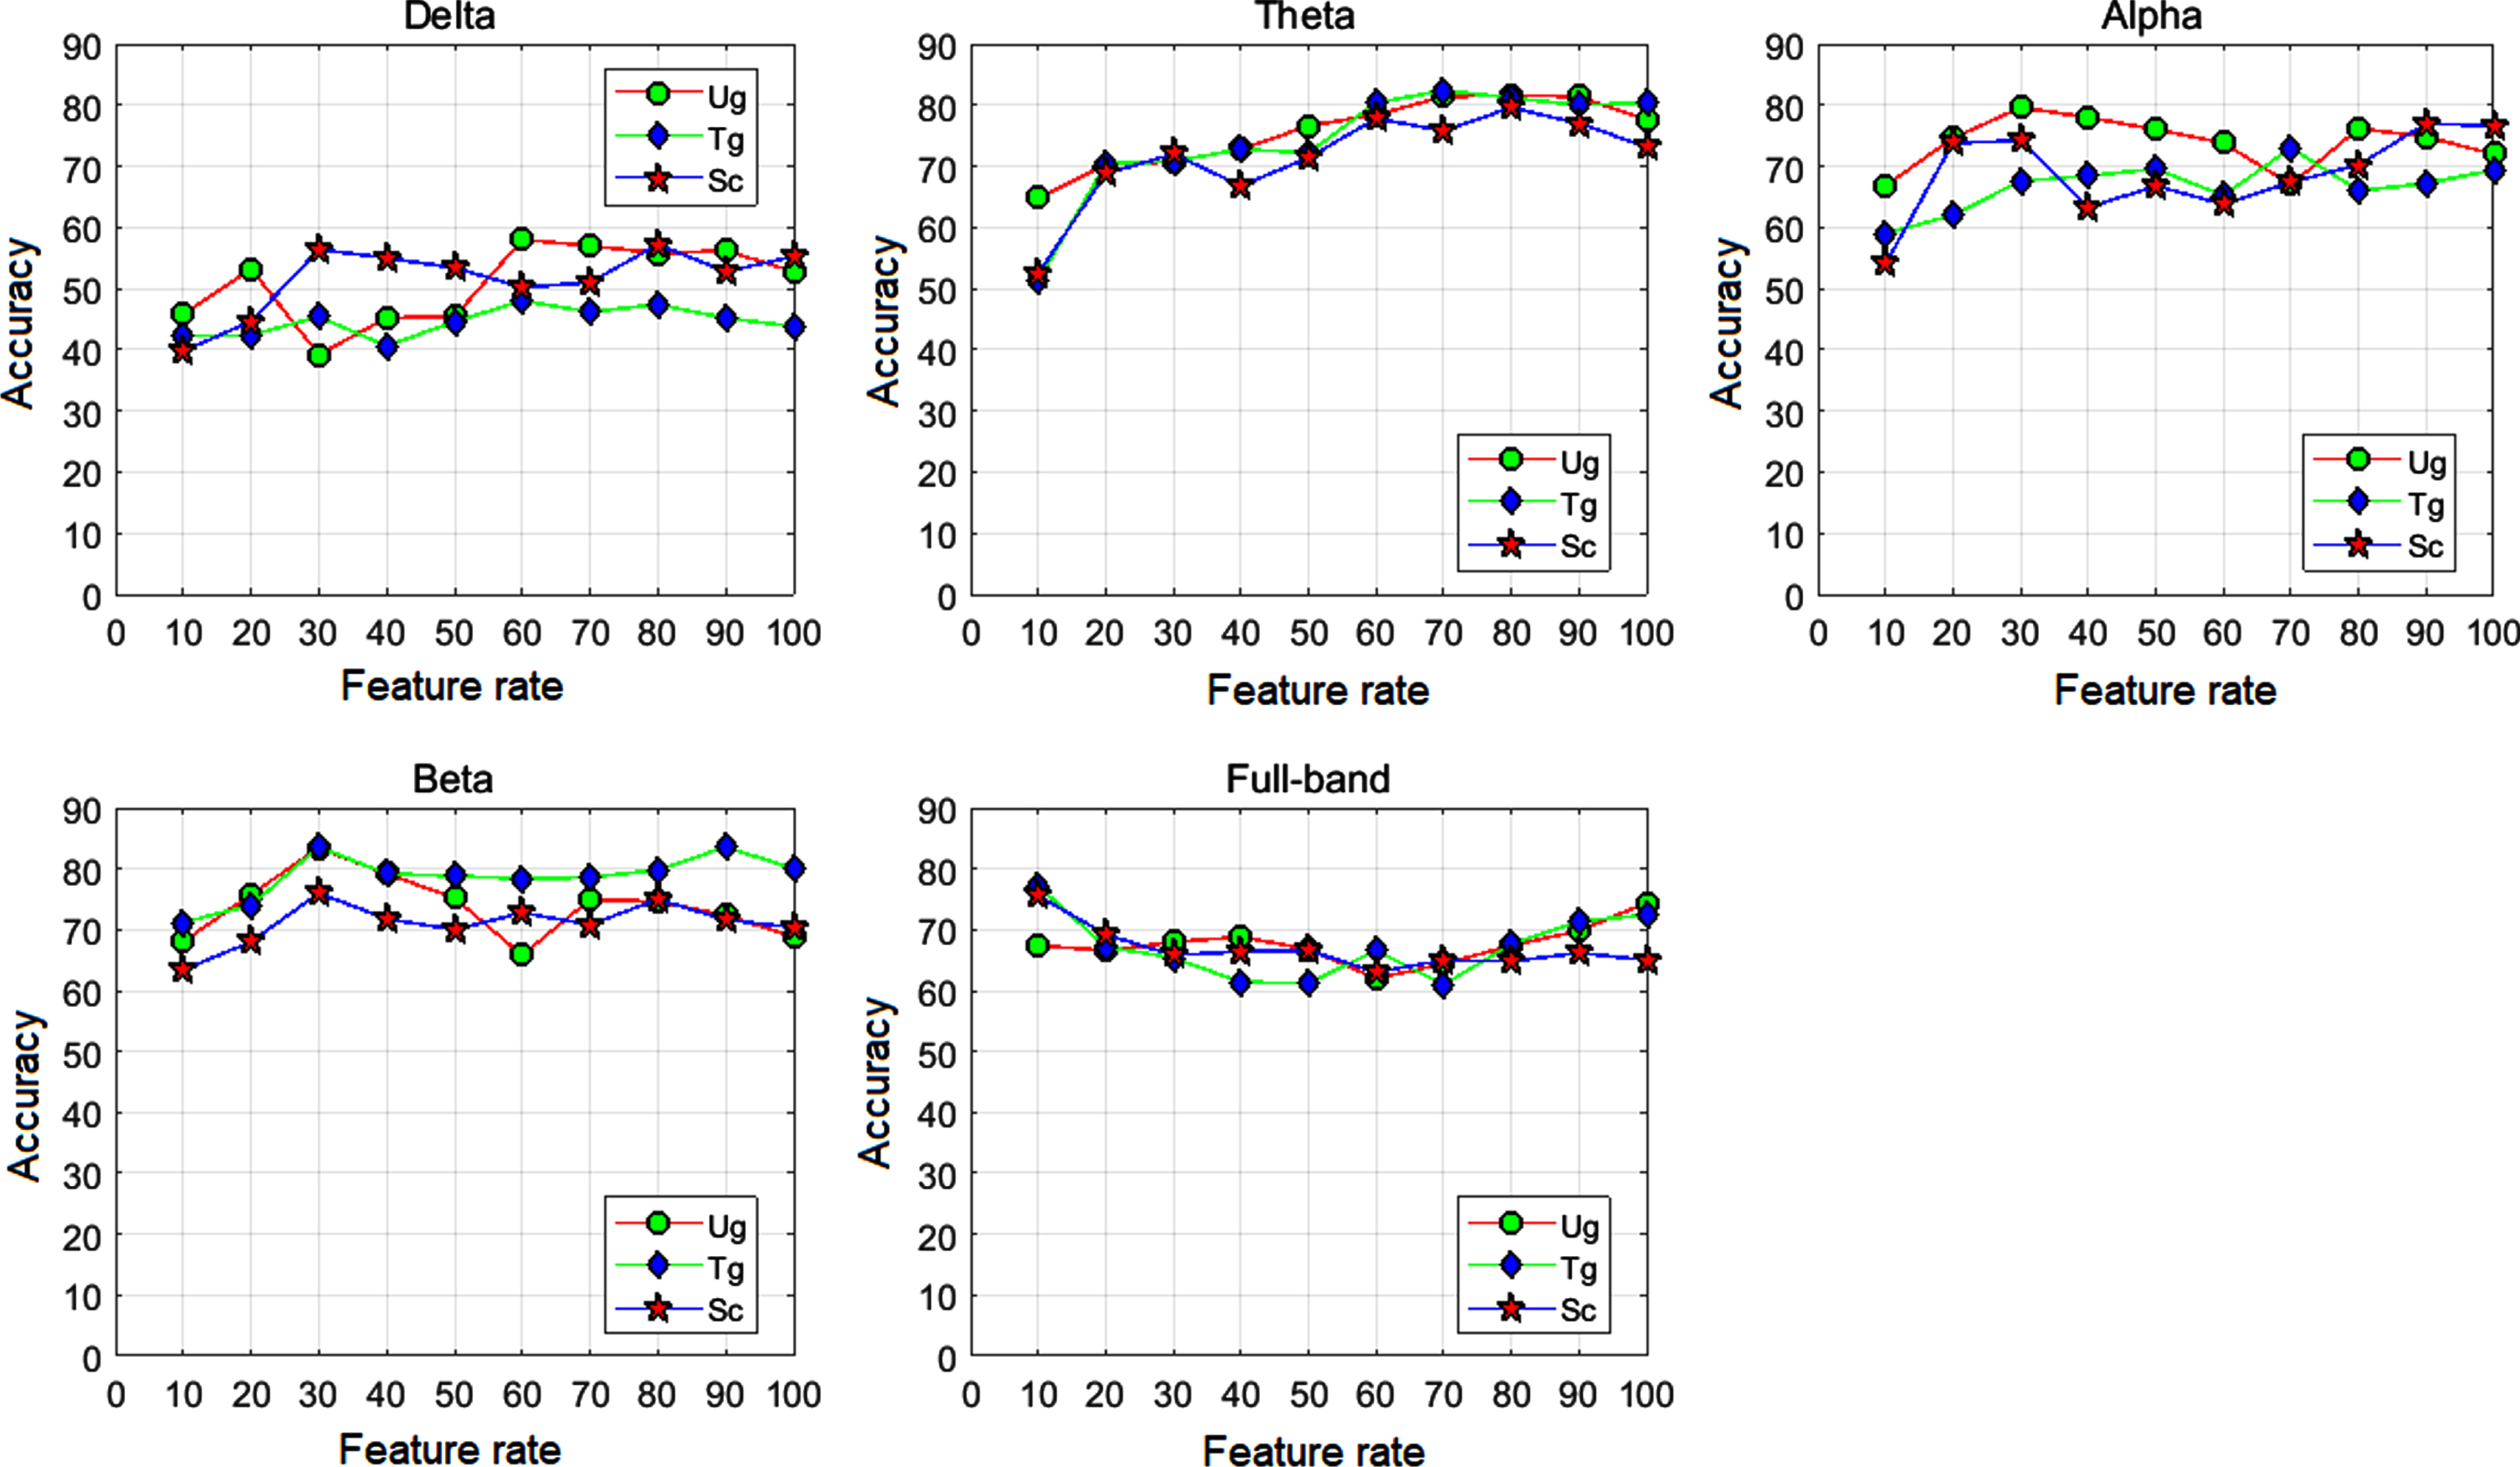
Classification accuracies with SVM classifier in different quantity features. The red, green and blue curves are the classification accuracies under the Ug, Tg and Sc conditions, respectively. The horizontal axis denotes how many features were selected to use as classification features, e.g., ‘20’ indicates that the top 20% features were used to implement machine learning task.
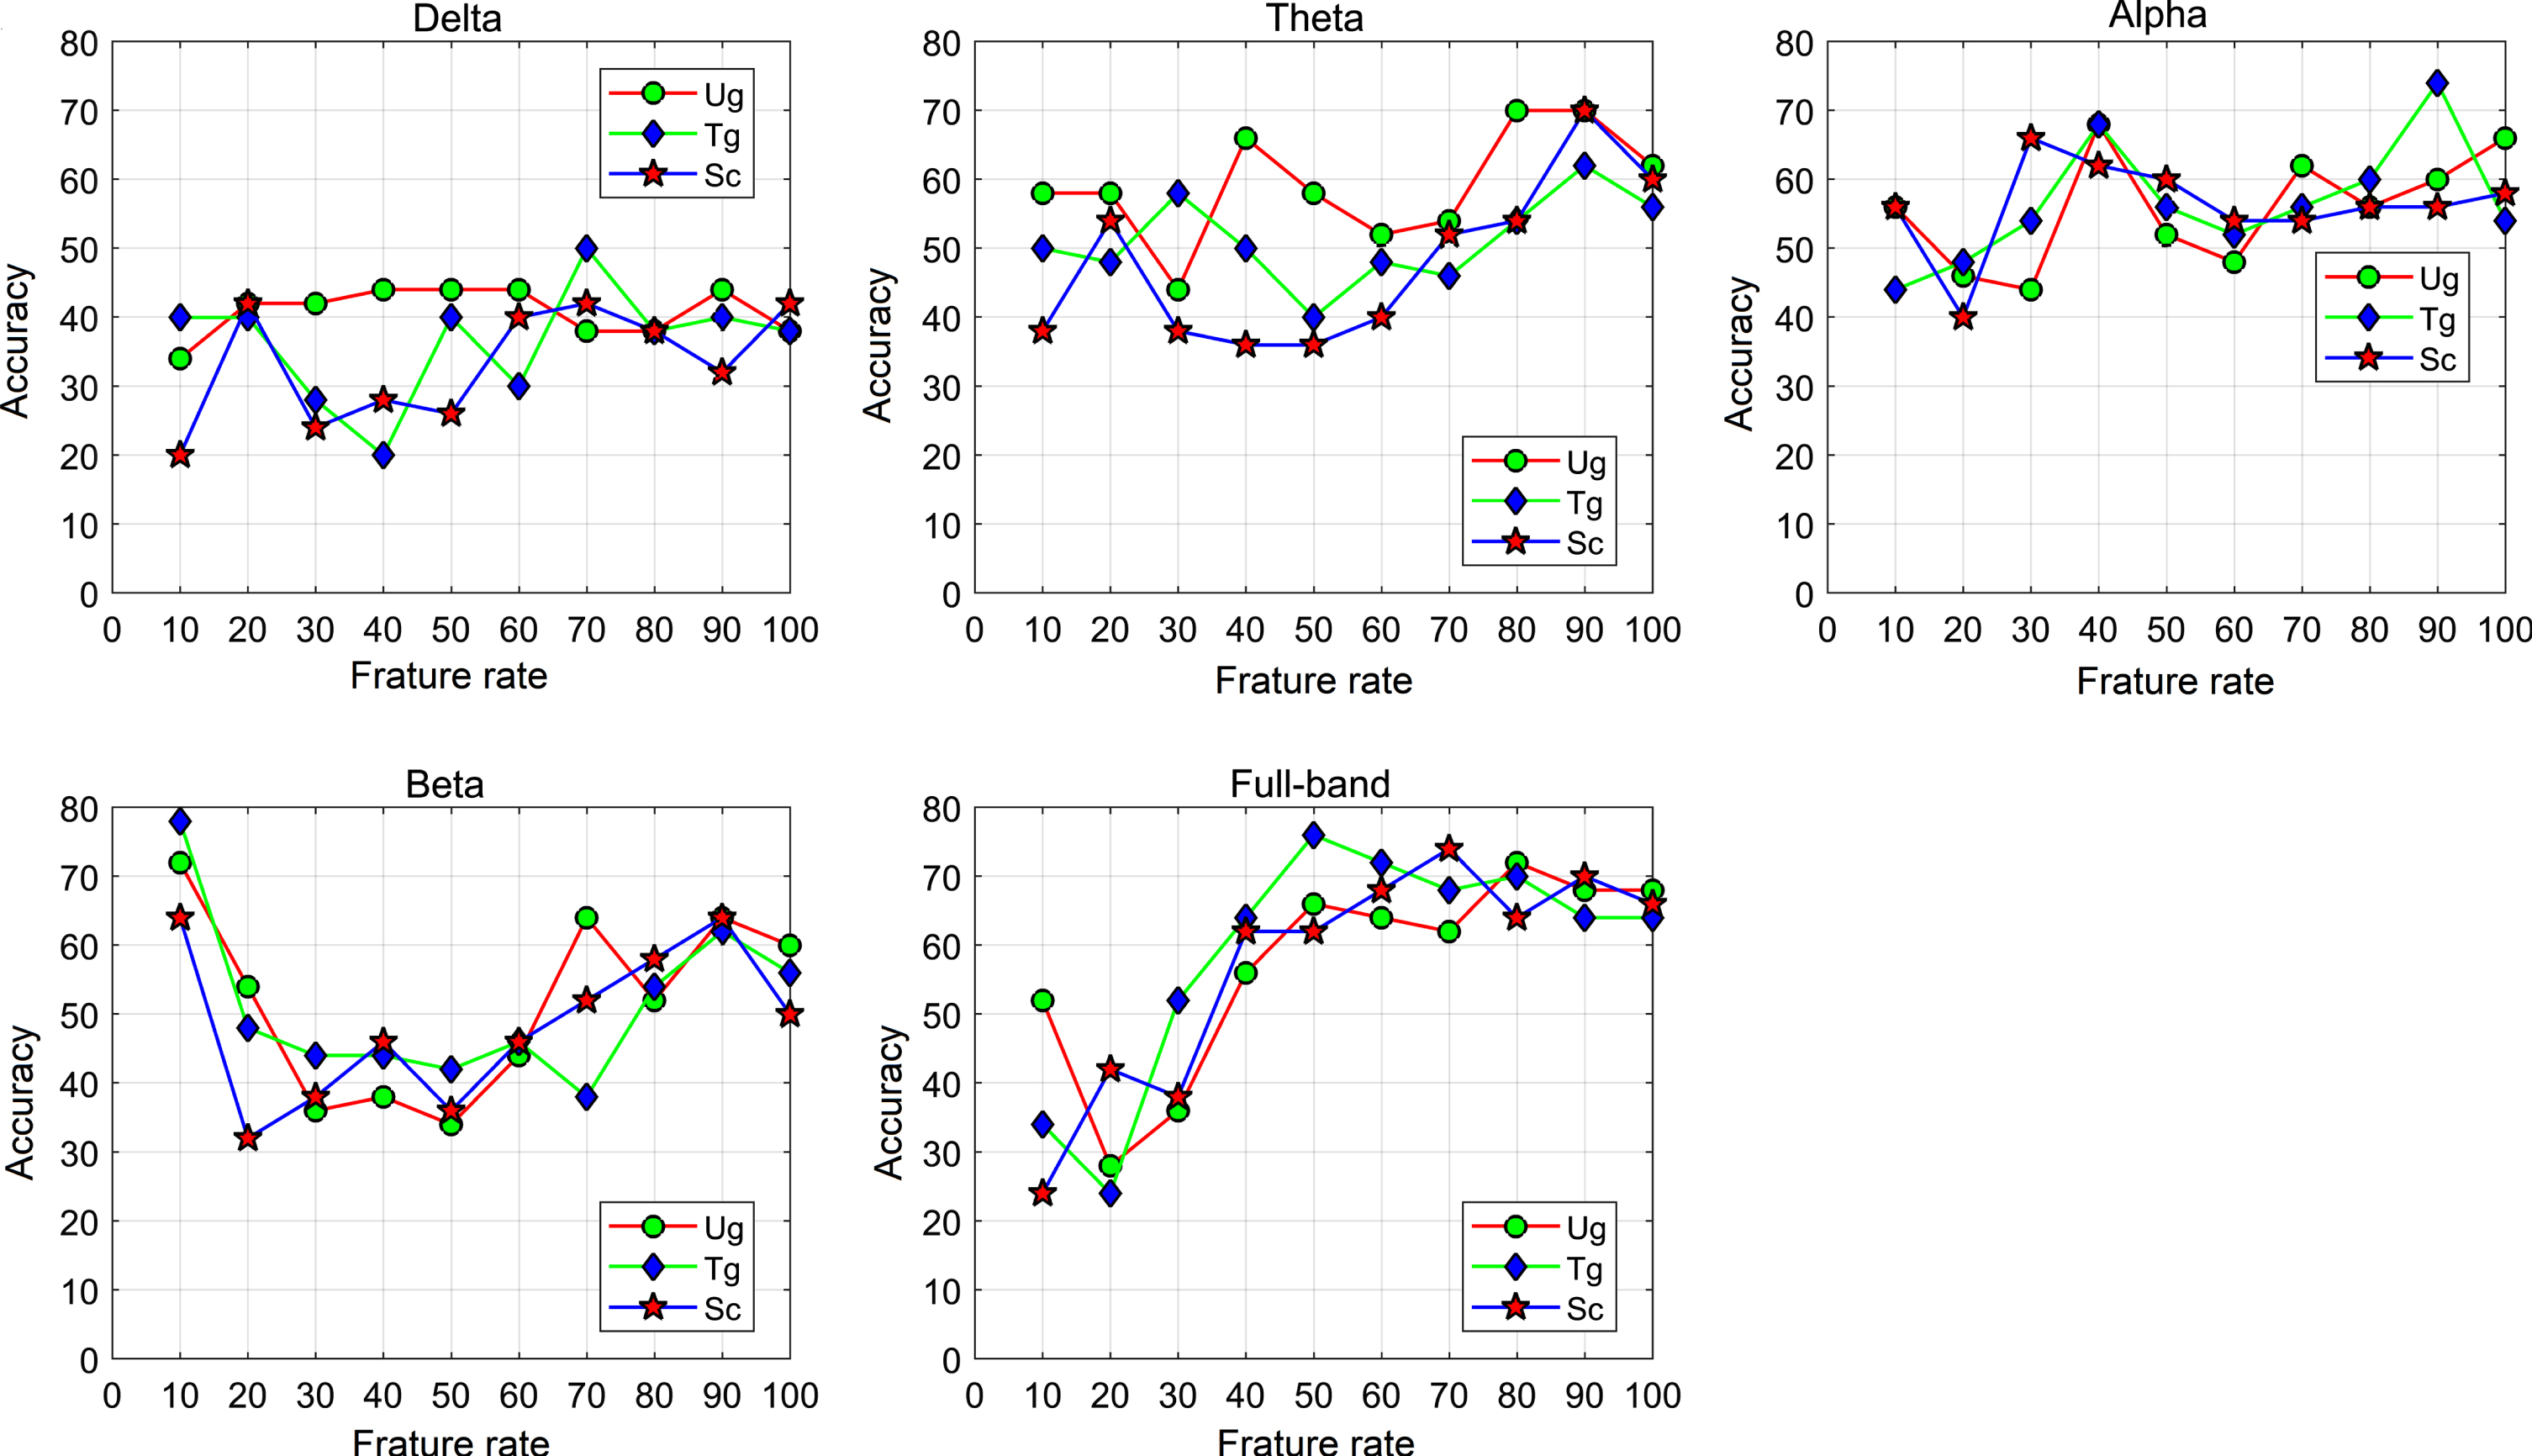
Classification accuracies with MLP classifier in different quantity features. The relevant details in this figure are the same as that in the Fig. 3.
Classification accuracies with LDA classifier in different quantity features. The relevant details in this figure are the same as that in the Fig. 3.
In the 5 subfigures on five frequency bands of Fig. 3, we can see that there exist some peaks of average classification accuracies in most conditions. For instance, the Ug on the delta frequency band achieved the highest average classification accuracy when 60% of the features were chosen to implement the classification task. The highest average classification accuracy of the alpha frequency band exceeded 70%, which used 60% of the top features. The highest average classification accuracy of the full-band exceeded 72%, which used 80% of the top features. Specifically, the two bands did not need to extract all the features to achieve the highest classification accuracy. From Fig. 4, we can see that the MLP classifier performs extremely well in most conditions. For example, the Ug on the alpha frequency band achieves an average classification accuracy 80.00% when only 30% top features are chosen to implement the classification task. Both Ug and Tg achieve the average classification accuracies over 83.00% when only 30% top features are used to classify action intention understanding EEG signals in the beta band. Especially, both Tg and Sc achieve the average classification accuracies that are near to 80% when only 10% top features are selected to carry out classification task in the full-band. As is shown in Fig. 5, we can see that the LDA classifier also performs very well, e.g., the Ug and Tg on the beta frequency band achieve the average classification accuracies approaching 80.00% when only 10% top features are chosen to implement the classification task. It is important to note that the three figures (Fig. 3–5) demonstrate that it does not need to extract all the features to achieve the highest classification accuracy in most of conditions.
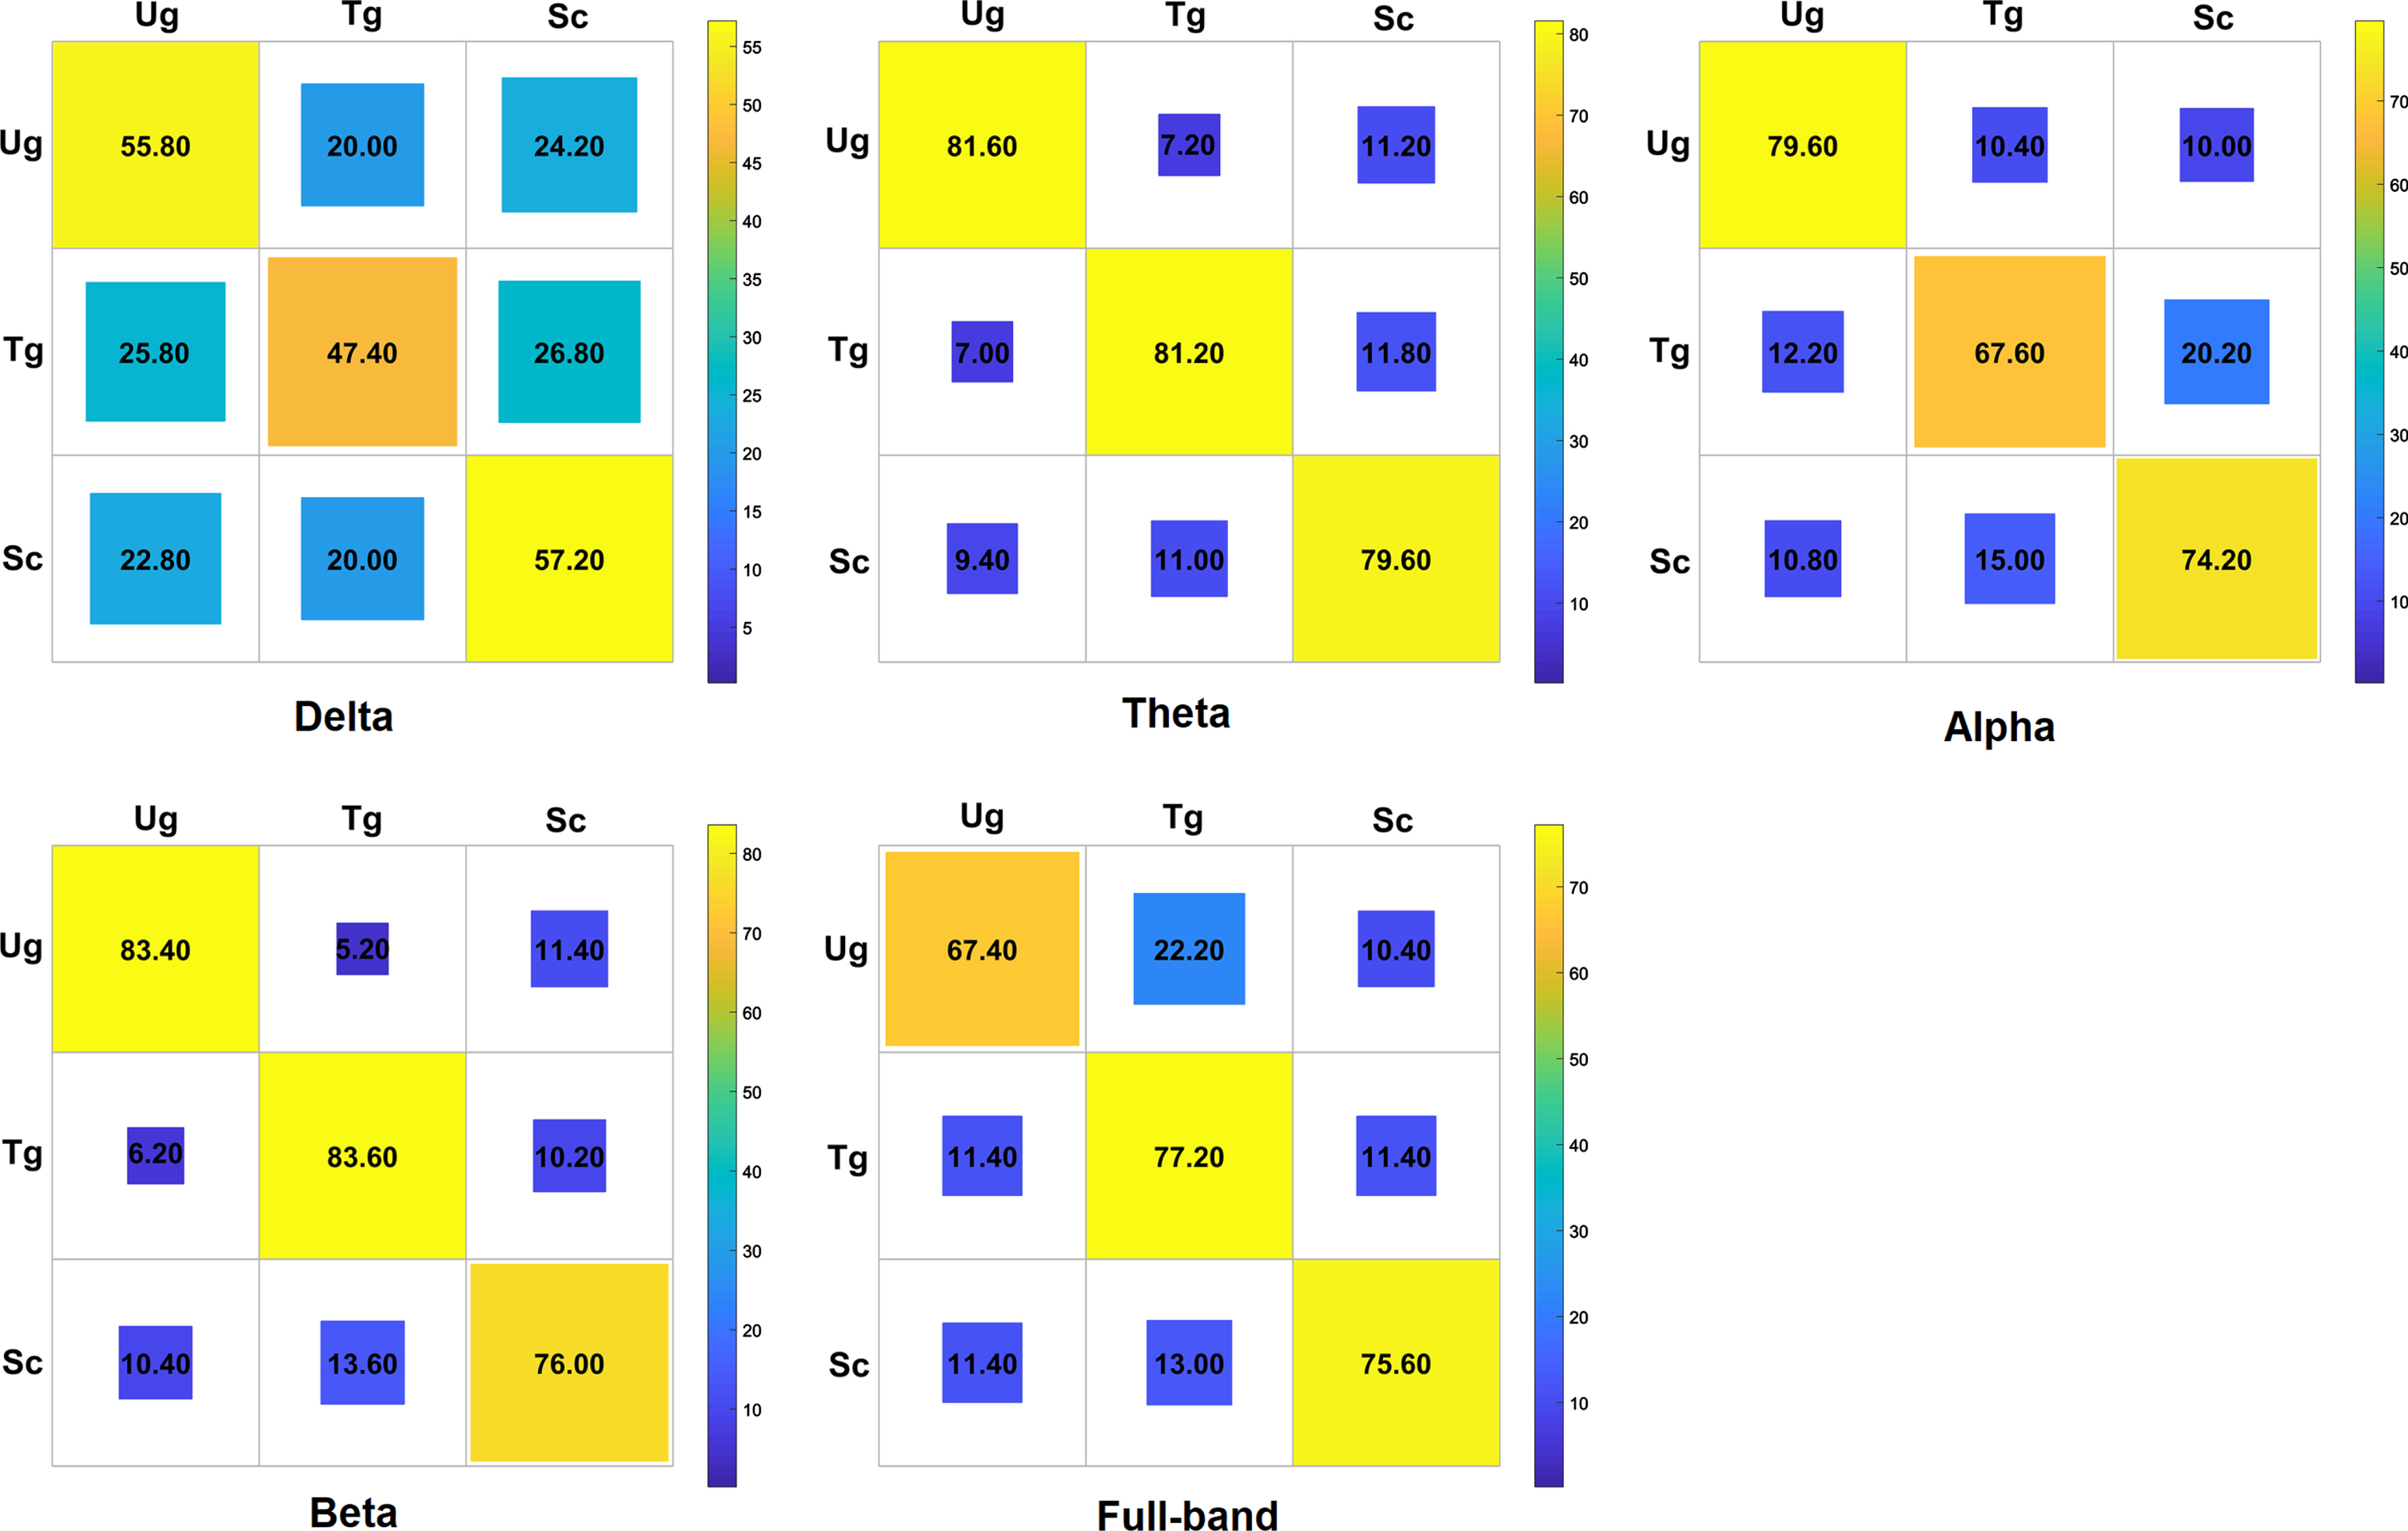
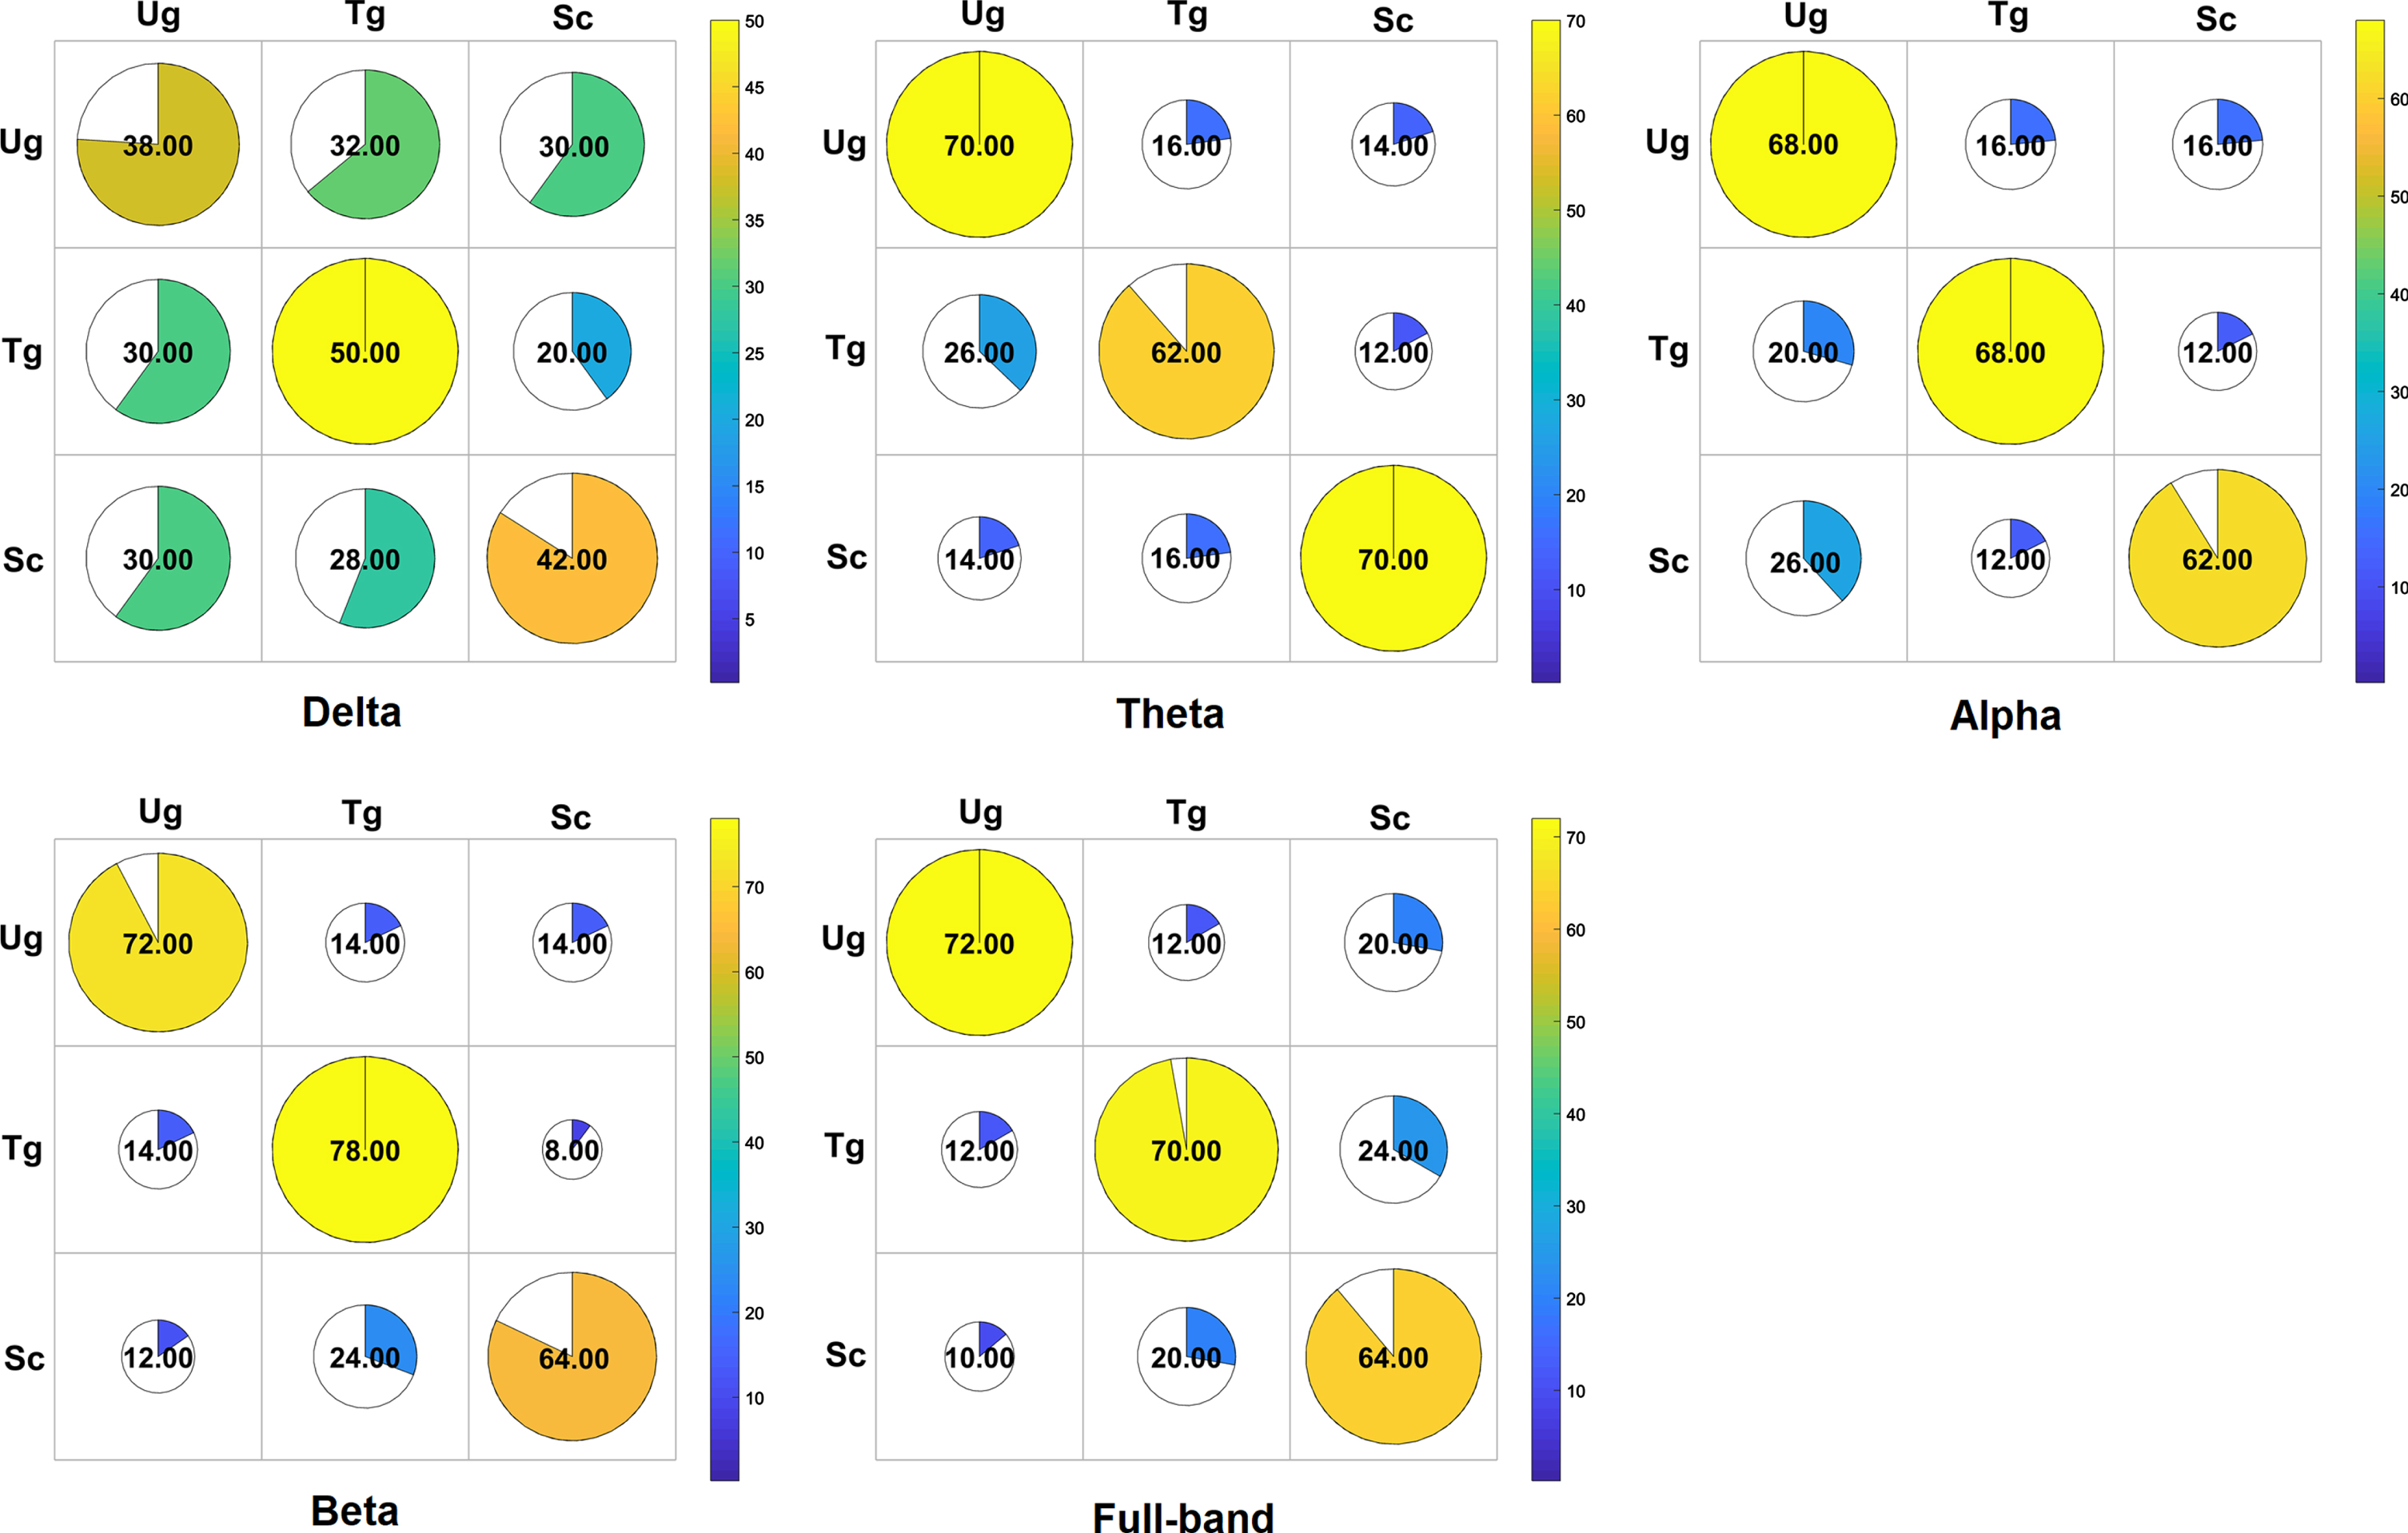
In this study, when several rounds of data processing steps were finished, the initial graph theory metrics in multiple microstate time windows were obtained. Then, we used variance analysis to extract the most useful feature dataset. Then, a multi-class classification task was implemented with the SVM, MLP and LDA classifiers. To estimate the classification efficiency, we present the best average classification accuracies on each frequency band. Figure 6, Fig. 7 and Fig. 8 show the confusion matrices on the five frequency bands.
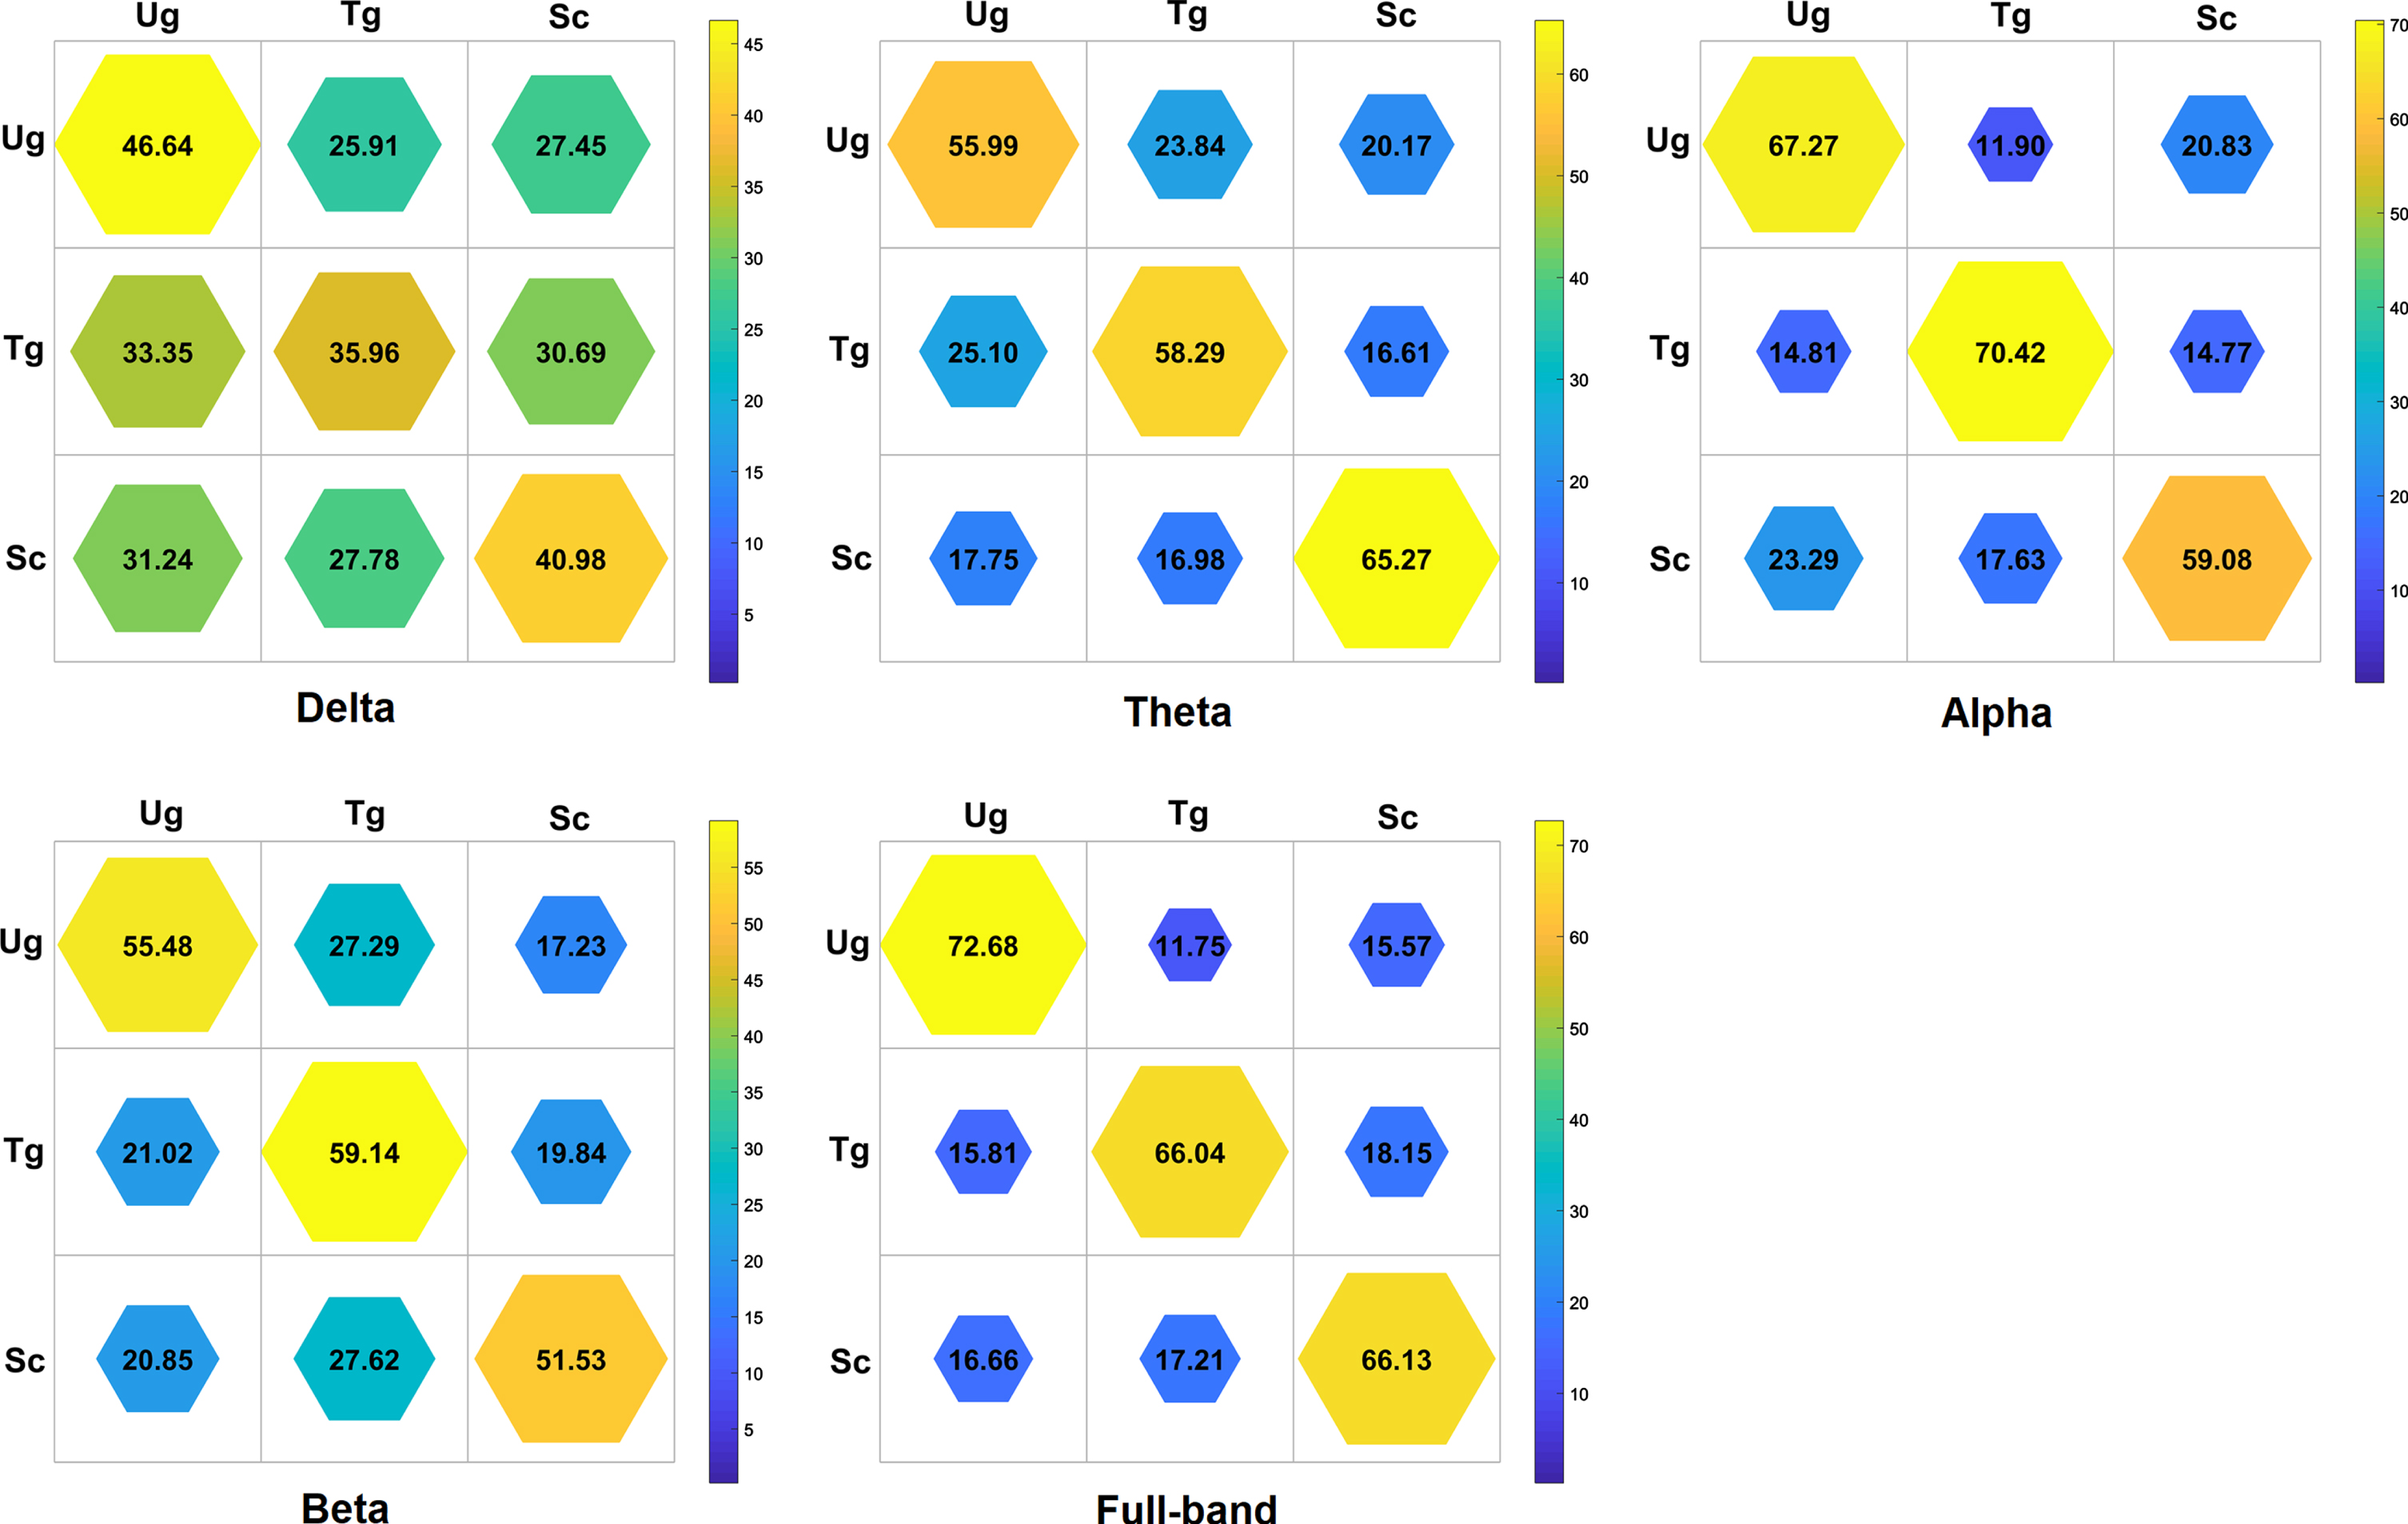
Highest average classification accuracies with SVM classifier on five frequency bands. The diagonal elements in the matrices represent the accuracies of correct classification, while others represent the probabilities of misclassification.
Highest average classification accuracies with MLP classifier on five frequency bands. The relevant details in this figure are the same as that in the Fig. 6.
Highest average classification accuracies with LDA classifier on five frequency bands. The relevant details in this figure are the same as that in the Fig. 6.
In subfigures of the Fig. 6, we can see that the alpha and full-band performed the best, and the highest average accuracies on both the alpha and full-band passed 70%. Except for the delta frequency band, the average classification accuracies on all other frequency bands were more than 50%, i.e., only the classification accuracies on the delta frequency band were below the random level. The most satisfactory result is obtained on the full-band. From subfigure 5, we can see that the average classification accuracies under the three action intention stimulus conditions, Ug, Tg and Sc, are all higher than 66%, in particular, the average classification accuracy on Ug outperforms 72%. In subfigures of the Fig. 7, except that the delta band performs poorly, all the other bands show higher classification accuracies. The delta, alpha, beta and full-band have the average classification accuracies above 70.00% in most of cases. Especially, the theta and beta bands show the average classification accuracies above 80.00% on both Ug and Tg classification tasks. In subfigures of the Fig. 8, we can also see that the delta band performs unsatisfactorily and all the other bands obtain higher classification accuracies. Most of the average classification accuracies overpass 65.00% in the delta, alpha, beta and full-band. Especially, the beta band shows the average classification accuracies above 72.00% on both Ug and Tg classification tasks, and the theta band shows an average classification accuracy of 70.00% on the Sc.
From the perspective of the new approaches themselves, the new approach can achieve the average classification accuracies of 83.40%, 83.60% and 76.00% correspond to the Ug, Tg and Sc on the beta band with MLP classifier, respectively. To more effectively evaluate our new approach, we compare the best result of the novel approach with two previous approaches [7, 8]. Table 1 shows the comparisons among these approaches. In Table 1, we can see that the novel approach only performs slightly worse than the approach proposed by Xiong et al. [8] on the Sc. However, the novel approach implements a multi-class classification task, which is more complex and difficult than the binary classification in the research of Xiong et al. It is noteworthy that the new approach performs much better than the approach proposed by Zhang et al. which carries out the binary classification task of action intention understanding brain signals. Undoubtedly, we can see that our new method has some advantages compared with the other authors’ methods.
Comparison with different methods. The Ug-vs-Tg, Ug-vs-Sc and Tg-vs-Sc denote binary classification, while Ug, Tg and Sc denote multi-classification. The symbol “#” indicates that there is no classification task. OVR and OVO denote one-versus-rest and one-versus-one classification strategies, respectively. fNIRS is the functional near-infrared spectroscopy
Comparison with different methods. The Ug-vs-Tg, Ug-vs-Sc and Tg-vs-Sc denote binary classification, while Ug, Tg and Sc denote multi-classification. The symbol “#” indicates that there is no classification task. OVR and OVO denote one-versus-rest and one-versus-one classification strategies, respectively. fNIRS is the functional near-infrared spectroscopy
This research investigates using thresholding graph metrics as classification features for the multi-class classification of brain signals related to action-intention understanding. The thresholding graph metric features are selected by several steps, which are very effectively proven by the experimental results.
We have shown the different experimental results in Fig. 3–5 and Fig. 6–8, and given out the comparison between our new method and other previous methods in Table 1. From Fig. 3–5, we know that the peak of the classification accuracy often appears at a combination of a certain number of features. It does not need to use all the features to achieve the highest classification accuracy in most of conditions. The main reason is that we have ranked the importance of features. A few top features can obtain satisfactory experimental result. The novel method has an exceedingly classification efficiency. From Fig. 6–8, we know that the alpha, beta and full-band easily obtain satisfactory average classification accuracies, which indicate that brain activities related to action intention understanding easily occur in the alpha and beta frequency band. Because the full band (1–30 Hz) contains some information of the alpha band (8–13 Hz) and beta band (13–30 Hz), this may be the reason that the full band also obtains satisfactory experimental results as the alpha frequency band. It is noteworthy that these results correspond to previous studies [7, 9], which note that action intention understanding closely correlates with the alpha frequency band.
Compared with other approaches [7, 8], the novel approach demonstrates that thresholding graph metric features are extremely effective and efficient for the multi-class classification of action intention understanding. The main reason is that it can select the most useful classification features because the classification features are selected by multiple procedures, which ensure that the useless information is discarded the best.
Our new method has some generalities, which can also be introduced into other neuroscience studies, such as motor imagery, epilepsy, Alzheimer’s disease, and mathematics genius. Strictly speaking, there are also some limitations in our study. For instance, we use the PLI and WPLI to construct functional connectivity matrices. Many kinds of algorithms can do so [8, 12], and other algorithms may obtain more satisfactory experimental results. In the future, we will attempt to adopt other advanced algorithms to implement experiments.
Conclusion
In summary, this study targets the feature extraction problem in the brain signal classification task of action intention understanding. We propose a new feature extraction procedure that contains multiple steps, which are helpful for extracting useful features and improving the multi-classification accuracy. Our new method has some potential application value.
Footnotes
Acknowledgments
The authors would like to thank the anonymous reviewers for their useful advices, and thank Dr. Yue Leng for collecting the EEG data.