
Abstract
Data clustering based on regression relationship is able to improve the validity and reliability of the engineering data mining results. Surrogate models are widely used to evaluate the regression relationship in the process of data clustering, but there is no single surrogate model that always performs the best for all the regression relationships. To solve this issue, a fuzzy clustering algorithm based on hybrid surrogate model is proposed in this work. The proposed algorithm is based on the framework of fuzzy c-means algorithm, in which the differences between the clusters are evaluated by the regression relationship instead of Euclidean distance. Several surrogate models are simultaneously utilized to evaluate the regression relationship through a weighting scheme. The clustering objective function is designed based on the prediction errors of multiple surrogate models, and an alternating optimization method is proposed to minimize it to obtain the memberships of data and the weights of surrogate models. The synthetic datasets are used to test single surrogate model-based fuzzy clustering algorithms to choose the surrogate models used in the proposed algorithm. It is found that support vector regression-based and response surface-based fuzzy clustering algorithms show competitive clustering performance, so support vector regression and response surface are used to construct the hybrid surrogate model in the proposed algorithm. The experimental results of synthetic datasets and engineering datasets show that the proposed algorithm can provide more competitive clustering performance compared with single surrogate model-based fuzzy clustering algorithms for the datasets with regression relationships.
Keywords
Introduction
With the advent of the data-intensive times, the monitoring of engineering systems is becoming increasingly perfect. The measured data not only record the operation process of engineering systems but also involve the internal mechanism of engineering systems. Mining these engineering data can help the design, analysis, operation, and maintenance of engineering systems. The operation state of engineering systems often changes to meet the requirements of different working conditions, resulting in the different features of engineering data. It is necessary to partition these engineering data to ensure the validity and reliability of the analysis results. However, most engineering data are usually not labeled, which leads that the engineering data need to be partitioned based on their internal characteristics. Data clustering is one of the mature tools to accomplish this work, which has been successfully applied in the data mining tasks such as data classification [1–4], anomaly detection [5, 6], and image segmentation [7, 8]. It is a task to group the data into clusters so that the patterns within the same cluster are more similar than those within different clusters [9]. Fuzzy clustering is a branch of clustering methods and algorithms. It is developed based on fuzzy set theory, in which the most well-known one is fuzzy c-means algorithm (FCM). Fuzzy c-means algorithm is an objective function-based fuzzy clustering method which partition a set of object data {x1, … , x
n
}
Through minimizing (1) with constraint (2), the clustering results can be obtained. It can be found that there are two key problems in the objective function-based fuzzy clustering method as shown in Equation (1). One is the minimization of the clustering objective function, and the other one is the evaluation of the similarity between data. The first problem is usually solved by Lagrange multiplier method or heuristic algorithms [10]. For the second problem, Euclidean distance is mostly used to evaluate the similarity between data. In addition, a variety of distance metrics have been introduced to replace Euclidean distance to improve the clustering results as well. Dey [11] designed a clustering objective function based on the sum of the entropy of Euclidean distance. Carvalho [12] used Quadratic distance to replace Euclidean distance and compared the proposed algorithm with FCM through numerical cases and real-world datasets. Liu [13] introduced Mahalanobis distance into fuzzy clustering algorithm and found that Mahalanobis distance can provide better clustering results when the scale of attributes is greatly different from each other. Gueorguieva [14] proposed a method to solve the solution instability problem of Mahalanobis distance by fixing the maximum and minimum eigenvalues of the covariance matrix. Kiraly [15] proposed a fuzzy clustering algorithm based on Geodesic distance for the division and planning of map paths.
In recent years, fuzzy clustering algorithms have been widely used in engineering data analysis. Mota [16] used fuzzy clustering algorithm to assist decision-making regarding the control of variables in compost bedded pack barns. Song [17] developed a time series segmentation method based on the framework of FCM and used it to segment the time series of a complex mechanical system. Majumder [18] utilized a fuzzy clustering algorithm for the multi-sensors data fusion to reduce the imprecision and uncertainty of the sensory data. Arora [19] proposed an enhanced spatial intuitionistic fuzzy c-means algorithm for image segmentation. Lin [20] used fuzzy clustering algorithm to mine the historical meteorological data to forecast air pollutant concentrations and environmental factors. The above-mentioned works provide insights into the availability and potential of fuzzy clustering algorithms for benefiting engineering systems. For engineering data, the difference between each other is more reflected in the regression relationship, and many data mining tasks of engineering data are depending on their regression relationship as well. However, most similarity metrics used in the current fuzzy clustering algorithms are based on the spatial distance or the mapped high-dimensional spatial distance, which results that it is difficult to ensure that the data of the same part have a similar regression relationship. To realize data clustering based on regression relationship, the most important problem is the evaluation of the regression relationship. However, the regression relationship of engineering data is usually unknown and very complicated, so it is difficult to evaluate by explicit formulas. This limitation can be addressed by adopting surrogate models, which can build the regression relationship based on small numbers of samples. The commonly used surrogate models are support vector regression (SVR), radial basis function (RBF), Kriging method (KRG), and response surface (RS). Ren [21] used SVR to model the actual flight data of an aero-engine to help its design and analysis. Li [22] used SVR to replace the finite element model of a dental implant to predict the stress at the interface between bone and implant. Serina [23] utilized RBF to replace expensive computational fluid dynamics computer simulations for the resistance optimization problems of a hydrofoil and a destroyer-type vessel. Halali [24] used RBF to estimate the pressure gradient in water-oil pipelines based on the experimental data. Lu [25] used KRG to predict the actual stiffnesses of a bridge. Lee [26] used KRG to replace the massive computer simulations in the reliability-based design optimization. Toft [27] assessed the site suitability of wind turbines based on RS and the aero-elastic simulations. Lmalghan [28] used RS to model the machining process of aluminum alloy. Through a number of engineering experiments and applications, the researchers find that no single surrogate model always performs the best for all engineering practices [29, 30]. Hybrid surrogate model, as an ensemble of multiple surrogate models, is proposed to solve this issue [31, 32]. The experimental results of numerical and engineering problems indicate that hybrid surrogate model is able to take advantage of different surrogate models to achieve higher regression accuracy. In this work, we proposed a clustering algorithm based on hybrid surrogate model (named the HSM-FC algorithm), in which the adaptive combination of multiple surrogate models is used to improve the data partition accuracy. The proposed algorithm is compared with single surrogate model-based fuzzy clustering algorithms through a number of synthetic and engineering datasets. In addition, the computational cost and convergence performance of the proposed algorithm are explored as well. The contributions of this work are as follows: 1) The regression relationship is used to replace the conventional similarity metrics based on spatial distance to constitute the clustering objective function, which realizes the data partition according to the regression relationship; 2) Hybrid surrogate model is used to evaluate the regression relationship. Through the adaptive combination of multiple surrogate models, the data partition accuracy is improved.
The rest of this paper is organized as follows. Section 2 describes the fuzzy c-means algorithm, the proposed algorithm and the optimization method to its clustering objective function. In Sections 3, the synthetic datasets are used to test the performance of the proposed algorithm. Section 4 presents the clustering results produced for several engineering datasets. Some conclusions are given in Section 5.
Fuzzy c-means algorithm (FCM)
Fuzzy c-means algorithm is a well-known algorithm to cluster data in unsupervised learning [33]. It partitions a given set of object data {x1, x2, . . . , x
n
}
ui,k is the membership that represents the degree which xk belongs to the i-th cluster and satisfies the following condition,
The necessary conditions for minimizing (3) with the constraint (2) result in the following iterative update formulas for the prototypes and the partition matrix:
The iterations are carried out until the changes in the values of the partition matrix reported in consecutive iterations are lower than a certain predetermined threshold.
In this section, a fuzzy clustering algorithm based on hybrid surrogate model is proposed. The proposed clustering objective function is defined as follows,
xobj,k is the output attribute that is selected by the user, and
where x1,k, … x(obj-1),k, x(obj+1),k, …, xd,k are the input attributes. The surrogate models are constructed using the data with membership higher than the membership criteria θ. Formally, the proposed clustering algorithm, called hybrid surrogate model-fuzzy clustering algorithm (HSM-FC) is characterized in the following way.
where λ is the Lagrange multiplier. The first derivatives of (13) with respect to ui,k and λ equal to zero, yielding
From (14) we obtain
Substituting (17) in (16), the ui,k in (11) can be obtained.
Fixed ui,k, we derive wi,j, and the Lagrangian function is designed as follows
By setting the first derivatives of (18) with respect to wi,j and ξ to zero, the following equations can be obtained
Thus
And, by considering (21)
By replacing (22) in (21), the wi,j in (12) can be obtained.
In each iteration, the surrogate models are updated based on the clustering results of the previous iteration. The j-th surrogate model of the i-th cluster is built based on the data with the corresponding membership higher than the membership criteria θ. The total procedure of the proposed HSM-FC algorithm is described as follows.
Step (1) Setting the clustering number c, the objective attribute x obj , and the iteration number g = 1;
Step (2) Initializing the weight matrix of surrogate models
Step (3) For each cluster, selecting the data with membership higher than the membership criteria θ, and use them as the training data;
Step (4) Checking whether a training dataset is empty, if yes, creating a new membership matrix
Step (5) Using the training data of the i-th cluster to build the corresponding surrogate models;
Step (6) Using the obtained surrogate models from Step (5) to get the responses of all the data;
Step (7) Calculating the membership matrix
Step (8) If ∀i, k: max
In the proposed algorithm, the membership criteria θ is updated as follows
Dataset generation and experiment settings
To thoroughly test the performance of the HSM-FC algorithm, 10 synthetic datasets are in this section. Each dataset is given a denomination by the number of object data, the number of attributes, and the regression relationship. For instance, N400A2F1 denotes that the dataset contains 400 object data and can be divided evenly into two clusters; A2 denotes the dataset has two attributes; F1 represents the regression relationship among attributes. The details of the 10 synthetic datasets are listed in Appendix A. The synthetic dataset is generated as follows. For each cluster, the input attributes of the i-th cluster are first sampled using Latin hypercube sampling method. For each datum, the output attribute is calculated according to the setting regression relationship and added with a random value. After that, the data of different clusters are combined as the obtained synthetic dataset.
In the experiments, fuzzy c-means algorithm and four single surrogate model-based fuzzy clustering algorithms including support vector regression, Kriging method, radial basis function, and response surface-based fuzzy clustering algorithms (short for SVR-FC, KRG-FC, RBF-FC, and RS-FC, respectively) are first used to cluster the synthetic datasets to select the surrogate models used in the HSM-FC algorithm. The details of single surrogate model-based fuzzy clustering algorithm can be found in Ref [34] and Appendix B. The parameters are set as follows: the fuzzification parameter m is 2, the threshold value is 10-6, the maximum iteration is 50, the membership criteria θ for the SVR-FC, KRG-FC, RBF-FC, and RS-FC algorithms is 0.5. For each dataset, the experiments are conducted 30 times, and the clustering performance is evaluated through the following cluster validity indexes. The first cluster validity index is misclassification rate (MS), which is defined as follows:
Adjusted rand index (ARI) is used to evaluate the clustering performance [35]. Given a set S of n elements, and two partitions of these elements, namely X ={ X1, X2, … , X
s
} and Y ={ Y1, Y2, …, Y
s
}, the overlap between X and Y can be summarized in a contingency table [n
ij
] where each entry n
ij
denotes the number of objects in common between X
i
and Y
j
: n
ij
= |X
i
∩ Y
j
| as shown in Table 1. Adjusted rand index is defined as follows:
Contingency table
Average MS of the synthetic datasets
The closer ARI to 1, the higher cluster validity. The third cluster validity index is normalized mutual information (NMI) [36] which is defined as follows:
The average results of 30 times experiments for the 10 synthetic datasets are shown in Tables 2-4, in which the bold blue numbers represent the best results of the single surrogate model-based clustering algorithms, and the bold red numbers represent the best results among all the clustering algorithms. It can be found that the mean cluster validity indexes of the SVR-FC, KRR-FC, RS-FC algorithms are much better than those of FCM. The clustering results of SVR-FC and RS-FC are better than FCM for all the synthetic datasets. The KRG-FC algorithm provides good results for low-dimensional synthetic datasets but exhibits worse clustering performance for high-dimensional synthetic datasets compared with FCM. It is because Kriging method establishes the regression model based on Gaussian process which is difficult to accurately describe the regression relationship among various attributes. The performance of the RBF-FC algorithm is worse than FCM. For the synthetic datasets tested in this section, the number of samples is much higher than the number of attributes. The solution of RBF is easy to be unstable, so the regression models built in the RBF-FC algorithm cannot effectively describe the regression relationship. Thus, the RBF-FC algorithm cannot provide accurate clustering results for most synthetic datasets. Similar results can be found in Tables 3 and 4.
Average ARI of the synthetic datasets
Average ARI of the synthetic datasets
Average NMI of the synthetic datasets
From the experimental results and analysis above, it can be seen that the SVR-FC and RS-FC algorithms exhibit much better clustering performance than the other algorithms. Thus, support vector regression and response surface are used to construct the hybrid surrogate model in the proposed algorithm. The parameters of the HSM-FC algorithm are set as follows: the fuzzification parameter m is 2, the threshold value is 10–6, the maximum iteration is 50. For each synthetic dataset, the experiments are conducted 30 times, and the average results are shown in Tables 2∼4 as well. It can be found that the HSM-FC algorithm achieves better cluster validity indexes than the SVR-FC and RS-FC algorithms for most synthetic datasets except N400A5F6 dataset, which indicates that the HSM-FC algorithm is able to take advantage of support vector regression and response surface to obtain accurate clustering results.
Average running time of the synthetic datasets (s)
To compare the computation cost of the HSM-FC algorithm with single surrogate model-based fuzzy clustering algorithms, the average running time of 30 times experiments of the synthetic datasets are shown in Table 5 (CPU: Intel Core i7-10700KF, RAM: 32 G). From this table, it can be found that the SVR-FC algorithm has the highest running time among the single surrogate model-based fuzzy clustering algorithms. It is mainly because that the computational cost of support vector regression is much higher than Kriging method, radial basis function, and response surface when the sample size is significantly higher than the dimension of input [37]. The proposed HSM-FC algorithm has less running time than the SVR-FC algorithm, but more running time than the KRG-FC, RBF-FC, and RS-FC algorithms. The hybrid surrogate model utilizes multiple surrogate models to evaluate the regression relationship of data, which result in that regression accuracy and the computational cost increase simultaneously. But the accurate regression relationship can be obtained through fewer iterations by the help of hybrid surrogate models, so the computational cost of the proposed HSM-FC algorithm is less than the SVR-FC algorithm. Finally, we concentrate on the convergence of the HSM–FC algorithm. The convergence curves shown in Appendix C demonstrate the convergence of the HSM–FC algorithm. It can be found that the values of the clustering objective function of the proposed algorithm decrease rapidly within the initial iterations and then tend to converge gradually. The alternation optimization method of the proposed algorithm is similar to that for FCM. The HSM–FC algorithm can achieve convergence as discussed in Ref [38].
Mill dataset
The Mill dataset is from three experiments running on a milling machine under different operating conditions [39]. Data sampled by three different types of sensors (acoustic emission sensor, vibration sensor, current sensor) are acquired at several positions, in which the DC spindle motor current, AC spindle motor current, table vibration, spindle vibration, acoustic emission at table, and acoustic emission at spindle of each experiment are recorded. The initial data have 9000 samples. In this paper, we choose the datum every 60 data (1, 61, 121,..., 8941), and only the data of the milling process is retained. Finally, the used dataset has 300 samples and includes three classes. The details of the mill dataset used in this section are shown in Table 6.
Details of Mill dataset
Details of Mill dataset
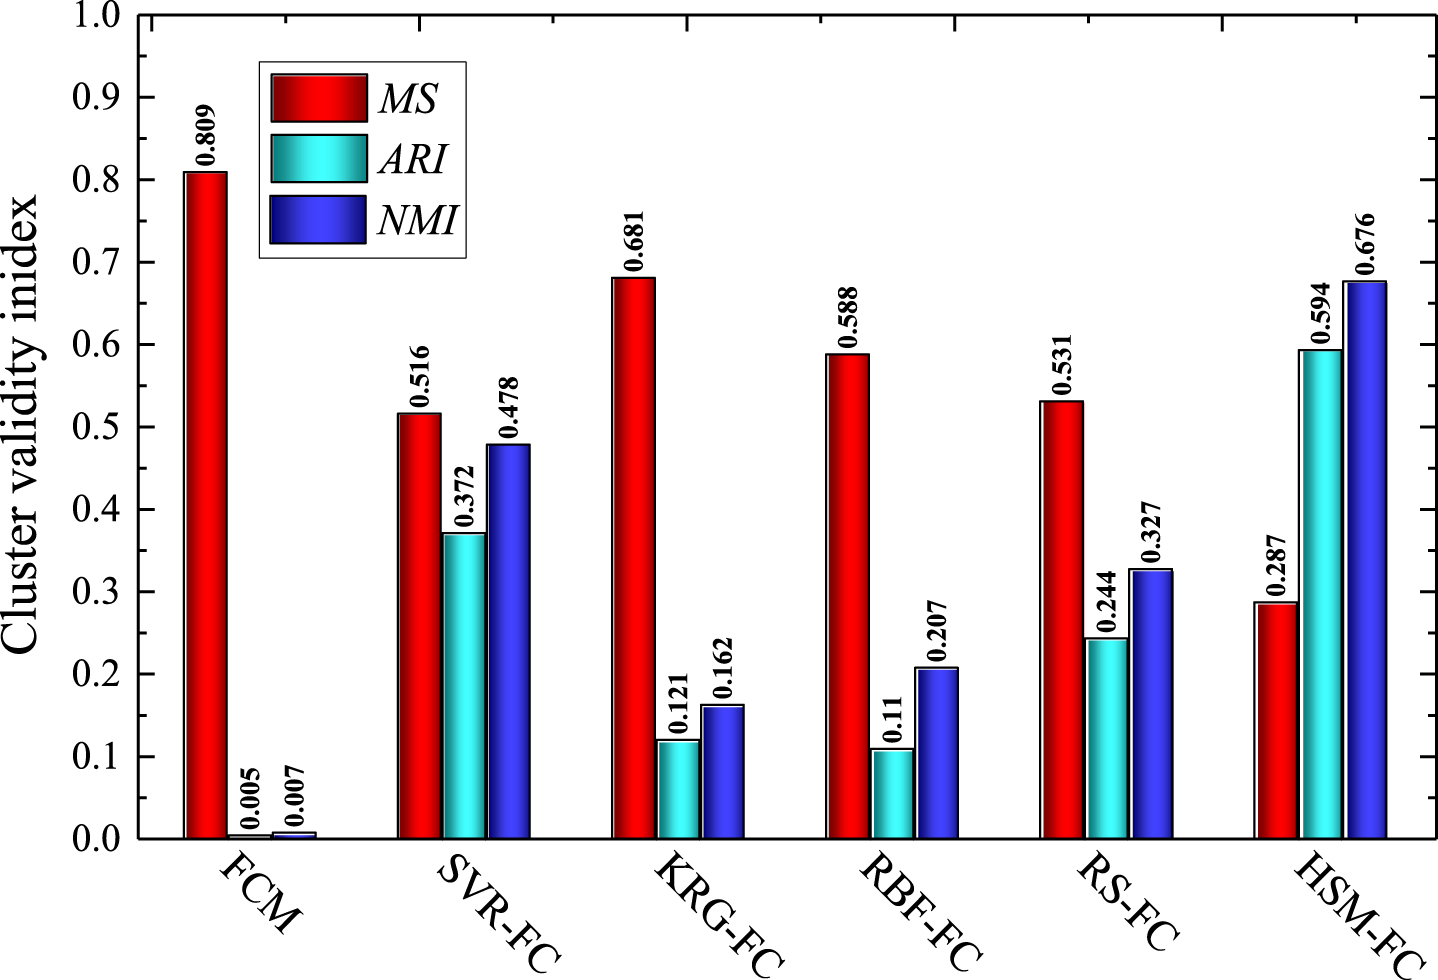
The parameters of the clustering algorithms are set as follows: the fuzzification parameter m is 2, the threshold value is 10–6, the maximum iteration is 50, the membership criterion θ for the SVR-FC, KRG-FC, RBF-FC and RS-FC algorithms is 0.33. The DC spindle motor current is set as the output attribute, and the AC spindle motor current, table vibration, spindle vibration, acoustic emission at table, and acoustic emission at spindle are set as the input attributes. The obtained clustering results are shown in Fig. 1. It can be found that the HSM-FC algorithm produces the smallest misclassification rate, the highest adjusted rand index and normalized mutual information. The proposed algorithm is able to provide competitive clustering results for the Mill dataset.

Clustering results of the Mill dataset.
Details of Battery discharge dataset
Clustering results of the Battery discharge dataset
The Battery discharge dataset is provided by the Prognostics CoE at NASA Ames [40]. The dataset records two discharging processes of a Li-Ion battery, which have 192 samples and 190 samples respectively. Each datum involves the voltage, current, and temperature of the Li-Ion battery (Table 7). The parameters of the experiments are set as follows: the fuzzification parameter m is 2, the threshold value is 10–6, the maximum iteration is 50, the membership criterion θ is 0.5 for the single surrogate model-based fuzzy clustering algorithms. The temperature is set as the output attribute, and the voltage and current are set as the input attributes. The obtained clustering results are shown in Table 8. From this table, it can be found that the HSM-FC algorithm produces the best clustering results. The proposed algorithm is able to provide competitive clustering results for the Battery discharge dataset.
Borehole dataset
The borehole dataset comes from the water flow rate problem [41]. The dataset has 1500 samples and can be evenly divided into five clusters according to the radius of borehole. The attributes of the Borehole dataset are listed in Table 9.
Details of the borehole dataset
Details of the borehole dataset
Clustering results of the Borehole dataset.
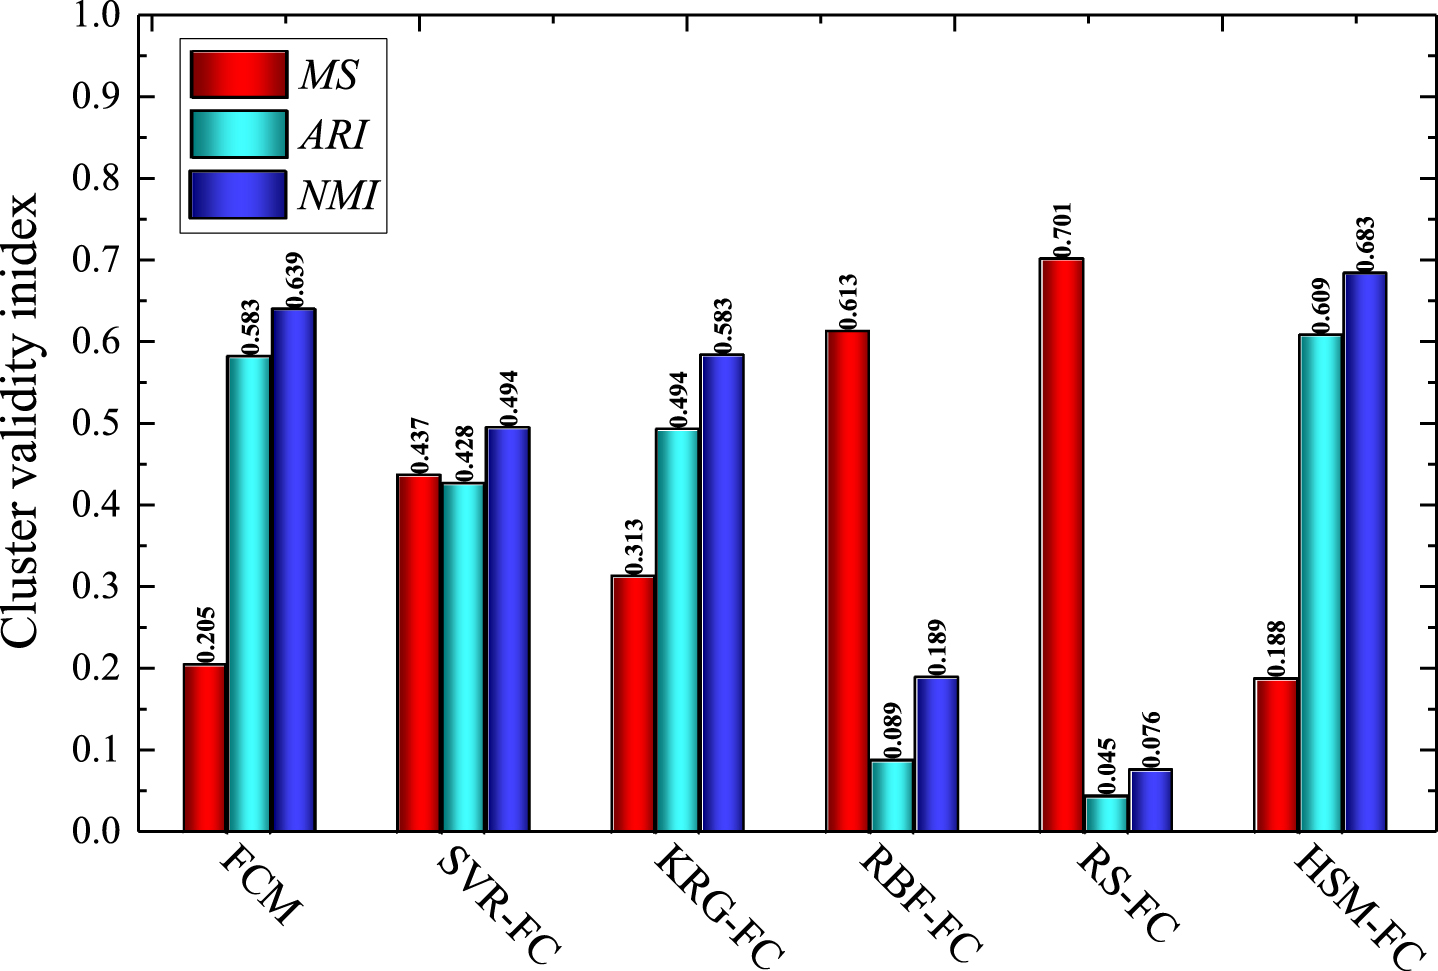
In the experiment, the water flow rate is set as the output attribute, and the other attributes are set as the input attributes. The experimental parameters are set as follows: the fuzzification parameter m is 2, the threshold value is 10–6, the maximum iteration is 50, the membership criterion θ is 0.2. The clustering results are shown in Fig. 2. It can be seen the misclassification rate of the HSM-FC algorithm is 0.287, which is much smaller than the other clustering algorithms, and it also achieves the best results for the cluster validity indexes ARI and NMI. The proposed HSM-FC algorithm can take advantage of different surrogate models to provide better clustering performance than the single surrogate model-based fuzzy clustering algorithms for the Borehole dataset.
The Piston dataset comes from the simulation of a piston moving with a cylinder, developed by Kenett and Zacks [42]. The dataset has 2000 samples and can be evenly divided into five clusters according to the piston mass and surface area. The details of the Piston dataset are listed in Table 10.
Details of the Piston dataset
Details of the Piston dataset
The parameters of the experiments are set as follows: the fuzzification parameter m is 2, the threshold value is 10–6, the maximum iteration is 50, the membership criterion θ is 0.2 for the single surrogate model-based fuzzy clustering algorithms. The cycle time is set as the output attribute. The initial gas volume, spring coefficient, atmospheric pressure, ambient temperature, and filling gas temperature are set as the input attributes. The obtained clustering results are shown in Fig. 3. It can be found that the HSM-FC algorithm produces the smallest misclassification rate, the highest adjusted rand index and normalized mutual information. The proposed algorithm is able to provide competitive clustering results for the Piston dataset.
Clustering results of the Piston dataset.
In this paper, a hybrid surrogate model-based fuzzy clustering algorithm is proposed. The proposed algorithm is developed based on fuzzy c-means algorithm, in which the regression relationship is utilized to evaluate the difference among the clusters. Several surrogate models are simultaneously utilized to describe the regression relationship through a weighting scheme. The clustering objective function is designed based on the prediction errors of surrogate models, and an alternating optimization method is designed to minimize it to obtain the memberships of data and the weights of surrogate models. The synthetic datasets are used to compare the performance of the single surrogate model-based fuzzy clustering algorithms. The results indicate that the support vector regression-based and response surface-based fuzzy clustering algorithms show better clustering performance than the other single surrogate model-based fuzzy clustering algorithms. Support vector regression and response surface are used to construct the hybrid surrogate model in the proposed algorithm. The experimental results of synthetic and engineering datasets indicate that the proposed algorithm can provide better clustering results than fuzzy c-means algorithm and single surrogate model-based fuzzy clustering algorithms for the datasets with regression relationship.
Footnotes
Appendix A
Details the synthetic datasets
| Dataset | Cluster | Regression relationship | Range |
| N400A2F1 | 1 | y = sin(2πx/10) + 0.2sin (2πx/2.5) + rand [- 0.02, 0.02] | [0, 1] |
| 2 | y = sin(2πx/10) + rand [- 0.02, 0.02] | ||
| N400A2F2 | 1 | y = x sin(x)/10 + rand [- 0.02, 0.02] | [0, 1] |
| 2 | y = (x + sin(x))/10 + rand [- 0.02, 0.02] | ||
| N400A2F3 | 1 |
|
[0, 1] |
| 2 |
|
||
| N400A3F4 | 1 |
|
[0, 1] |
| 2 |
|
||
| N400A4F5 | 1 | y = - x1x2x3 + rand [- 0.1, 0.1] | [0, 1] |
| 2 | y = - x1x2x3 - x1x3 - x1x2 - x2x3 + rand [- 0.1, 0.1] | ||
| N400A5F6 | 1 |
|
[0, 1] |
| 2 |
|
||
| N400A5F7 | 1 |
|
[0, 1] |
| 2 |
|
||
| N400A6F8 | 1 | y = 10 sin(2x1x2π) + 20 (x3 - 1.5) 2 + 8x4 + 4x5 + rand [- 0.1, 0.1] | [0, 1] |
| 2 | y = 10 sin(x1x2π) + 20 (x3 - 0.5) 2 + 10x4 + 5x5 + rand [- 0.1, 0.1] | ||
| N400A7F9 | 1 |
|
[0, 1] |
| 2 |
|
||
| N400A7F10 | 1 |
|
[0, 1] |
| 2 |
|
Appendix B
In this section, the single surrogate model based-fuzzy clustering algorithms are described, in which the SVR-FC algorithm is introduced first. The SVR-FC algorithm is a clustering algorithm that partitions data according to the regression relationship of data with the help of support vector regression [34]. It clusters a given set of object data {x1, x2, . . . , x
n
}
where ui,k is the membership that represents the degree which xk belongs to the i-th cluster;
To ensure that the i-th SVR model can effectively learn the regression relationship, only the data with higher membership than a criteria θ are used to construct the SVR model in each iteration. The total procedure of the SVR-FC algorithm is described as follows.
Step (1) Setting the clustering number c, the objective attribute x obj , the membership criterion θ and the iteration number g = 1;
Step (2) Using FCM to cluster data, and the obtained membership matrix
Step (3) For each cluster, selecting the data with membership higher than θ as the training data;
Step (4) Checking whether a training dataset is empty, if yes, creating a new membership matrix
Step (5) Using the training data of i-th cluster to build i-th SVR model;
Step (6) Using the obtained SVR models to get the responses of all the data and creating the response matrix xn × c ;
Step (7) Calculating the partition matrix
Step (8) If ∀i, k: max
Through replacing support vector regression with Kriging method, radial basis function, and response surface in Steps (5) and (6), respectively, the KRG-FC, RBF-FC, and RS-FC algorithms can be obtained.
Appendix C
Acknowledgments
This work is supported by Natural Science Foundation of Jiangsu Province (BK20210777), Funding of Jiangsu University (20JDG068) and National Natural Science Foundation of China (51875260).