
Abstract
Automatic segmentation of Magnetic Resonance Imaging (MRI), which bases on Residual U-Net (ResU-Net), helps radiologists to quickly assess the condition. However, the ResU-Net structure requires a large number of parameters and storage model space. It is not convenient to apply to mobile MRI device. To solve this problem, Depthwise Separable Convolution and Squeeze-and-Excitation Residual U-Networks (DSRU-Net) is proposed to segment MRI. Squeeze-and-Excitation method is a channel attention mechanism. The proposed method is conducive to simplify ResU-Net model, making ResU-Net more convenient to be applied to mobile MRI device. The fuzzy comprehensive evaluation method, which includes three evaluation factors are that the required parameters of the model, the value of Dice Similarity Coefficient (DSC), and the value of Hausdorff Distance (HD), is used to evaluate the test results of the proposed method on the MICCAI 2012 Prostate MR Image Segmentation (PROMISE12) challenge dataset and Automatic Cardiac Diagnosis Challenge (ACDC) dataset. The fuzzy comprehensive evaluation values obtained by the proposed method in 5 PROMISE12 samples and 15 ACDC samples are 0.9889 and 0.9652, respectively. Combining the average results of the two datasets, the proposed method has the best effect in balancing the accuracy of segmentation and the amount of model parameters.
Introduction
Cancer is a disease that endangers man’s health [1], so it is particularly important to help radiologists to accurately determine the condition of the disease. Radiologists use ultrasound imaging and magnetic resonance imaging to evaluate cancer. Magnetic Resonance Imaging (MRI) has a higher accuracy rate in soft tissue imaging than ultrasound imaging and Computer Tomography (CT) methods [2, 3]. However, the high price of MRI equipment is not conducive to use widely, which makes it impossible for patients to detect and diagnose early. Recently, the U.S. Food and Drug Administration (FDA) approved the world’s first mobile MRI equipment. Mobile MRI is less expensive to help doctors diagnose faster and to find the disease earlier [4].
Before a professional radiologist diagnoses a patient’s disease, the doctor first needs to accurately locate the specific location of the tissue before further analyzing and processing the tissue area [5–8]. Therefore, segmentation of the tissue area is an important step for the diagnosis of disease. However, manual segmentation of MRI images not only requires time and effort, but also relies heavily on experience. And the conclusions of manual segmentation made by different doctors are different. The researchers have proposed many methods to automatically segment medical images [9, 10]. In 2015, Long et al. [11] proposed Fully Convolutional Networks (FCN) to successfully apply neural networks to the field of image segmentation. Since then, researchers have extensively studied medical image segmentation methods based on deep learning. Olaf et al. [12] proposed the U-Net structure for cell image segmentation. Zhang et al. [13] applied convolutional neural networks (CNN) to infant brain tissue segmentation. Milletari et al. [14] proposed the V-Net structure based on U-Net and successfully applied it to MRI segmentation. Yu et al. [15] proposed a three-dimensional neural network architecture with mixed residual connections for MRI segmentation. The architecture uses 3D spatial context information to perform efficient, accurate and volume-to-volume predictions. And the architecture uses residual connections to improve the training efficiency and discrimination capabilities of the network. The U-Net of the residual structure can provide the accuracy of segmentation, but the amount of parameters also increases. It is not conducive to the application of mobile miniaturized MRI device.
In this paper, Depthwise Separable Convolution and Squeeze-and-Excitation Residual U-Networks (DSRU-Net) is proposed to tackle the above-mentioned challenges. The contributions of this paper can be summarized as follows.
Firstly, the Depthwise Separable Convolution is used to replace the standard CNN in the original U-Net model; Secondly, After the residual structure combines the deep features and shallow features, the channel attention is used to redistribute the weights of these features, thereby improving the segmentation effect; Thirdly, DSRU-Net greatly reduces the number of parameters than Residual U-net, and keeps the segmentation effect from decreasing.
The performance of the proposed model in the paper is evaluated using the dataset of the Prostate Image Segmentation Challenge hosted by the International Conference on Medical Imaging Computing and Computer Aided Intervention 2012 (MICCAI2012) and the dataset of Automatic Cardiac Diagnosis Challenge (ACDC).
This paper is structured as follows. Section 2 introduces the related work of lightweight networks. Section 3 presents the methods employed in this work. Section 4 describes the materials and experimental results and discusses the results obtained. Section 5 concludes this paper.
Related work
To simplify the neural network structure, Iandola et al. [23] proposed SqueezeNet to be applied to image classification. Badrinarayanan et al. [26] proposed SegNet, which uses a small network structure and jump connection method, and has been successfully applied to natural image segmentation. Zhang et al. [24] proposed ShuffleNet, which uses two new operations, pointwise group convolution and channel shuffle, to greatly reduces the computational cost while maintaining accuracy. Yu et al. [27] proposed BiSeNet, which includes two paths: Spatial Path and Context Path. The design of the spatial path is to preserve the spatial information from the original image. The Context Path uses a lightweight model and a global average pool to quickly obtain a considerable receptive field. Chollet proposed to replace the traditional convolution with depthwise separable convolution (DWSC) [16]. Howard et al. [22] proposed MobileNets, which based on a streamlined architecture that uses DWSC to build light weight deep neural network. Chen et al. [19] proposed a spatial pyramid pooling module based on DWSC and applied it to semantic image segmentation. Qi et al. [20] proposed the X-Net based on DWSC, which designed feature similarity module to capture long-range dependencies for better brain stroke lesion Segmentation. Wang et al. [21] proposed ADSCNet based on DWSC, which is a lightweight neural network for real-time semantic segmentation. The DWSC is divided into deep convolution part and pointwise convolution part. Using DWSC instead of standard CNN can reduce the number of parameters in the network, but the accuracy of the network segmentation image will be reduced. Differently, our proposed model keeps the segmentation effect while reducing the amount of parameters.
Methods
ResU-Net uses CNN, which requires a lot of parameters, it is not conducive applied to mobile MRI device. DSRU-Net is proposed to tackle the challenge. DSRU-Net is based on the U-Net as shown in Fig. 1. In this chapter, the framework of DSRU-Net is introduced firstly, and then introduce the depthwise separable convolution and channel attention mechanism of the components of DSRU-Net in detail.
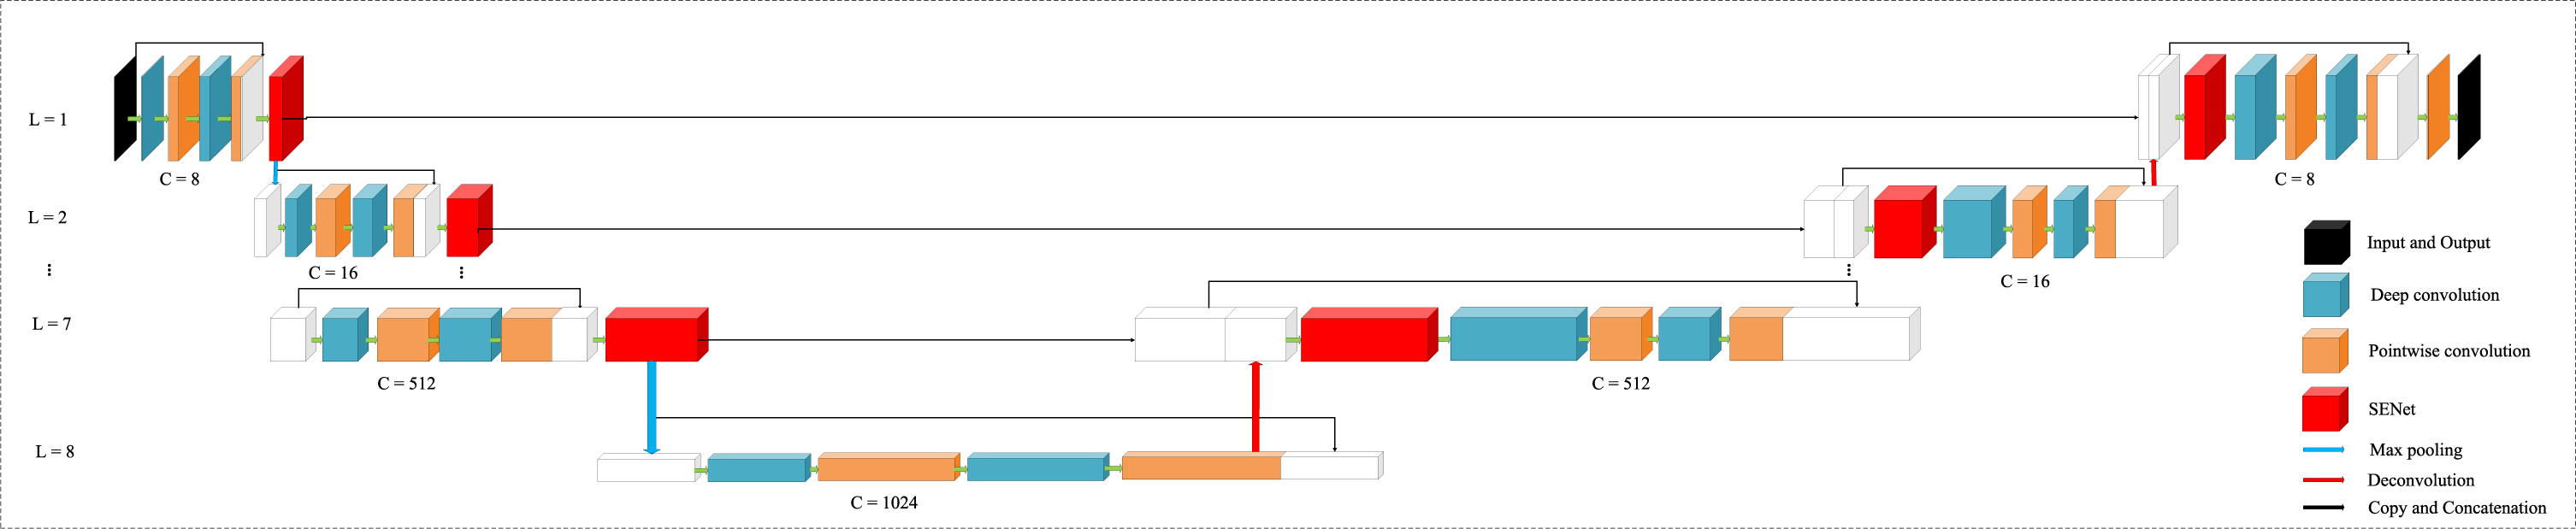
The architecture of the proposed DSU-Net. L represents the depth of encoder and decoder.
The DSRU-Net structure is mainly divided into three parts, which are down-sampling, up-sampling, and jump connection. Firstly, the network is divided into left and right parts for analysis. On the left is the down-sampling process, namely encoder. The encoder is implemented through DWSC, SENet and pooling. The image size is reduced after the encoder, and the encoder extracts some shallow features. The right part is the process of upsampling, namely decoder. The decoder is implemented through DWSC, SENet and deconvolution. The size of image is increased after the decoder, while some deep features are obtained through convolution and upsampling. In the middle, the concat is used to combine the feature map obtained in the encoding stage with the feature map obtained in the decoding stage. The purpose is to combine deep and shallow features to refine the image.
SENet is placed at the tail of the residual connection, which can fuse deep features and shallow features, and redistribute weights to feature maps. Deep convolution and point convolution use “same” as filling method to ensure that the image size remains the same after passing through convolution, and deep convolution and point convolution use ReLU activation to speed up training. The combination of DWSC and SENet can be expressed by the following formula.
DWSC was first applied in deep learning by Chollet [16]. DWSC is different from standard convolution operation. The standard convolution works by applying the convolution kernel to all channels of the input image and obtains the input covered by the kernel. The weighted sum of pixels that slide across all input channels of the image. This means that no matter how many input channels are available for standard convolution, there only is one output channel as shown in Fig. 2. The parameters required for standard convolution are in the following.
Standard convolution. C is the number of input channels and convolution kernels of a filter, D
F
is the size of the input channels, N is the number of filters and output feature maps, and D
k
is the size of the convolution kernel.

Deep convolution. C is the number of input channels, filters and output feature maps, D F is the size of the input channels, and D k is the size of the convolution kernel.
The second step is the pointwise convolution (1×1) convolutional layer, which weights the input maps in the depth direction to generate a new feature map, as shown in Fig. 4. The number of output feature maps is the same as the number of filters. The amount of parameters required for DWSC is in the following.
Pointwise convolution. C is the number of input channels and convolution kernels of a filter, N is the number of filters and output feature maps.
Squeeze-and-Excitation Networks (SENet) was proposed by Hu et al. [17]. The channel attention mechanism model in this paper is modified based on the SENet structure. The point convolutional layer is used to instead of the fully-connected layer of the SENet, which enables the input of feature maps of any number and size. The implementation process is shown in Fig. 5. Squeeze-and-Excitation is a module that consists of three parts, namely squeeze operation, excitation operation and reweight operation. The first is the squeeze operation, which aims to compress information for each input feature channel and reduce the deviation of the estimated mean value caused by the parameter error of the convolutional layer. The feature map after deep convolution and batch normalization is taked as input for global max pooling, so as to obtain a real number with global receptive field. The number of output matches the number of input feature channels. Global max pooling can be described as follows.
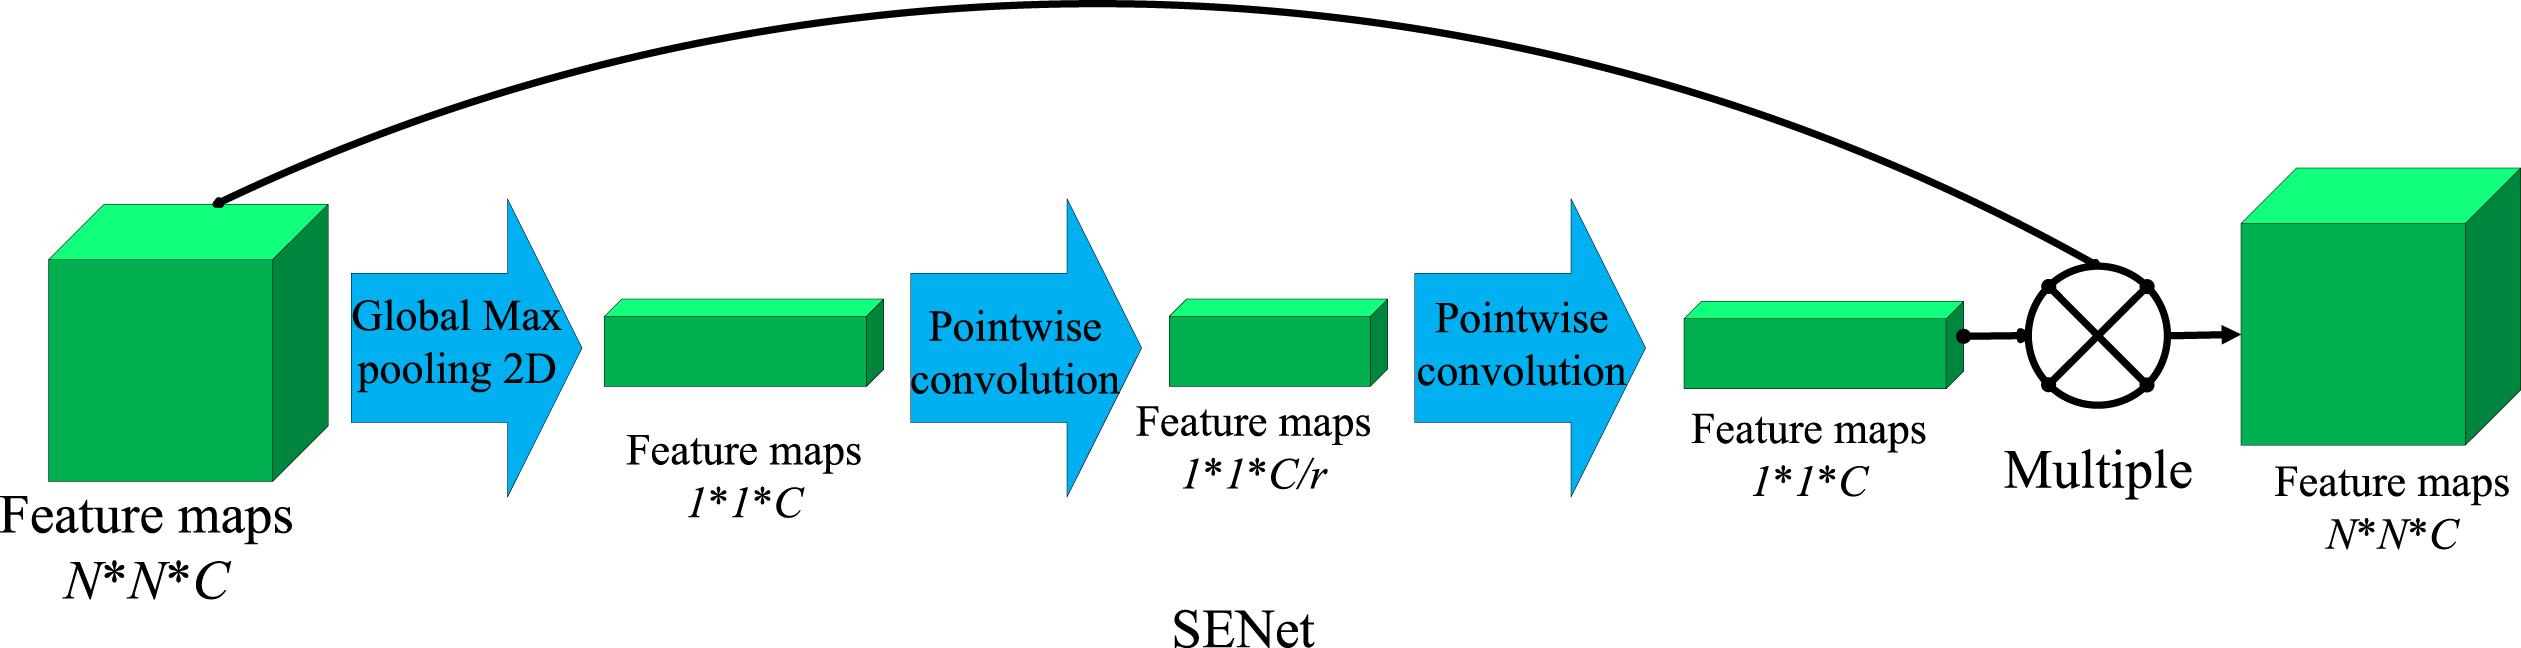
Channel attention (SENet). C represents the number of input feature channels, r represents the dimensionality reduction coefficient.
The second is the excitation operation, which mainly generates weights for each feature channel. It consists of two pointwise convolution layers. The first pointwise convolutional layer reduces the dimensionality of the input feature channels by setting the number of channels to C/r. C represents the number of input channels, r represents the dimensionality reduction coefficient. When the number of input feature channels is C = 1, the dimensionality reduction coefficient is equal to r = 1. When the input feature channel is 1 < C < 64, the dimensionality reduction coefficient is equal to r = 8, when the input feature channel is C > = 64, the dimensionality reduction coefficient is equal to r = 16, and the second pointwise convolutional layer restores the number of compressed feature channels by setting the number of channels to C. Excitation operation can be described as follows.
Where
Finally, there is a reweight operation. The value of the output weight of the excitation indicates the importance of the feature channel. The weight of the output of the excitation is multiplied with the feature map input by squeeze to complete the recalibration of the original feature in the channel dimension. Reweight operation can be described as follows.
This section mainly introduces the dataset and evaluation criteria required for the experiment, and analyzes the experimental results.
Dataset
This paper uses two datasets to verify the effectiveness of the method, one is a two-class segmentation of the MICCAI 2012 Prostate MR Image Segmentation (PROMISE12) challenge dataset, and the other is a four-class segmentation of the Automatic Cardiac Diagnosis Challenge (ACDC) Dataset.
PROMISE12 only provides 50 patient samples as a training set. Due to the small number of PROMISE12 samples, the 50 patient samples is divided into 40 training sets, 5 validation sets and 5 test sets.
The Automatic Cardiac Diagnosis Challenge (ACDC) Dataset [25] provides 100 patient samples as a training set. The 100 patient samples is randomly selected into 70 training set, 15 validation set and 15 test set.
After that, each sample is sliced and adjusted the size of each slice to 256×256. The contrast of the sliced image is improved in the preprocessing part. Contrast-limited adaptive histogram equalization for histogram equalization is used. In addition, to make the pixel distribution more uniform, curvature-driven image denoising for each image is used. Finally, calculate the mean and standard deviation of the training set, and use the calculated mean and standard deviation to standardize the training set, validation set and the test set.
In the training set of PROMISE12 and ACDC, there are only about 1200 images with corresponding masks in the training set, therefore the data needs to be enhanced. Random rotation, shift, zoom, inversion and elastic deformation methods are used to enhance the training set to 150000 images.
Evaluation
In medical image segmentation, usually the region needs to be segmented which only occupy a small part of the entire image. In this environment, using Dice Similarity Coefficient (DSC) as the loss function has a better segmentation effect [18]. DSC is also an evaluation function. DSC is derived from two classifications, and essentially measures the overlap of two samples. The DSC value ranges from 0 to 1, where “1” means that the segmentation result completely overlaps the ground truth (GT). The calculation formula is in the following.
It is not enough to use DSC to evaluate the effect of segmentation, because DSC cannot judge the effect of segmentation contour. Here, the Hausdorff Distance (HD) is introduced to evaluate the matching degree between the contour of the segmentation result and the GT contour. The smaller the HD value is, the more the edge of the segmentation result coincides with the edge of the GT result.
HD is a distance defined between any two sets in the metric space. The formula is in the following.
This experimental platform is based on Keras 2.3.1 version, adopting Tensorflow-GPU version 2.1.0 as the backend to experiment under the python3.7 framework. The hardware platform is NVIDIA GeForce RTX2060 GPU (6GB RAM) and AMD Ryzen 5 3600 6-Core Processor 3.59 GHz (16GB RAM), adopting CuDNN7.6 library as a benchmark function to ensure that the fastest algorithm is used.
Test results of PSPNet, SegNet and the proposed method on the PROMISE12 dataset
Test results of PSPNet, SegNet and the proposed method on the PROMISE12 dataset
Test results of PSPNet, SegNet and the proposed method on the ACDC Dataset
The backpropagation algorithm is used to train the model. The optimizer selects Adam, the learning rate is set to 0.001, and the momentum is set to 0.9. When the accuracy of training does not increase by 0.001 after 5 consecutive epochs, the training is ended early, the results of training are saved, and the results are used to evaluate the model. The input image batch is 16.
The comparative experimental results on the PROMISE12 dataset are shown in Table 1. From the results of Table 1, the DSC and HD values of PSPNet, SegNet and DSRU-Net are 81.60%, 81.24%, 84.61% and 16.16 mm, 15.02 mm, 9.96 mm. The parameters of PSPNet, SegNet and DSRU-Net are 46.76 million, 30.82 million and 20.54 million respectively. From the results, it can be seen that the proposed method DSRU-Net has greater advantages in segmentation effect and parameter amount.
The comparative experimental results on the ACDC dataset are shown in Table 2. From the results of Table 2, the DSC and HD values of PSPNet, SegNet and DSRU-Net are 78.77%, 56.03%, 75.86% and 7.14 mm, respectively, 13.83 mm, 8.05 mm. The parameters of PSPNet, SegNet and DSRU-Net are 46.76 million, 30.82 million and 20.54 million, respectively. From the results, it can be seen that PSPNet achieves the best segmentation effect, but the proposed method DSRU-Net is not far behind PSPNet in terms of segmentation effect. At the same time, the proposed method DSRU-Net has greater advantages in terms of parameters.
From the comparative experiment of PROMISE12 dataset and ACDC dataset, it can be seen that the proposed method can not only achieve a better segmentation effect but also effectively reduce the amount of model parameters.
The results of ablation experiments on the PROMISE12 dataset are shown in Table 3. From the results in Table 3, the DSC value of ResU-Net, ResU-Net-D, ResU-Net-C and DSRU-Net is 87.65%, 88.50%, 88.22% and 88.40% respectively. The HD value of ResU-Net, ResU-Net-D, ResU-Net-C and DSRU-Net is 18.00 mm, 37.81 mm, 21.67 mm and 15.80 mm respectively. The parameters of ResU-Net, ResU-Net-D, ResU-Net-C and DSRU-Net is 53.25 million, 19.98 million, 53.47 million and 20.76 million respectively. The segmentation results of each model are shown in Fig. 6.
Quantitative comparison of four groups of experiments of PROMISE12 dataset
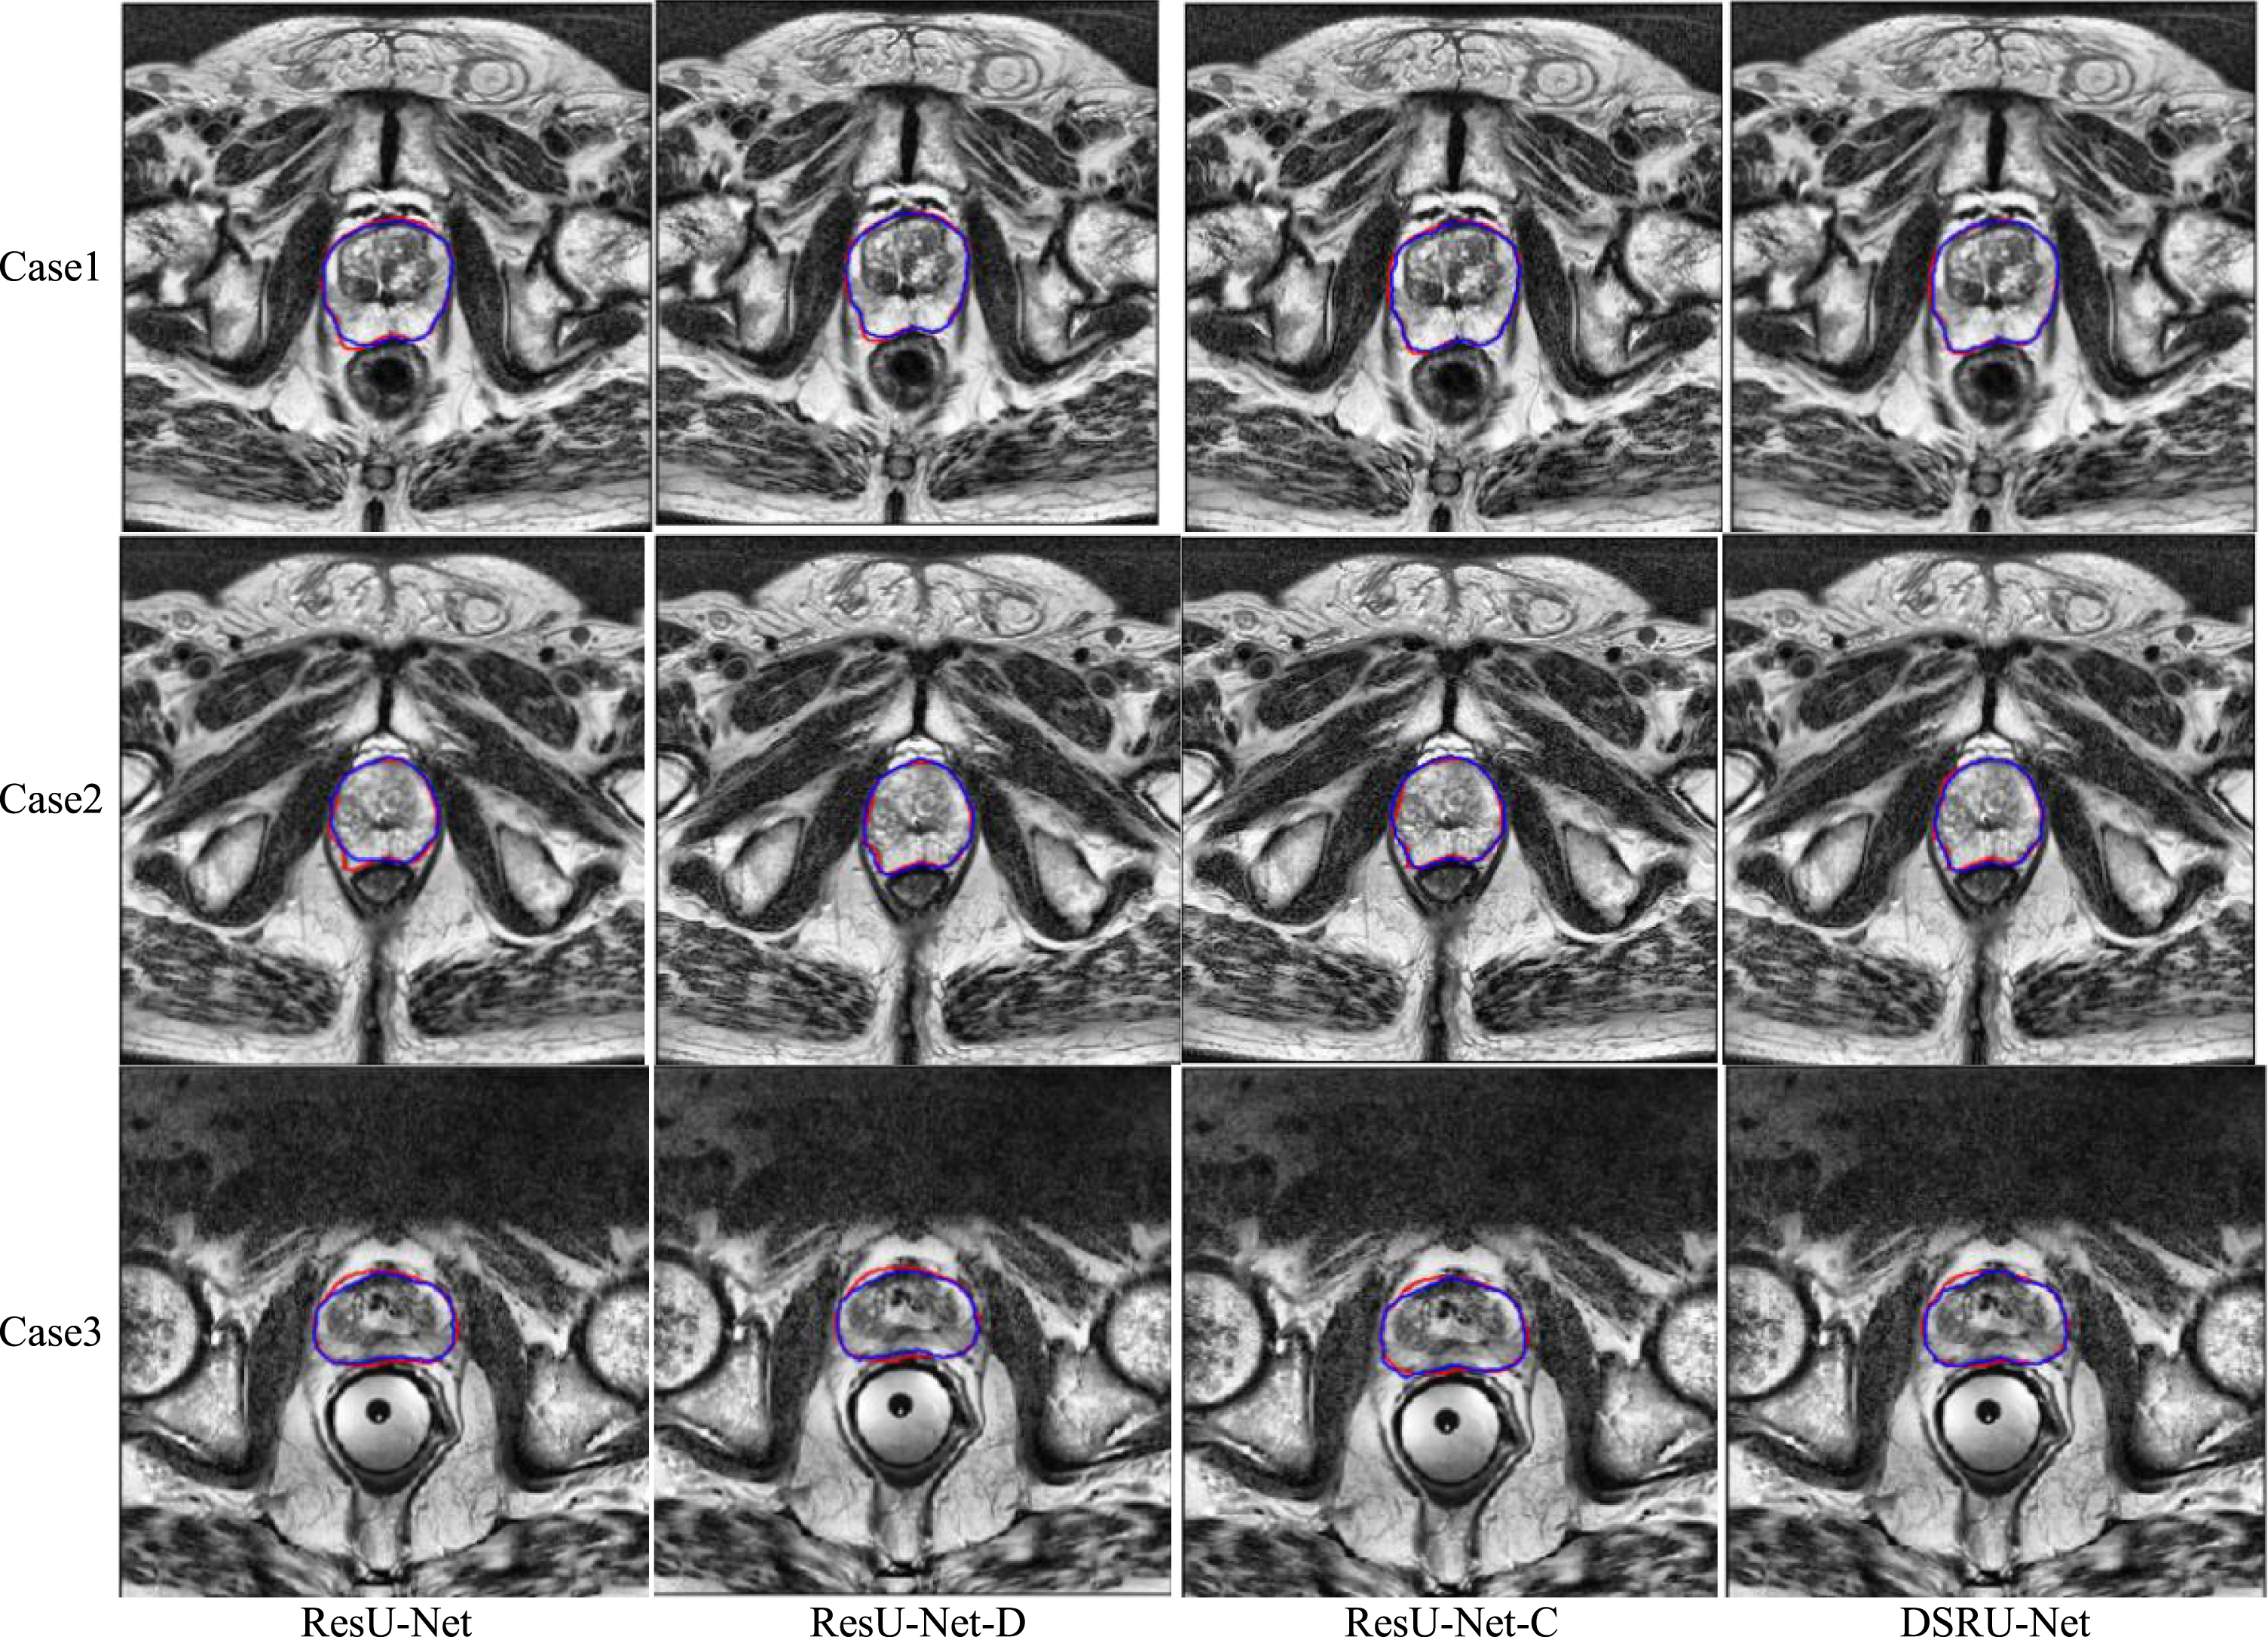
The blue curve represents the contour of the prostate obtained through deep learning, while the red curve represents the contour obtained manually and segmented by an experienced radiologist.
The results of the ablation experiment on the ACDC dataset are shown in Table 4. From the results in Table 4, the DSC value of ResU-Net, ResU-Net-D, ResU-Net-C and DSRU-Net is 77.10%, 77.32%, 79.78% and 78.49% respectively. The HD value of ResU-Net, ResU-Net-D, ResU-Net-C and DSRU-Net is 7.58 mm, 7.54 mm, 6.98 mm and 7.46 mm respectively. The parameters of ResU-Net, ResU-Net-D, ResU-Net-C and DSRU-Net is 53.25 million, 19.98 million, 53.47 million and 20.76 million respectively. The segmentation results of each model are shown in Fig. 7.
Quantitative comparison of four groups of experiments of ACDC Dataset, LV, RV and MYO represent the left ventricle, right ventricle and myocardium, respectively
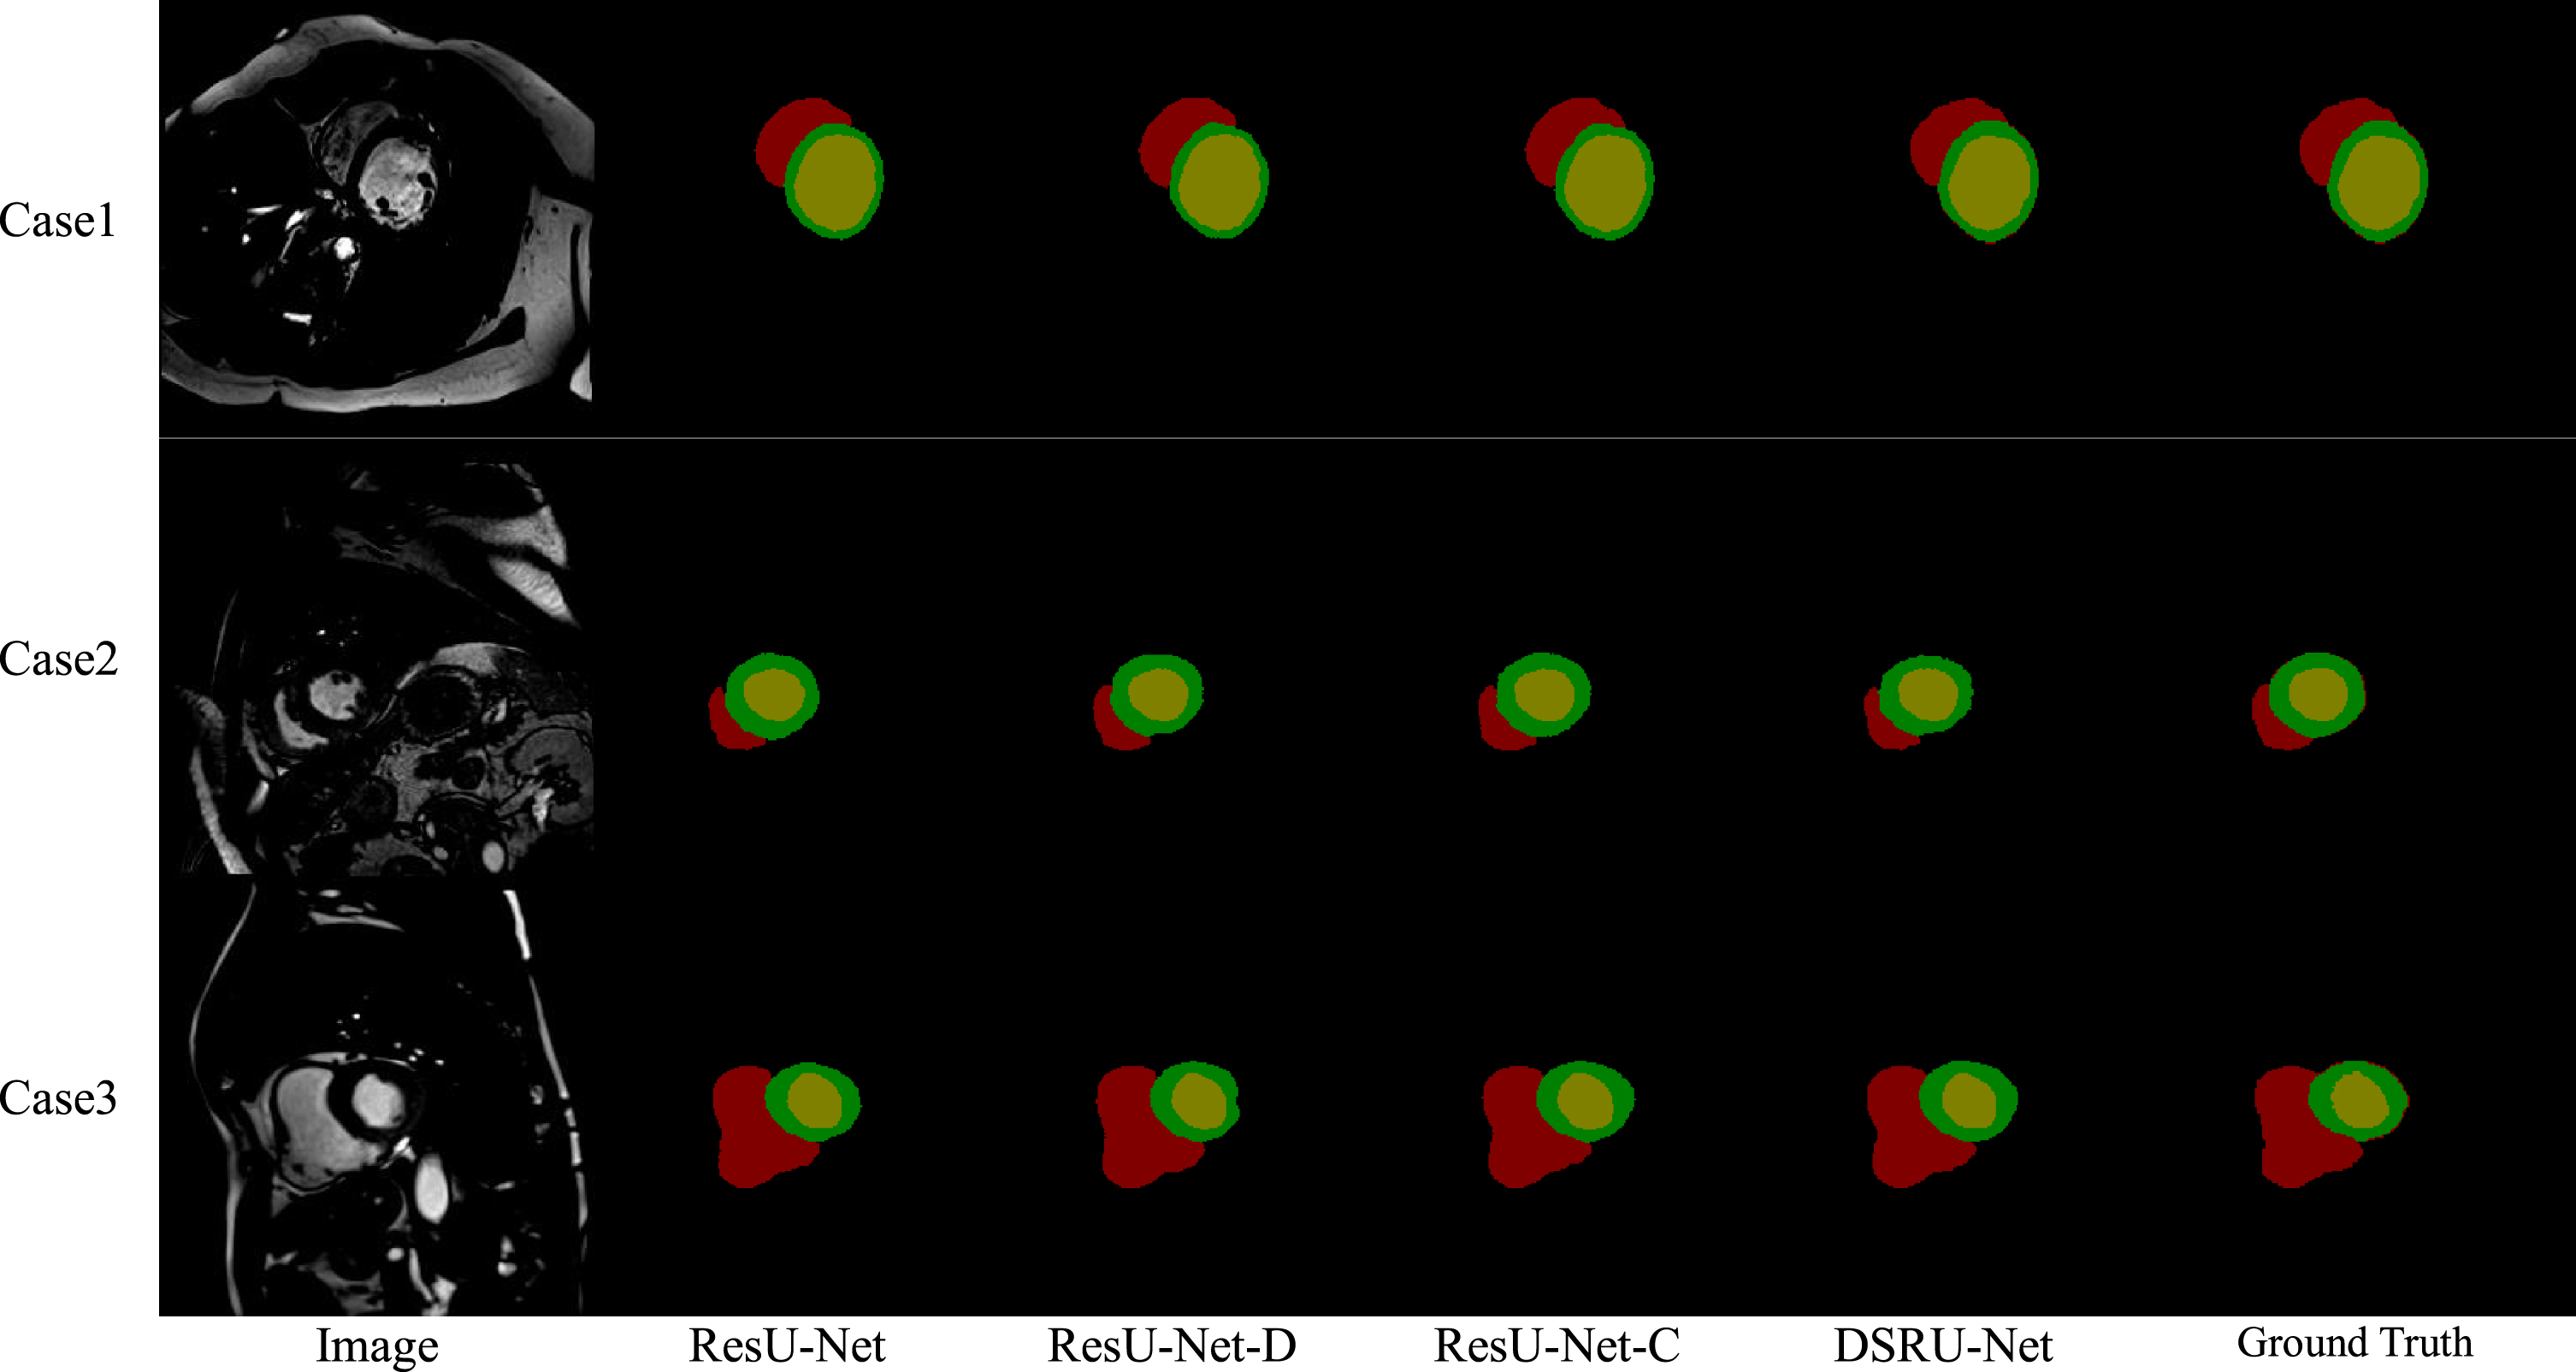
Qualitative comparison on ACDC dataset. The proposed DSRU-Net achieves more accurate results along with better smoothness and continuity in shape. Yellow, red and green represent the left ventricle, right ventricle and myocardium, respectively.
From the results in Tables 3 and 4, it is impossible to intuitively judge that certain models are better, so the fuzzy comprehensive evaluation method is introduced. Fuzzy comprehensive evaluation method is one of the most basic mathematical methods in fuzzy mathematics. Fuzzy mathematics is used to make an overall evaluation of things or objects restricted by multiple factors.
The purpose of this experiment is to reduce the model parameters and improve the segmentation effect. Therefore, the first-level evaluation factors is set as the model parameter quantity u1 and the segmentation accuracy rate u2, and set the second-level evaluation factors DSC value u21 and HD value u22 under u2. In this experiment, u1 has no second-level indicators and u2 has Second-level indicators, so the weights of u1 and u2 are set to 0.4 and 0.6, respectively. The DSC value and HD value are commonly used accuracy evaluation indicators, so the weights of u21 and u22 are set to 0.5 and 0.5, respectively. From the above content, Table 5 can be designed. The values listed in Tables 3 and 4 refer to the values of the evaluation factors. The evaluation value is calculated based on the data in Tables 3 and 4. The evaluation value refers to the degree of merit of the evaluation factor. Taking the best evaluation factor as the benchmark, its evaluation value is 1; the other poor evaluation factors get corresponding evaluation values based on the degree of the poor quality. The corresponding relationship between the evaluation value and the evaluation factor value (technical parameter value) is proportional: evaluation value = technical parameter value/optimal technical parameter value. The corresponding relationship between evaluation value and evaluation factor value (technical parameter value) is inversely proportional: evaluation value = optimal technical parameter value/technical parameter value. The DSC value is the higher the better, and the the HD value and model parameters are the lower the better. The evaluation value of each evaluation factor of Tables 3 and 4 is shown in Tables 6 and 7, respectively. The fuzzy comprehensive evaluation method uses the comprehensive evaluation value to judge the pros and cons of each model. The comprehensive evaluation value can be calculated by the following formula.
Second-level indicators for evaluating model effects
The evaluation value of the evaluation factors of each model of PROMISE12 dataset
The evaluation value of the evaluation factors of each model of ACDC dataset
According to the results in Tables 6 and 7, the evaluation value of each method model parameter quantity u1 is 0.375, 1.0, 0.372, 0.973. The amount of parameters using DWSC is reduced by about 60% compared to that of CNN. It shows that the model structure of DWSC can greatly reduce the amount of parameters, while also reducing the storage space. The evaluation values of the segmentation accuracy u2 of each method in the PROMISE12 dataset are 0.9340, 0.7090, 0.8630, 0.9995, and the evaluation values of the segmentation accuracy u2 of each method in the ACDC dataset are 0.9435, 0.9475, 1.0, 0.9600. From the PROMISE12 dataset, comparing the u2 values of ResU-Net and ResU-Net-D, it can be seen that using DWSC instead of traditional convolution will significantly reduce the segmentation effect. Comparing the u2 value of ResU-Net-D and the proposed method, it can be seen that the channel attention mechanism can improve the segmentation performance. Taking the average of the fuzzy comprehensive evaluation values obtained from the PROMISE12 dataset and the ACDC dataset, the proposed method is the highest, indicating that the combination of DWSC and the channel attention mechanism can not only reduce the model parameters, but also improve the segmentation effect.
This paper proposes the DSRU-Net method. This method uses DWSC to replace the standard CNN of U-Net so it greatly reduces the amount of model parameters. At the same time, the reduction of U-Net effect caused by the use of DWSC layers can be improved by the channel attention mechanism. Through comparison, it can be seen that the method in this paper has better segmentation effect and fewer model parameters than PSPNet and SegNet. The fuzzy comprehensive evaluation method is used to evaluate the ablation experiment. The fuzzy comprehensive evaluation method includes three evaluation factors, which are the parameters required by the model, the value of DSC and the value of HD. The fuzzy comprehensive evaluation method is used to evaluate the proposed method on PROMISE12 dataset and ACDC dataset. The proposed method is tested in selected 5 PROMISE12 dataset samples and 15 ACDC dataset samples. The proposed method obtaines the fuzzy comprehensive evaluation values in these two datasets, which is 0.9889 and 0.9652 respectively. The result show that the proposed method is the best choice in balancing the amount of parameters and the segmentation effect.