
Abstract
Social vulnerability assessment is of great significance for risk management and reduction. Carrying out the assessment is beneficial to the sustainability of the development of society and the economy. For this purpose, Jiangsu province in China is taken as the study area to explore the social vulnerability assessment at a city level. A framework has been constructed from three dimensions of demographics, economics, and social security. In our study, a new approach based on the maximizing deviation method and TODIM model is proposed to evaluate social vulnerability in Jiangsu province. For the sake of analysis, we divide 13 cities of Jiangsu province into three parts, namely the southern part, central part, and northern part, according to the geographical location. As a result, the north part performance of social vulnerability is the worst among the three regions. The average of the northern part has always obviously exceeded the others of Jiangsu province from 2012 to 2017, which indicates that the north part is the most vulnerable to natural hazards. In addition, the performance of the southern part is relatively better than that of the central region. Especially, Suqian has always been at the bottom from 2012 to 2017, which reveals the ability to withstand natural disasters is the most insufficient. Our findings also imply that social vulnerability is related to local economic development to some extent.
Introduction
Natural disasters and extreme weather events have become more frequent in recent years, while losses caused by hazards are also increasing at a rapid speed [1]. Risk management plays an essential role in modern society, and more attention is paid to risk prediction and management. Enhancing social resilience contributes to disaster risk reduction. Notably, China has been one of the countries with the most severe natural disasters worldwide in recent years. According to the Ministry of Civil Affairs of the People’s Republic of China, a total of 140 million people across the country were affected by natural disasters in 2017, and direct economic losses reached 3.7 percent of gross domestic product.
Social vulnerability evaluation has become a core element in reducing losses from disasters in recent research. The social vulnerability can explain why disasters of equal magnitude cause significantly different losses for different areas, which is crucial for risk analysis. Furthermore, regions hit by hazards possess their unique social background, including culture, economy, code of conduct, natural environment, etc. These influence the local inward social vulnerability and decide how well they respond to disasters and recover from strikes. Therefore, evaluating social vulnerability is beneficial to risk management and contributes to decreasing the loss caused by hazards.
The concept of social vulnerability has been involved in many fields, including natural hazard [2], risk management [3], sustainability [4]. Scholars define social vulnerability as the recovery ability from disasters or the state of susceptibility to risk due to the lack of response capacity. With the deepening of research, it is more recognized as a potential or inherent state of human society that may affect the performance of people respond to risks or disasters [5].
Social vulnerability is vital for the improvement of risk management. Therefore, a lot of research about social vulnerability has been carried out in recent years. For instance, the social vulnerability was firstly measured through factor analysis to discuss losses from natural disasters in American [6]. Furthermore, later scholars have successively studied social vulnerability. For example, a multi-hazards risk and vulnerability assessment for the coastal municipality in Bangladesh were explored to sort the disaster with community involvement [7]. In addition, it was found that vulnerability was derived mainly from the shortage of physical, financial, and social capital, represented as low nutrition levels, weak social networks, and low employment [8]. Moreover, a low-cost, rapid social vulnerability assessment approach was provided for cross-regional research [9].
Results indicated that the provincial social vulnerability in China showed significant regional differences [10]. A comparative study of flood and earthquake vulnerability was implemented. It was found that flood vulnerability studies focused more on indicators applied to aggregated land-use classes in curve-based models [11]. An approach was proposed that integrated the spatial and temporal dimensions into social-ecological vulnerability assessments, where social and ecological vulnerabilities were linked by a feedback loop [12]. An indicator-based approach was developed to assess social vulnerability to sea-level rise in Bandar Abbas city coastal district, and fuzzy AHP was used to calculate the weight [13]. The principal component analysis is applied to help identify hidden social vulnerability and outlined policy implications for decision-makers [14]. A framework was proposed to measure vulnerability, which focused on hazard generic and livelihood-oriented socio-economic factors [15]. It is found that social and economic factors were considered the main factors which contributed to high drought vulnerability [16]. The vulnerability index indicated that Bihar was highly vulnerable to floods, with north Bihar especially being more vulnerable [17].
In recent research, the multi-criteria decision-making (MCDM) method has been gradually used in vulnerability. Furthermore, a new approach was created based on contextual analysis of image and GIS data, which made social vulnerability indicators with physical characteristics [18]. PCA was used to determine the weight of indicators for each district of Guangdong province in China [19]. The priority ranking of land-use restrictions in Taiwan was carried out via VIKOR according to the severity of environmental vulnerability [18]. Five indicators were selected to build a community-based social vulnerability index, and TOPSIS was developed to assess the value of vulnerability [19]. An attempt was made to integrate nine risk variables through AHP to evaluate the vulnerability in Indian coastal regions [20].
Nevertheless, the existing literature mainly studies social vulnerability utilizing factor analysis and AHP, which requires massive data and the pre-feasibility test. The method of AHP needs sufficient experienced specialists in practice [21]. Some decisions are made under fuzzy environments [22]. In addition, some scholars choose VIKOR, TOPSIS, ELECTRE II, and MULTIMOORA to study social vulnerability, but the data standardization process of VIKOR is complex [23,24, 23,24]. Meanwhile, it is difficult for TOPSIS to show the preference of decision-makers, and ELECTRE II needs more parameters [25]. Besides, these methods are based on expected utility theory. They assume that the decision-makers can rationally decide, which is very hard to realize in the real application [26]. Compared with others, the TODIM model is based on the prospect theory considering the preference of decision-makers by studying the impact of the recession coefficient [27,28, 27,28]. The traditional TODIM method is extended to handle the hesitant fuzzy linguistic term sets based on the novel comparison and distance measurements [26]. The probabilistic uncertain linguistic TODIM method is developed to select the best alternatives [29].
Given that, a new approach based on TODIM is applied to assess the social vulnerability. Meanwhile, little attention has been paid to evaluating social vulnerability in China, particularly the study from the city level. Based on the observation, a novel approach based on TODIM model and maximizing deviation method is proposed to evaluate the social vulnerability of Jiangsu province from 2012 to 2017. In brief, our study explores the current research about social vulnerability in China, and main contributions are as follows: A framework of social vulnerability index from the city level is constructed, which includes three dimensions respectively demographics, economics, and social security. A new approach based on maximizing deviation method and the TODIM model has been applied to the social vulnerability assessment. The empirical study is implemented in Jiangsu province from the city level, in which the sensitivity analysis has also been carried out.
The paper is organized as follows. Some preliminaries are defined in Section 2. The proposed evaluation approach is discussed in Section 3. An empirical study is presented in Section 4, and conclusions are made in Section 5.
The preliminaries
In this section, some preliminaries are introduced firstly. Different from the conventional approach AHP, the maximizing deviation method is used to calculate weights. Then, the TODIM is employed to evaluate social vulnerability.
The maximizing deviation method
Given that the weight of the indicator may influence the ranking of alternatives [30], a maximizing deviation method is used for determining the weight [31]. The assignment of weight should concur with the significance among alternatives. Concretely, the value of weight will decrease if the indicator makes little difference in assessing social vulnerability. When it greatly influences the result, the weight will be given a larger value. The weight of the indicator can be calculated without any subjective factors, which is a completely objective approach to obtain the weight. Generally, a multi-objective program is expressed as follows:
ω
j
represents the weight of each objective. W
j
is the comprehensive weight of each indicator that can be obtained by
For the sake of calculation, let θ = min{ W1, W2, . . . , W
n
}, then the multi-objective program can be transformed into a single objective program as shown in Equation (2):
Set
The Lagrange function is utilized to solve this model as described in the following. The objective function is shown in Equation (4):
To solve this problem, set the partial derivations to be zero:
Thus, ω
j
C
j
= θ, λ
j
C
j
= - μ,
Evaluation of social vulnerability in our study is implemented based on the proposed methodology. TODIM is one of the MCDM methods, which Gomes and Lima initially proposed. It provides an opportunity to measure the dominance degree of each alternative over others and can take the behavioral features into consideration. Moreover, TODIM doesn’t rely on massive data and complex calculations compared to AHP or VIKOR. In addition, it reflects the preference of decision-makers in practice that is better than TOPSIS. Because of the above characteristics, TODIM is widely applied in recent research for decision-making [26,29, 26,29]. Hence, a new approach based on the TODIM model is adopted to assess the social vulnerability of Jiangsu province.
Let A = (A1, A2, A3, ⋯ , A m ) be a set of objects to be evaluated and let C = (C1, C2, C3, ⋯ , C n ) be a collection of evaluation indicators, which constitutes the evaluation matrixX = [x ij ] m*n. x ij represents the value of j th evaluation indicator of i th object. The specific steps of TODIM evaluation are shown below:
For the positive indicator:
For the negative indicator:
The recession coefficient is represented by θ and the smaller the parameter is, the higher the degree of loss avoidance is. Meanwhile, the value of the recession coefficient is more than zero. If the parameter is less than one, the possibility of loss increases. So, the recession coefficient is generally set to be greater than 1. In the part of the case study, this parameter sets to be 2.
The more ɛ i is, the worse the social vulnerability is.
Social vulnerability reflects the capability to resist natural disasters and recover from shock in our study. Maximizing deviation method and TODIM approach is proposed to evaluate the social vulnerability of Jiangsu province. As shown in Fig. 1, a framework of social vulnerability is constructed from three dimensions, including demographics, economics, and social security. The maximizing deviation method is used to calculate the individual weight for each indicator. Based on that, the value of social vulnerability can be obtained in combination with the TODIM model. When the value is getting smaller, it indicates a more robust ability to deal with hazards for local residents.

The methodology about social vulnerability assessment.
Quantitative analysis of social vulnerability focuses on selecting relevant variables to obtain the vulnerability value such as race, gender, age, income, education, poverty, health care, household, employment [32–34]. In this study, the social vulnerability of Jiangsu province is discussed from the purely socio-economic perspective, which consists of three dimensions of demographics, economics, and social security. A considerable population and excessive population density may lead to a shortage of resources and traffic congestion, and a range of issues that reinforce inequality among social strata [35]. Gender is an important variable that can’t be ignored when considering social vulnerability. Compared with men, women are in a weak position in terms of physiology. Therefore, they are more sensitive to pressure and hazard and take longer to recover from the disaster [36]. Similarly, children and the aged are more likely to be influenced by incidents because of the weak and insufficient ability to cope with accidents [37].
Resource investment in rural areas is far less than that in cities on every side, which results in slower resilience than urban residents, mainly peasants who make a living by farming [38]. Regions with advanced economic development tend to have lower levels of social vulnerability because they have abundant capital to withstand the impact of the damage. The industrial structure can reflect the quality of the economy to a certain extent. For instance, primary industries dominated by agriculture are easily exposed to natural disasters and suffer the most losses compared to other sectors [39]. Meanwhile, the income of individuals in various places is also a vital factor in distinguishing the degree of vulnerability [40]. Social security indicates the resilience for affected people dealing with and recovering from hazards. Availability of timely medical services directly affects post-disaster reconstruction. Proper and rapid medical care can effectively reduce the damage caused by disasters and contribute to relief work [41]. Above on, we build the index system of social vulnerability of Jiangsu province as shown in Table 1.
Index system of social vulnerability of Jiangsu province
Index system of social vulnerability of Jiangsu province
Summarizing the above analysis, we come up with the evaluation procedure as follows:
Empirical study and analysis
Study area
The social vulnerability of Jiangsu province at a city level has been explored in this study. All these 13 cities make up Jiangsu province, Nanjing, Wuxi, Xuzhou, Changzhou, Suzhou, Nantong, Lianyungang, Huaian, Yancheng, Yangzhou, Zhenjiang, Taizhou, and Suqian, as shown in Fig. 2. The economic development of Jiangsu province ranks top among the country with a large population and economic activities. Once a major disaster occurs, the damage will be enormous. Therefore, it is necessary to explore the social vulnerability of Jiangsu province to improve risk management. For the sake of analysis, we divide 13 cities of Jiangsu province into three parts according to the geographical location. Nanjing, Suzhou, Wuxi, Changzhou, and Zhenjiang are classified as the southern part, while Yangzhou, Taizhou, and Nantong belong to the central part of Jiangsu province. Besides, the northern region includes the rest five cities, including Xuzhou, Lianyungang, Suqian, Huaian, and Yancheng.

Study area.
Data resource
A secondary data set is collected from Jiangsu Statistical Yearbook and urban statistical yearbook from 2012 to 2017. The index system of social vulnerability in Jiangsu province is composed of 22 indicators altogether. Particularly, we separate these indicators into two groups, respectively, positive and negative, based on their nature to match the TODIM model.
Analysis of social vulnerability in 2012
To explain the methodology clearly, we take the specific year 2012 as an example to demonstrate how to get the values of social vulnerability for 13 cities.
Let A = (A1, A2, A3, ⋯ , A13)=(Nanjing, Wuxi, Xuzhou, Changzhou, Suzhou, Nantong, Lianyungang, Huaian, Yancheng, Yangzhou, Zhenjiang, Taizhou and Suqian).
Standardized data in 2012 for 13 cities in Jiangsu
Standardized data in 2012 for 13 cities in Jiangsu
Standardized data in 2012 for 13 cities in Jiangsu
For instance, the matrix about d (A i , A k ) for the first indicator (C1) is displayed in Table 4. The other matrix can be obtained in the same way.
The matrix about d (A i , A k )
According to the previous setti
The value of C j in 2012
The individual weight w j
The relative weight
The relative dominance matrixδ (A i , A k )
The overall dominance value ɛ i
Social vulnerability value s i
To further discuss the social vulnerability of Jiangsu province, we carry out the analysis from three parts, namely the southern part, central part, and northern part. The distribution of social vulnerability for 13 cities in Jiangsu province is shown in Fig. 3 from 2012 to 2017. From Fig. 3, it can be noticed that different cities have different social vulnerabilities while the trend is similar from 2012 to 2017. The social vulnerability of the southern part is lower than the middle and northern parts. The main reason may be that the economic development and infrastructure construction of the part is much better than the rest parts. The social vulnerability of the middle part is lower than the northern part except for Xuzhou. Suqian has the highest social vulnerability from 2012 to 2017. The city is the newest in the Jiangsu province. The economic development and infrastructure construction are relatively backward. The GDP is always the last one in the whole province.
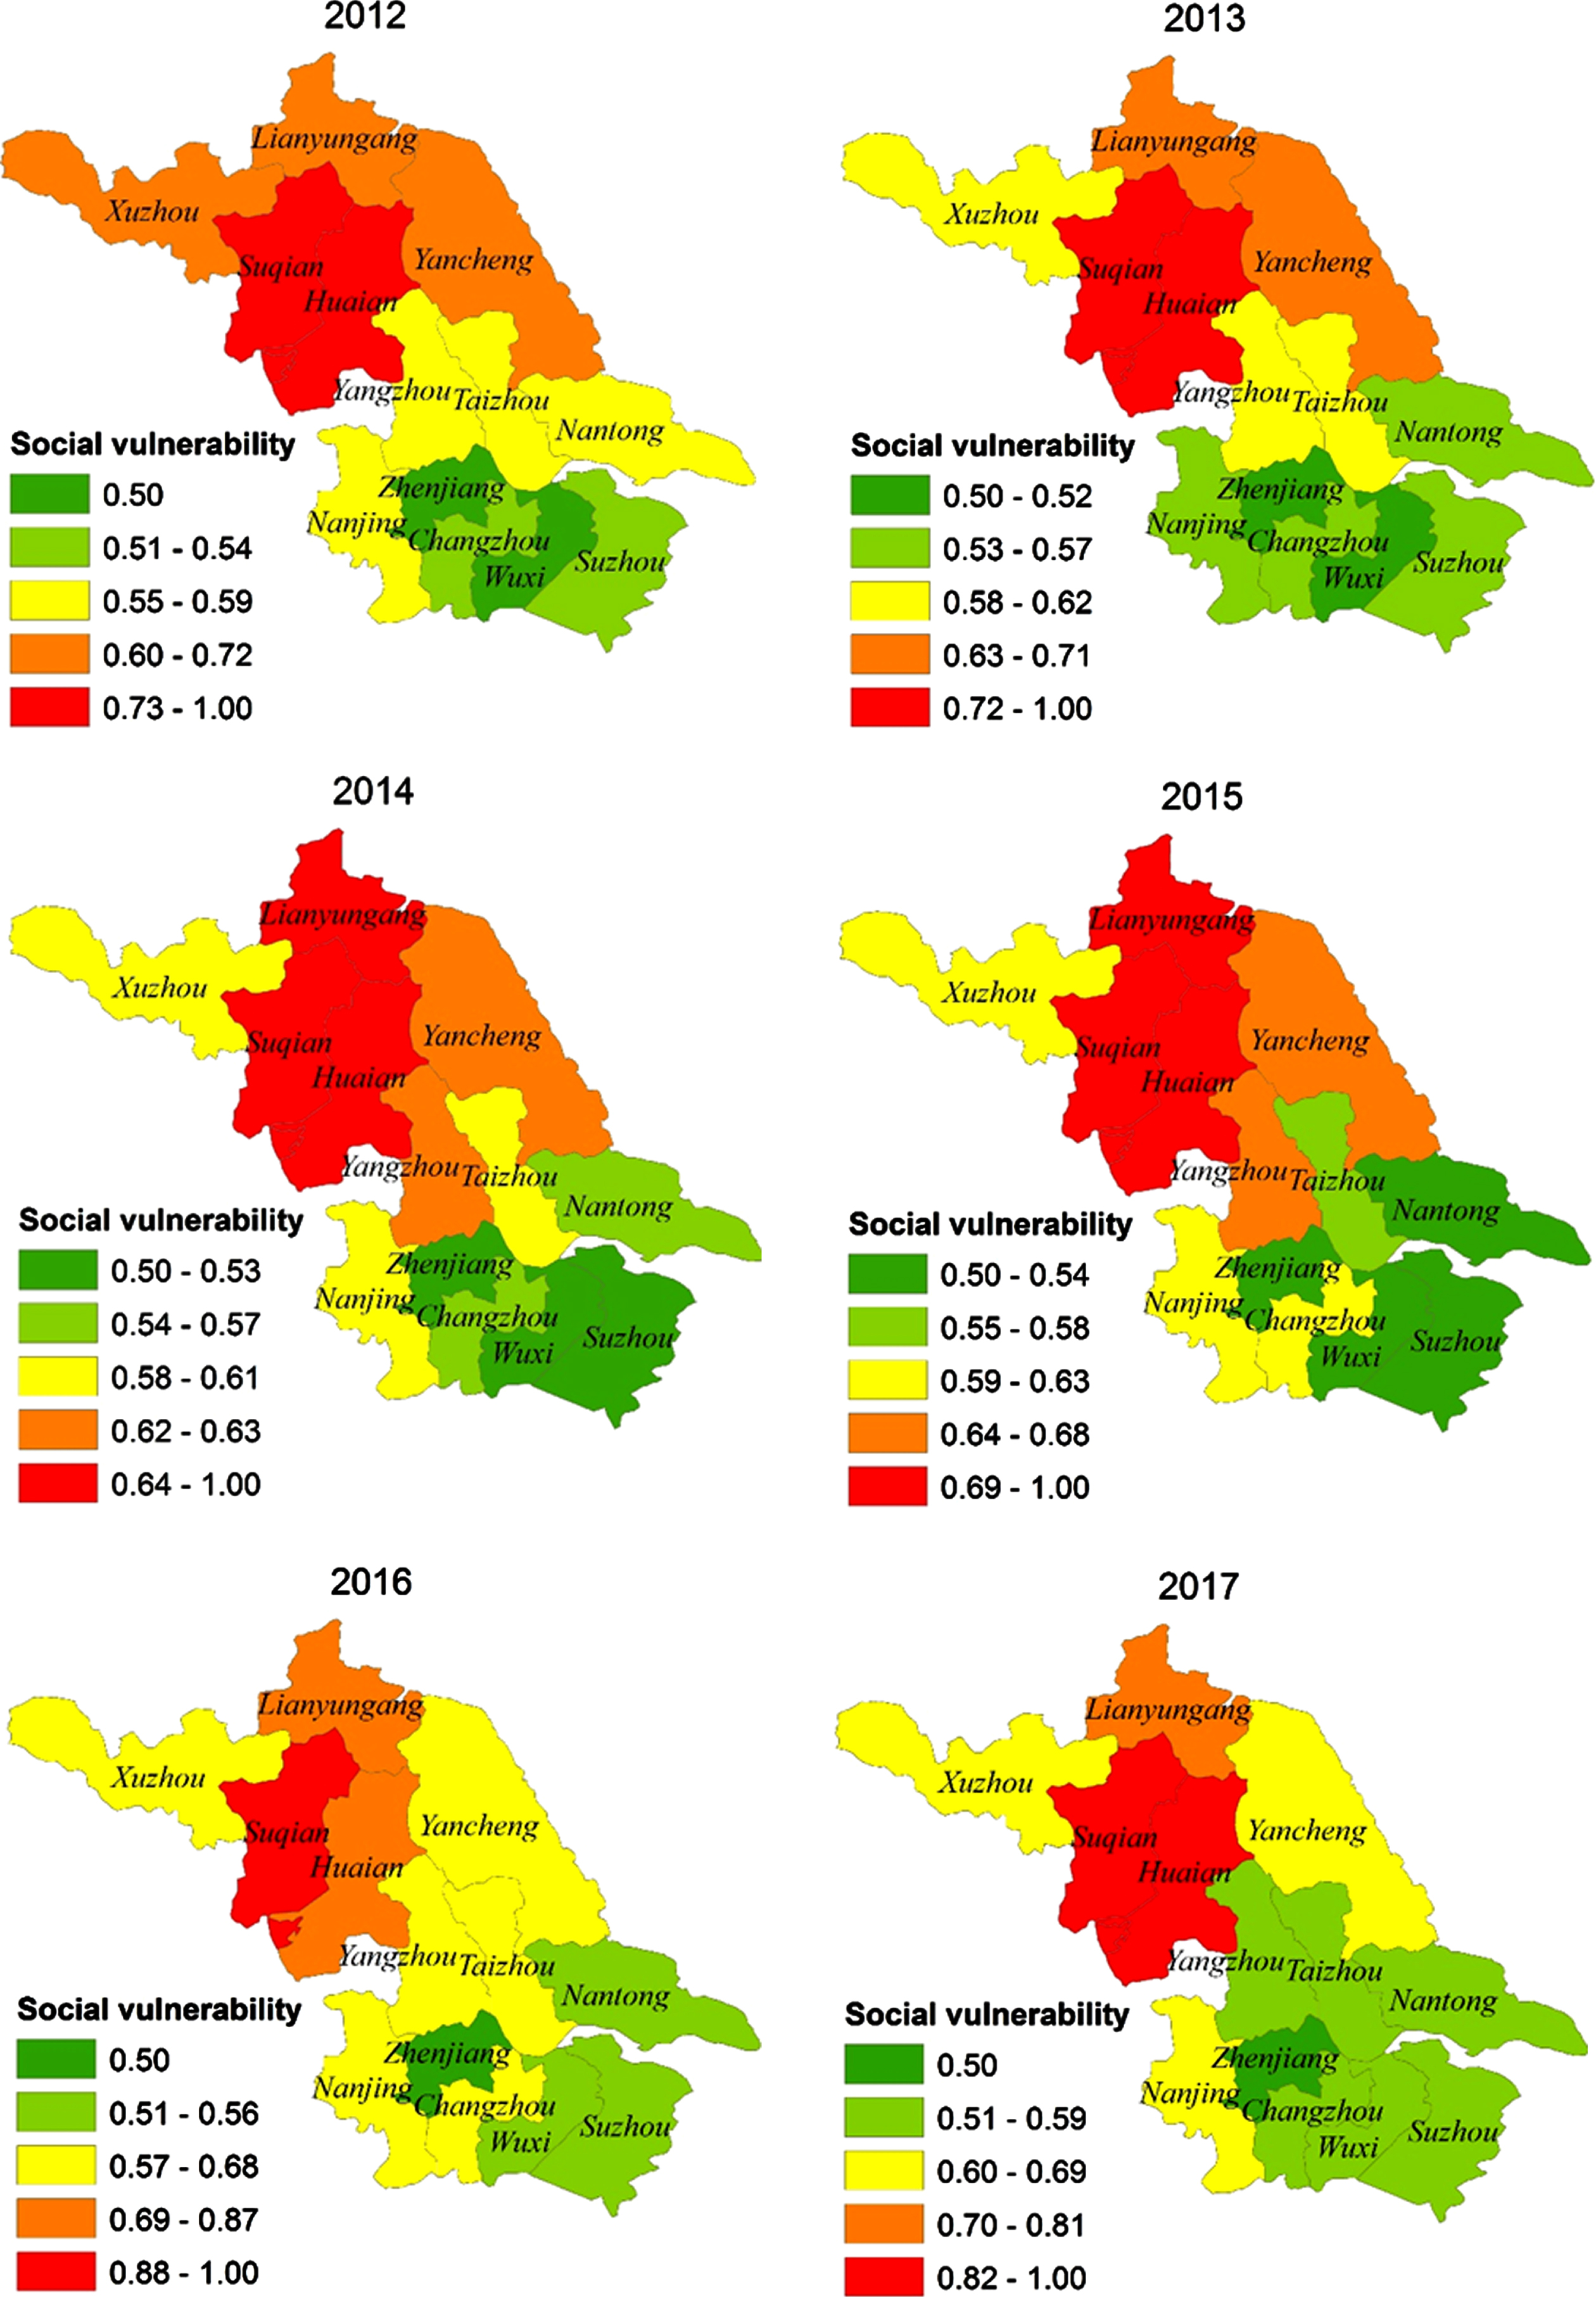
The distribution of social vulnerability for 13 cities from 2012 to 2017.
Social vulnerability varies according to the location of cities in Jiangsu province, as seen from Fig. 4. Particularly, the northern part performance is the worst among three regions. The average of the north part has always obviously exceeded the average of Jiangsu province from 2012 to 2017. Furthermore, the value of social vulnerability for the southern and central parts is below the province average. On the whole, the performance of the south part is relatively better than the central part in Jiangsu, but the gap is gradually narrowing. Remarkably, the value of social vulnerability for three parts is closely related to their economic development degree. For instance, the southern part represents the most advanced in Jiangsu province, which is the least vulnerable to hazards. On the contrary, the performance of the northern part is visibly far less than the southern part. The economy of the north part ranks the last in Jiangsu province, which makes it harder to stand up to the onslaught of disaster.
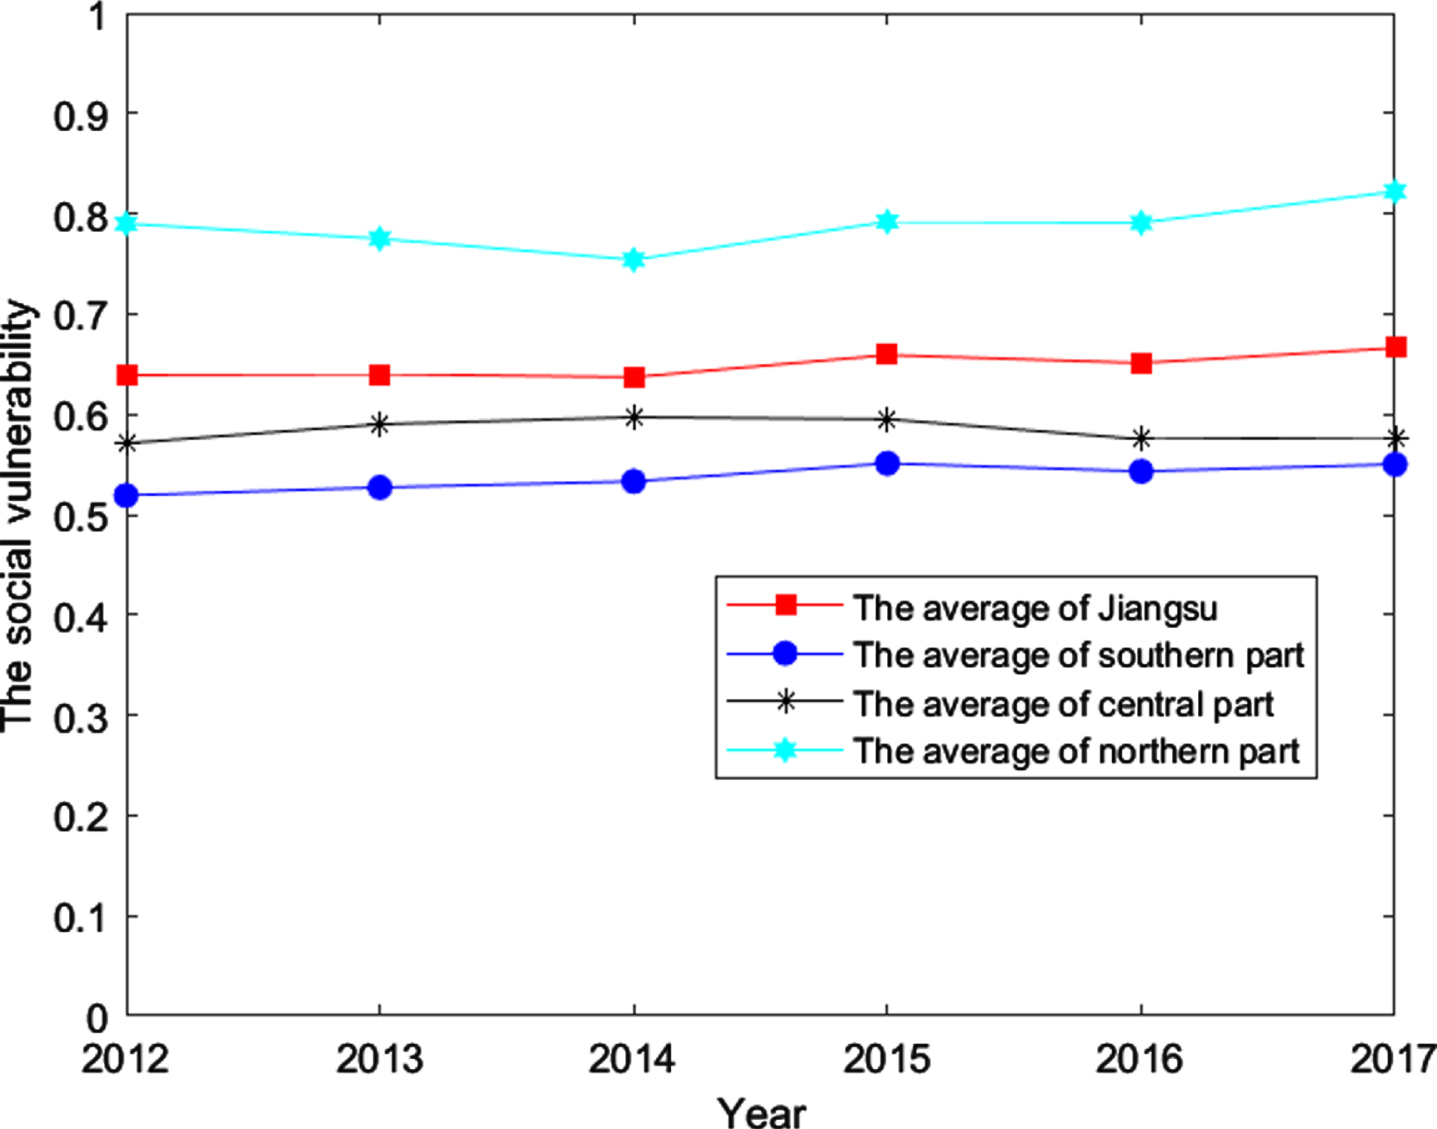
The average social vulnerability of three parts in Jiangsu province.
As the capital city of Jiangsu province, Nanjing’s social vulnerability has been rising from 2012 to 2017 in Fig. 5. Compared to other ones in the southern part, social vulnerability’s value has always been higher, indicating Nanjing is more vulnerable to natural hazards or shocks. The total population of Nanjing is the largest in Jiangsu province that poses a significant threat in resisting hazard. Risk management and prevention are supposed to be emphasized for the capital. In addition, Suzhou’s performance fluctuates little and remains at the bottom in terms of social vulnerability among the four cities, as does Wuxi. Changzhou’s social vulnerability peaked in 2015, and the value is second only to Nanjing among the southern part. Compared to the average of five cities, Changzhou is always above average. Moreover, Zhenjiang is the least socially vulnerable, and it has ranked the last among the four cities for the last six years. Per capita fixed asset investment of Zhenjiang far exceeds that of other cities, which is beneficial to reducing social vulnerability and improving the ability to respond to disasters.

The value of social vulnerability for cities in the southern part.
Yangzhou’s social vulnerability is at a moderate level among 13 cities between 2012 and 2017, as depicted in Fig. 6. In general, the economic development and infrastructure construction of Yangzhou have always been located in the middle class of Jiangsu province, which makes the moderately social vulnerable. Taizhou has a lower population than the other two cities in the central part. Given that its average performance in the economy and social security, the comprehensive degree of social vulnerability of Taizhou belongs to the intermediate level. Besides, the social vulnerability of Nantong is generally at a low level. It indicates that Nantong is equipped with a solid capability to disasters. Although the proportion of age 65 and over is higher than others among 13 cities, the performance of Nantong in terms of per capita balance of saving a deposit and per capita social security expenditure is excellent. Much financial support can be applied to the post-disaster relief and reconstruction that significantly reduce the social vulnerability of Nantong.

The value of social vulnerability for cities in the central part.
As shown in Fig. 7, the social vulnerability of Xuzhou is relatively low at the level of the northern part, but in the whole cities of Jiangsu, the value belongs to a middle position. In addition, Lianyungang’s performance is far from satisfactory due to the high ratio of agricultural. Considering the backward state of the economy, the per capita balance of saving a deposit and per capita net income of farmers in Lianyungang are significantly behind other cities, making it more vulnerable to disasters. Notably, Suqian has kept the highest score social vulnerability in the past six years. With the highest proportion of the agricultural population, it is much harder for Suqian to recover from hazards because most rural people lack adequate resources and conditions to resist risk. Furthermore, compared to other cities, Suqian’s economy ranks the last among the thirteen cities and the lowest ratio of tertiary industry and per capita GDP. All the above factors result in the worst performance for Suqian. Similarly, the remaining two cities, Huaian and Yancheng, are also much more vulnerable on account of the poor economic situation.

The value of social vulnerability for cities in the northern part.
TODIM is based on the prospect theory, which makes it different from TOPSIS and VIKOR. It considers the psychological behavior of decision-makers. Now, we discuss the parameter θ in Equation (12) of the TODIM. The parameter is the attenuation factor of the losses. Different θ can result in different prospect values, which can reflect the decision maker’s psychological behavior. Nanjing is taken as an example by assigning different values to the parameter to study the sensitivity. As described in Fig. 8, the social vulnerability varies when the recession coefficient takes different values. It also reflects the advantage of the TODIM method, which considers the psychological behavior characteristic of decision-makers. When the parameter value increases, the social vulnerability decreases. The findings indicate that the more the parameter θ, the less social vulnerability. The decision-makers are less sensitive to the losses.

Impact of parameter θ on the social vulnerability of Jiangsu province.
Now, we make some comparative experiments to show the advantages and differences of the proposed method. The TODIM is solely used to make evaluations, and the weights among different criteria are the same as each other, i.e., 1/22. The evaluation results are listed in Table 11, in which s13 > s8 > s7 > s9 > s3 > s10 > s6 > s12 > s1 > s4 > s5 > s11 > s2.
The evaluation results based on the TODIM
The evaluation results based on the TODIM
The ranking of social vulnerability in Jiangsu province is Suqian >Huaian>Lianyungang >Yancheng>Xuzhou>Yangzhou>Nantong>Taizhou>Nanjing>Changzhou>Suzhou>Zhenjiang >Wuxi, which is similar to the proposed method. However, the differences among these cities are pretty more minor than the proposed method. The main reason is that we introduce the maximizing deviation method to calculate weights. To make the ranking result more significant, one has a smaller deviation value assigned a small weight; otherwise, one makes a more considerable deviation value assigned a more considerable weight. In the MCDM method, it is desirable that the difference among evaluation results should be more, which is convenient to make decision-makers. Therefore, the proposed method is superior to the conventional TODIM.
Social vulnerability has become an essential part of risk management. Our study explores the social vulnerability assessment of Jiangsu province at a city level from 2012 to 2017. Index system of social vulnerability has been constructed from three dimensions of demographics, economics, and social security. Based on the maximizing deviation method and the TODIM model, a new approach is proposed to evaluate social vulnerability in Jiangsu province.
As a result, the social vulnerability in the northern part is the worst, and the average value has always obviously exceeded others from 2012 to 2017. Furthermore, the value of social vulnerability for the southern and central parts is below the province average. It is found that social vulnerability is related to the degree of economic development to some extent. The most advanced ones are the least vulnerable to hazards, while the back is less capable of resisting risks. In addition, the sensitivity test has been performed for the recession coefficient, reflecting the preference of the decision-maker.
The government should further make the public aware of the implications of natural disasters clearly, especially farmers sensitive to hazard. Therefore, decreasing social vulnerability needs to enhance public consciousness of risk. Besides, solid financial support is of great significance for improving the ability to resist disasters. The funding for education and health service needs to be increased to reduce social vulnerability. In general, this study explores the research about social vulnerability in China and provides references for the government.
Footnotes
Acknowledgments
This research was funded by the China Natural Science Foundation (No. 71974100, No. 41501555), Natural Science Foundation in Jiangsu Province (No. BK20191402), Major Project of Philosophy and Social Science Research in Colleges and Universities in Jiangsu province (2019SJZDA039), Qing Lan project (R2019Q05), Postgraduate research and innovation plan project (SJCX21_0384) in Jiangsu Province and Social Science Research in Colleges and Universities in Jiangsu province (2019SJZDA039).