
Abstract
Machine learning approaches have a valuable contribution in improving competency in automated decision systems. Several machine learning approaches have been developed in the past studies in individual disease diagnosis prediction. The present study aims to develop a hybrid machine learning approach for diagnosis predictions of multiple diseases based on the combination of efficient feature generation, selection, and classification methods. Specifically, the combination of latent semantic analysis, ranker search, and fuzzy-rough-k-nearest neighbor has been proposed and validated in the diagnosis prediction of the primary tumor, post-operative, breast cancer, lymphography, audiology, fertility, immunotherapy, and COVID-19, etc. The performance of the proposed approach is compared with single and other hybrid machine learning approaches in terms of accuracy, analysis time, precision, recall, F-measure, the area under ROC, and the Kappa coefficient. The proposed hybrid approach performs better than single and other hybrid approaches in the diagnosis prediction of each of the selected diseases. Precisely, the suggested approach achieved the maximum recognition accuracy of 99.12%of the primary tumor, 96.45%of breast cancer Wisconsin, 94.44%of cryotherapy, 93.81%of audiology, and significant improvement in the classification accuracy and other evaluation metrics in the recognition of the rest of the selected diseases. Besides, it handles the missing values in the dataset effectively.
Keywords
Introduction
Currently, the whole world is suffering severely from the COVID-19 pandemic [1]. The person who had a history of other deadly diseases like, cancer, tumor, heart disease, lungs, and diabetes, etc. is affected the most with COVID-19 [2]. Besides, COVID-19 has a long-term impact on mental health, immunity, and fertility, etc. [3–5]. The early-stage diagnosis prediction of severe diseases is useful to save human life and it is a critical task for the health care system. The known risk factors and symptoms are useful in the early-stage diagnosis and treatment of deadly diseases. Besides, the cutting-edge clinical diagnosis techniques are playing a vital and supportive role in the health care system for early-stage disease diagnosis [6]. The analysis of the measurements of most of the clinical techniques in diagnosis prediction is a tedious and time-consuming process and depends on the expertise of doctors and health care workers [7]. There is a need to automate the diagnosis prediction system in order to improve its accuracy and to reduce its current limitations. For the last few years, artificial intelligence (AI) is contributing to the automation of the decision process in each aspect of human life. Specifically, the machine learning approaches have been widely employed in improving the decision in health, agriculture, business, energy, security, and safety [8–12]. Exploring the full potential of machine learning for its application in medical science is a demanding research issue that needs to be addressed in the future. The implementation of machine learning-based software and hardware development will assist in faster diagnosis prediction of deadly diseases at low cost which will ultimately reduce the workload of the health care system in coming years [13, 14]. Besides, it can be also used in monitoring the condition of patients during and after treatment. Such development will boost the efficiency of the existing clinical diagnosis and treatment procedures. Many single and combined machine learning approaches have been developed and implemented in the past studies for disease diagnosis prediction. Though, the development of machine learning approaches that can be used for the diagnosis prediction of multiple diseases with high accuracy is an existing research problem that is not explored enough. It is essential for the development of the futuristic automated disease diagnosis system.
Related previous research
In recent studies, classification methods and combinations of feature selection and classification methods have been implemented in the diagnosis prediction of the primary tumor, post-operative patient, breast cancer, breast cancer Wisconsin, audiology, lymphography, breast cancer survival (Haberman’s Survival), wart treatment using cryotherapy, fertility, immunotherapy in the treatment of wart, and COVID-19 [8, 15–23]. It was noticed that the selected features improved the prediction accuracy of the classification methods [15–19]. Therefore, combining feature selection methods with classifiers can be used in improving the accuracy of diagnosis prediction. However, the selection of efficient attributes is an important research issue. Also, it was noticed that the fuzzy approaches have better performance in modeling a dynamic system and classification [9, 19]. Moreover, the disease datasets have fuzzy nature, like the post-operative patient dataset [16]. The disease dataset may contain the nominal attributes and missing values of some of the attributes like breast cancer, audiology, and Primary tumor [24, 25], etc.
Motivation and contribution of present research
The survey of the existing machine learning methods in the diagnosis prediction of disease points out the better performance of the combination than the single machine learning approach. Though, it is hard to find out some hybrid machine learning approaches based on the combination of the feature generation, feature selection, and classification methods that can be used in the diagnosis prediction of multiple diseases. This is the main inspiration of the current research. With this motivation, a novel hybrid machine learning method based on the combination of feature generation using latent semantic analysis, feature selection using ranker search, and classification using the fuzzy-rough-k-nearest neighbor methods is implemented in the diagnosis prediction of eleven benchmark disease datasets compiled from the University of California, Irvine (UCI) machine learning repository [24]. Besides, the limitation of the fuzzy-rough-k-nearest neighbor method to deal with the missing values of the attributes is another motivation behind the present research. The main contributions of the present study are as follows.
• A hybrid machine learning approach for the diagnosis prediction of multiple deadly diseases (cancer, tumor, and surgery survival, and COVID-19, etc.).
• Performance comparison analysis of the proposed hybrid approach with single and combined machine learning approaches, and methods implemented in past studies.
• Better evaluation metrics of the proposed hybrid machine learning approach than the single and other hybrid approaches.
The organization of the rest part of the paper is as follows. The details of the disease datasets are presented in section 2. The description of the proposed hybrid machine learning approach and its components is detailed in section 3. The results of the study are presented in section 4 and discussed in section 5. Section 6 concludes the findings of the study.
Experimental disease datasets
Eleven benchmark disease datasets, including audiology (AU), breast cancer (BC), breast cancer Wisconsin (BW), COVID-19 (CO), cryotherapy (CR), fertility (FR), Haberman’s Survival (HS), immunotherapy (IM), lymphography (LY), post-operative patient (PO), and primary tumor (PT) have been obtained from the UCI machine learning repository [24]. The benchmark disease datasets have been used in the validation of the proposed machine learning approach. The basic summary of the disease datasets has been presented in Table 1. The AU dataset contains 24 types of audiology diseases [24, 25]. The BC dataset has two classes (no-recurrence events and recurrence events) [24]. The BW dataset has two classes (benign and malignant) [26]. The CO dataset has three classes (patient under supervision (PUS), person in monitoring (PIM), and person without symptoms (PWS)) [23]. The CR, HS, and IM datasets have two classes with labels ‘1’ and ‘2’ [21, 26]. The fertility dataset has two classes with labels ‘N’ and ‘O’ [28]. The LY dataset has four classes (normal, metastases, malign lymph, and fibrosis). The PO dataset has three classes (patient sent to the intensive care unit (ICU), home, and general hospital floor) [24, 25]. The PT dataset has 22 types of primary tumors. Further details can be seen in Refs. [21–28].
Experimental disease datasets
Experimental disease datasets
The algorithmic table of the proposed hybrid approach (feature generation, feature selection, and classification) is shown in Fig. 1. A short description of each of the components of the hybrid approach is as follows.
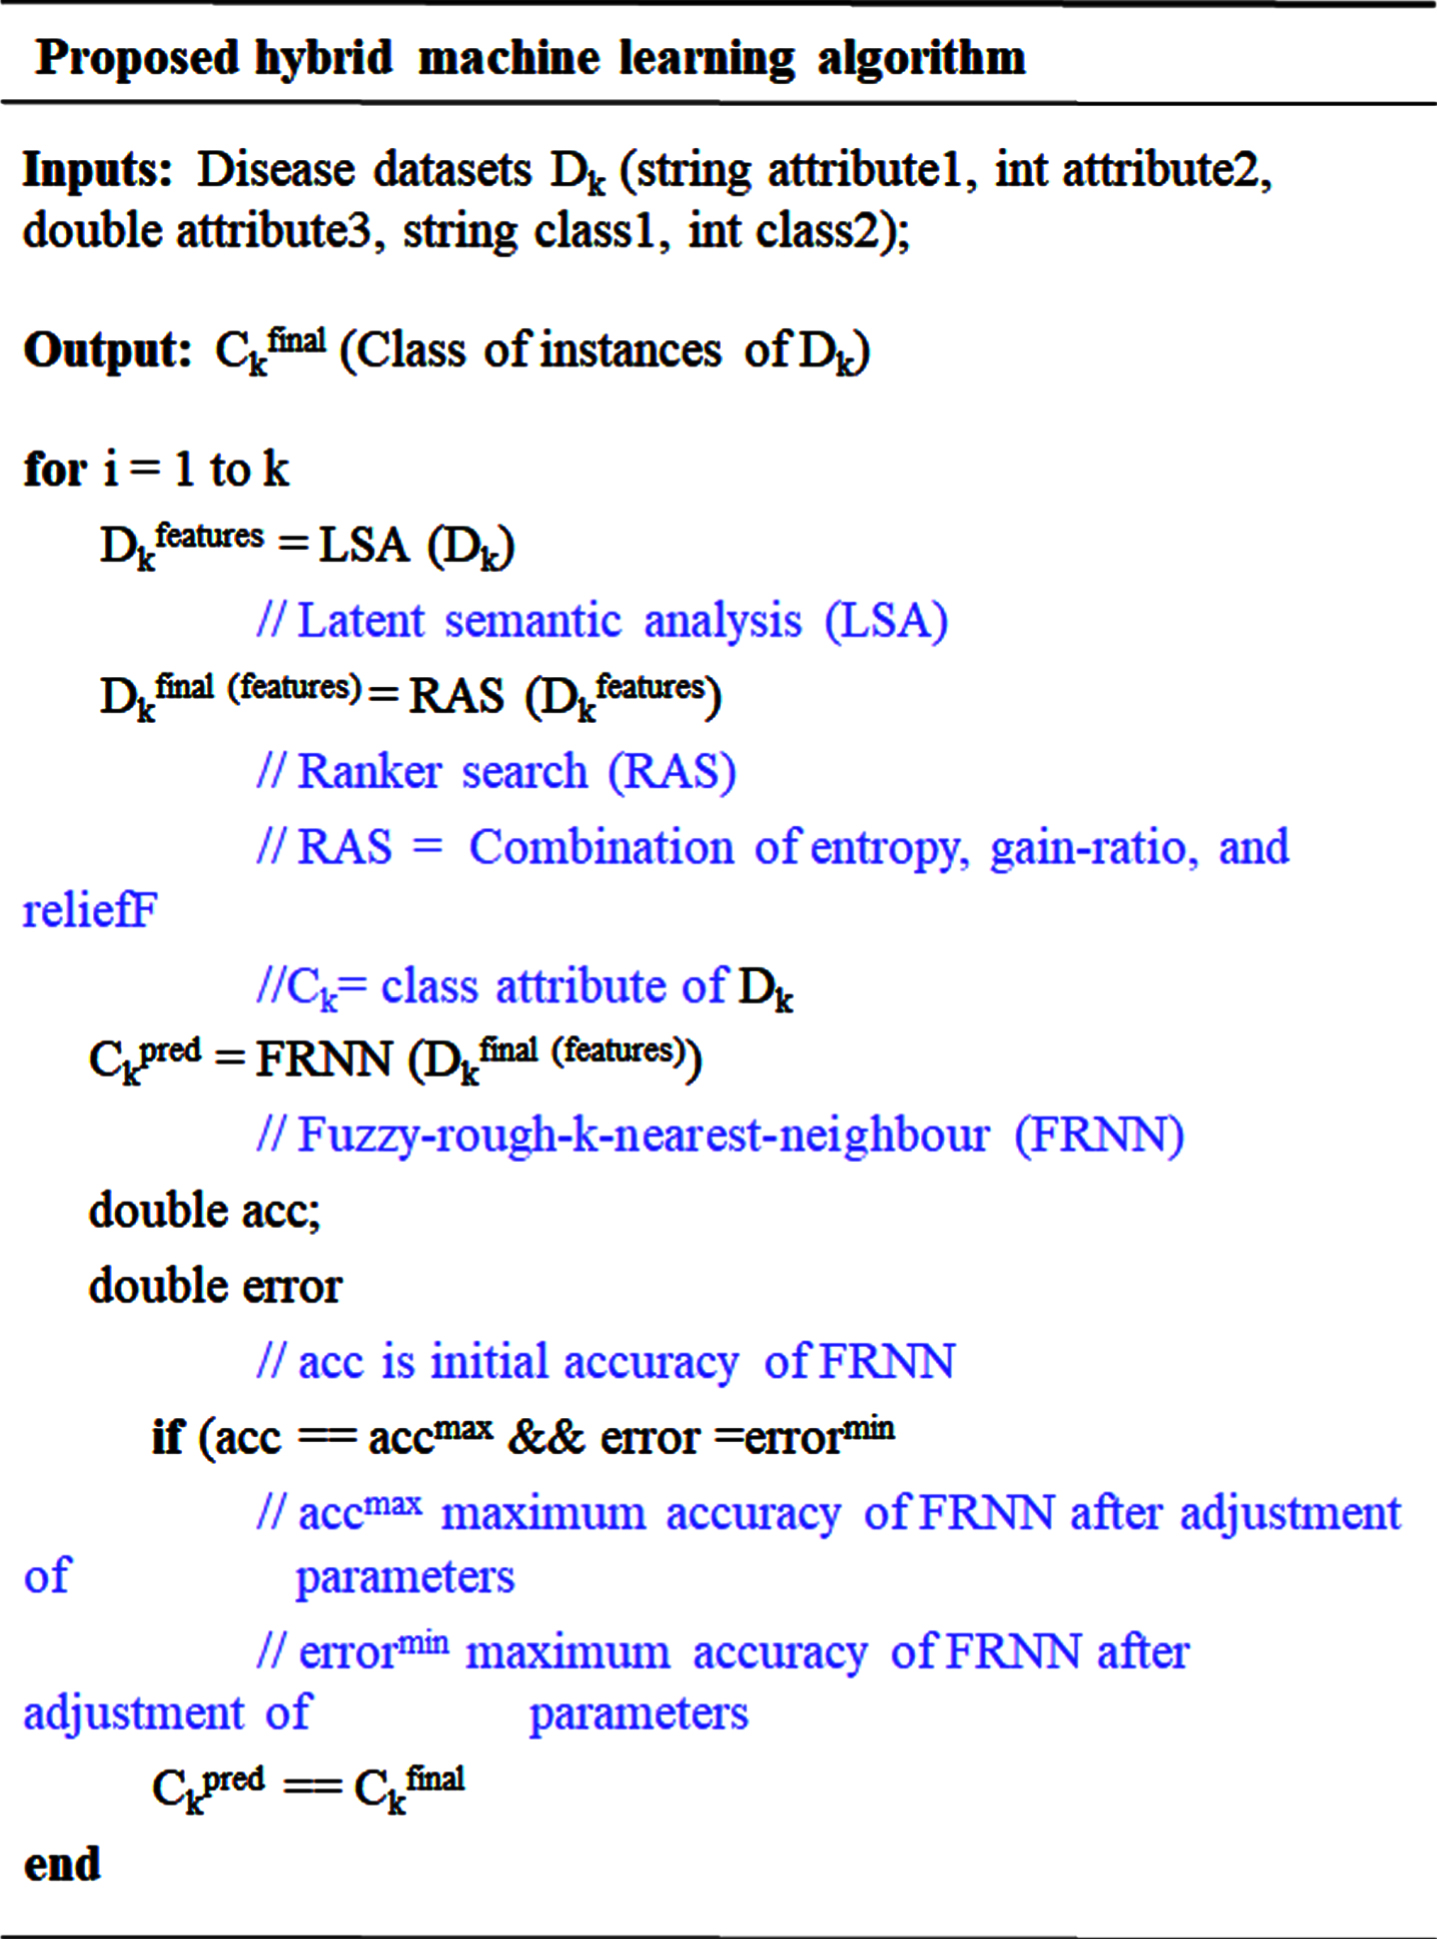
Algorithmic table of the proposed hybrid machine learning approach (LAS-RAS-FRNN)
The novel features subsets are generated using the latent semantic analysis (LSA) of the original attributes of each of the datasets, independently. The LSA executes in the following steps [29].
•A term-document matrix
•
•Normalized
•Reconstruction of
The reconstructed term-document matrix represents the novel features, generated using the combination of the original attributes. Thereafter, the optimal features are obtained using the ranker search (RAS). The RAS is mainly a combination of entropy, gain-ratio, and reliefF evaluation metrics. Therefore, it is more efficient in the selection of optimal features generated by LSA [30]. The entropy (information required) of an instance for its class recognition is computed as
In the relief, a preliminary weight of each of the attributes is assumed initially. The Euclidian distance between the adjacent hit (H) and miss (M) is used to adjust the values of the initial weight as Wi = Wi - (a i - H i ) 2 + (a i - M i ) 2. The Manhattan distance is used in the selection of the optimal features in the reliefF measure [32]. The optimal features generated and selected using the combined approach of LSA and RAS are used in the class recognition of instances.
Fuzzy-rough-k-nearest neighbor for class recognition
Fuzzy-rough set is a hybrid machine learning approach of fuzzy sets (model imprecise linguistic data) and rough sets (model incomplete information) [33, 34]. The K-nearest neighbor (KNN) is a simple approach to classify a test instance to the class of its ‘k’ nearest neighbor using some distance measure. Besides, its simplicity, it has good performance in many domains [35]. Though due to its basic assumption of equal weights to all nearest neighbors and discarding the significance of rest, and tough to select the optimal number ‘k’, improved versions of KNN have been developed. The concept of the fuzzy set is used to improve the performance of KNN [36]. The fuzzy nearest neighbor algorithm (FNN) calculates the degree of fuzzy similarity of an unknown test instance with all training instances. Thereafter the ‘k’ instances of the maximum degree of similarity are selected and the test instance is assigned to the class of maximum degree of similarity [34]. The degree of membership of an unknown instance y to class C is computed as C′ (y) = ∑x∈NR (x, y) C (x). R (x, y) (similarity of x and y) computed as R (x, y) = (∥ y - x ∥ -2/(m-1)/ ∥ y - j ∥ -2/(m-1)). The weights of the similarity are controlled using the parameter m. The hybrid fuzzy-rough set-KNN (fuzzy-rough-k-nearest-neighbor (FRNN)) is developed with the objective to further improve the classification performance of FNN and KNN. A test instance is assigned to a specific class according to its membership of fuzzy lower and upper approximations defined by the nearest neighbors. The performance of the FRNN depends on the fuzzy tolerance relation (R) defined as
Evaluation metrics
The performance of FRNN is evaluated in terms of classification accuracy, analysis time, Folkes-Mallows index, Kappa coefficient, F-measure, precision (positive predictive value), and recall (sensitivity), etc. F-measure is computed using the harmonic mean of precision and recall. The area of receiver operating characteristic (ROC) curve is calculated as ROC
area
= 1 + (TP/ TP + FN) - (FP/ FP + TN)/ 2 [37], where TP is true positive, FP is false positive, FN is false negative, and TN is true negative. Kulczynski’s measure and Folkes-Mallows index is the arithmetic mean and geometric mean of precision and recall, respectively [38]. Kappa coefficient is calculated using the confusion matrix as

The design of the proposed hybrid approach.
Selected features
Features subsets selected by the hybrid approach of LSA-RAS are summarized in Table 2. The LSA generates the novel virtual attributes (latent variables) considering the contributions of each of the experimental features of the dataset. Thereafter, RAS selects an optimal subset of features according to the ranking of the LSA-generated latent variable.
Selected features and their ranking
Selected features and their ranking
It is obvious from Table 2 that the number of generated and selected latent variables varies according to the number of original attributes in the dataset. It is a maximum (20) for BC and a minimum (1) for HS and CS datasets. The visual discrimination of instances of PT and BW datasets in latent variable space (LV1 vs. LV2) is shown in Fig. 3 and Fig. 4, respectively. Similar representations for other datasets can be obtained. Most of the classes of the primary tumor are well discriminated in Fig. 3 except a few overlapping. Due to a large number of types (22) of the primary tumor and the uneven distribution of instances, it is not possible to count the exact number of the instances of the overlapping classes. The BW dataset has only two classes, therefore the discrimination of their instances in Fig. 4 is more obvious. Still, there are few overlapping instances of both classes. The performance of LSA-RAS-FRNN has been assessed in terms of classification accuracy (CC), errors (root mean square error (RMSE), and other evaluation metrics. Besides, the performance of LSA-RAS-FRNN is compared with the LSA-RAS-FNN. The performance of the LSA-RAS-FRNN is summarized in Table 3 and Table 4. It is obvious from Table 3 that the LSA-RAS-FRNN has the maximum accuracy and Kappa coefficient and the minimum RMSE in the recognition of each of the diseases than the LSA-RAS-FNN. Moreover, the FRNN and FNN using the original attributes of the disease datasets have an inferior recognition performance than the LSA-RAS-FNN and LSA-RAS-FRNN (Table 3). The LSA-RAS-FRNN has the maximum accuracy of 99.12%in the recognition of the primary tumor and the minimum accuracy of 71.43%in the recognition of COVID-19. Though an improvement in recognition accuracy of 21.43%of LSA-RAS-FRNN compared to the accuracy of FNN and LSA-RAS-FNN, and 14.29%compared to the accuracy of FRNN has been obtained in the analysis of the COVID-19 dataset. The classification accuracy of the LSA-RAS-FRNN lies between 71.43–99.12%in the recognition of the rest of the diseases. The evaluation metrics results in Table 4 complements the results in Table 3, like the maximum value of the precision, recall, F-measure, and ROC⟶1 of the LSA-RAS-FRNN in the analysis of the primary tumor dataset. The average value of the evaluation metrics (precision, recall, F-measure, and ROC) in between 0.7–0.8 has been obtained in the analysis of the Immunotherapy and COVID-19 datasets. The evaluation metrics of the LSA-RAS-FRNN lies between 0.7–0.9 in the recognition of the rest of the diseases.

Latent variables score plot of PT dataset.

Latent variables score plot of BW dataset.
Recognition performance of FNN and FRNN
Note: CC-correct classification rate in %, RMSE-root means square error, and k- Kappa coefficient.
Other evaluation metrics of FNN and FRNN
Note: Prec.-precision and F-F measure.
The error curves of the FNN and FRNN using the original attributes of the LSA-RAS selected features in the analysis of the primary tumor and breast cancer Wisconsin datasets are shown in Fig. 5 and Fig. 6, respectively. The miss-classification of instances of the 22 types of the primary tumor is denoted by the different color square symbols in the error curve (Fig. 5(a)-(d)). A similar representation of the misclassification of instances of the two types of breast cancer Wisconsin is demonstrated in Fig. 6(a)-(d). The error curves of FNN, FRNN, LSA-RAS-FNN, and LSA-RAS-FRNN in the analysis of the rest of the dataset can be plotted but contains additional misclassified instances.

Error curve of (a) FNN, (b) FRNNA, (c) LSA-RAS-FNN, and (d) LSA-RAS-FRNN in the analysis of primary tumor dataset.
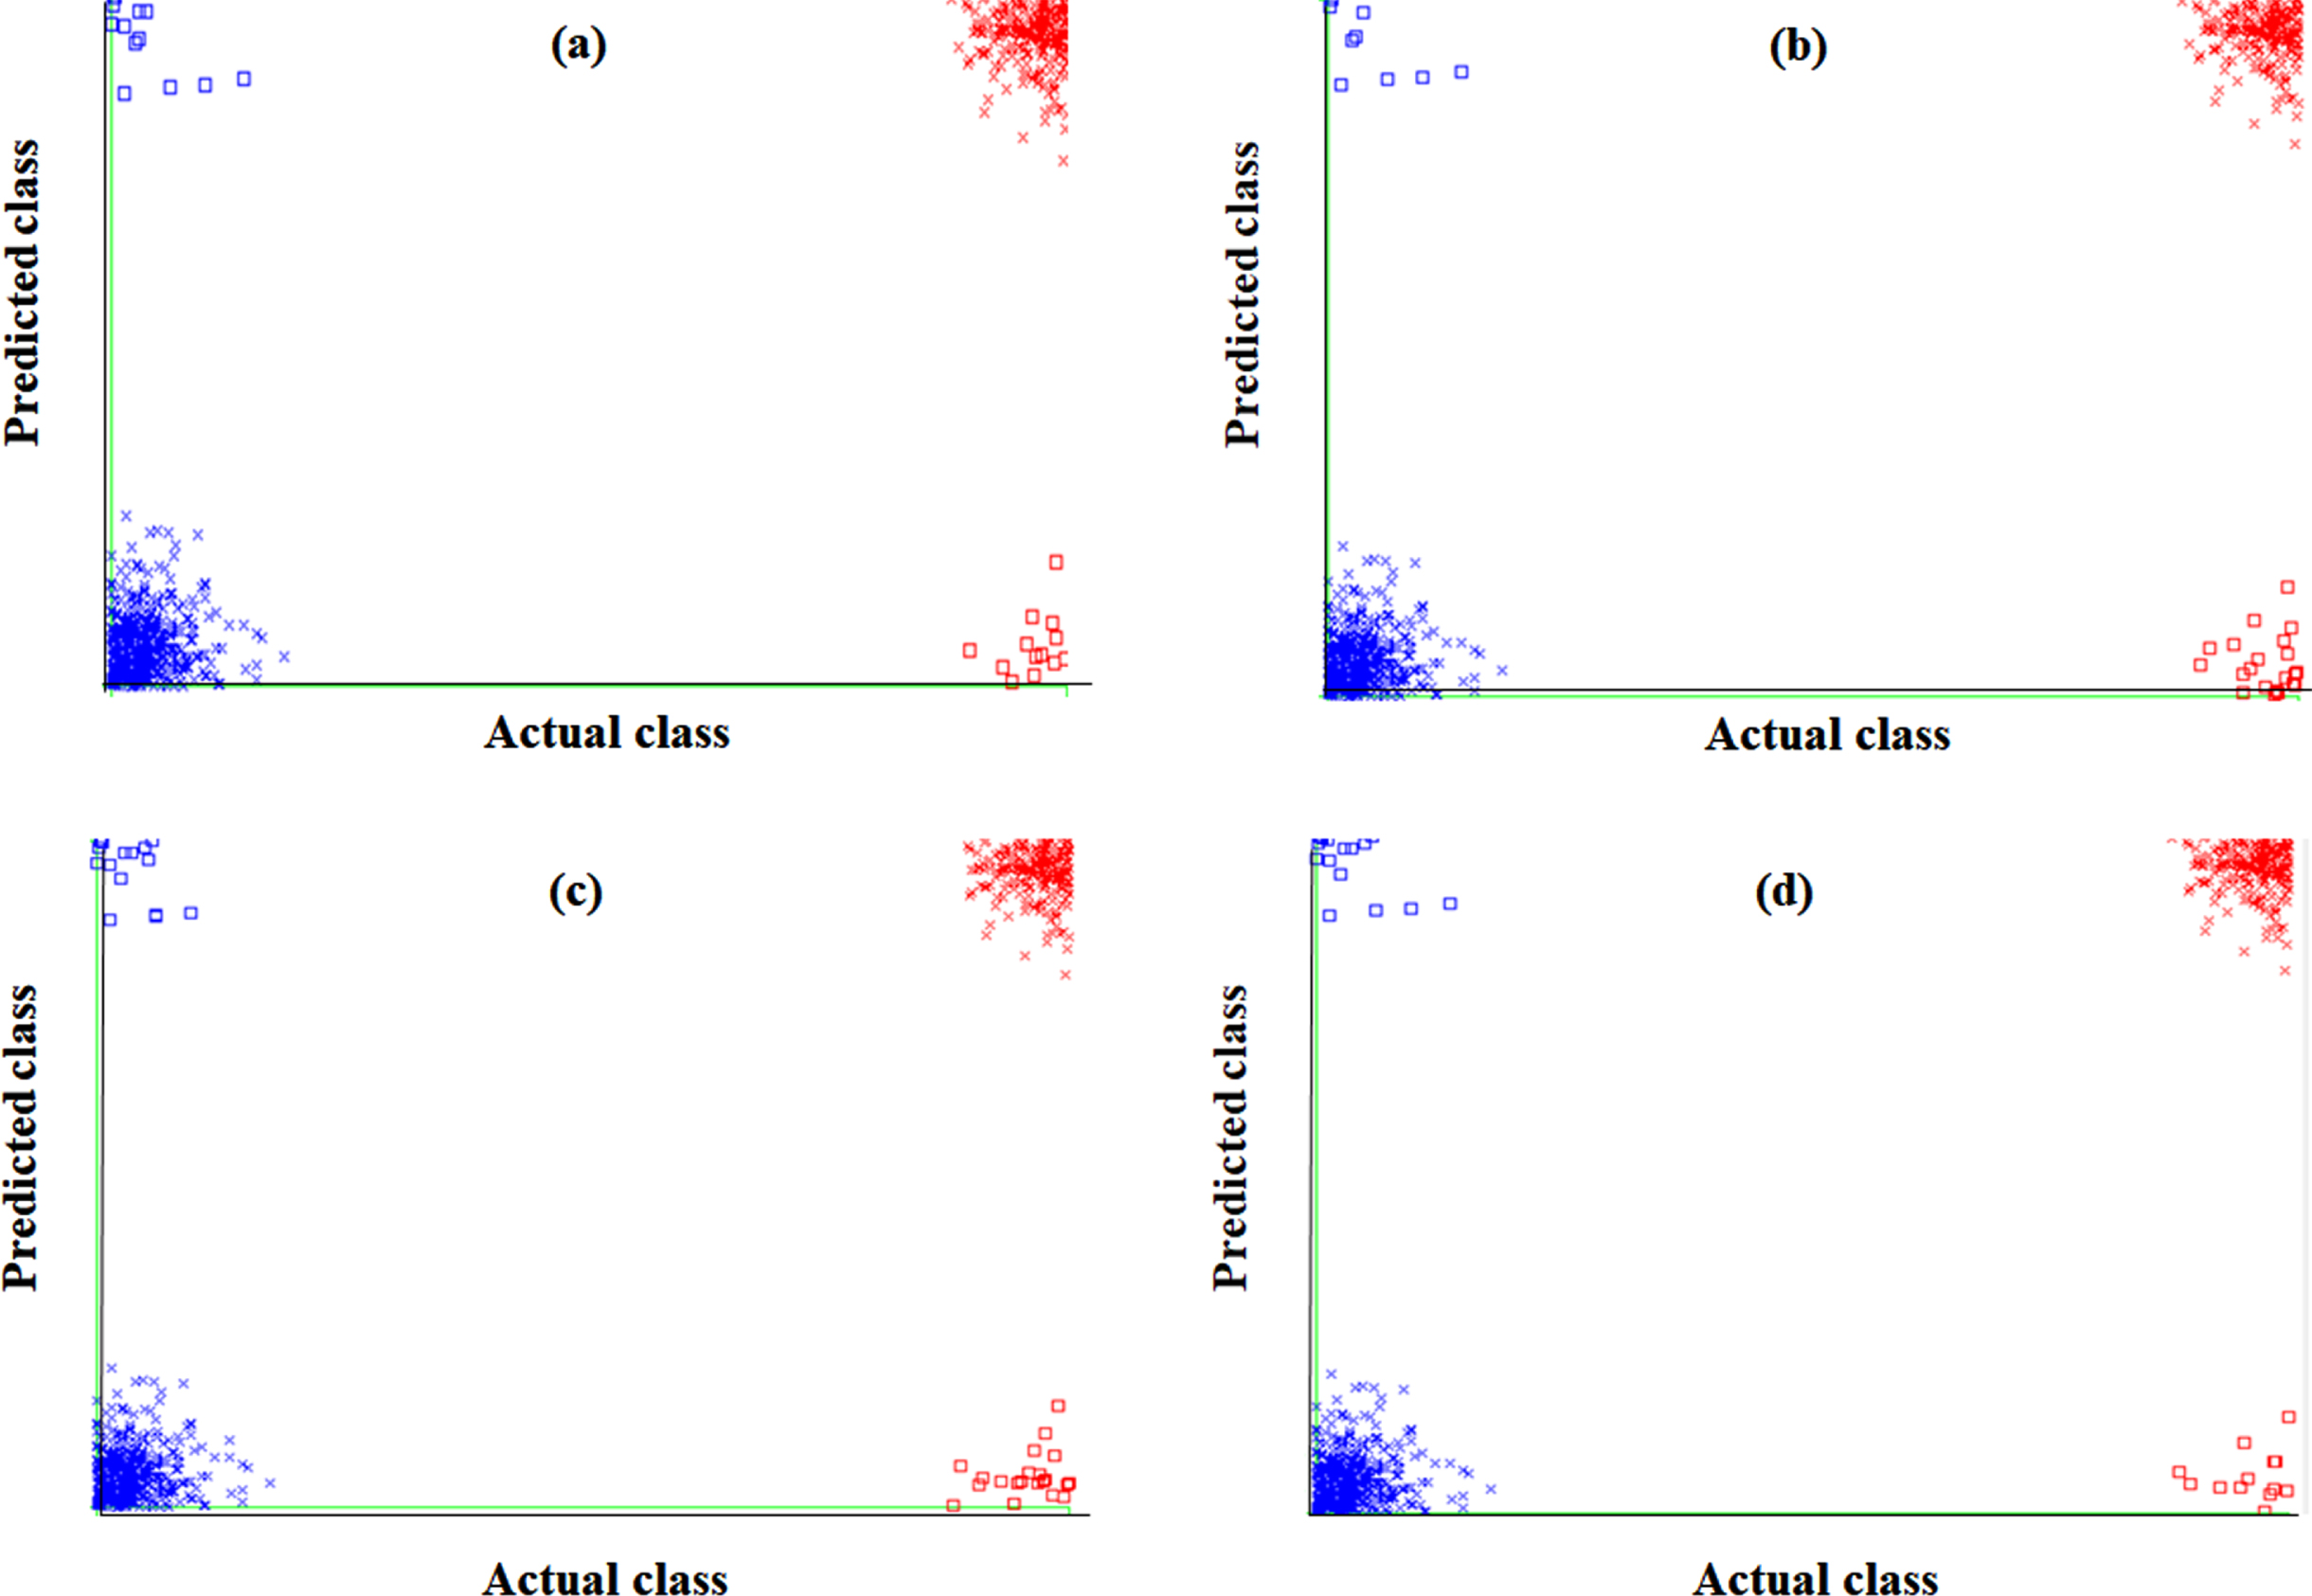
Error curve of (a) FNN, (b) FRNNA, (c) LSA-RAS-FNN, and (d) LSA-RAS-FRNN in the analysis of breast cancer Wisconsin dataset.
The class-wise area under the ROC curve of FRNN and LSA-RAS-FRNN in the analysis of the breast cancer Wisconsin dataset is demonstrated in Fig. 7 (a)-(d), respectively. A similar representation in the analysis of the primary tumor dataset for two classes (lung and head and neck) is shown in Fig. 8(a)-(d) . The area under the ROC curve can be plotted for the rest of the classes of the primary tumor also. The minimum area under the ROC (0.496) is obtained for the testis and vagina classes of the primary tumor. It is obvious that the two classes (Benign and Malignant) of breast cancer Wisconsin have an area under ROC⟶0.99. The area under the ROC of FRNN and LSA-RAS-FRNN can be plotted for other datasets also. Figure 9 represents the margin curve of FRNN and LSA-RAS-FRNN in the analysis of the breast cancer Wisconsin dataset. A similar margin curve in the analysis of the primary tumor dataset for two classes (lung and head and neck) is shown in Fig. 10.
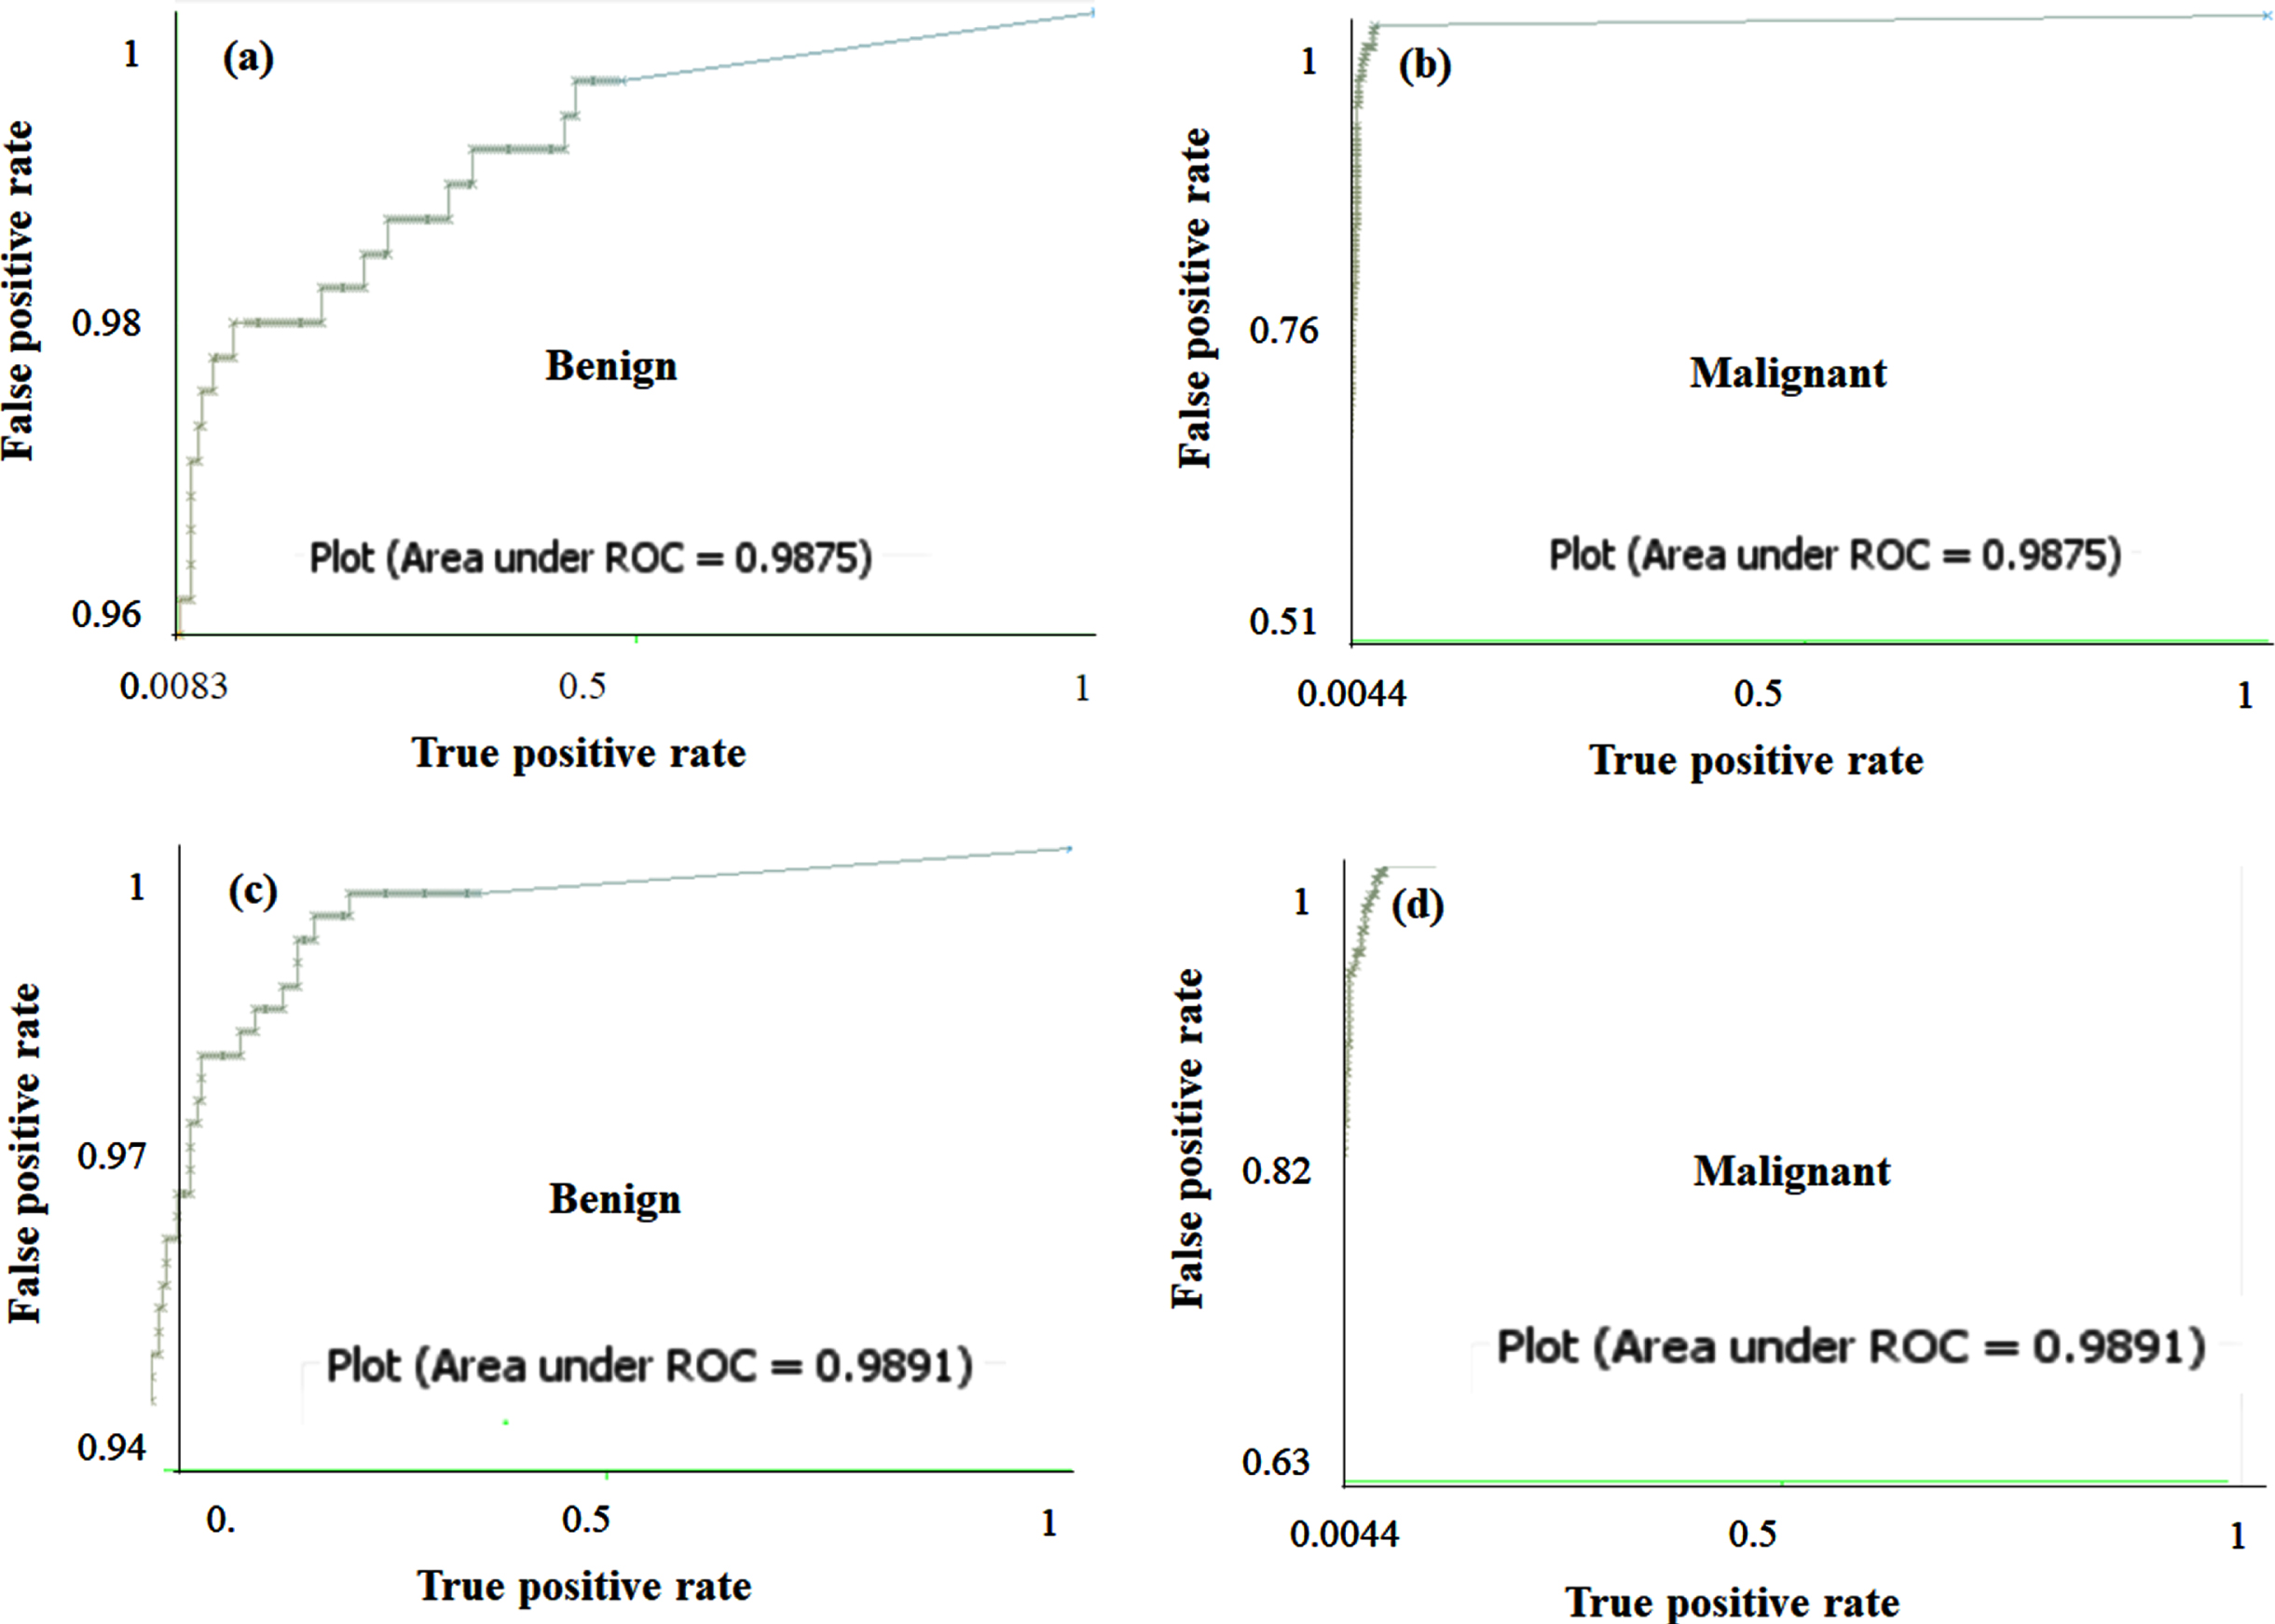
The area under the ROC curve of FRNN for (a) Benign, (b) Malignant and LSA-RAS-FRNN for (c) Benign, and (d) Malignant classes of breast cancer Wisconsin.
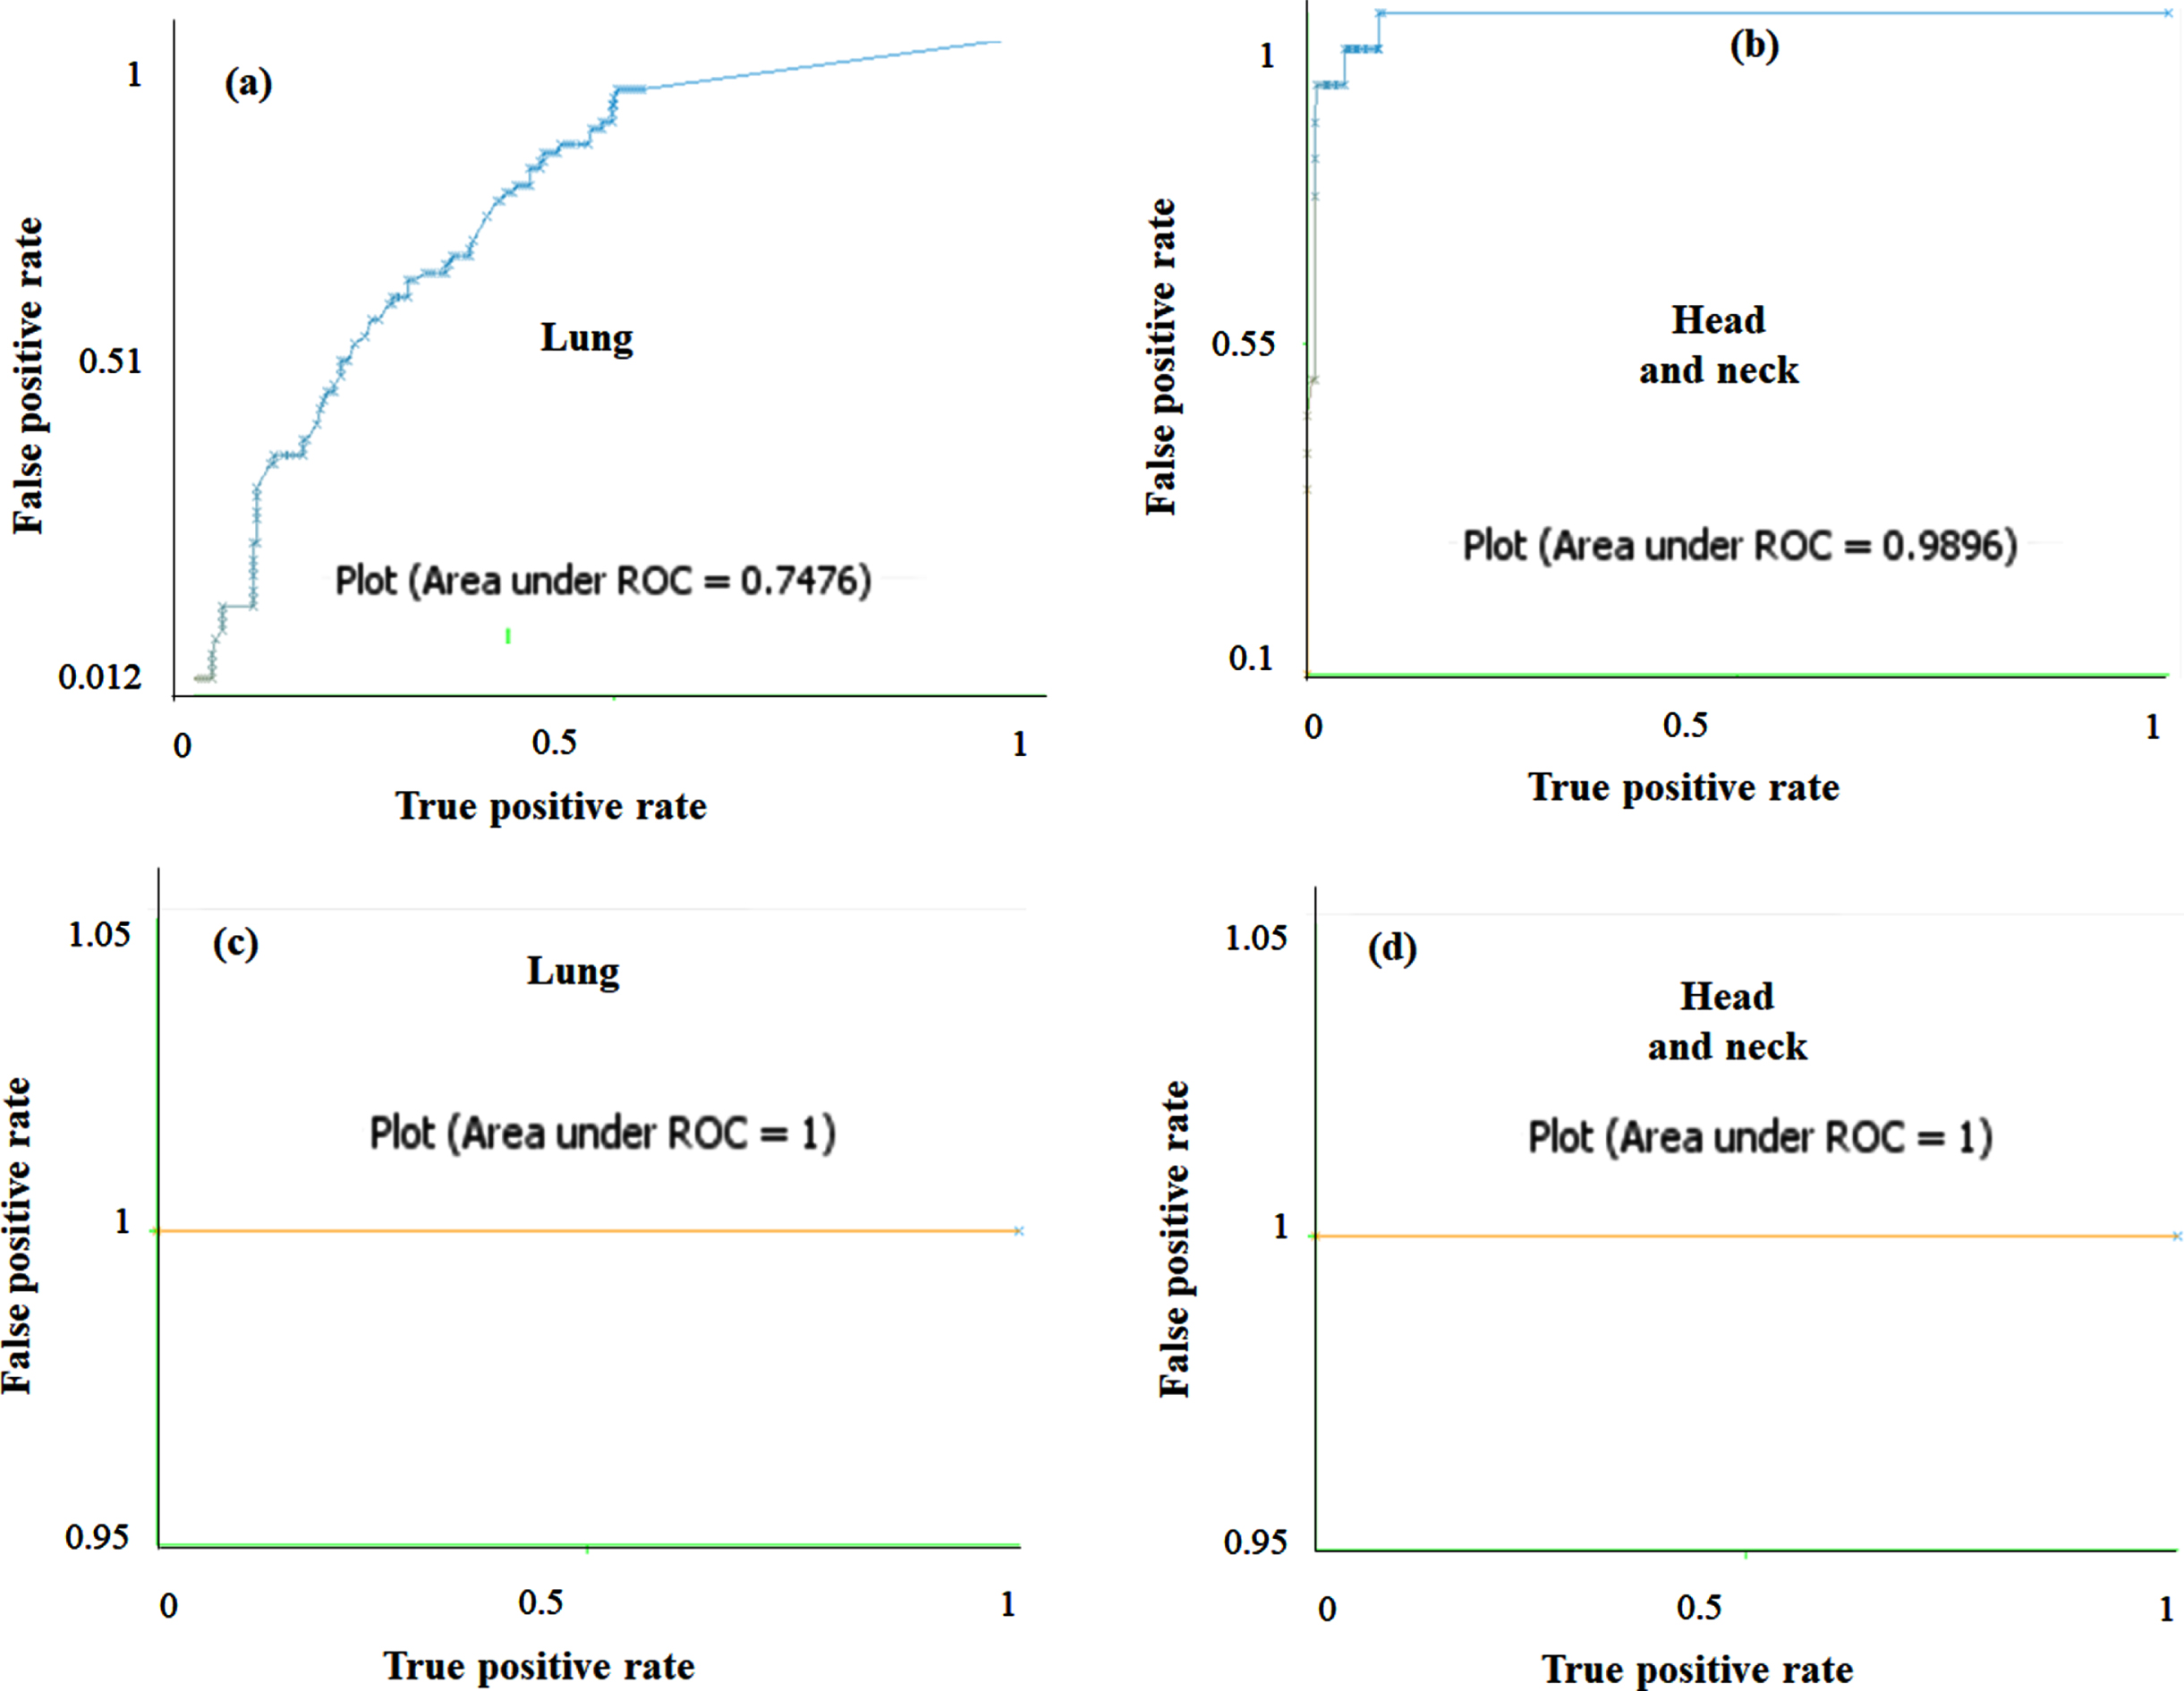
The area under the ROC curve of FRNN for (a) lung, (b) head and neck and LSA-RAS-FRNN for (c) lung, and (d) head and neck classes of primary tumor.
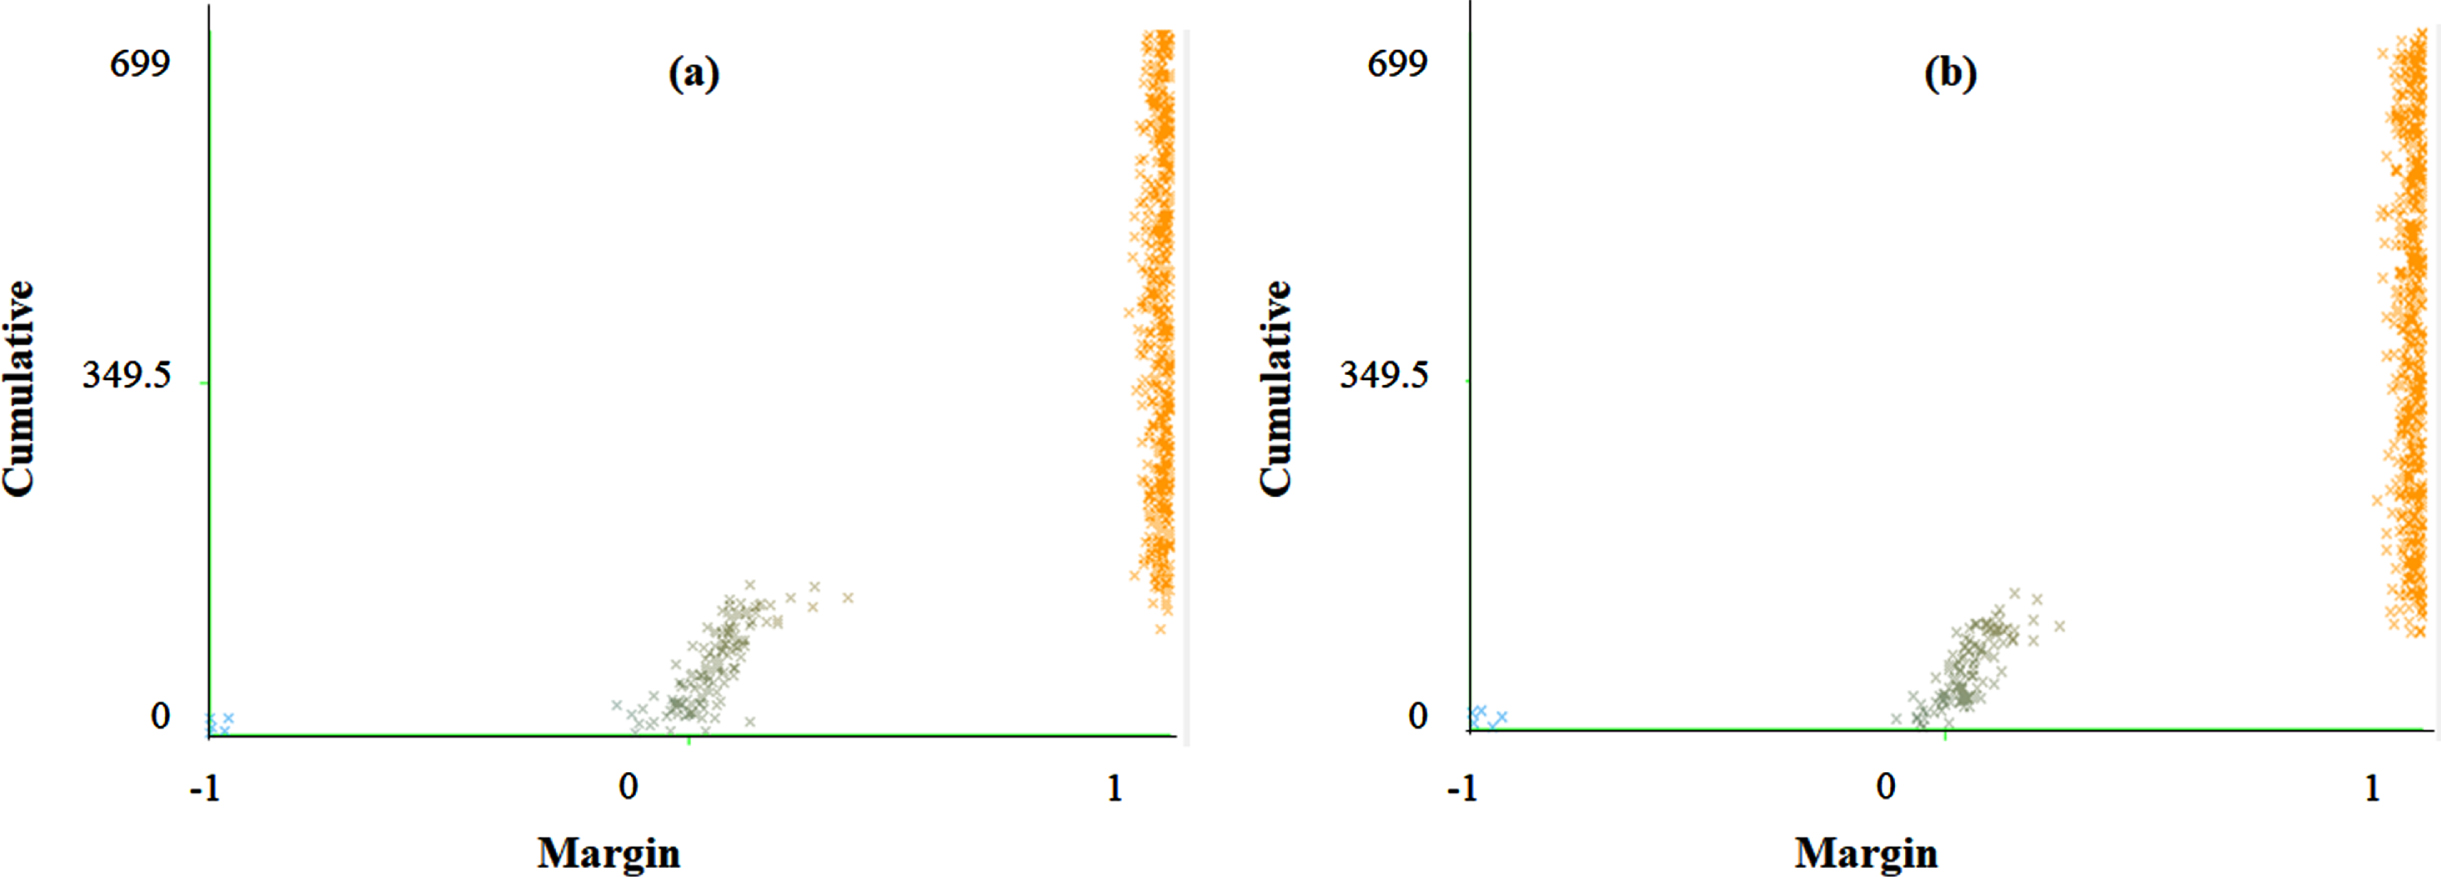
The margin curve of (a) FRNN and (b) LSA-RAS-FRNN in the analysis of breast cancer Wisconsin.
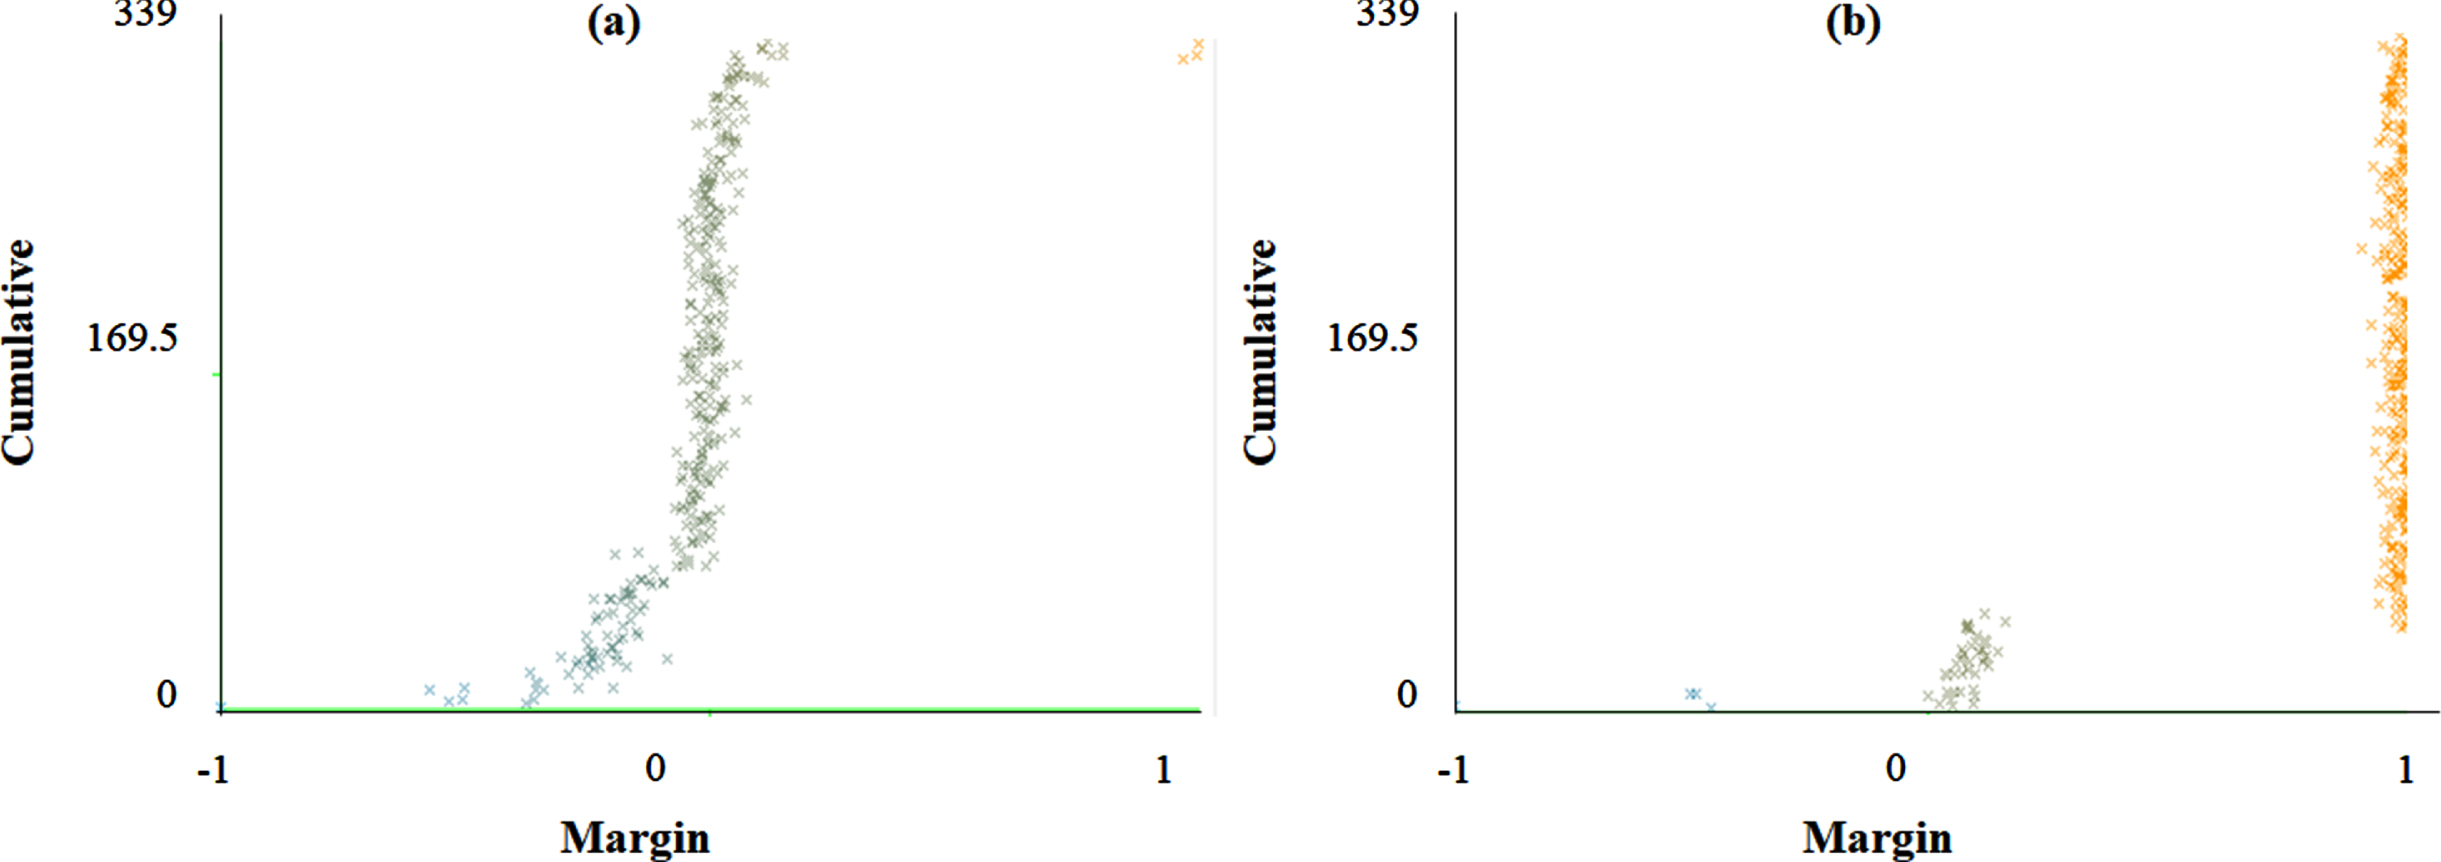
The margin curve of (a) FRNN and (b) LSA-RAS-FRNN in the analysis of primary tumor.
Table 3, Table 4, and Figs. 5–10 confirm the superior performance of hybrid machine learning approach LSA-RAS-FRNN than LSA-RAS-FRNN, FRNNA, and FNN in the diagnosis prediction of multiple diseases. The basic reason for the better performance of the LSA-RAS-FRNN than the rest of the three methods is due to its competent elements and their proper composition (efficient feature generation by LSA, feature selection by RAS, and feature classification by the hybrid FRNN approach). The better performance of the LSA method has been discussed in the translation of sign language [39], personality trait analysis [40], and classification of web pages [41], etc. The LSA measures the lexical co-occurrence in the text by the transformation of the terms of the document matrix into low dimensional space. It is the main reason for the generation of the robust features by the LSA in the analysis of the disease datasets (Table 1) which further improves the recognition accuracy of the FNN and FRNNA. Since most of the disease datasets in Table 1 contain nominal attributes except breast cancer Wisconsin which has the only numeric attribute. Therefore, the LSA-generated features result in a minor change (–1.57%and 0.74%, respectively) in the classification accuracy of the FNN and FRNNA than the original experimental attributes in the analysis of the breast cancer Wisconsin dataset. For the rest of the disease datasets which contain both numeric and nominal attributes, the LSA-generated features result in the improved recognition accuracy of the FRNNA. The instances of the diseases are assumed as the documents and their attributes as the terms by the LSA and try to associate terms to the respective class to the instances. Therefore, the best association of the terms of the document to their corresponding class is achieved using the latent structure. It is always better to use multiple evaluation measures in the selection of the optimal set of features. This is what done by the RAS method which combines the entropy, gain ratio, and reliefF evaluation measures in the selection of the most efficient features generated by the LSA. The performance of the single evaluation measures (gain ratio and relief) in the feature selection is discussed in Ref. [15].
The FRNN is a hybrid classification approach that combines the significant features of fuzzy set theory, rough set theory, and k-nearest classification approach [34, 36]. The fuzzy set theory assumes a partial membership of instances to their class; therefore, it has a great contribution in dealing with the nominal and imprecise attributes [42]. The rough set theory is useful in case of incomplete information, besides it extracts the knowledge more precisely [43]. The KNN is the most simple and natural classification approach in which the class of a test instance is decided according to the class of its neighbor [35].
Therefore, the hybridization of KNN is easier with the other approaches, like fuzzy and rough set theory. The FNN is the hybrid approach of the fuzzy set theory and KNN approaches. FNN implements the partial membership assumption of fuzzy set theory to consider the significance of each of the training instances [36]. It is the reason for the better performance of FNN and FNN-LSA-RAS in the analysis of the BC, CR, FR, HS, IM, PO, and PT (Table 3 and Table 4). After including the rough set theory in FNN, the lower and upper approximations are used to obtain the information about the membership of a test instance, [34]. Therefore, FRNN performs better in the diagnosis prediction of most of the disease datasets. One of the limitations of the FRNN is the handling of missing values [34]. The hybrid approach of feature generation and selection (LSA-RAS) is efficient in treating the missing value of the dataset. Therefore, FRNN-LSA-RAS (the hybrid of the hybrid LSA-RAS and hybrid FRNN) performs well even in the case of the missing values in the datasets, like the AU, BC, PO, and PT. Specifically, the better classification accuracy (93.81%and 99.12%, respectively) of FRNN-LSA-RAS is obvious in the recognition of classes of the AU and PT which have the maximum missing values 318 and 225, respectively. The better performance of the fuzzy, fuzzy rough set and hybrid fuzzy approach is also validated in some past studies [9, 36]. Few studies implemented the FRNN in the recognition of diseases in recent studies, like cancer classification [44], diabetes biomarker recognition [45], cancer recognition [46], and breast cancer diagnosis [47]. Though, it is hard to find the implementation of FRNN in multiple disease diagnosis. In the analysis of the AU dataset, a net improvement of 93.37%, 16.82%, and 19.03%in the accuracy of LSA-RAS-FRNN has been achieved compared to the FNN, LSA-RAS-FNN, and FRNN, respectively. Correspondingly, LSA-RAS-FRNN has the maximum value of kappa coefficient k and the minimum value of the RMSE (Table 3), and the maximum value of precision, recall, F-measure, and ROC area (Table 4). In a comprehensive search of classification approaches [8], the functional tree classifier achieved the maximum recognition accuracy of 84.51%compared to the rest 31 approaches. Therefore, the LSA-RAS-FRNN approach has an accuracy improvement of 9.3%than the best performing method in Ref. [8] in the recognition of the classes of the AU. The area of ROC of 83.43±1.37–84.32±1.56 has been achieved using the attribute weighted naïve Bayes approach in the analysis of the AU dataset [48] while LSA-RAS-FRNN has an area of ROC of 0.98 in the present study. In the analysis of the BC dataset, LSA-RAS-FRNN achieved a net improvement of 40.91%, 1.39%, and 16.08%in the recognition accuracy compared to the FNN, LSA-RAS-FNN, and FRNN, respectively. The LSA-RAS-FRNN has a normal value of kappa coefficient k and RMSE (Table 3), and an improved value of precision, recall, F-measure, and ROC area (Table 4). The logistic model tree has a maximum recognition accuracy of 75.17%compared to other approaches [8] and bagging credal decision tree 79.96%[18], however, the LSA-RAS-FRNN has the recognition accuracy of 86.01%in the recognition of the classes of the BC. The random committee has an area of ROC of 0.631 [8] and attribute weighted naïve Bayes approach achieved ROC of 67.13±12.81–71.32±13.81 [48], while the area of ROC of LSA-RAS-FRNN is 0.94 in the class recognition of BC. The precision, recall, and F-measure of LSA-RAS-FRNN are 0.86 which is higher than the precision, recall, and F-measure of the random committee approach [8]. The LSA-RAS-FRNN attained a minor improvement in the recognition accuracy of 0.74%and 1.6%compared to FRNN and LSA-RAS-FNN, respectively in the analysis of the BW dataset (Table 3). The kappa coefficient k precision, recall, F-measure, and ROC area of LSA-RAS-FRNN are > 0.90 and RMSE has minimum value (Table 3 and Table 4). FRNN in combination with a consistency subset evaluation and instance selection achieved recognition accuracy of 99.71%[47]; however, the proposed combination is not validated for other disease datasets. Other approaches summarized in Ref. [8] have recognition accuracy of 32.5%-97.21%in the class identification of BW. The area of ROC of LSA-RAS-FRNN is 0.99 which is better than most of the methods discussed in Ref. [8] and comparable to the approach discussed in [47]. The better performance of the LSA-RAS-FRNN is also obvious from the error curve shown in Fig. 6 (least number of squares of Benign, Malignant classes in Fig. 6(d)). The class-wise area under the ROC curve of LSA-RAS-FRNN for Benign and Malignant are ⟶ 0.99 (Fig. 7). The margin curve in Fig. 9 denotes the variation of margin value vs. cumulative (no. of instances with margin≤current margin). The margin value has a range of [–1, 1]. The larger margin value denotes the high confidence of LSA-RAS-FRNN (Fig. 9 (b)) while the negative margin value of few instances represents misclassification. It is obvious that the margin value of LSA-RAS-FRNN is ⟶ 1 for most of the instances in Fig. 9 (b) compared to the margin value plot of FRNN in Fig. 9 (a) in the analysis of the BW dataset. The LSA-RAS-FRNN achieved a net improvement of 21.43%, 21.43%, and 14.29%in the recognition accuracy compared to the FNN, LSA-RAS-FNN, and FRNN, respectively in the analysis of the CO dataset. An average value 0.47 of the kappa coefficient of LSA-RAS-FRNN is obtained. The area of the ROC of LSA-RAS-FRNN is equal to 0.76. The average performance of the LSA-RAS-FRNN is due to the few instances in the CO dataset. In the analysis of the CR dataset, LSA-RAS-FRNN achieved a net improvement of 14.4.0%, 28.88%, and 14.4.0%in the recognition accuracy compared to the FNN, LSA-RAS-FNN, and FRNN, respectively. The kappa coefficient of LSA-RAS-FRNN is 0.9. There is a good improvement in the precision, recall, and F-measure while the LSA-RAS-FRNN has a high value of the area of ROC of 0.98. The adaptive neuro-fuzzy inference system (ANFIS) has an accuracy of 80.00±5.23%in the class recognition of CR [21] while the LSA-RAS-FRNN has a recognition accuracy of 94.44%. In the analysis of the IM dataset, LSA-RAS-FRNN achieved a minor improvement of 0.89%, 0.89%, and 7.56%in the recognition accuracy compared to the FNN, LSA-RAS-FNN, and FRNN, respectively. The precision, recall, F-measure have an average value close to 0.75 while the area of the ROC is 0.7. The ANFIS has the recognition accuracy of 67.44–89.35%(average accuracy of 78.39%) [21], while for the LSA-RAS-FRNN, it is 77.56%. Though there is no information about the precision, recall, and F-measure in Ref. [21]. The kappa coefficient of LSA-RAS-FRNN is 0.9. There is a good improvement in the precision, recall, and F-measure while the LSA-RAS-FRNN has a high value of the area of ROC of 0.98. The ANFIS has an accuracy of 80.00±5.23%in the class recognition of CR [21] while the LSA-RAS-FRNN has a recognition accuracy of 94.44%. The LSA-RAS-FRNN achieved a minor improvement of 1.0%, 1.0%, and 6.0%in the recognition accuracy compared to the FNN, LSA-RAS-FNN, and FRNN, respectively in the analysis of the FT dataset. The multilayer perceptron (MLP), support vector machine (SVM), and decision tree (DT) methods have recognition accuracy of 69%, 69%, and 67%, respectively in the class identification of the FT dataset [28]. However, the LSA-RAS-FRNN has a recognition accuracy of 89%. The LSA-RAS-FRNN has precision, recall, and F-measure equal to 0.86, 0.88, and 0.87, respectively, and the area of ROC equal to 0.84. The MLP, SVM and DT have the sensitivity equal to 73%, 74%, and 72%, respectively, and specificity equal to 25%, 13%, and 13%, respectively [28]. The LSA-RAS-FRNN achieved an improvement of 1.43%, 9.6%, and 9.27%in the recognition accuracy compared to the FNN, LSA-RAS-FNN, and FRNN, respectively in the analysis of the HS dataset. The LSA-RAS-FRNN has an accuracy of 76.59%, which is better than the recognition accuracy of the tree-based classification approach (accuracy of 76.14%) [8], and other previous approaches summarized in [8]. An improvement of recognition accuracy of 29.06%, 4.73%, and 5.4%of LSA-RAS-FRNN has been noticed in the analysis of the LY dataset compared to the FNN, LSA-RAS-FNN, and FRNN, respectively. The precision, recall, and F-measure have a significant value of 0.87, and the area of the ROC is equal to 0.88. The tree-based classification approach has a recognition accuracy of 86.49%[8]. Therefore, the LSA-RAS-FRNN has better recognition accuracy (87.16%) than the tree-based approach [8], and other approaches summarized in Ref. [8]. The LSA-RAS-FRNN achieved an improvement of recognition accuracy of 16.66%, 4.44%, and 19.99%than the FNN, LSA-RAS-FNN, and FRNN, respectively in the analysis of the PO dataset. The precision, recall, and F-measure have a value of 0.87. The area of ROC has a significant value equal to 0.94. The tree-based classification method has a recognition accuracy of 71.11%[8], while the LSA-RAS-FRNN has a recognition accuracy of 87.77%. Also, the recognition accuracy of other methods summarized in [8] lies in between 50.75–71.11%. Consequently, the LSA-RAS-FRNN has better recognition performance than the approaches implemented and reviewed in [8]. The precision, recall, and F-measure have a significant value of 0.87, and the area of ROC is equal to 0.88. The tree-based classification approach has a recognition accuracy of 86.49%[8]. Therefore, the LSA-RAS-FRNN has better recognition accuracy (87.16%) than the tree-based approach [8], and other approaches summarized in Ref. [8]. The LSA-RAS-FRNN achieved a major improvement in the recognition accuracy of 91.45%, 1.77%, and 65.79%compared to FRNN and LSA-RAS-FNN, respectively in the analysis of the PT dataset (Table 3). The precision, recall, and F-measure of LSA-RAS-FRNN have a value of 0.99. The kappa coefficient is equal to 1 and the RMSE has a minimum value. Also, the area of the ROC is equal to 1. The recognition accuracy of other classification approaches summarized in Ref. [8] lies in between 28.91–48.38%, and the tree-based classification approach has the recognition accuracy of 50.15%. Therefore, it is obvious that the LSA-RAS-FRNN achieved perfect recognition accuracy in the identification of classes of PT. The better performance of the LSA-RAS-FRNN is also obvious from the error curve shown in Fig. 5. Three squares denote the misclassification of instances in Fig. 5 (d). The class-wise area under the ROC curve of LSA-RAS-FRNN for lung and head and neck classes is shown in Fig. 8. The areas under the ROC of LSA-RAS-FRNN for both classes of PT are equal to 1 while it is less than 1 for the FRNN. The LSA-RAS-FRNN has high margin value for most of the instances (Fig. 10 (b)) than the margin values of FRNN in Fig. 10 (a). Overall, from the analysis results, it is obvious that the LSA-RAS-FRNN is a successful hybrid machine learning approach in the recognition of selected diseases.
The LSA-RAS-FRNN approach has improved performance than some recent approaches [49–52], like a combination of safe-region imputation and tree method in recognition of audiology (accuracy of 89.28%) [49]; MLP in the recognition of audiology (accuracy of 83.2%), C4.5 in the recognition of breast cancer (accuracy of 76.9%), naïve Bayes in the recognition of Haberman survival (accuracy of 74.8%), SVM in the recognition lymphography (accuracy of 86.6%), and naïve Bayes in the recognition of primary tumor (accuracy of 50.1%) [50]; attribute and instance weighted naïve Bayes in the recognition of audiology (accuracy of 83.93±7.00%), breast-cancer (accuracy of 72.46±7.25%), lymphography (accuracy of 85.70±7.95%), and primary-tumor (accuracy of 47.76±5.25%) [51]; and Chi-square dissimilarity and t-SNE-based recognition of audiology (accuracy of 80.9%) and lymphography (accuracy of 82.9%) [52]; etc.
Though, the performance of the LSA-RAS-FRNN approach may get affected due to certain limitations of the component methods. Like the major change in the values of the lower and upper approximations of FRNN due to the noise and no effect on the performance of FRNN due to the variation of parameter K. Besides, for a large dataset, the SVD in LSA needs more computation. In future research, we plan to develop other fuzzy-rough set-based hybrid approaches in disease diagnosis prediction by minimizing the existing limitations.
Conclusion
A hybrid machine learning approach (LSA-RAS-FRNN) using the combination of hybrid feature generation and the selection and hybrid fuzzy-rough set-k-nearest classification is proposed which is well efficient in handling the missing values, imperfect and vague datasets containing both the numeric and nominal attributes. The LSA-RAS-FRNN results improved recognition accuracy in the validation using eleven benchmark disease datasets. The LSA-RAS-FRNN approach is useful in removing the missing value limitations of the FRNN approach to some extent and results in better recognition performance.
Footnotes
Acknowledgments
This work is supported by The Startup Foundation for Introducing Talent of NUIST. The authors acknowledge the anonymous reviewers for their valuable suggestions.