
Abstract
The weak fault characteristics of rolling bearings are difficult to identify due to strong background noise. To address this issue, a bearing fault detection scheme combining swarm decomposition (SWD) and frequency-weighted energy operator (FWEO) is presented. First, SWD is applied to decompose the bearing fault signal into single mode components. Then, a new evaluation index termed LEP is constructed by combining the advantages of envelope entropy, Pearson correlation coefficient and L-kurtosis, and it is utilized to choose the sensitive component containing the richest bearing fault characteristics. Finally, FWEO is employed for extracting the bearing fault features from the sensitive component. Simulation and experimental analyses indicate that the LEP index has better performance than the L-kurtosis index in determining the sensitive component. The method has the effect of suppressing noise and enhancing impulse characteristics, which is superior to the SWD-based envelope demodulation method.
Introduction
Rolling bearing is very essential in the reliable operation of machinery equipment [1], which is prone to failure due to structural defects and harsh operating conditions. With the growth of bearing fault severity, more and more rotating parts (such as gears and rotors) will be damaged. Therefore, early fault diagnosis of bearing is crucial. Vibration signals gathered from faulty bearings have non-stationary characteristics [2, 3], thus, many adaptive non-stationary signal analysis techniques are applied in fault diagnosis [4]. Karatoprak et al. put forward a fault detection technique by using improved empirical mode decomposition (EMD) method and variable window median filter [5]. Hongchao et al. combined wavelet transform and ensemble EMD (EEMD) to obtain the bearing fault information [6]. Chen et al. [7] combined empirical wavelet transform (EWT) and wavelet spatial neighboring coefficient denoising and succeeded in diagnosing generator bearing. Liu et al. [8] presented an improved local mean decomposition (LMD) technique for fault diagnosis, and the result demonstrated that the approach improves the performance of LMD. Singular spectrum decomposition (SSD) has been successfully employed for bearing fault detection [9]. All of the above methods have achieved the bearing fault diagnosis, but each method has a few disadvantages that are difficult to solve completely. For example, EMD is an empirical method that lacks a complete theoretical basis. In addition, EMD is susceptible to noise interference and suffers from modal mixing problems. Although EEMD can suppress the mode mixing phenomenon to a certain extent with the addition of Gaussian white noise, but it also has some shortcomings. One limitation of EEMD is that it is difficult in selecting parameters such as noise amplitude and number of episodes. The other is that EEMD is computationally expensive. The number of EWT decomposition modes must be predetermined, and it is difficult for EWT to properly segment the Fourier spectrum for achieving an accurate description of the fault information. LMD is affected by mode mixing, which will reduce the accuracy of signal decomposition. In addition, the best embedding dimension of SSD needs to be selected subjectively, and these issues can affect the accuracy of bearing fault diagnosis. In a word, the above problems can affect the subsequent fault feature extraction and fault diagnosis.
In 2017, swarm decomposition (SWD) was first proposed for EEG signal analysis [10], which can decompose a complex multicomponent signal into multiple single-mode oscillatory components (OCs) by iterative swarm filtering (SWF) [11]. SWD can separate two harmonic signals with similar frequencies and has higher frequency discrimination than EMD. Compared with traditional methods such as EMD and LMD, SWD has obvious advantages in noise suppression and mode mixing suppression.
After the rolling bearing signal is decomposed by SWD, the most useful OC with the dominant fault information needs to be chosen to further detect the bearing defect features. Many techniques have been studied in the public literatures to select the most useful oscillating components. Kurtosis is useful for identifying the impulse of the bearing fault signal. Therefore, kurtosis is usually used as a measurement index to study the degree of damaged bearings. However, it has been proved that the robustness of kurtosis-based technique is poor, particularly for processing signals with random noise [12]. Gu et al. proposed an index based on kurtosis and correlation coefficient, and employed this index to select the most useful component from the IMFs decomposed by VMD [13]. Yi et al. combined Hilbert marginal spectrum and EEMD to realize bearing fault diagnosis. In their study, the vibration signal was decomposed using EEMD. Afterwards, the confidence index of the IMFs was used to determine the most useful IMF for marginal spectrum analysis [14]. Yang et al. proposed a frequency cutoff criterion for filtering redundant IMFs obtained by EEMD, and established a spectrum amplification factor (SAF) index to calculate the energy of the remaining IMFs to determine the best component. The result demonstrated that SAF has better noise resistance and stability than conventional kurtosis [15]. In this paper, a new index named LEP for selecting the most useful oscillation component from the OCs decomposed by SWD is constructed. It consists of L-kurtosis, envelope entropy and Pearson correlation coefficient. Then, the selected useful oscillation component is demodulated to extract the bearing fault features by using frequency-weighted energy operator (FWEO) [16, 17], which is effective in suppressing random noise and enhancing the impact component of signals [17].
Two major contributions are made for this study. First, because SWD has better signal decomposition performance than some adaptive decomposition methods such as EMD, LMD and SSD, this paper proposes a bearing fault diagnosis approach integrating SWD with FWEO, which is effective in overcoming the effects of noise and successfully detect the fault features. Secondly, In order to clearly observe the fault characteristic frequency in the FWEO spectrum, it is necessary to choose the component containing the richest fault information. Therefore, this paper proposes a new index for selecting the most useful component, which is composed of L-kurtosis, envelope entropy and Pearson correlation coefficient. This comprehensive index can measure the impact and periodicity of the component, and can also reflect the correlation between the component and the original signal. The results demonstrate the validity of the presented approach.
The remainder of this paper is structured as follows. The theory of SWD and FWEO is explained in Section 2. Section 3 analyzes the frequency discrimination ability and resolution ability of SWD. In Section 4, the presented scheme is investigated by the simulation signal and experimental signal. Finally, Section 5 makes the conclusion of this paper.
Theory
Swarm decomposition
Through SWF filtering, the input signal can be decomposed into a sum of OCs. The decomposition process of SWD is as follows [11]: The center frequency of the initial signal ω
q
dom
is determined from the peak of the power spectrum [19]. Then, the SWF parameters (M, δ) can be further obtained after determining ω
q
dom
: The input signal x[n] is filtered using the SWF to acquire the output signal y[n], and the variance StD between y[n] and x[n] can be calculated by Equation (2): Updating the input signal. Take x0’ [n] as a new input signal and repeat from steps (1) to (3) in sequence until S
x
(ω)< P
th
. Calculate the oscillatory mode components.
The energy operator was first used in speech processing and called Teager-Kaiser energy operator (TKEO). The principle is briefly explained as below.
For a continuous time signals x(t), the corresponding energy operator can be described as Equation (6).
For a normal demodulation signal, it is typically converted into an analytic signal at first, which is expressed as Equation (9). The energy of the signal is related to the square of the amplitude and is expressed as Equation (10):
The energy of the envelope spectrum is related to A and is unrelated to ω, that is, S[Acos(ωt+φ)] = A2. On the contrary, Equation (8) shows that the energy of TKEO is related to A and ω. To satisfy the similar property of TKEO, the FWEO is defined as follows by using the Fourier transform property to select the derivative function as a filter.
By simplifying the above formula, Equation (11) can be rewritten as Equation (12), it can be seen that the FWEO has the same properties of TKEO. But compare Equations (6) and (11), the two energy operators have some differences in the frequency domain. Moreover, the FWEO of the discrete signal x(n) also can be defined as Equation (13):
To choose the sensitive OC for further fault feature extraction, a new evaluation index LEP is proposed. The index is composed of L-kurtosis [0], envelope entropy [25] and Pearson correlation coefficient [26]. When the bearing fails, the impact of its vibration signal is periodic. L-kurtosis can detect the impact of the signal and has certain noise robustness compared to kurtosis, which can omit impulses that are large in amplitude but scattered in distribution. The envelope entropy enables to evaluate the periodicity of impulses. The more impulses are identified, the less noise interference in the spectrum and the lower the envelope entropy. The Pearson correlation coefficient can reflect the correlation between variables. The LEP index integrates the advantages of the above three indexes, making the new index LEP more sensitive to periodic impulse signals and reduce the omission of useful information as much as possible. Therefore, the larger the LEP value of an oscillatory component, the more abundant fault information it contains. L-kurtosis is given by:
Although L-kurtosis index can evaluate impulsiveness of the signal, it does not characterize the periodicity of the signal. To this end, the envelope entropy is introduced in the LEP index, which can be expressed as below:
The Pearson correlation coefficient indicates the degree of correlation between variables, which can be expressed as:
EMD has a wide range of applications in signal processing, but there are still some inherent drawbacks. In this paper, a simulation study is performed to demonstrate the decomposition performance of SWD, and compared with EMD to emphasize the merits of SWD. The simulation signal consists of two cosine signals, which is defined as Equation (20). The sampling time is set to 1 s, and the sampling frequency is 1024 Hz. Figure 1 displays the artificial simulation signal and its constituent components.
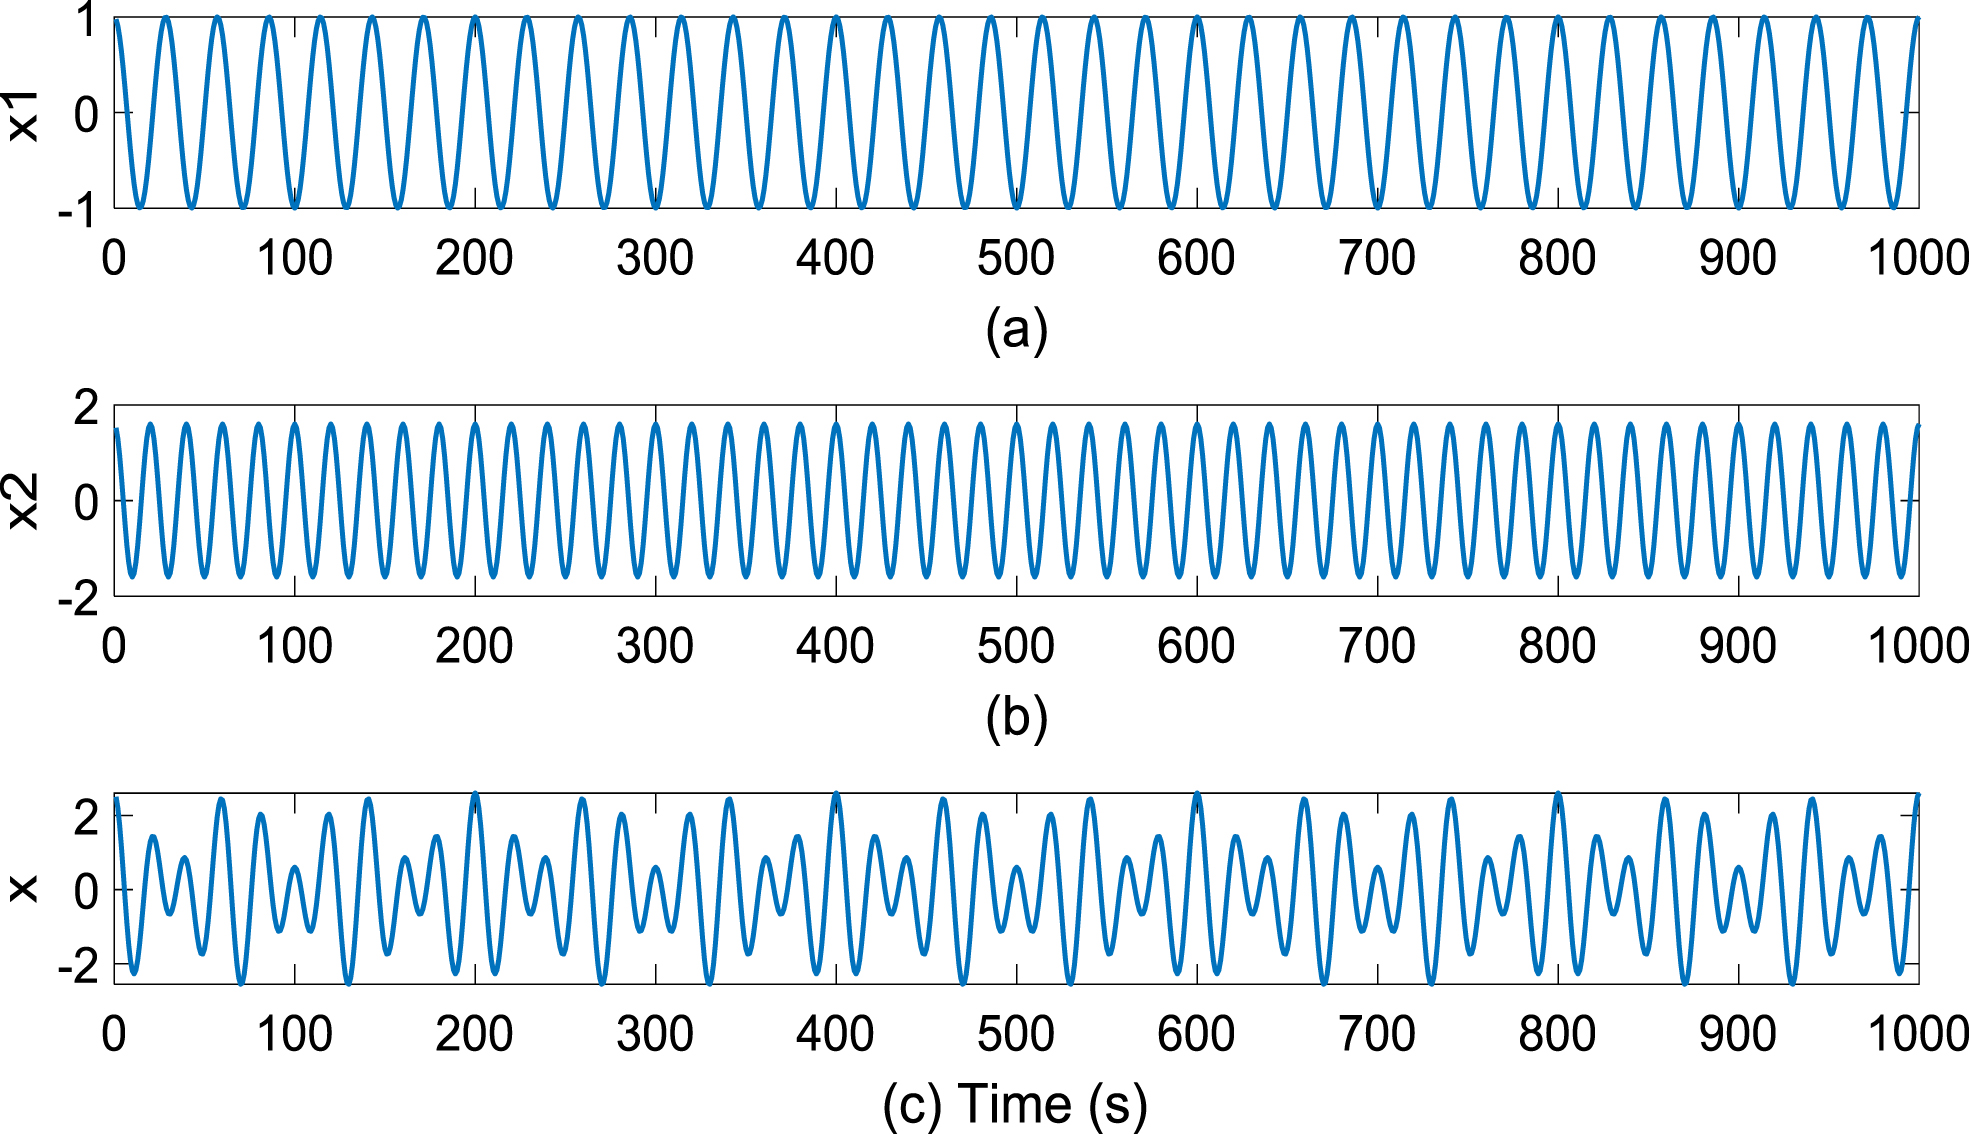
The artificial simulation signal: (a) the constituent component x1, (b) the constituent component x2, (c) the mixed artificial signal x.
The time-domain waveform and frequency spectrum of the IMF1-3 are given in Figs. 2 and 4, respectively. An obvious mode mixing has occurred in the first three IMFs, as shown in Fig. 2. SWD is applied to analyze the same signal and results are displayed in Figs. 3 and 5. As shown in the figures, the decomposition results of SWD match well with the actual components. Therefore, it can be concluded that the decomposition results obtained using SWD are more accurate than those obtained using EMD.
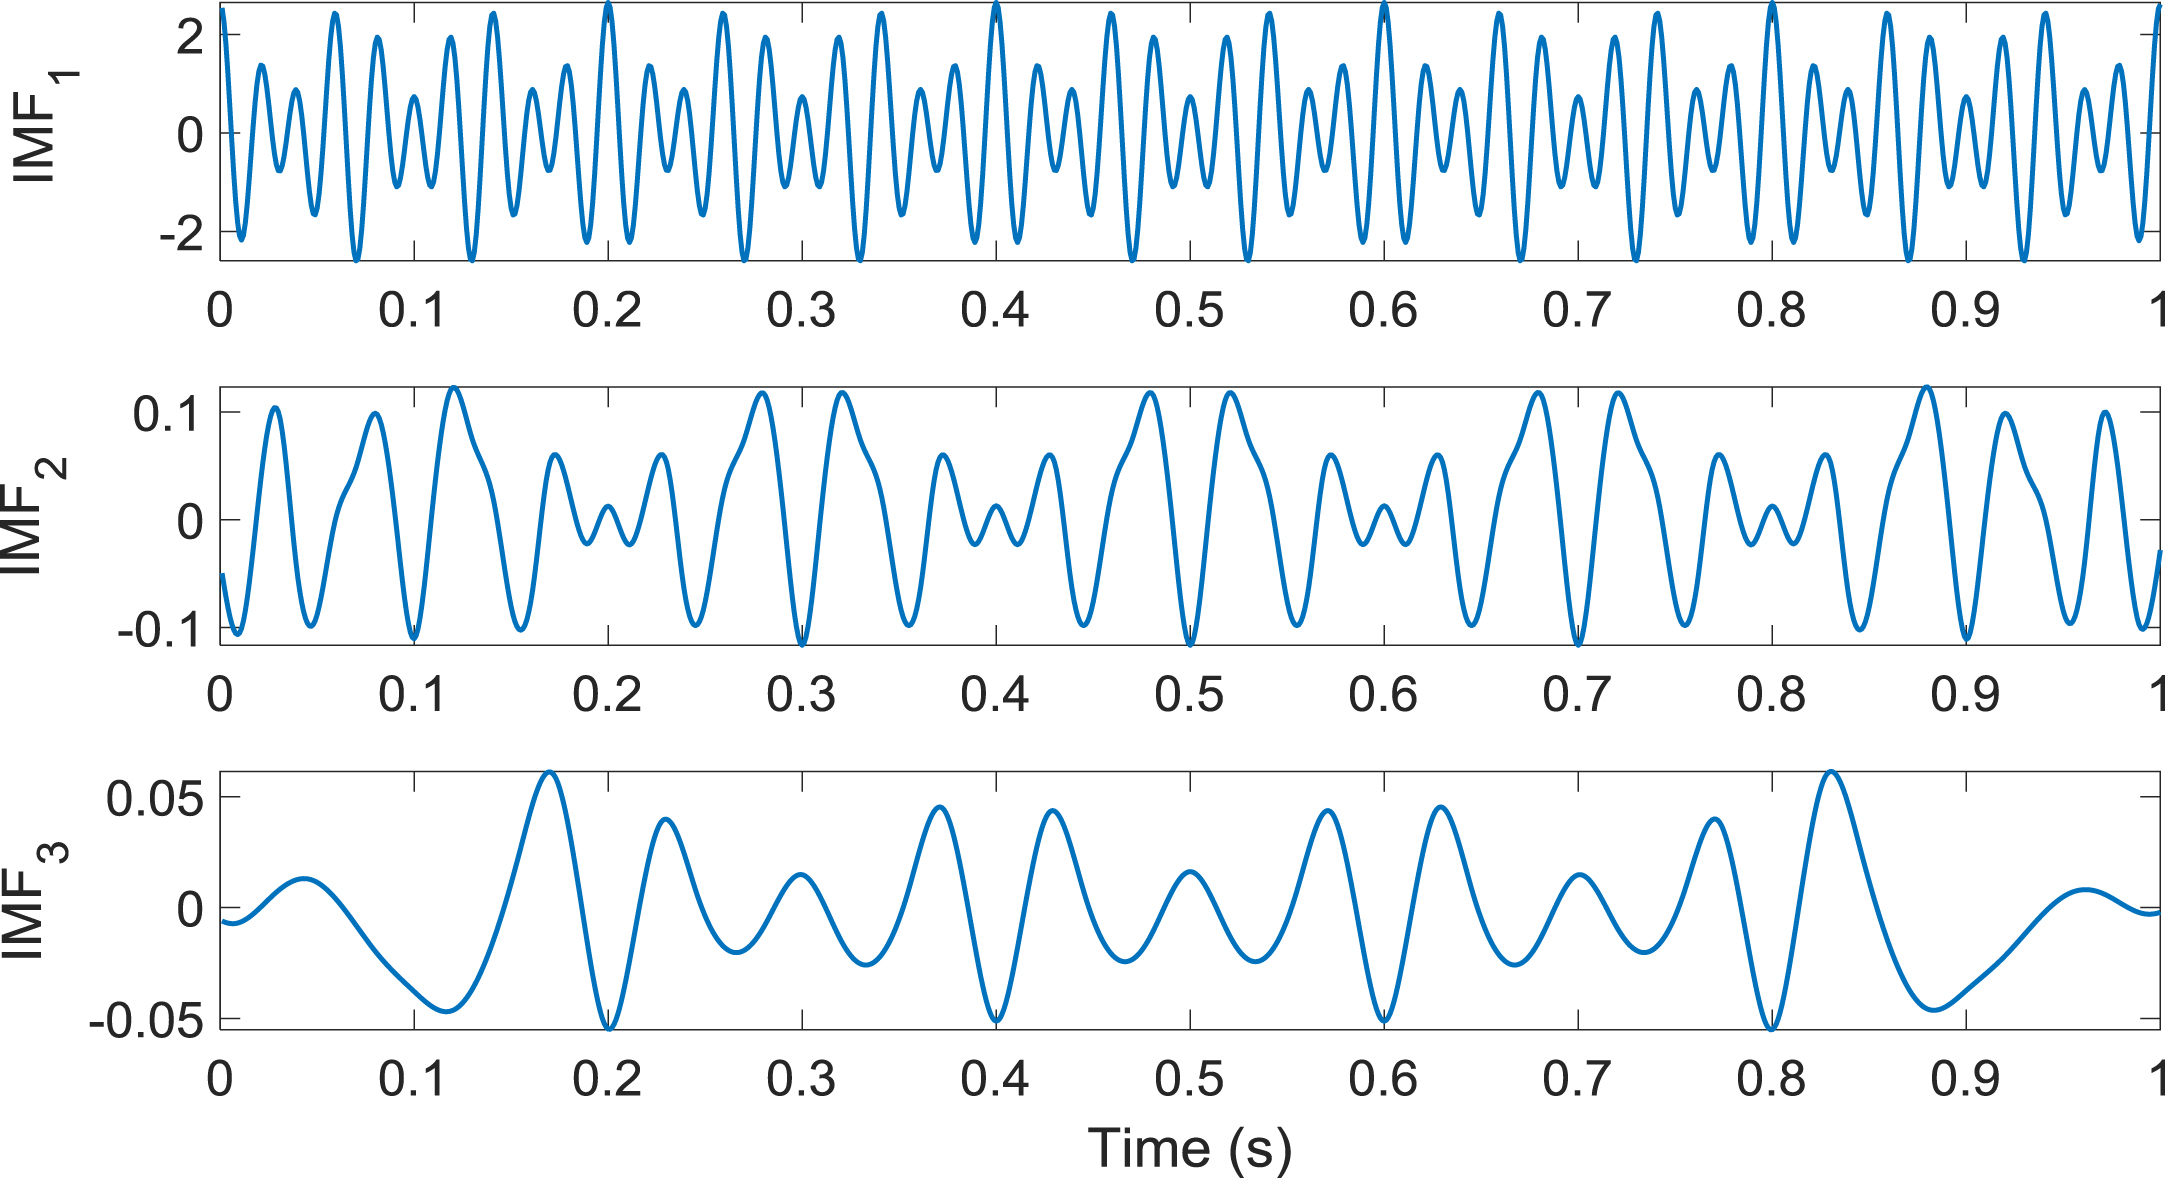
The waveform of the first three IMFs obtained using EMD.
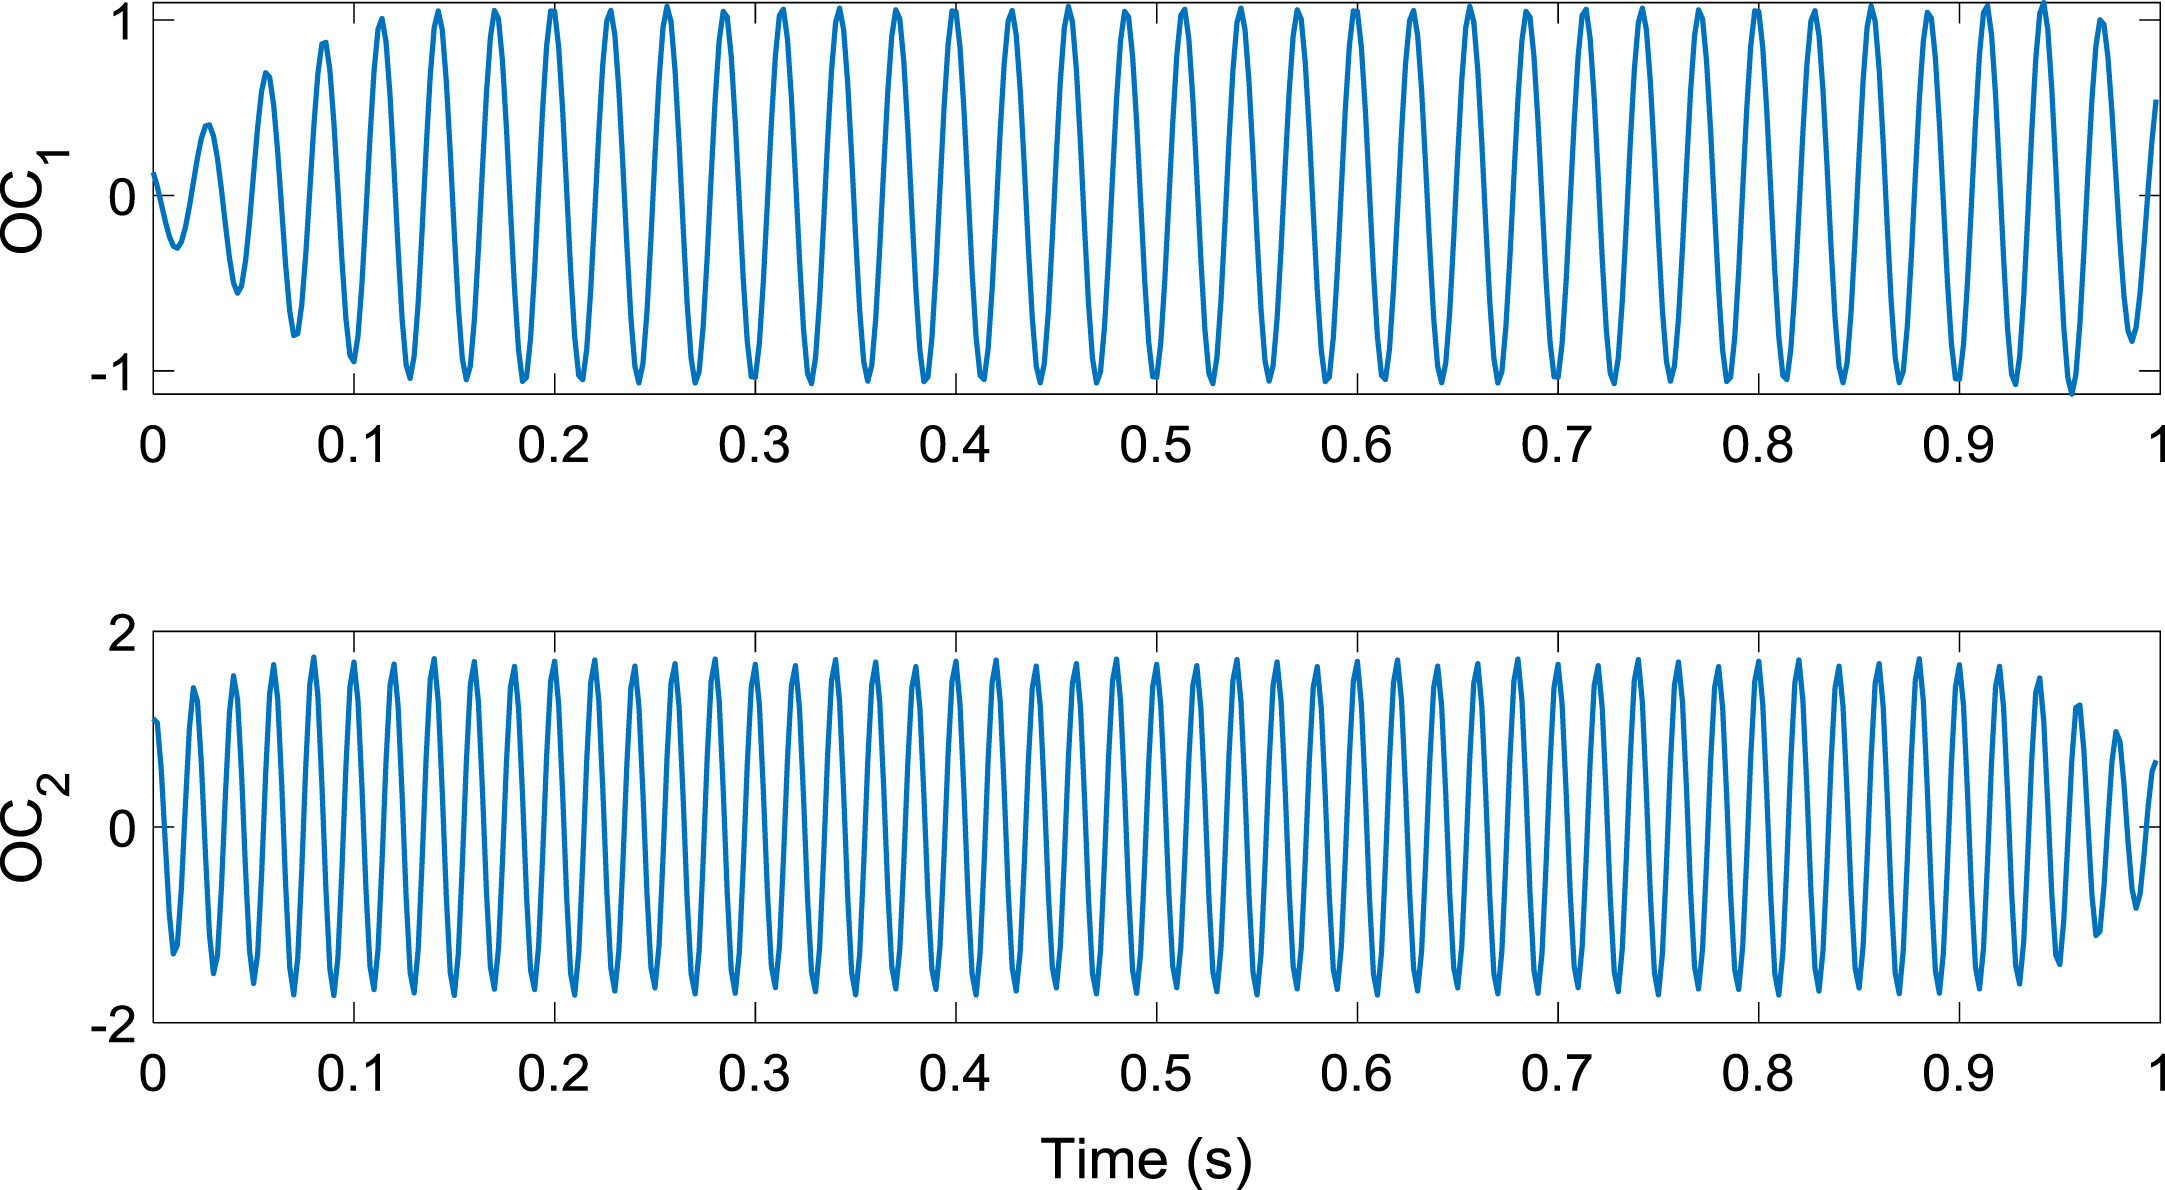
The waveform of the first two OCs obtained using SWD.
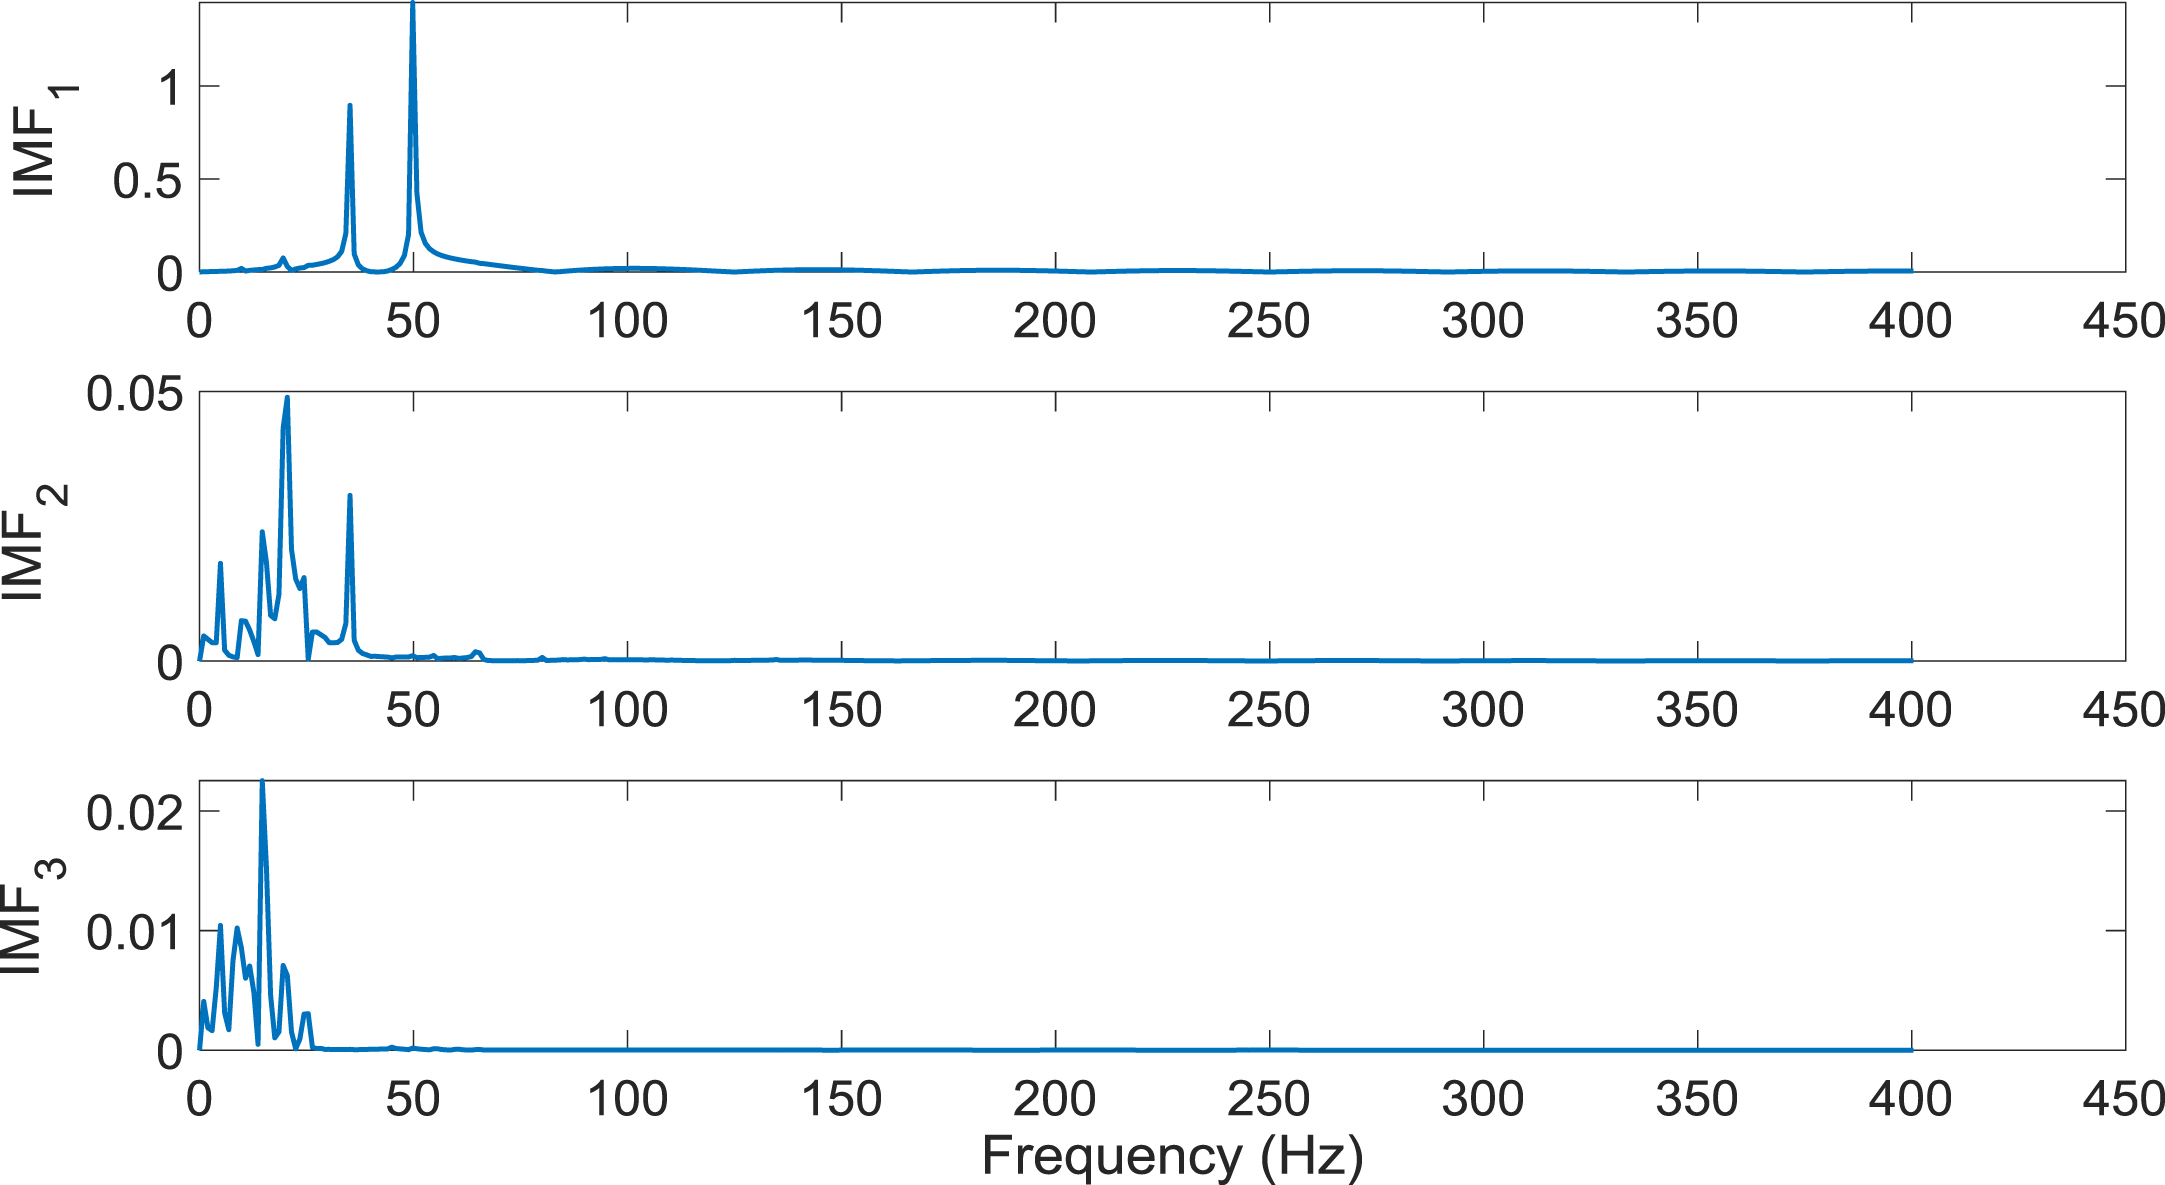
The spectrum of IMF1-IMF3.
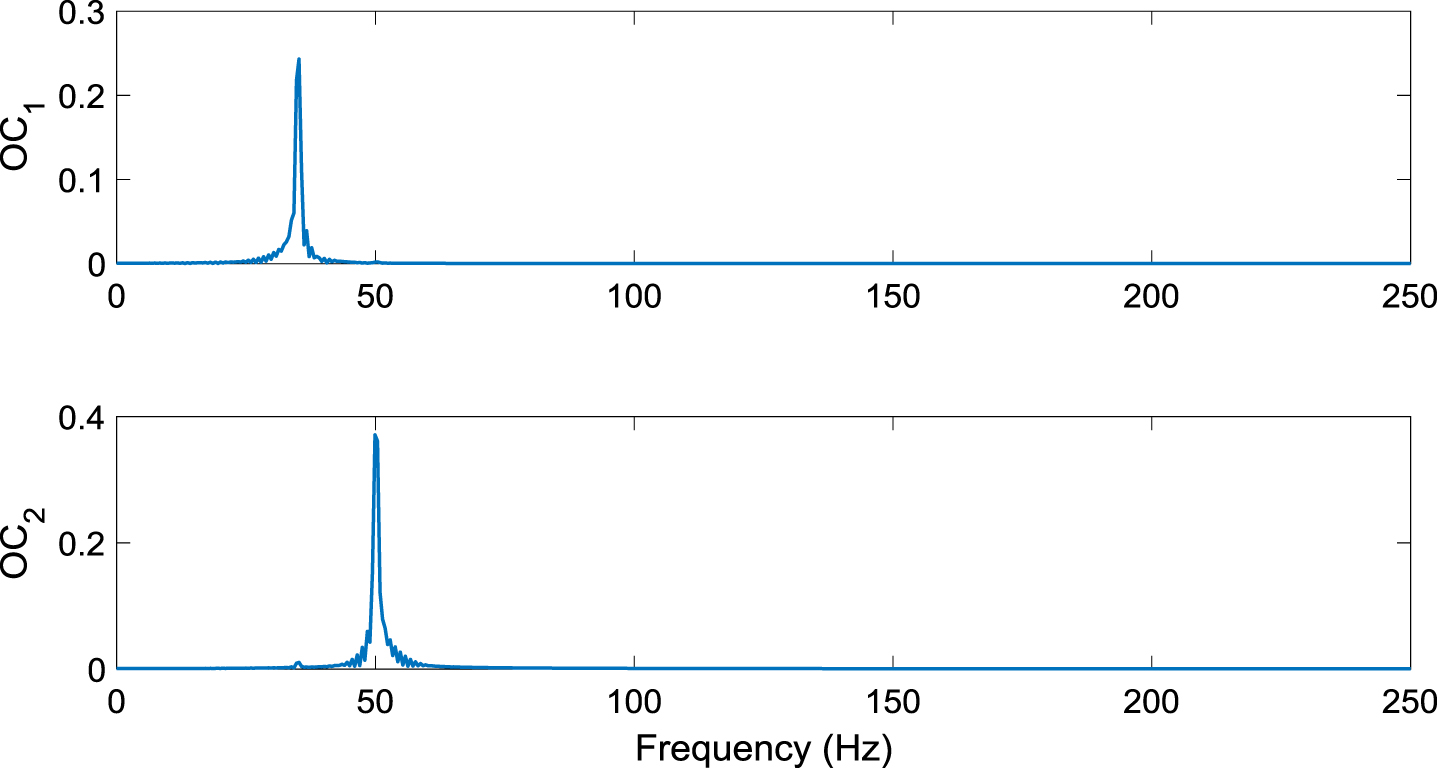
The spectrum of OC1 and OC2.
Due to the presence of noise interference in the bearing fault signal, it is hard to extract the early fault features of rolling bearing. Combining the superiority of SWD in extracting harmonic components and the demodulation effect of FWEO to enhance the bearing fault impact, a bearing fault diagnosis scheme integrating SWD with FWEO is proposed. The fault signal is decomposed into various frequency bands using SWD, and the FWEO is applied to further obtain the fault features. The specific steps of the presented scheme are as follows. The flowchart of the presented approach is given in Fig. 6. Input the vibration signal and initialize the SWD parameters. Decompose the vibration signal by SWD and obtain OCs. Calculate the LEP index of each OC and save the maximum LEP. Select the OC corresponding to the maximum LEP as the most useful mode component. Analyze the selected mode using FWEO for bearing fault diagnosis.
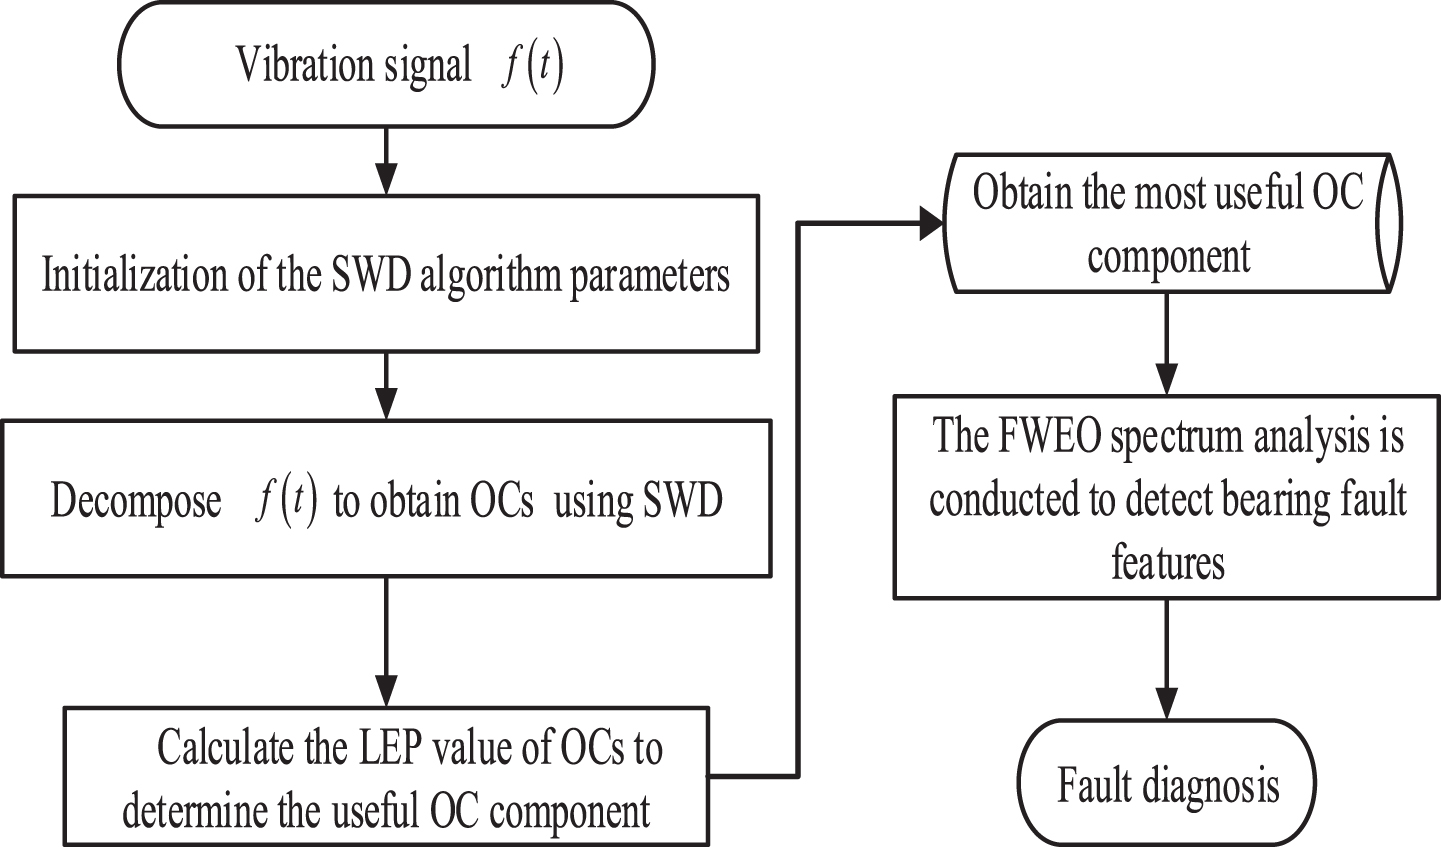
Flowchart of the bearing diagnosis scheme integrating SWD with FWEO.
A simulation signal is applied to prove the effectiveness of the presented bearing fault diagnosis scheme, and the artificial simulation signal of bearing failure is defined in Equation (21):

Time-domain waveform of the simulation signal.
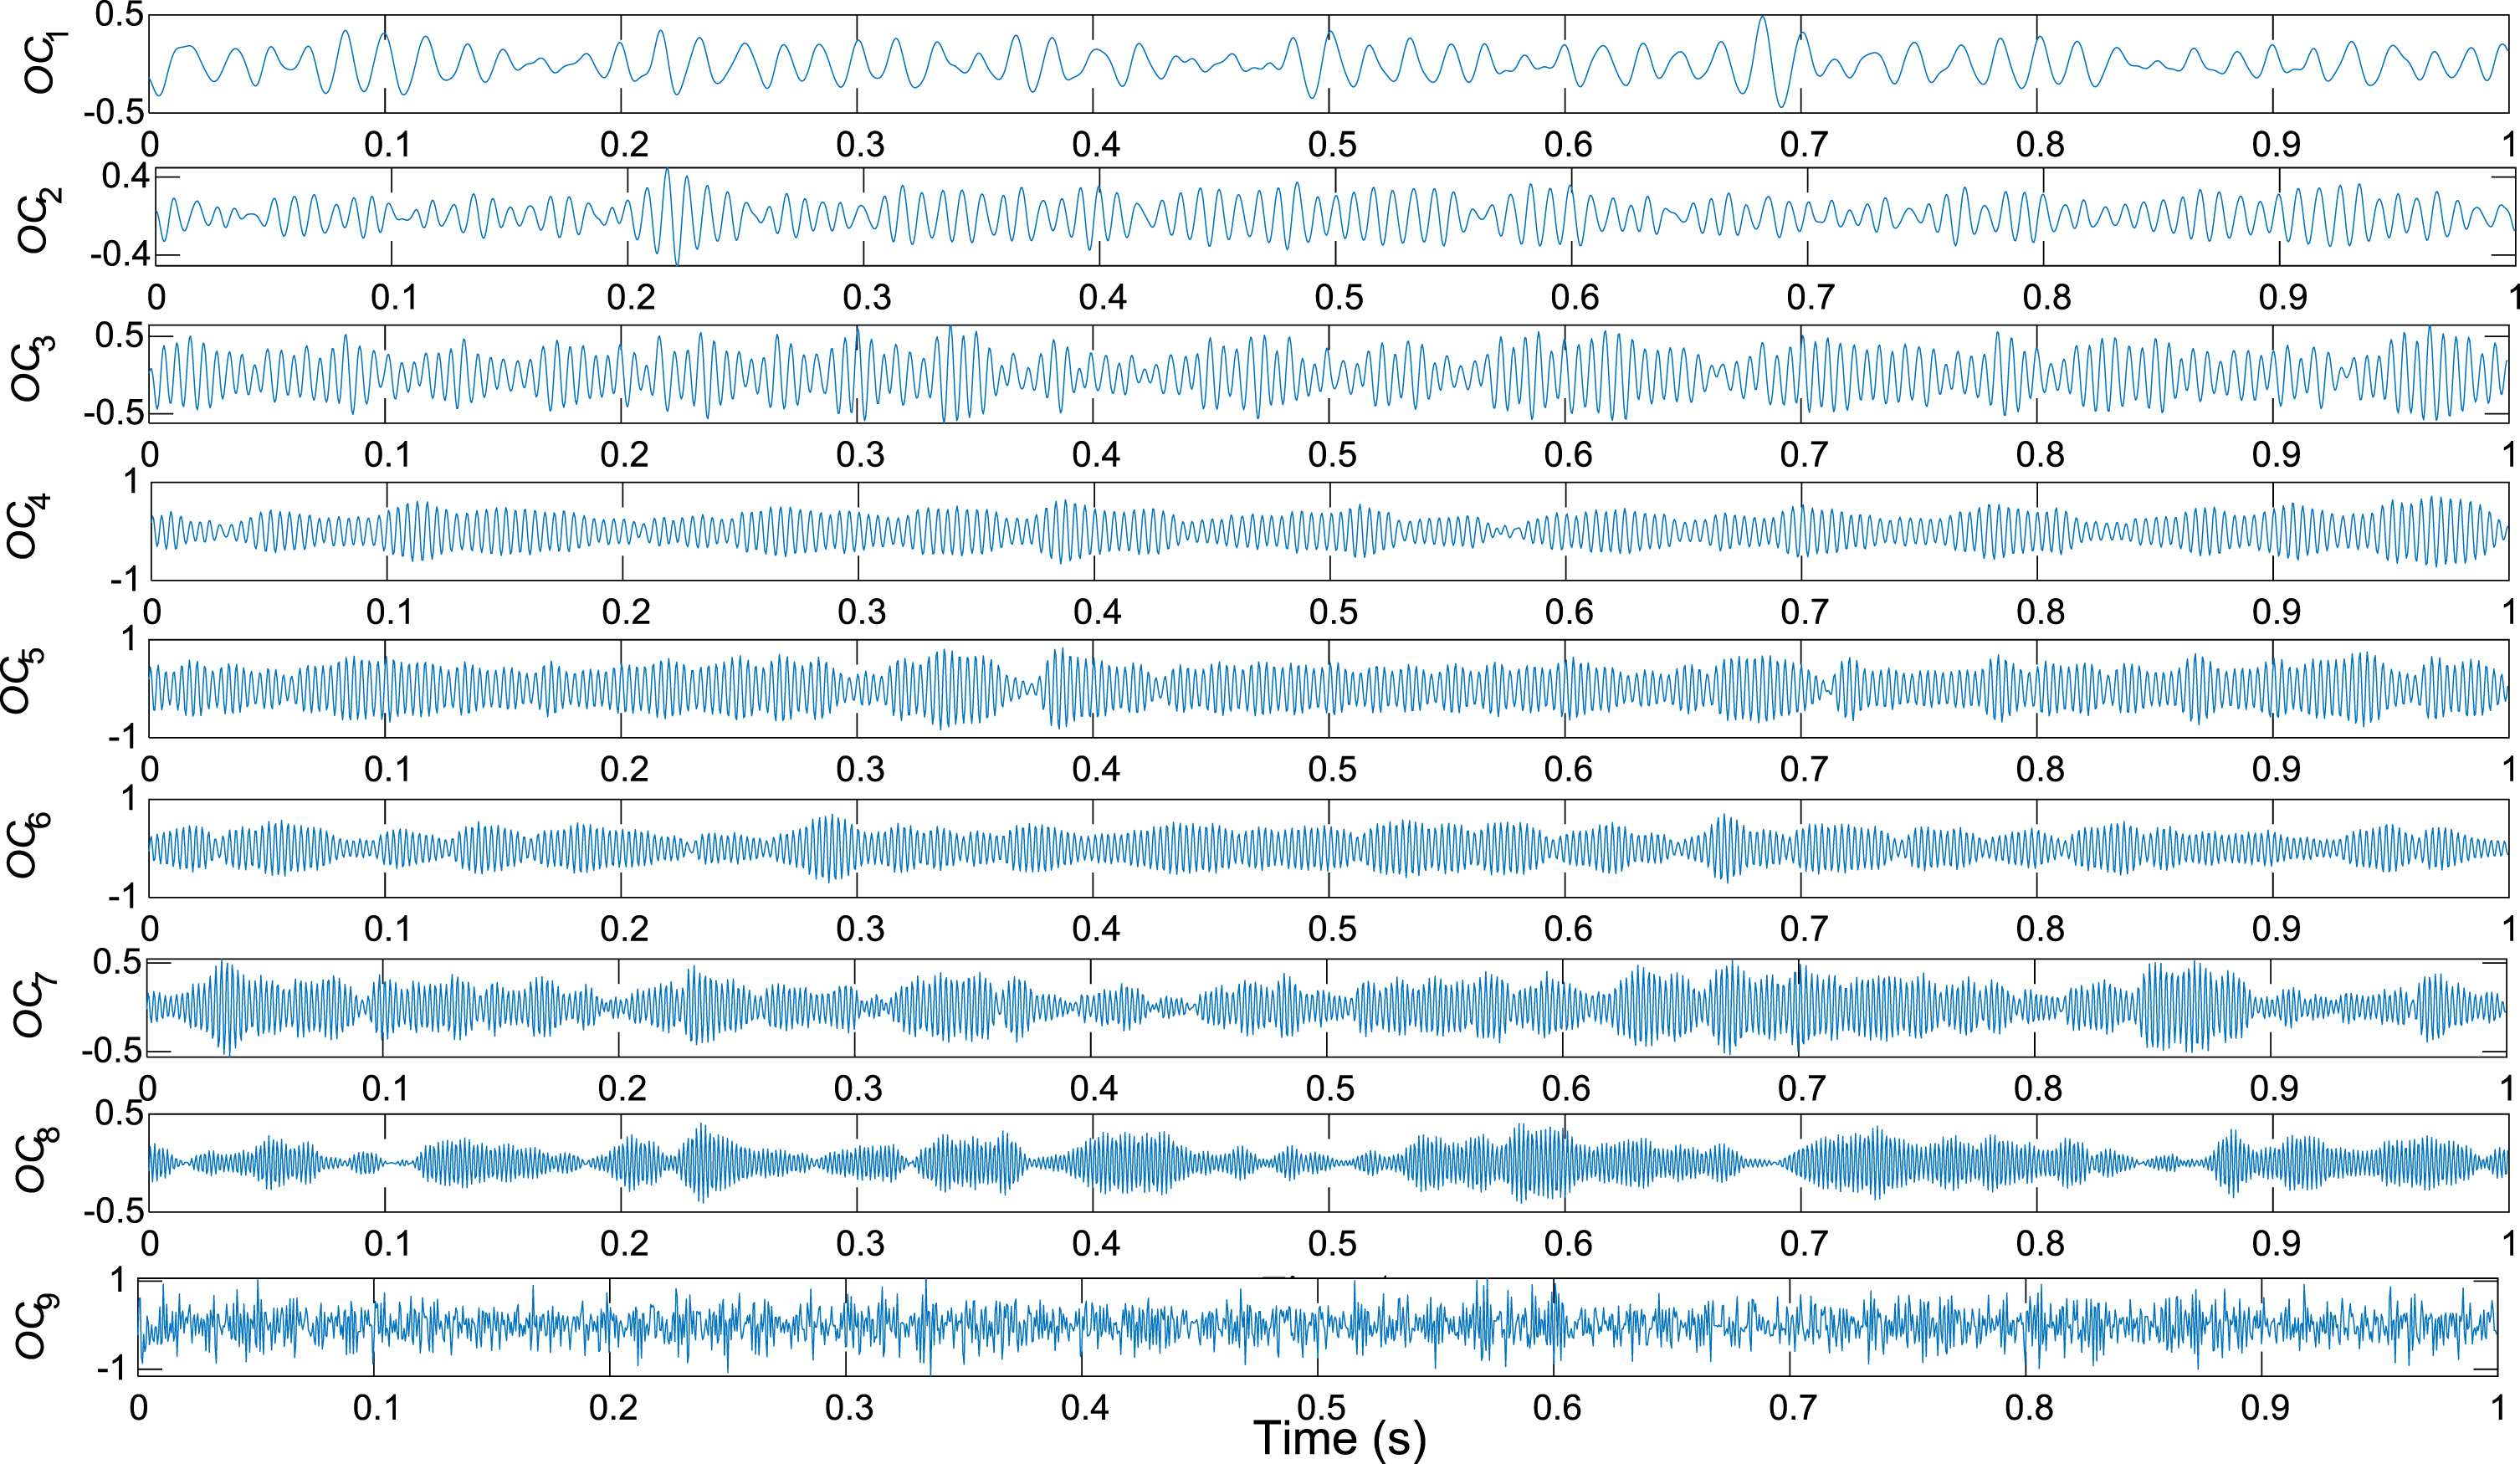
The decomposed components of the artificial simulation signal using SWD.
The LEP values and L-kurtosis values of OC components are calculated and saved in Table 1. The results show that the OC9 has the largest LEP values and L-kurtosis, that is, OC9 contains the richest useful information for fault diagnosis. Therefore, the FWEO spectrum is performed on OC9 for bearing fault features extraction, and the result is plotted in Fig. 9. As displayed in Fig. 9, the IF and its multiple harmonics ×IF (×= 2,3,...,6) can be observed clearly. The results demonstrate that the presented bearing fault detection scheme is valid.
The LEP values and L-kurtosis values of each OCs
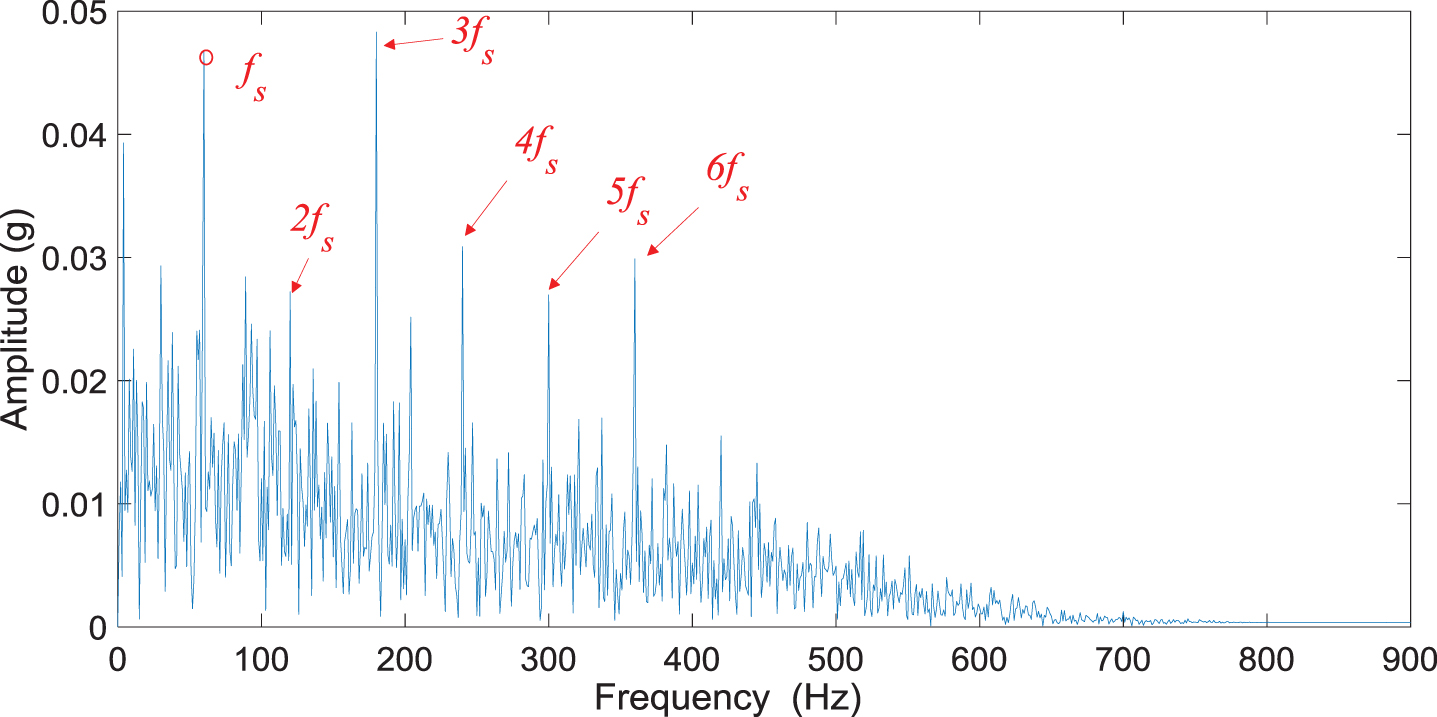
The FWEO spectrum of OC9.
Experimental analysis of bearing with inner race damage
The bearing vibration acceleration datasets from the Case Western Reverse University was employed to validate the effectiveness of the presented scheme. As indicated in Fig. 10, the experimental platform is composed of an induction motor on the left side, a torque encoder in the center and a load motor on the right side. One side of the induction motor is the fan end, and the other side is the drive end. The acceleration sensors are mounted vertically on the induction motor housing for collecting vibration signals. The sampling frequency is 12 kHz, and the rolling bearing type is an SKF deep-groove ball bearing (6205-2RS). The rotating speed maintains at 1730 rpm, and the fault characteristic frequency of bearing with inner-race damage (FIRD) is 159.7 Hz. Meanwhile, to validate the validity of the approach in extracting bearing fault features in a strong noise environment, Gaussian white noise is also added to the above measured signal.
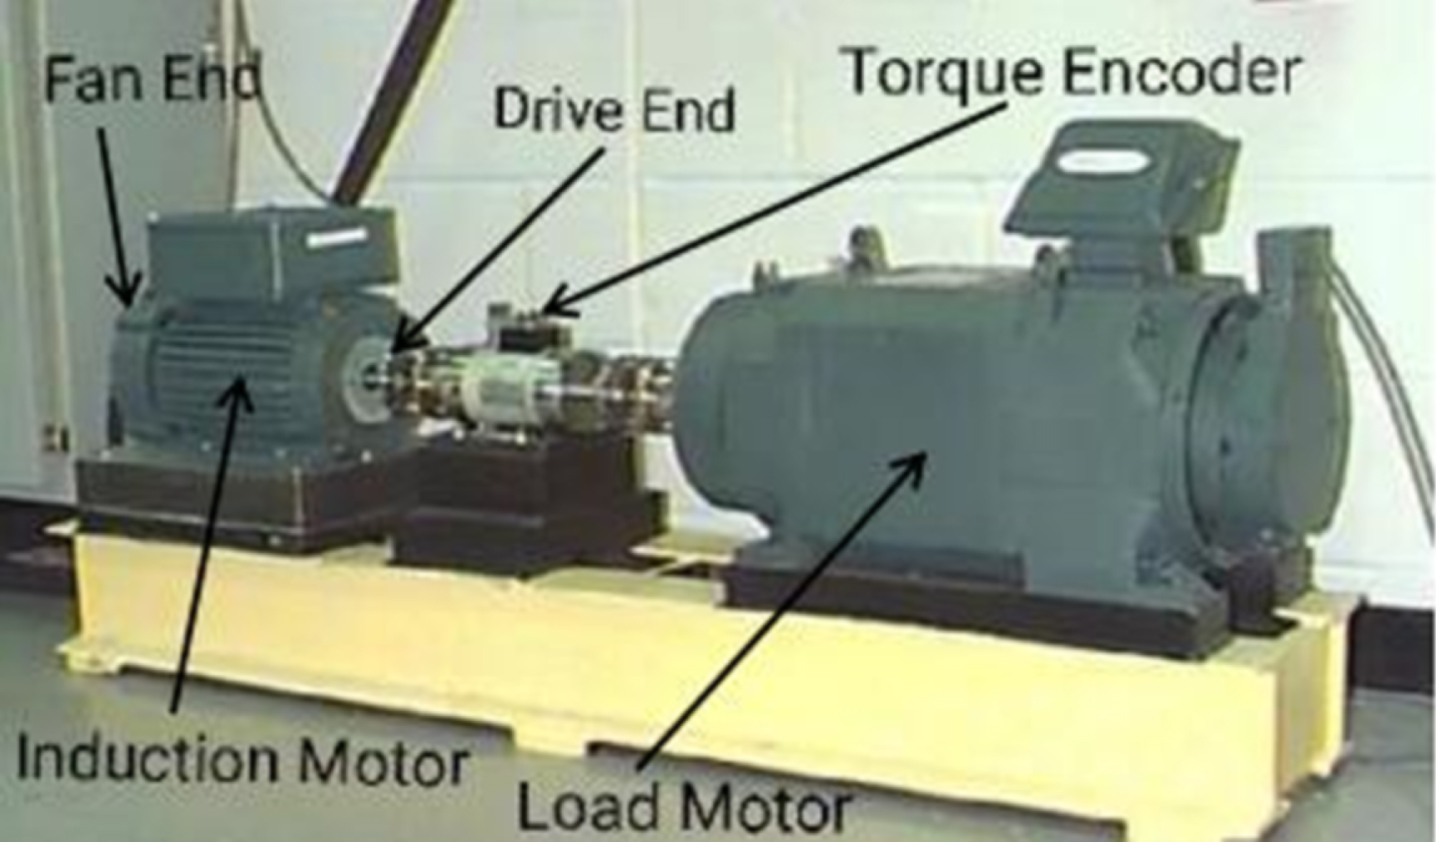
Western Reserve University Bearing experimental setup.
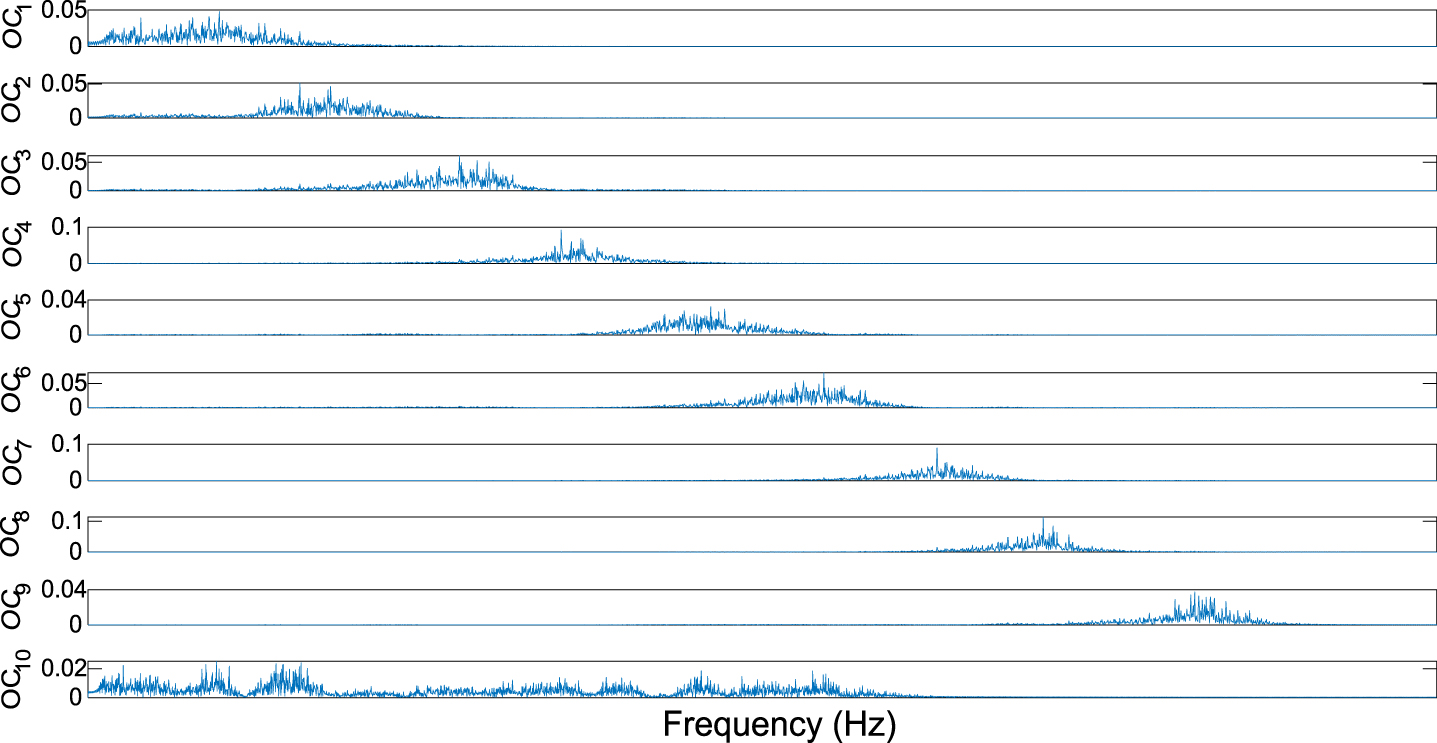
The time-frequency waveform of the bearing fault vibration signal is illustrated in Fig. 11. As can be seen, the FIRD is submerged by noise. Then the envelope and FWEO analysis are employed to analyze the original signal, as shown in Fig. 12(a) and (b), respectively. From the Fig. 12, the FIRD and its harmonics are also masked by the noise interference, and fault features are hard to observe clearly. Due to the complex working environment, the noise energy generated by other mechanical components is stronger than the impact energy generated by bearing defects, so the FIRD of bearing cannot be detected. In other words, only through FWEO, envelope spectrum and the FFT analysis, it is difficult to identify bearing fault features. Finally, SWD technique integrated with FWEO is used to decompose the vibration signal, and the frequency spectrum of 9 components obtained is shown in Fig. 13. The last of one is the remainder. Furthermore, the LEP values of OCs are calculated and given in Table 2.
Original bearing fault signal: (a) time domain waveform (b) frequency domain waveform.

The result of bearing fault diagnosis: (a) envelope spectrum, (b) FWEO spectrum.
The decomposition results of the inner race defective bearing fault signal.
The LEP values and L-kurtosis values of each OCs
A comparative study was conducted to verify which of the proposed LEP index and L-kurtosis index is more suitable for selecting the most useful component. From the Table 2, among all the decomposition results, the L-kurtosis and LEP values of each OC indicates that OC9 has the largest L-kurtosis value (0.1312) and OC8 has the largest LEP value (0.0065). Then, the FWEO spectrum analysis is performed on OC9 and OC8, respectively. The FWEO spectrum of OC9 does not contain bearing fault information, as depicted in Fig. 14. The FWEO spectrum of OC8 is illustrated in Fig. 15. The FIRD can be detected obviously. Therefore, it is more effective to select the most useful component with the LEP index.

The FWEO spectrum of OC9.
The FWEO spectrum of OC8.
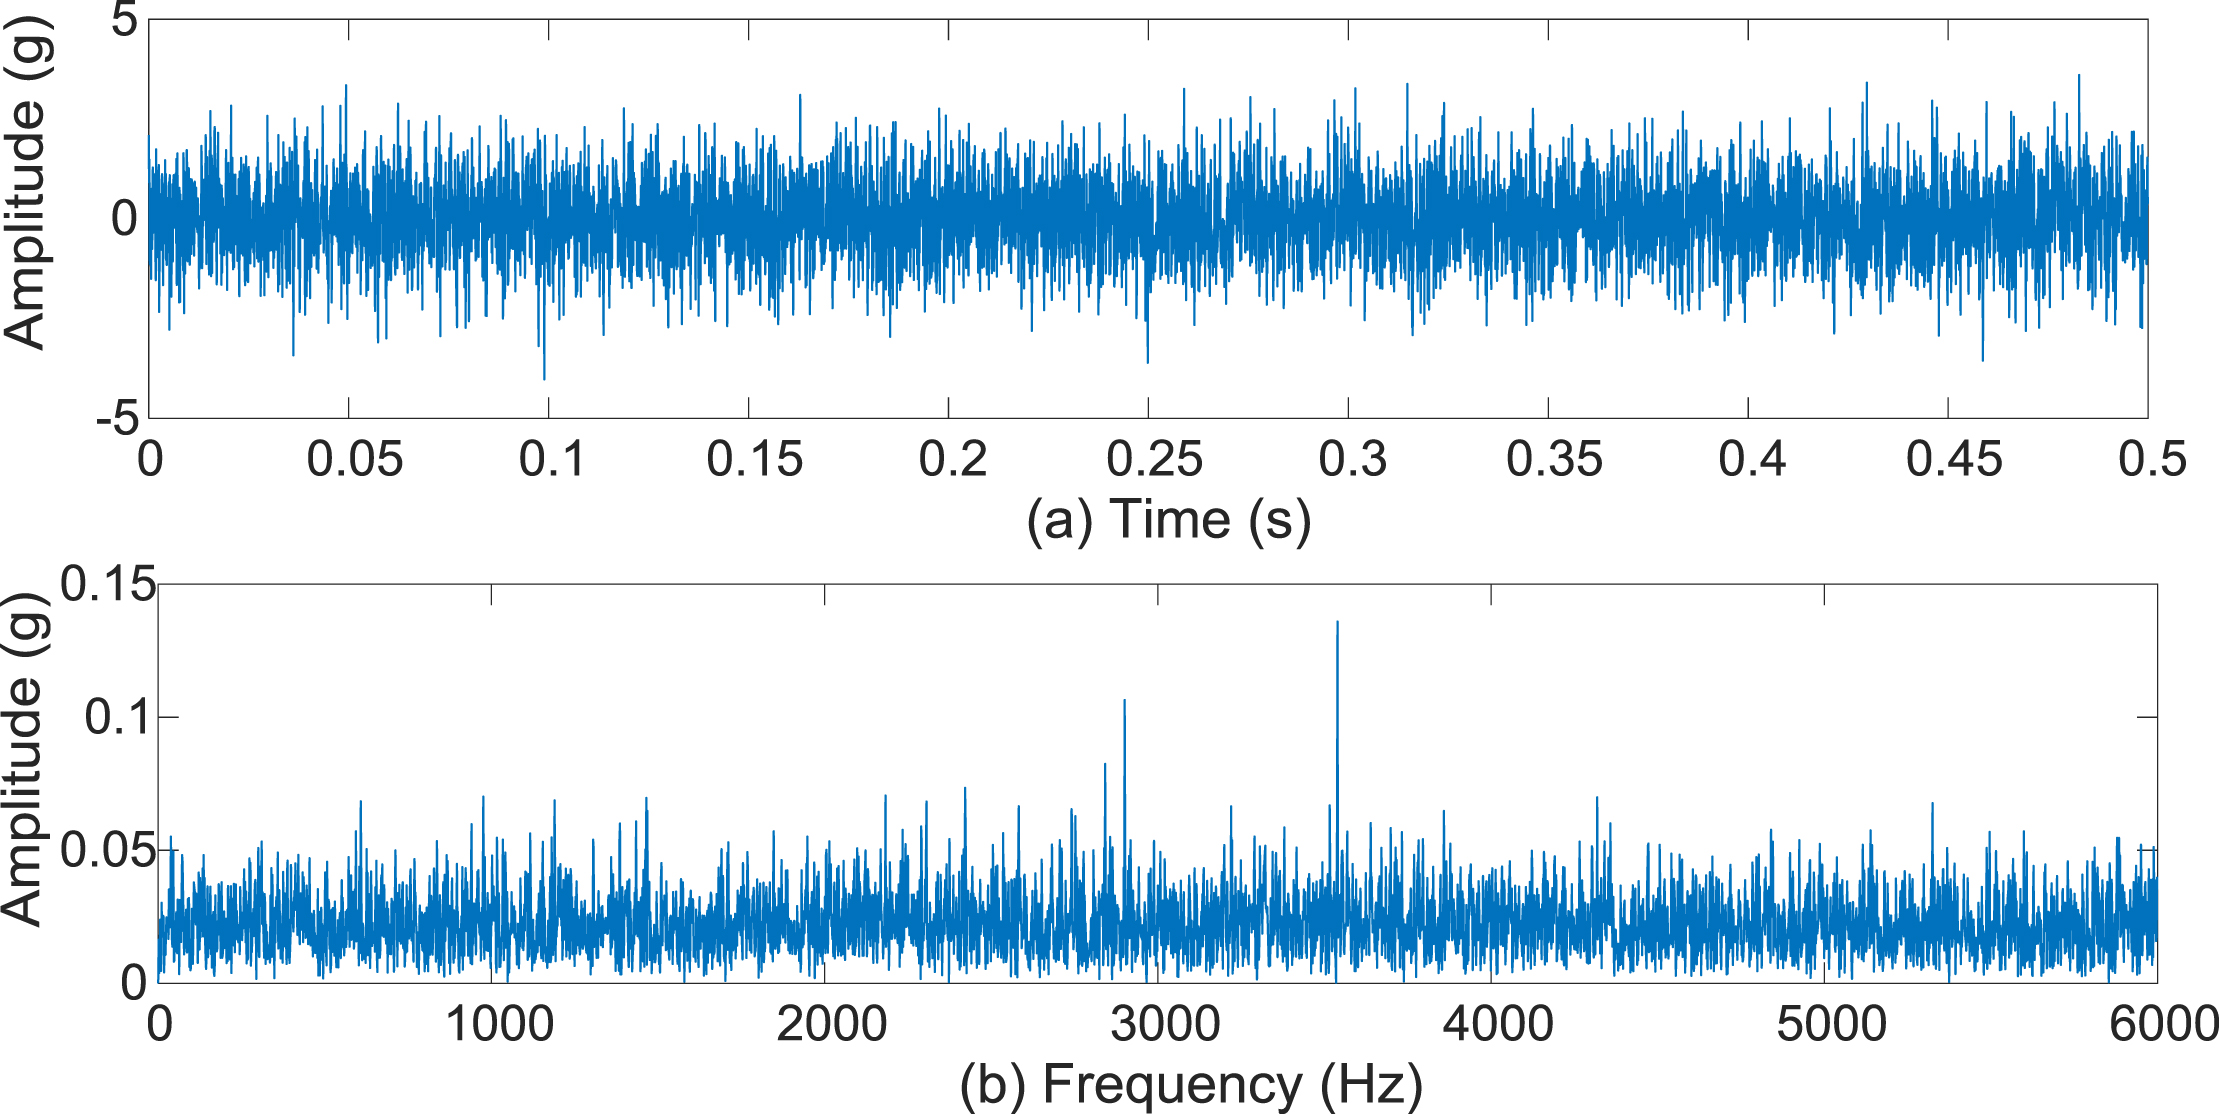
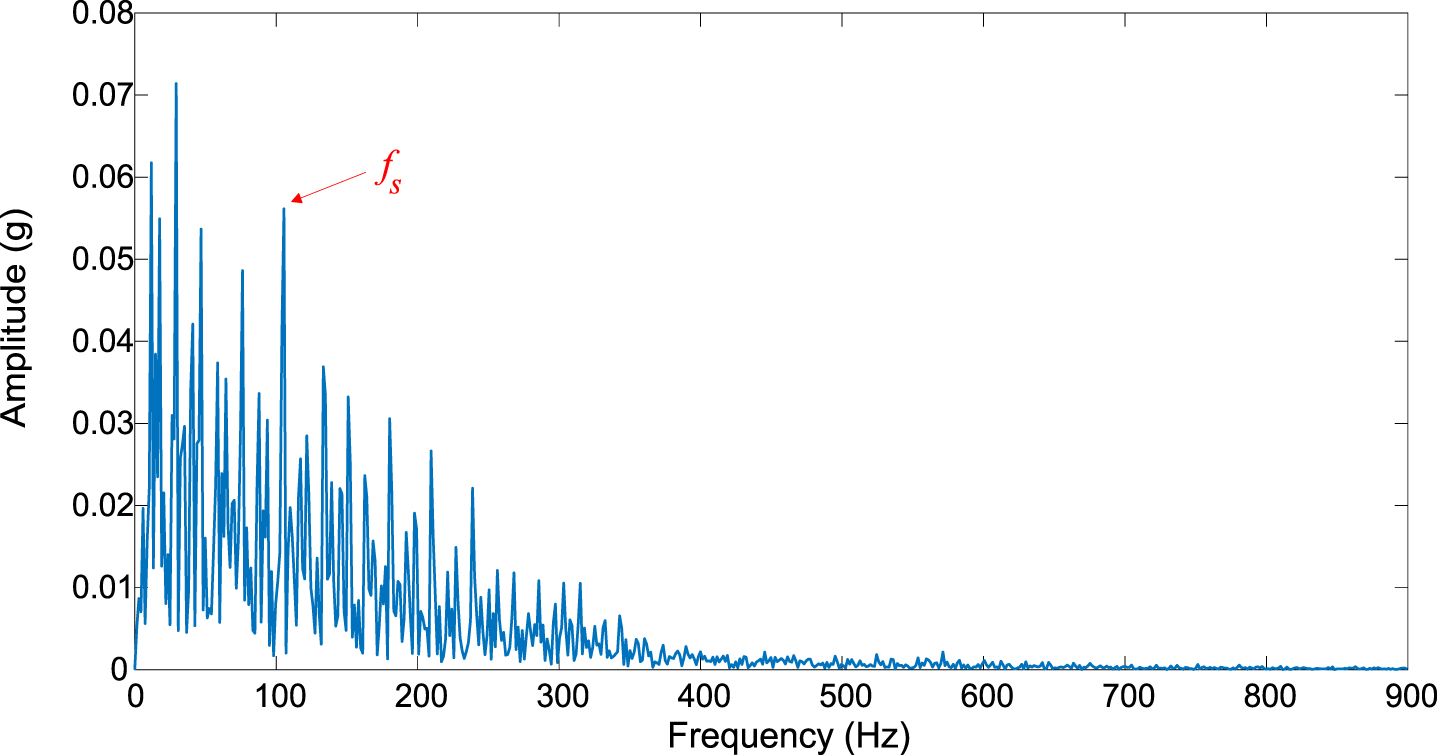
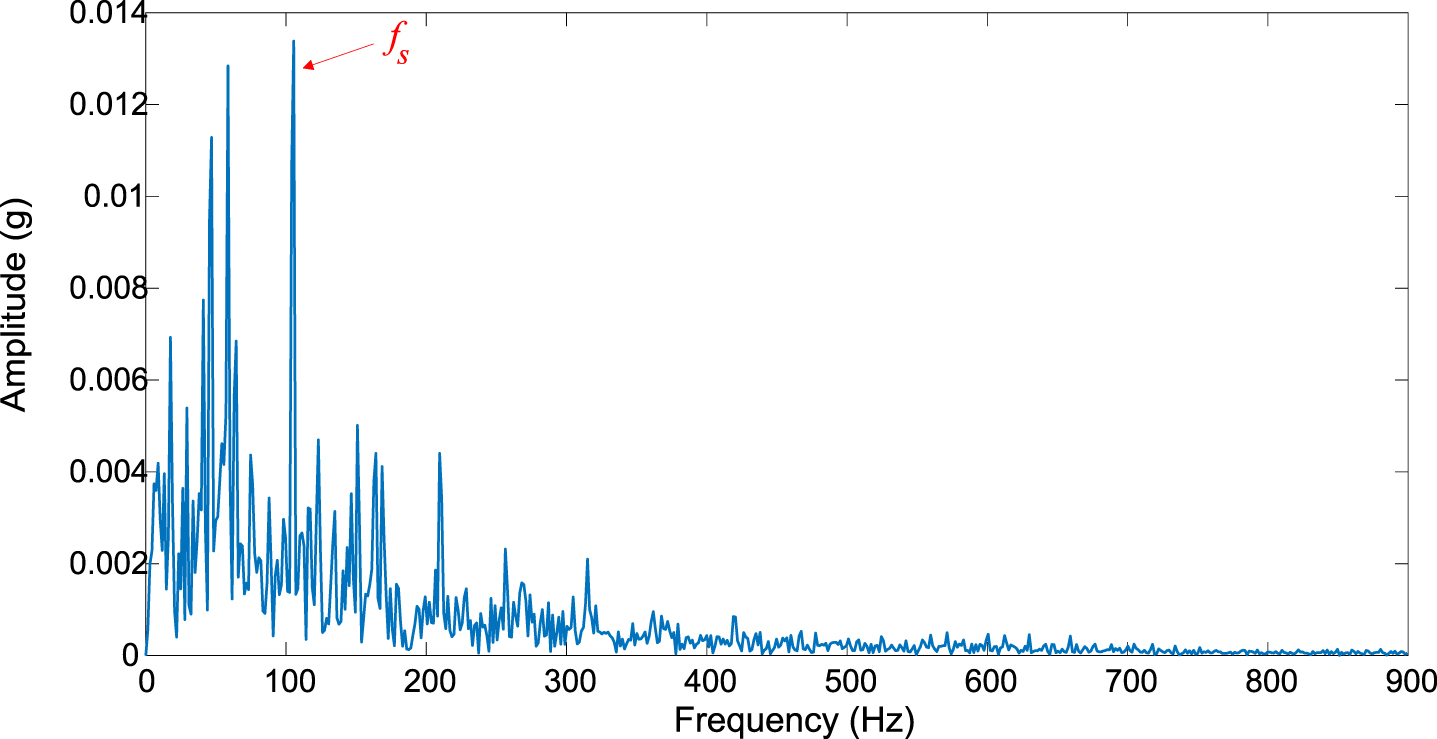
The bearing vibration data was acquired from the above bearing experimental setup. The sampling frequency is 12 kHz, and the sampling point is 6000. The fault characteristic frequency of bearing with outer race damage (FORD) is 105.8 Hz. Meanwhile, to prove the validity of the approach for extracting fault features in a strong noise environment, Gaussian white noise is added to the vibration signal. The time-domain analysis and frequency-domain analysis of the vibration signal are shown in Fig. 16.

Original bearing fault signal: (a) time domain waveform, (b) frequency domain waveform.
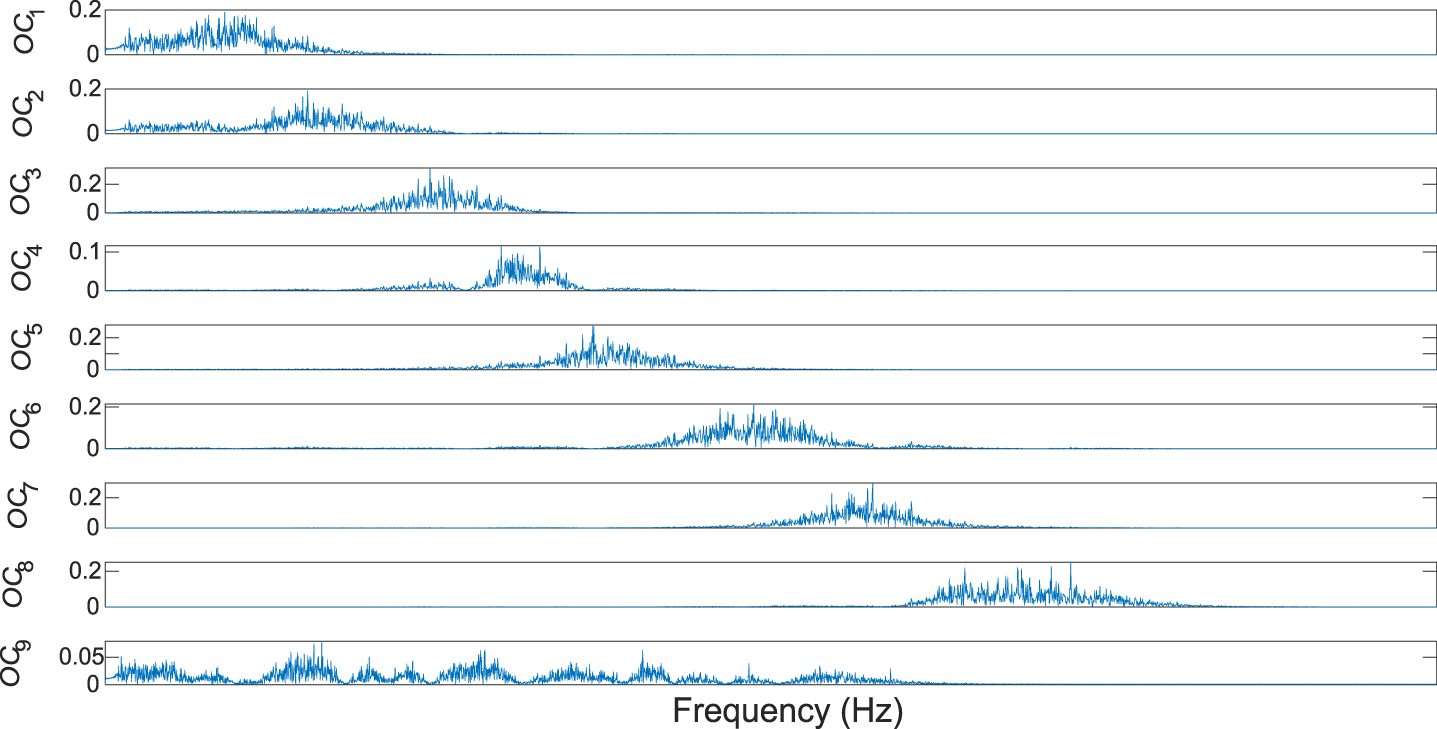
As depicted in Fig. 16, fault impact components are difficult to identify in the waveform of the time domain. Furthermore, there are many interference components in the spectrum, which make FORD and its harmonics are indistinct. The SWD decomposition results are shown in Fig. 17, and the LEP value of each OC is calculated and listed in Table 3.
The decomposition results of the outer race defective bearing fault signal.
The LEP values and L-kurtosis values of each OC
Table 3 shows that OC8 has the largest L-kurtosis value (0.2353), and OC9 has the largest LEP value (0.0221). Figures 18 and 19 plot the FWEO spectrum of OC8 and OC9, respectively. The FWEO spectrum of OC9 and OC8 both indicate a local defect in outer race of bearing. However, the FORD can be detected more clearly in the FWEO spectrum of OC9, and the amplitudes of interference components are smaller compared with Fig. 19. Thus, OC9 is the most useful component, which further proves the effectiveness of the LEP index and the presented approach.
The FWEO spectrum of OC8.
The FWEO spectrum of OC9.
Experimental analysis of bearing with outer race damage
The experimental data from Machinery Failure Prevent Technology is used to further verify the availability of the proposed approach [27]. In this experiment, the speed of the input shaft is 1500 rpm, the load is 25 pounds, and the FORD is 81.8 Hz. The sampling frequency and sampling point are 48828 Hz and 8000, respectively. The test bench is installed with a NICE bearing, which includes the following parameters: the roller diameter is 0.235 mm, the pitch diameter is 1.245 mm, the number of elements is 8, and the contact angle is 0°.
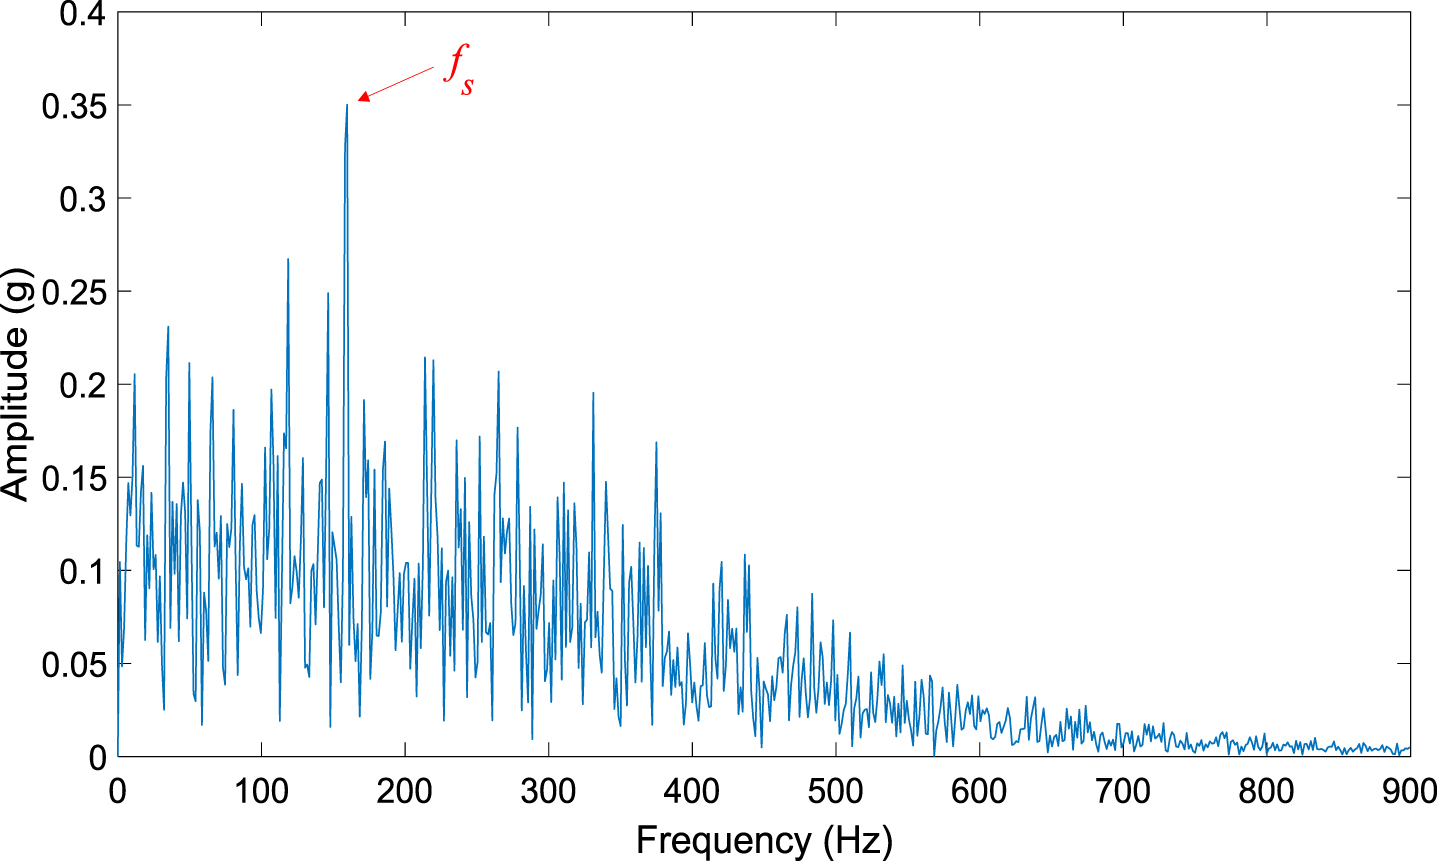
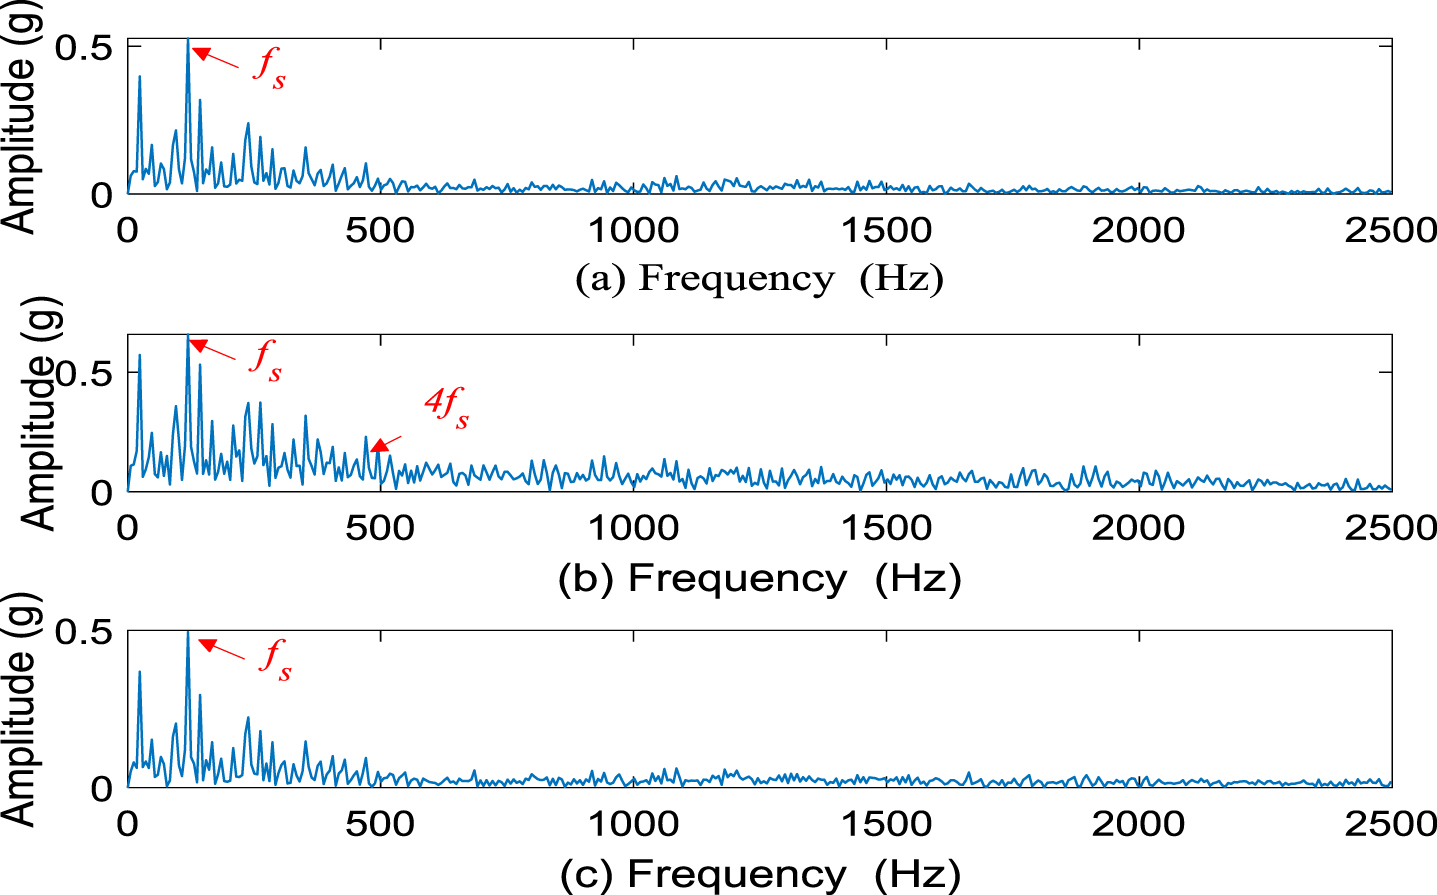
The time-frequency domain waveform is plotted in Fig. 20. The above vibration signal is preprocessed using the presented scheme. The LEP values of all OCs are calculated and presented in Table 4. The demodulation results of OC7 are depicted in Fig. 21, where the envelope and TKEO spectrum are shown in Fig. 21(a) and (c). The FORD and its harmonics ×FORD (×= 2,3,4,5) are detected in both Fig. 21(a) and (c). From Fig. 21(b), the FWEO spectrum of OC7 can also identify the FORD and its harmonics ×FORD (× = 2,3,...,13). These comparisons confirm that the presented scheme is more accurate in bearing fault features detection.

Original bearing fault signal: (a) time domain waveform and (b) frequency domain waveform.

The demodulation results of the useful OC: (a) envelope spectrum, (b) FWEO spectrum, (c) TKEO spectrum.
The LEP values of each OCs
In this experiment, the experimental analysis of bearing with inner race damage is conducted. the speed of the input shaft is 1500 rpm, the load is 25 pounds, and the FIRD is 118.2 Hz. The sampling frequency and sampling point are 48828 Hz and 8000, respectively. The parameters of the experimental bearing are the same as as those described in section 4.3.1.
First, the vibration signal is decomposed using SWD and 6 OCs is obtained. As mentioned before, the last of one is the remainder. Thus, we calculated the LEP index for the first five OCs, and the corresponding result is given in Table 5. As can be seen from Table 5, the OC4 corresponds to the maximum LEP value. Finally, the demodulation results of OC4 are depicted in Fig. 22, where the envelope and TKEO spectrum are shown in Fig. 22(a) and (c). The FIRD and its harmonics ×FIRD (×= 2,3) are detected in both Fig. 22(a) and (c). The FWEO spectrum of OC4 can also identify the FIRD and its harmonics ×FORD (×= 2,3,4,5) in Fig. 22 (b). Obviously, the fault characteristic frequencies shown in Fig. 22(b) are more and clearer. The analysis results further indicate that the presented scheme is more accurate and effective in bearing fault features detection.
The demodulation results of the useful OC: (a) envelope spectrum, (b) FWEO spectrum, (c) TKEO spectrum.
The LEP values of each OCs
In this paper, a bearing fault detection scheme integrating SWD with FWEO is presented. This approach took advantage of the frequency separation performance of SWD and the excellent fault feature extraction ability of FWEO to extract the bearing fault features. The main conclusions were as follows: SWD can effectively separate harmonic components with similar frequencies compared with EMD. It proves that SWD is more effective in frequency discrimination than EMD, and this paper successfully employs SWD to bearing fault detection. The proposed LEP index can select the most useful modal components more accurately compared with L-kurtosis. Experiments on both simulation signal and practical fault signal demonstrate that the presented approach is effective in decomposing the vibration signal and extracting the fault features for bearing fault detection. The presented scheme is superior to SWD combined with envelope analysis and TKEO spectrum analysis in terms of fault features extraction.
Footnotes
Acknowledgments
This work was supported by the Hubei Key Laboratory of hydroelectric machinery design and maintenance (No.2020KJX11), Hubei Superior and Distinctive Discipline Group of “Mechatronics and Automobiles” (No.XKQ2021033).