
Abstract
The problem of bilateral matching of teams and scientific and technical talents is studied in new R&D institutions with different forms of uncertain assessment information. A decision method is proposed based on a combination of grey correlation and cloud model. The method firstly applies interval grey numbers to characterize uncertain assessment score information and cloud models to characterize uncertain linguistic assessment information; secondly, the two different pieces of information are converted into grey correlation coefficients by applying grey correlation analysis methods to the assessment values, so as to solve indicator weights, and assemble assessment data based on indicator weights and cloud models; finally, the bilateral matching model is constructed and the matching results are solved based on the cloud model data features and the dual objectives of maximum satisfaction and minimum uncertainty. The case analysis and method comparison show that the method is feasible and effective.
Keywords
Introduction
New R&D institutions are a product of the technological revolution and industrial changes, and are of great significance in revitalizing innovation resources, realizing the organic reorganization of the innovation chain and enhancing the overall effectiveness of the national innovation system. In recent years, along with a series of policies introduced by the state, local governments, universities and enterprises support the development of new R&D institutions, new R&D institutions have accelerated their landing in the country, and the scale effect begins to emerge, becoming a new force of science and technology industry that cannot be ignored.
Compared with traditional R&D institutions, new R&D institutions have new features such as diversified investment subjects, modernized management system, market-oriented operation mechanism, flexible employment mechanism, etc. They can respond quickly to the market and the frontier of science and technology, gather scientific and technological teams and scientific and technological talents quickly, and focus on strategic priorities. however, the key to break through the “neck” of core technology lies in talents, especially those who master the core technology and understand the development trend of science and technology innovation. The concentration of scientific and technological talents promotes the sustainable development of new R&D institutions, generating spillover effects such as knowledge, information and technology, which also have a “siphon effect” on other innovation factors [1].
Since scientific and technological talents also have the right to choose new R&D institutions, new R&D institutions should not only select the talents they need according to regional characteristics, industrial characteristics and their own characteristics, but also actively promote the reform of the scientific research system mechanism, innovate the mechanisms of talent recruitment, remuneration and treatment, and transformation of results, so as to better stimulate the enthusiasm of scientific and technological talents, and the matching problem is highlighted. But the matching of new R&D institutions and scientific and technological talents has hardly been studied. There are many teams in new R&D institutions, and many teams exist independently, while scientific and technological talents eventually have to enter the team to work and study, so scientific and technological talents are actually matched with the team bilaterally in many-to-many ways. The bilateral matching of teams and scientific talents in new R&D institutions is based on two-way assessment, which needs to solve five problems: first, the problem of indicators of assessment information; second, the problem of representation of assessment information; third, the problem of weight of assessment information; fourth, the problem of aggregation of assessment information; and fifth, the problem of matching assessment information.
Indicators for assessing information can be informed by the research literature on the performance assessment of new R&D institutions and scientific and technological talents. The literature [2] assessed new R&D institutions in four dimensions: sustainable development and knowledge empowerment, industrial upgrading and technological innovation, product innovation and open sharing, and service clustering and collaborative innovation. The literature [3] designed an evaluation model for the performance of industrialization-oriented new R&D institutions in terms of four dimensions: R&D conditions, innovation activities, innovation benefits and human resources. The literature [4] proposed a new dynamic grey target assessment model of R&D organization performance from four evaluation indicators of innovation source-innovation process-innovation level-innovation result, three reference points of peer-development-expectation and four stages. In the paper [5], it is pointed out that the “Five Self” qualities and growth experiences of outstanding strategic scientific and technological talents are important inspirations for the cultivation and growth of strategic scientific and technological talents. Literature [6] designed quantitative indicators in terms of academic contribution and research potential in terms of academic achievements, research projects, collaborative exchanges and output applications. The literature [7] constructed an evaluation system for high-end talents in terms of academic ability, academic influence and social activeness.
The problem of evaluating the representation of information can be obtained from the literature on bilateral matching in fact. Professor Gale from Brown University and Professor Sharply pioneered the theory of bilateral matching decision in 1962. But Gale-Sharply matched based on the preference order given by both parties, and many scholars conducted bilateral matching research based on incomplete and uncertain preference order [8, 9], and later some scholars expanded the matching information from preference order to triangular intuition fuzzy number [10], interval hesitation fuzzy information [11], linguistic information [12], etc., considering the diversity and uncertainty of matching input information.
The problem of assessing the weight of information can be determined by methods of determining the weights of indicators for multi-attribute decision making, with subjective methods, objective methods, and combined subjective-objective methods [13–16].
The problem of assessing the aggregation of information can be referred to bilateral matching combinations: the Choquet integral approach [17] considering indicator correlations, ant colony optimization methods [18], cloud models [12], prospect theory[19], dynamic game methods [20], regret theory [21], grey system theory [22], equity theory [23], etc.
The problem of matching assessment information can be referred to the literature related to bilateral matching based on preference order, with matching methods such as one-to-one [24], one-to-many [25], and many-to-many [12], mostly using linear 0-1 planning and considering single objectives such as maximum satisfaction or minimum regret for both parties [17–21], and there is also literature considering dual-objective matching with maximum satisfactions and minimum individual differences [26].
Since matching new R&D institutions and technological talent is particularly important and relevant, combined with many methods, there are also many scholars the author refers to a lot of literature on cloud models and argues that cloud models are highly adaptable in that they can convert any form of information into cloud data, and the three numerical features of cloud data, Expectation “Ex”, Entropy “En”, and Hyper entropy “He”, fully express the uncertainty of the data. First, most of the current cloud modeling research papers transform fixed linguistic assessment information into standardized cloud data [27–30], and there are few studies on expanding information beyond linguistic information [31]; second, the first conversion of assessment data into cloud data is integrated with serial data under the same index, without considering the weights of serial data [31]; third, after transforming information into cloud data, it did not consider the characteristics of the cloud data comprehensively, but only simulated with the expectation value “Ex” [12]; fourth, there is little literature combining the cloud model and bilateral matching [12]. Grey system theory is the study of uncertain small sample problems, and grey correlation analysis not only considers reference points, but also similarity and satisfaction. There is literature combining grey system theory and cloud model for decision analysis [31–33].
Based on the uncertainty of two-way assessment information of new R&D institutions and scientific and technological talents, and the small sample problem, this paper considers the method of combining grey correlation analysis and cloud model. Firstly, constructing a two-way assessment index system based on the characteristics of new R&D institution team and scientific and technological talents, expanding the assessment input information from linguistic information to uncertain interval grey number and uncertain linguistic information; secondly, in the process of first time of serial data assembled into cloud data, the weight of data shall be considered; and finally, the assessment data are assembled into the data of the cloud model, and the characteristics of the cloud data are considered comprehensively, and the two-way satisfaction maximum and uncertainty minimum dual objectives are considered, and the dual objectives are converted into a single objective to construct an optimization model, so as to realize the matching of new R&D institution teams and scientific and technological talents. The method of this article is very universal from input information to indicator weights, to data assembly methods, and finally the dual-objective many-to-many matching method based on cloud model. The calculation process is very simple and convenient, and the graph of cloud model data can also be simulated by MATLAB software during the calculation process to see the characteristics of the evaluation data more intuitively. The article concludes with a case and method comparison detailing the operational steps and timeliness of the method.
Main approaches
A system of indicators for assessing scientific and technological talents by teams of new R&D institutions (T-S)
Since new R&D institutions focus on breaking through core technologies, solving “neck” problems and transforming achievements, the development process of new R&D institutions requires more and more comprehensive quality and sensitivity of scientific and technological talents, especially scientific and technological talents who master core technologies and can understand the development trend of scientific and technological innovation, have a patriotic heart and a passion for serving the country with science and technology. In order to ensure the accuracy of the index system for the assessment of scientific and technological talents in new R&D institutions, the indexes should be selected as high-end cutting-edge and comprehensive as possible, based on literature research, summarizing and refining the assessment of scientific and technological talents’ ability and considering the availability and operability of index data. 7 papers were finally selected [1–7], of which 100% were included in SCI, SSCI and CSSCI, etc, summarized 5 dimensions and 10 indicators, and established a multidimensional science and technology talent assessment index system, as shown in Table 1.
Indicator system for the assessment of scientific and technological talents by the team of new R&D institutions
Indicator system for the assessment of scientific and technological talents by the team of new R&D institutions
According to Maslow’s Hierarchy of Needs, the needs are divided into physiological needs, security needs, love and belonging, respect and self-actualization needs. When scientific and technological talents choose the team of a new R&D institution, they first consider whether they have a sense of belonging, which is reflected in the talent training and talent ladder, and the talent training shows that the team of a new R&D institution attaches importance to the sustainable development ability of the talents and gives them a continuous input of knowledge and skills. the talent ladder shows the team’s research direction and development trend, so that scientific and technological talents can well plan their future development direction. Secondly, scientific and technological talents should be clear about how to realize their own value, such as talent assessment and talent services. Talent assessment can let scientific and technological talents see clear assessment requirements, develop a clear struggle path according to the assessment target, and analyze the possibility of receiving high performance; talent services can let scientific and technological talents start their future career in a very relaxed and pleasant process, and the access to scientific and technological resources and the leadership of scientific and technological culture can make science and technology talents more confident and self-aware. According to the characteristics of scientific and technological talents, literature analysis and working practice, the author similarly summarizes 4 dimensions and 8 indicators to establish a team assessment index system for new R&D institutions, as shown in Table 2.
Indicator system for the assessment of new R&D organization teams by scientific and technological talents
Indicator system for the assessment of new R&D organization teams by scientific and technological talents
In summary, the bilateral matching of new R&D institutions and scientific and technological talents are represented in Fig. 2.2. In the process of bilateral matching between new R&D institutions and scientific and technological talents, the supply of scientific and technological talents should meet the needs of new R&D institutions, while the supply of new R&D institutions should also meet the needs of scientific and technological talents, and they are assessed in both directions based on the index system and matched in both directions based on the principle of the highest satisfaction of both sides.
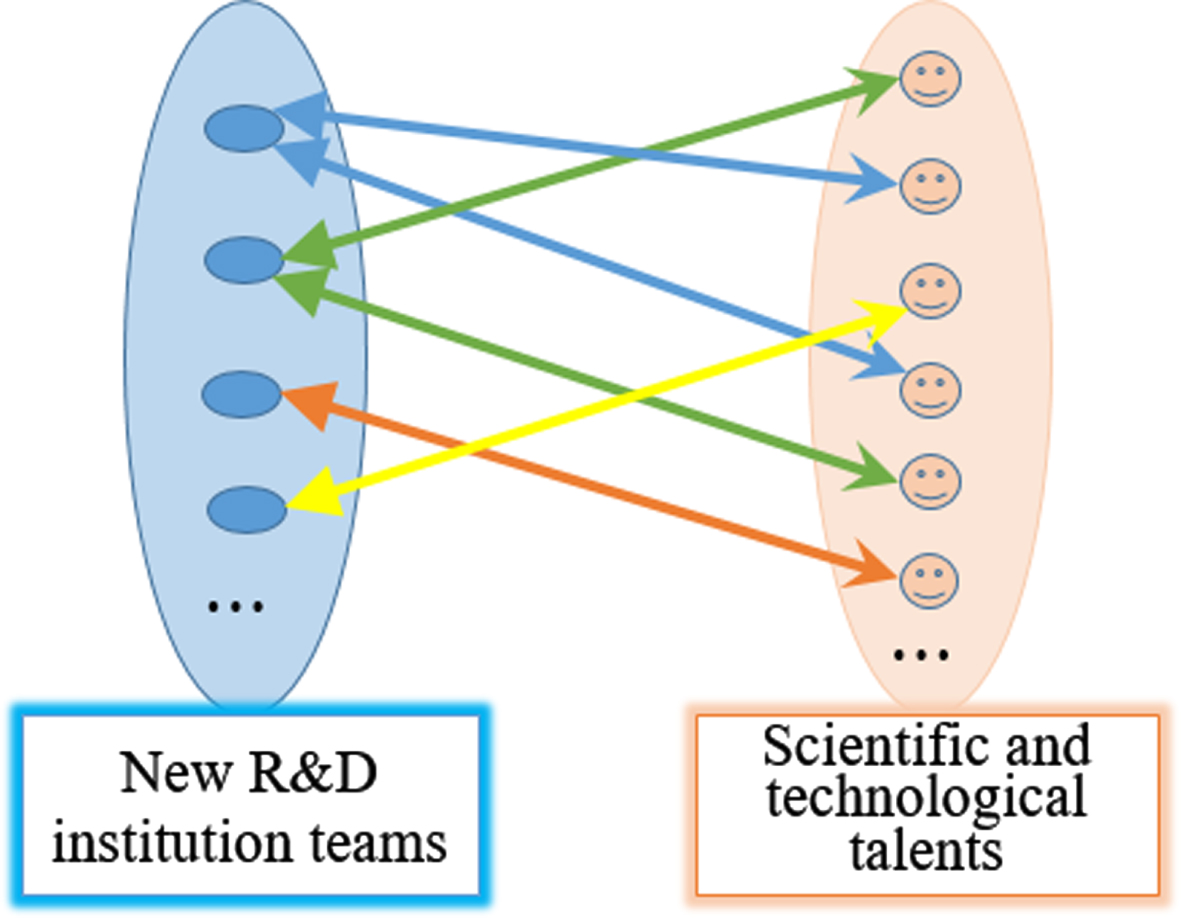
Model of bilateral matching indicators between new R&D institution teams and talents.
In this paper the decision for bilateral matching of team-technical talents in the new R&D organization is two decision matrices A and E for two-way assessment. Let there are n teams in the new R&D organization and m scientific and technical talents pass the initial test and need to be matched. There are k assessment indicators for team-to-talent assessment and r assessment indicators for talent-to-team assessment. When teams and talents are assessed based on the assessment index system, sometimes they give percentage scores and some give linguistic information, which are uncertain. Therefore, there is a need to find certain methods to aggregate the assessment data for the purpose of bilateral matching.
Characterization of T-S assessment values in terms of interval grey numbers
The T-S assessment value is the specific data given by the new R&D institution team T to the scientific and technological talent S based on the T-S assessment index. The team of the new R&D organization gives a percentage score when assessing the scientific and technical talent. Since different team representatives are involved in the assessment, there are assessment differences in these representatives’ own learning, preferences, reference points, information asymmetry, etc., so the assessment results are not exactly the same. However, since they belong to a new type of R&D organization, the head of the organization often has some introduction to the assessment, so that the difference between the assessment results will not be too large, and the assessment data is a range of grey numbers, which do not know the specific value of the assessment, but clearly know the range of the assessment value. 1982, our scholar Professor Deng Julong proposed the “grey system theory”, which is to solve this kind of uncertainty of small sample data set problem. Grey number is the basic “cell” of grey system theory, which is an uncertain number of values in a certain interval, only knowing the range of values of information but not the exact value of information, usually denoted by the symbol ⊗. A grey number that has both a lower and an upper bound is called an interval grey number, denoted as
Normalization of interval grey number assessment values based on the maximum value method
The maximum value transformation method is intuitive, convenient, and fast to achieve the normalization requirements while preserving the characteristics of the original data, and is one of the most commonly used transformation methods for grey numbers in multi-attribute intervals. In this paper, the maximum value transformation method is used to normalize the T-S assessment values. The maximum value transformation method uses the initial evaluation values of
call σ (⊗ 1, ⊗ 2) as the distance between ⊗1 and ⊗2. Where
In 1982, Professor Deng Julong published a paper on “Control Problems of Grey Systems” and “Grey Control Systems”, which marked the beginning of the new cross-cutting discipline of grey system theory [34]. The research object of grey system theory is a “small sample” and “information-poor” uncertain system with “partly known information and partly unknown information”. It understands the real world through the generation and development of “partially” known information, and realizes the correct grasp and description of the system operation behavior and evolution law. In literature [35], a fast typical target recognition algorithm f small samples is proposed, which uses a laser line scan model to complete the two-dimensional scanning of the target and obtains the distance value of the target to be recognized, forming the sample sequence matrix of the recognition algorithm, thus providing a reference for future applications of low-cost laser imaging fuse target recognition. The literature [36] proposed a top-down prediction method based on grey system theory to reveal the future trend of annual heat supply to assist urban planning and energy structure reform. The literature [37] applies the grey system theory MGM (1,4) to predict the development of road traffic accidents in Germany until 2025 based on the market diffusion of electronic stability plans (ESP). The literature [38] proposes a new supplier selection tool that combines grey systems theory with uncertainty theory without any probability distribution nor fuzzy affiliation function to not only select the most suitable supplier but also to assign the optimal purchase quantity under stochastic and identifiable uncertainty. The literature [39] proposed the grey point assignment full consistency (grey-PA-FUCOM) weighting method and the extended grey state method based on grey system theory to solve the uncertainty in the process of evaluating suppliers. From the above literature, it can be seen that: the main contents of grey system theory include grey correlation analysis, grey series generation, grey prediction model, etc. There are no special requirements and restrictions on the observation data and its distribution, and it has very wide application fields for system analysis, evaluation, prediction, decision making, control, optimization, etc.
The basic idea of grey correlation analysis is to determine whether the series curves are closely related according to their similarity in geometry. The closer the curves are, the greater the degree of correlation between the corresponding series, and vice versa, the smaller the crelation. The grey correlation analysis method is equally applicable to the amount of sample size and the presence or absence of aattern in the sample, and it is very convenient with a small calculation, and there is no discrepancy between the quantitative results and the qualitative analysis results. The literature [40] conducted a comprehensive evaluation owaste heat recovery technologies for offshore alications based on hierarchical-grey correlation analysis, analyzed the correlation between each cost and studied the impact of individual costs on the total cost, which helps to determine the most suitable heat recovery technology for marine engines. The literature [41] proposed 16 potential factors influencing carbon emissions and used grey correlation analysis to identify factors with strong correlation with carbon emissions, providing a theoretical basis for reducing carbon emissions in China. The paper [42] analyzed the relationship between the correlation coefficient and the physical properties of recycled coarse aggregate (RCA) based on the grey correlation analysis (GCA) method to achieve the prediction of the compressive strength of recycled aggregate concrete. The literature [43] proposed an adaptive kernel principal component analysis (AKPCA-GRA) method combined with grey correlation analysis (GRA) to dynamically monitor the occurrence of failures. In the literature [44], the safety of nonlinear hydro generator units (HGU) operating under different loads was analyzed using a combination of entropy weight method and grey correlation analysis. From the above literature, it can be seen that grey correlation analysis can be used for assessment, influence factor analysis, prediction, monitoring of faults and safety, etc. It can also be combined with different methods, such as hierarchical analysis, principal component analysis, entropy weight method, etc., showing better problem solving capabilities.
In this paper, the maximum value is used as the reference point. Due to the existence of the reference point, the team of the new R&D organization and the scientific and technical personnel care more about the difference between the result and the ideal solution rather than the result itself. The closer the assessed value under a certain indicator is to the maximum value, the higher the satisfaction of the decision maker under that indicator, and the farther the distance from the maximum value, the lower the satisfaction under that indicator. In this paper, we calculate the grey correlation coefficient based on grey correlation analysis and get the T-S correlation coefficient matrix
Let the T-S subjective indicator weights be ω1j, the T-S objective indicator weight is ω2j, and the T-S composite indicator weight is ω3j. The objective indicator weights are calculated based on the grey correlation coefficient
Introducing subjective-objective weighting parameters θ, the weights of the subjective indicator weights are θ, the weights of the objective indicator weights are 1 - θ, then the combined indicator weights,
The matrix of T-S grey correlation coefficients C = [cij] according to the combined indicator weights ω3j. The clustering is performed. In order to keep the normality of the assembled data and the original correlation coefficient information from being lost, and to consider the integrated indicator wghts, this paper takes 1/max(ω3j) and performs the reconciliation tobtain the new T-S evaluation correlation coefficient matrix
The cloud model was proposed by Professor Li Deyi in 1995 to deal with the uncertainty transformation of qualitative concepts and quantitative descriptions [27], which breaks the traditional fuzzy assessment method and abandons the practice of using the exact affiliation function to calculate the median value of the thesis domain, followed by the expectation “Ex”, entropy “En” and super entropy “He” to reflect the uncertainty of the concept. The cloud model can be converted from qualitative to quantitative by forward cloud generator, which generates cloud drops based on the numerical characteristics of clouds. The cloud model, through the inverse generator, then converts the exact data into a qualitative concept represented by numerical features.
Definition: let U be a quantitative domain represented by exact values and C be a qualitative concept on U. If the quantitative value x is a random realization of the qualitative concept C, the degree of certainty of x with respect to C. μ
x
∈ [0, 1] is a random number with a tendency to be stable.
Then x in the domain of the theory U. The distribution over a cloud is called a cloud and x is a cloud drop.
“Ex” is the mathematical expectation in the theoretical domain. “En” is the entropy, which represents the uncertainty of the qualitative concept, and the entropy En the greater the uncertainty of the expectation, the higher the uertainty of the expectation. “He” is the entropy oentropy, which indicates the uncertainty of entropy, usually reflected in the thickness of the cloud, where the super entropy “He” the greater the entropy, the thicker the cloud. The tee numerical characteristics of the cloud model are shown in Fig. 2.
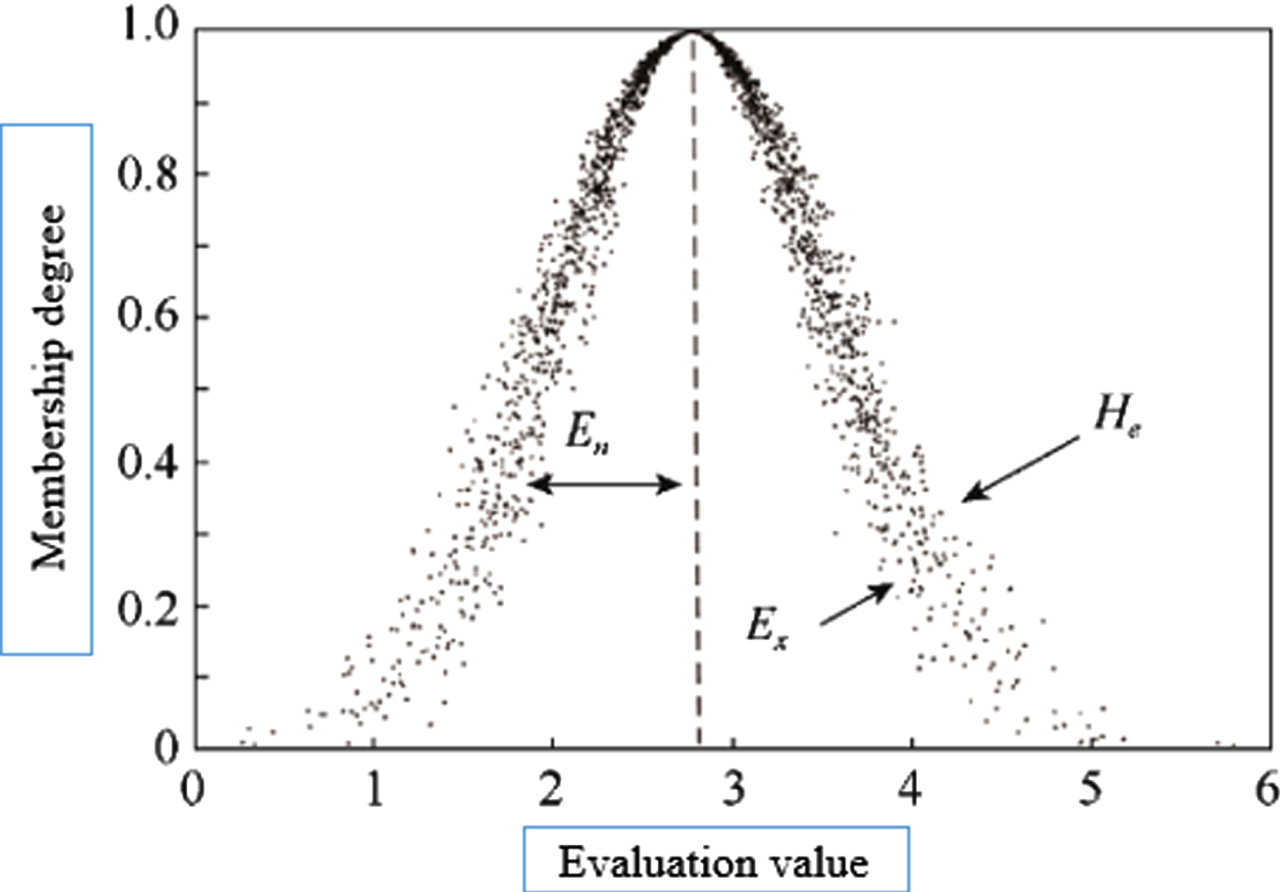
Nmerical characteristics of the cloud model.
The cloud model expectations of the tth team for the sth talent are
The entropy of the cloud model expectation of the tth team for the sth talent is
The hyperentropy of the cloud model expectations of the tth team for the sth talent is
In this paper, we invert the cloud generator by cloud model to transform the decision matrix
Characterizing S-T assessment values with a cloud model
The S-T assessment value is the specific data given by the scientific and technical talent S to the new R&D organization team T based on the S-T assessment index. The language assessment value given by the new R&D organization team in the assessment of the new R&D organization by the S-T talent. Since the language assessment itself also has some uncertainty, the standard cloud of the cloud model is applied to convert the language assessment values into cloud data.
In this paper, we divide the theoretical domain [0,1] into five evaluation levels based on the golden partition method to establish the cloud model scale for S-T language evaluation. Let 0.618 be the multiplier between the cloud model parameters of adjacent levels, and the closer to the central region of the thesis domain [0,1], the smaller the entropy and hyper entropy of the assessment levels. Taking the focus 0.500 of the theoretical domain [0, 1] as the intermediate assessment level, the cloud model parameters of Ex = 0.500, the He = 0.005, with specific values as in Table 3.
Cloud model transformation scales for S-T language evaluation
Cloud model transformation scales for S-T language evaluation
Based on the transformation scale, the S-T expectation decision matrix is obtained
Sce the expected values of cloud data meet the normalization requirements, the initial assessment values do not need to be normalized again. In this paper, the maximum value of the expected value of the initial assessment value is used as the reference point, and the grey correlation coefficient is calculated based on grey correlation analysis to obtain the T-S correlation coefficient matrix
Let the S-T subjective indicator weights be ω4j, the S-T objective indicator weight be ω5j, and the S-T composite indicator weight is ω6j, this paper calculates the objective indicator weights based on the grey correlation coefficient
Introducing subjective-objective weighting parameters δ, the weights of the subjective indicator weights are δ, the weights of the objective indicator weights are 1 - δ, then the combined indicator weights
The matrix of T-S grey correlation coefficients
The cloud model expectations of the sth talent for the tth team are
The entropy of the cloud model expectation of the sth talent for the tth team is
The super entropy of the cloud model expectation of the sth talent for the tth team is
In this paper, we invert the cloud generator by cloud model to transform the decision matrix
Bilateral matching theory
Professor Gale of Brown University and Professor Sharply, a renowned economist, published the paper “College Admissions and Stable Marriages” in 1962, which studied match existence, the Gale-Sharply algorithm, Pareto optimality, and stable matching, and pioneered the theory of bilateral matching decisions. Professor Roth of the University of Pittsburgh introduced the concept of bilateral matching explicitly in 1985.
Let μ : P ∪ Q → Q ∪ P be a one-to-one mapping, if ∀Pi ∈ P, ∀ Qj ∈ Q, satisfies μ (P) i = Qj ∈ Q and μ (Qj) = Pi ∈ P, then we call μ is a two-way matching. μ (Pi) = Qj denotes Pi with Qj in μ is in the match, and μ (Q) j = Qj indicates at Qj in μ does not match.
For real-life bilateral matching decision problems, forming a reasonable and effective bilateral matching solution is a common need for all subjects, and constructing a bilateral matching model and proposing a solution algorithm is the most critical step. The traditional Gale-Sharply algorithm is based on male-optimal (Man-optimal) or woman-optimal (Woman-optimal), and the Hospital-Resident aorithm is based on hospital-optimal (Hospital-optimal) or intern-optimal (Resident-optimal) can only obtain a bilateral matching solution that is satisfactory for some subjects and does not guarantee the fairness of bilateral subjects.
With the development of market economy, the team of new R&D institutions and scientific and technological talents are on an equal footing, and the matched subjects are influenced by individual characteristics, the internal and external environment they are in, desired goals, geographical differences and their own preferences, giving assessments of the other subject that are not necessarily preference-order information, but may be linguistic information, uncertain information, etc.
Combination of cloud models
The different forms of uncertain initial assessment values have been assembled above to obtain two sets of cloud model representations of the assessment values, each with three numerical features. The TS matrix is the assessment value of the new R&D organization team T on the technological talent S. The TS matrix is the assessment value of the technological talent S on the new R&D organization team T. The TS matrix is the assessment value of the technological talent S on the new R&D organization team T. The TS matrix is the assessment value of the new R&D organization team T.
When the cloud data is combined and integrated, all 3 digital features need to be combined and operated as follows.
Expectation is the most important feature among the 3 numerical features of cloud data, and its magnitude determines the final sign of whether the new R&D organization or the scientific and technological talent is satisfied or not. Since there exists a certain degree of importance for the new R&D organization team and the scientific and technological talents, we introduce the importance parameter ρ to indicate the matching dominance of the new R&D organization team. For example, if the new R&D organization team dominates more in the matching than the scientific and technological talents, then ρ > 0.5. If the tech talent dominates more in the match, then ρ < 0.5. If team and talent are equally important, then ρ = 0.5. We follow the dominance parameter ρ by combining the expected value
Based on the cloud integration formula and the team-talent dominance combination formula, we obtain the combined cloud data matrix for both parties’ satisfaction W = [Exts, Ents, Hets].
The combination expectation value Exts is the larger the better. We consider the tth team and the sth talent to be matched if the combination expectation value reaches the maximum. The entropy En of the assessment value represents the uncertainty of the expectation value, and we want the assessment value to be as close to the expectation value as possible, so the smaller the uncertainty the better, then the smaller the entropy En of the combination.
In this paper, we develop a bilateral matching model M-1 based on bilateral matching theory and cloud data matrix W.
The objective of the M-1 model is to transform the bi-objective with maximum expectation and minimum entropy into a single objective. The constraints are: the weight vector πts can only be 0 or 1; each tech talent must be matched to a new R&D organization team, and only 1 team can be matched; each team must be matched to a tech talent, and multiple tech talents can be matched.
According to the optimality existence theorem, any single-objective programming with bounded feasible domain must be optimal over its feasible domain. The model M - 1 is a single-objective programming problem and the feasible domain of the model exists and is bounded, so the M-1 model must have an optimal solution. M - 1 can be solved by LINGGO software, and the solution of πts = 1 means that the tth team of new R&D organization and the sth technological talent are successfully matched.
In this paper, the steps of the bilateral matching method for teams and scientific and technical talents in new R&D institutions based on the grey correlation-cloud model are as follows.
The first step is to establish an indicator system for the two-way assessment of teams and scientific and technological talents in new R&D institutions.
In the second step, two-way assessment data based on the assessment index system are collected and characterized by interval grey numbers for uncertain percentile assessment values of the new R&D organization team to the science and technology talent and cloud model data for uncertain linguistic assessment values of the science and technology talent to the new R&D organization team.
In the third step, the T-S assessment values characterized by interval grey numbers are normalized to find the maximum series, calculate the grey correlation coefficient between the assessment values and the maximum series, and calculate the indicator weights based on the grey correlation coefficient, and convert the grey correlation coefficient into T-S cloud data by the cloud model inverse cloud generator.
In the fourth step, we find the maximum sequence of expected values of S-T assessment values characterized by cloud data, calculate the grey correlation coefficient between expected values and the maximum sequence, and calculate indicator weights based on the grey correlation coefficient, and convert the grey correlation coefficient to S-T cloud data by cloud model inverse cloud generator.
In the fifth step, bilateral matching is performed based on T-S cloud data, S-T cloud data and M-1 model, which is solved by LINGO software to obtain the bilateral matching results of new R&D institutions and scientific and technological talents.
Case studies
Background analysis
The new R&D institution T was established in 2018 by the talent team of NU, the government and social capital, of which the talent team holds 65% of the shares. The new R&D institution T aims at the frontier of science and technology and market demand, and is a concrete initiative to implement General Secretary Xi Jinping’s “three firsts: development is the first priority, talent is the first resource, innovation is the first driving force”, reflecting the organic unity of superior disciplines, innovation clusters and high-quality development. At present, the institution is mainly engaged in the application technology development in the field of sensing and imaging, although some products have not been officially listed, due to the foreseeable huge market prospect, successfully attracted nearly 200 million yuan of venture capital chase. The core team of the institution has always maintained high intensity of new technology breakthroughs and innovations, and is determined to become an industry leader and serve the motherland.
The new R&D institution T, with a new mechanism and system, has gathered high-end talents and has introduced more than 50 talents from home and abroad, and has signed a framework agreement with M Fund with a fund size of 50 million yuan. The government provides 4,000 square meters of land for free. The institution currently has 12 R&D teams, and in various projects, the R&D teams account for up to 70% of the shares. In 2019, the new R&D institution T will focus on promoting the vision of building an ecosystem-platform-technology landmark, and in 2020 the institution will incubate a total of 23 introduced enterprises and apply for a total of 127 intellectual property rights, including 95 invention patents. It is expected that through another 3–5 years, 30 innovation teams will be assembled, 50 high-tech enterprises will be nurtured, and an industrial scale of more than $2 billion will be formed, thus creating a TT industrial innovation center of world influence.
The development of new R&D institutions is inseparable from the development of scientific and technological talents, new R&D institutions have always attached importance to the introduction and cultivation of scientific and technological talents, and many talents have obtained the green card of scientific and technological talents in L region, enjoying the policy dividends of scientific and technological talents. The institution itself has developed a number of talent incentive systems, with clear provisions for the transformation of results and the distribution of income. Local governments and universities have also introduced policies to support the development of new R&D institutions.
New R&D institution T is always looking for scientific and technical talents in the direction of electronic information science and technology, requiring solid theoretical knowledge of molecular electronic information technology, relevant papers published in foreign professional academic journals, familiarity with laboratory-related technical experimental processes, PhD degree, and 1–3 years of relevant work experience. Offering an annual salary of 100,000–1,000,000, working in the Yangtze River Delta, and providing working conditions with 20–50 million RMB of laboratory equipment investment. The new R & D institution T in March this year, four teams proposed a plan to recruit talent, the personnel department after screening, preliminary tests, practice and other links, and finally determined to hire six scientific and technological talent, but will be these six scientific and technological talent to which team, there is a two-way matching problem. According to the two-way assessment index system of team and scientific and technological talents in new R&D institutions proposed in this paper, both teams and talents have completed the assessment, and the data and bilateral matching situation will be presented in detail next.
Analysis of the assessment of scientific and technological talent in new R&D institutions
Collect assessment data and characterize the initial assessment values in terms of interval grey numbers
In this paper, we collected the assessment interval values of six scientific and technological talents based on 10 assessment indicators from teams T1-T4 in the new R&D organization, as shown in Tables 4–9. There are 12 science and technology teams in the new R&D organization T. Four of the teams have similar specialties, and each team sends three experts to assess the science and technology talents under each indicator, and 12 experts from each of the four teams fill in the assessment values under the percentage system, and this paper uses the interval grey number to characterize the assessment values of the new R&D organization teams on science and technology talents, which indicates the uncertainty of the assessment values under this indicator.
Assessed values of new R&D organization teams T1-T4 for scientific and technological talents S1
Assessed values of new R&D organization teams T1-T4 for scientific and technological talents S1
Assessed values of new R&D organization teams T1-T4 for S2 of scientific and technological talents
Assessed values of the new R&D organization team T1-T4 for scientific and technical talents S3
Assessed values of the new R&D organization team T1-T4 for the scientific and technological talent S4
Assessed values of the new R&D organization team T1-T4 for the scientific and technological talent S5
Assessed values of the new R&D organization team T1-T4 for the scientific and technological talent S6
The data in the above table do not reveal the overall situation, the comparison of strengths and weaknesses, and the proposed matching characteristics of the assessment of scientific and technological talents S by the new R&D organization team T. Therefore, certain methods are needed to transform and assemble the data so that the information of the data can reflect the characteristics of the assessment object.
In this paper, based on all the assessed values of the j-th indicator under

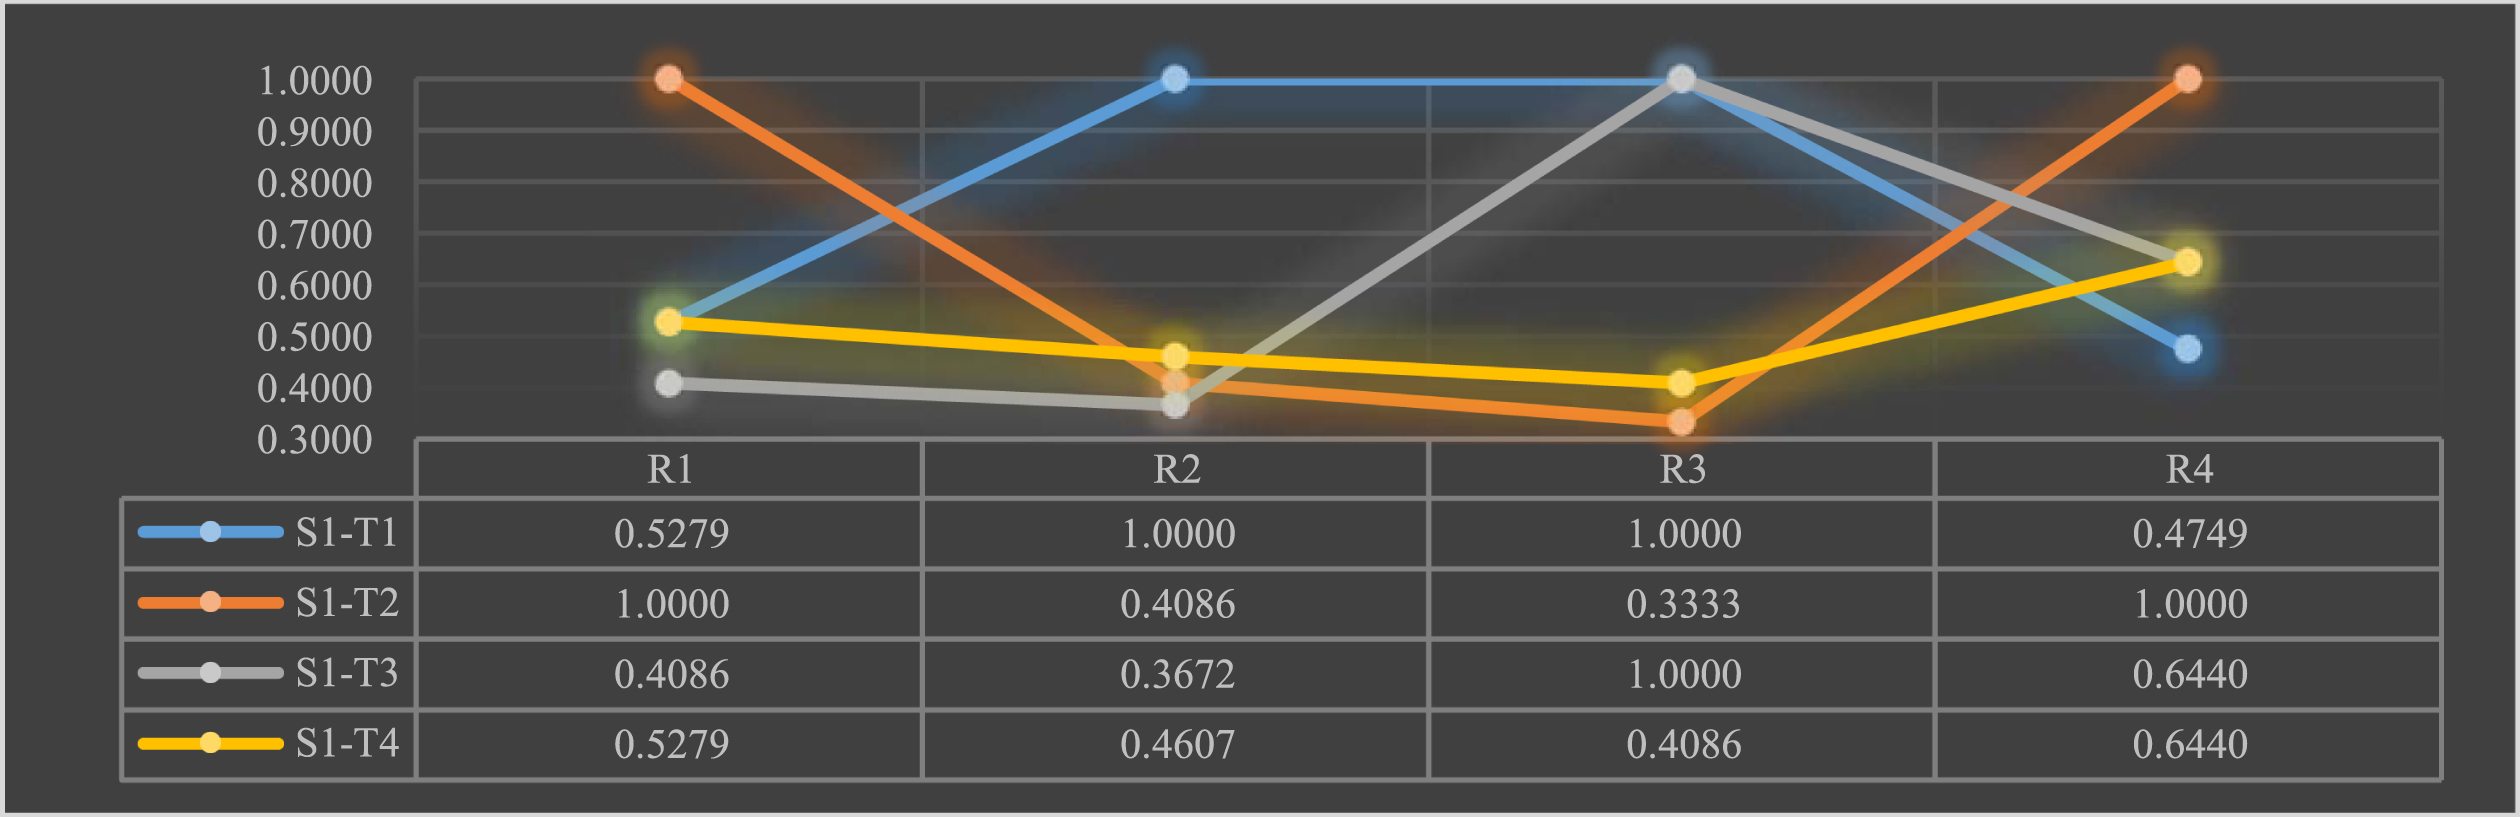
Satisfaction of new R&D organization teams T with scientific and technological talent S1.
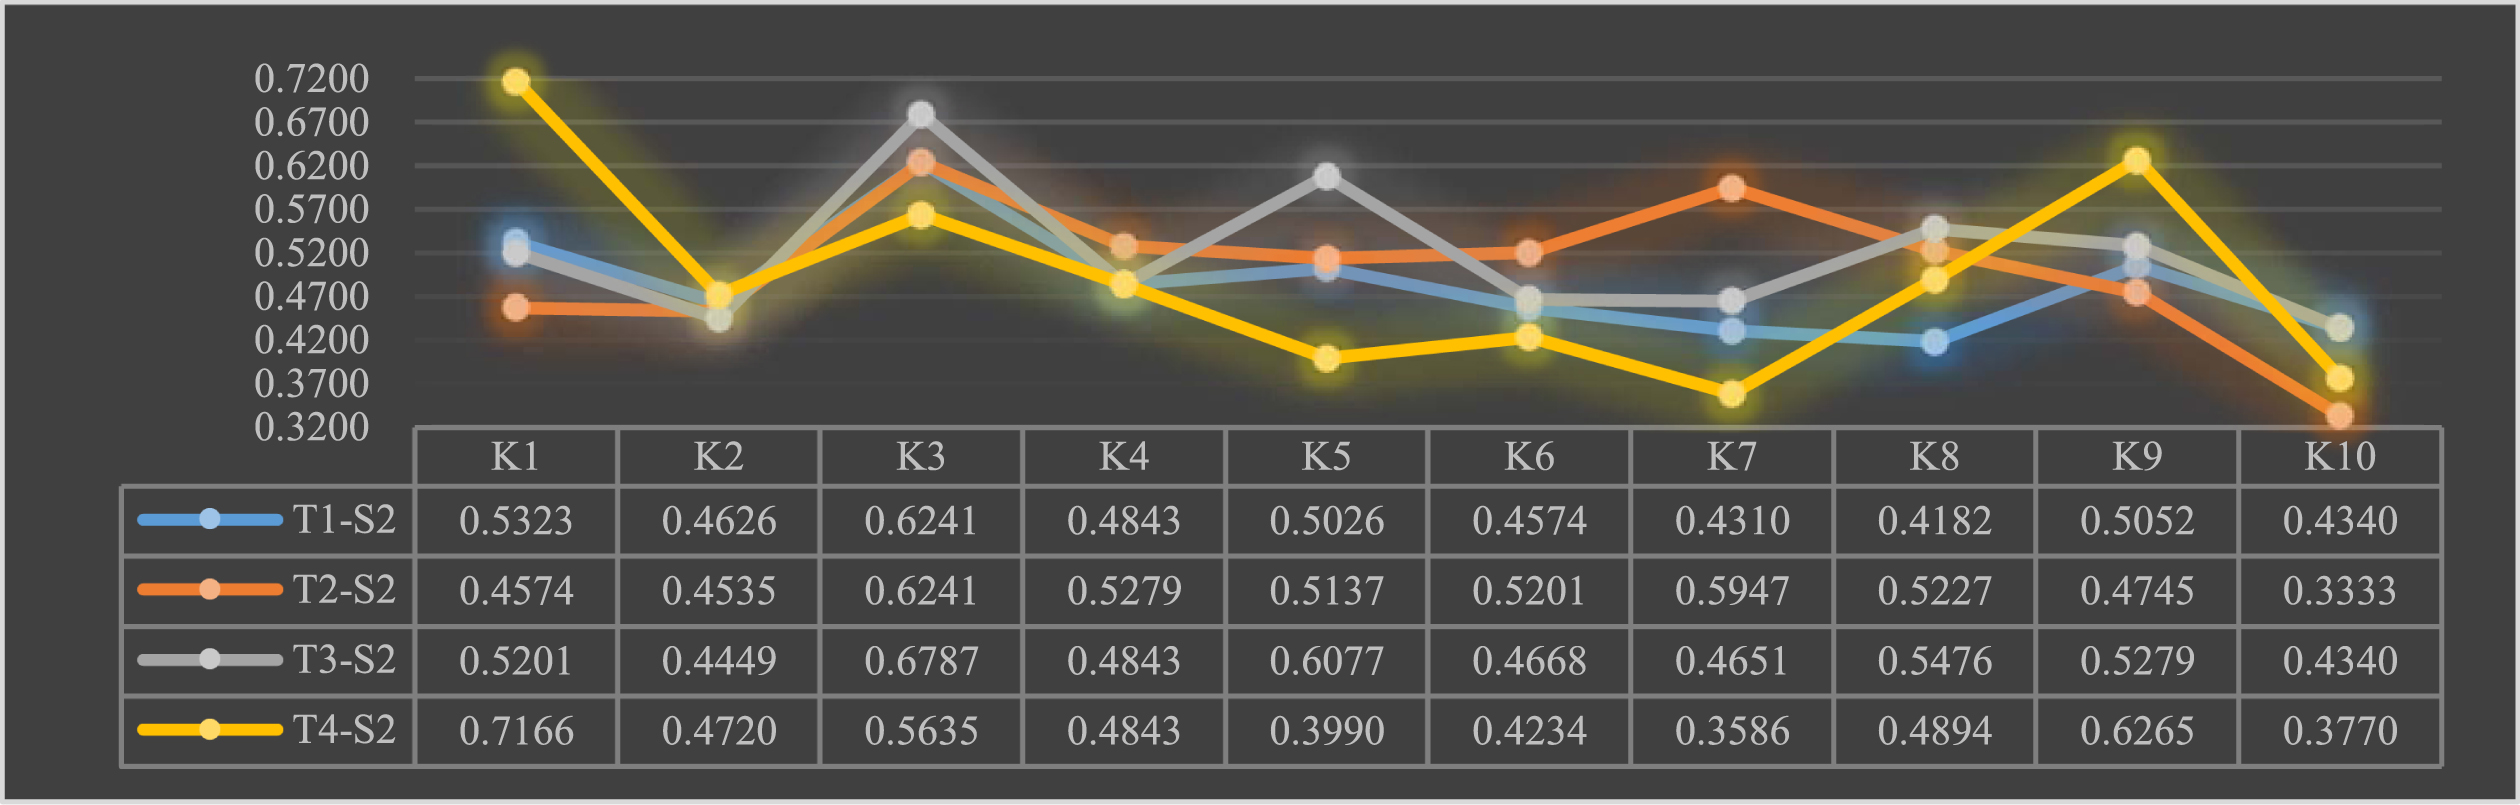
Satisfaction of new R&D organization teams T with scientific and technological talent S2.

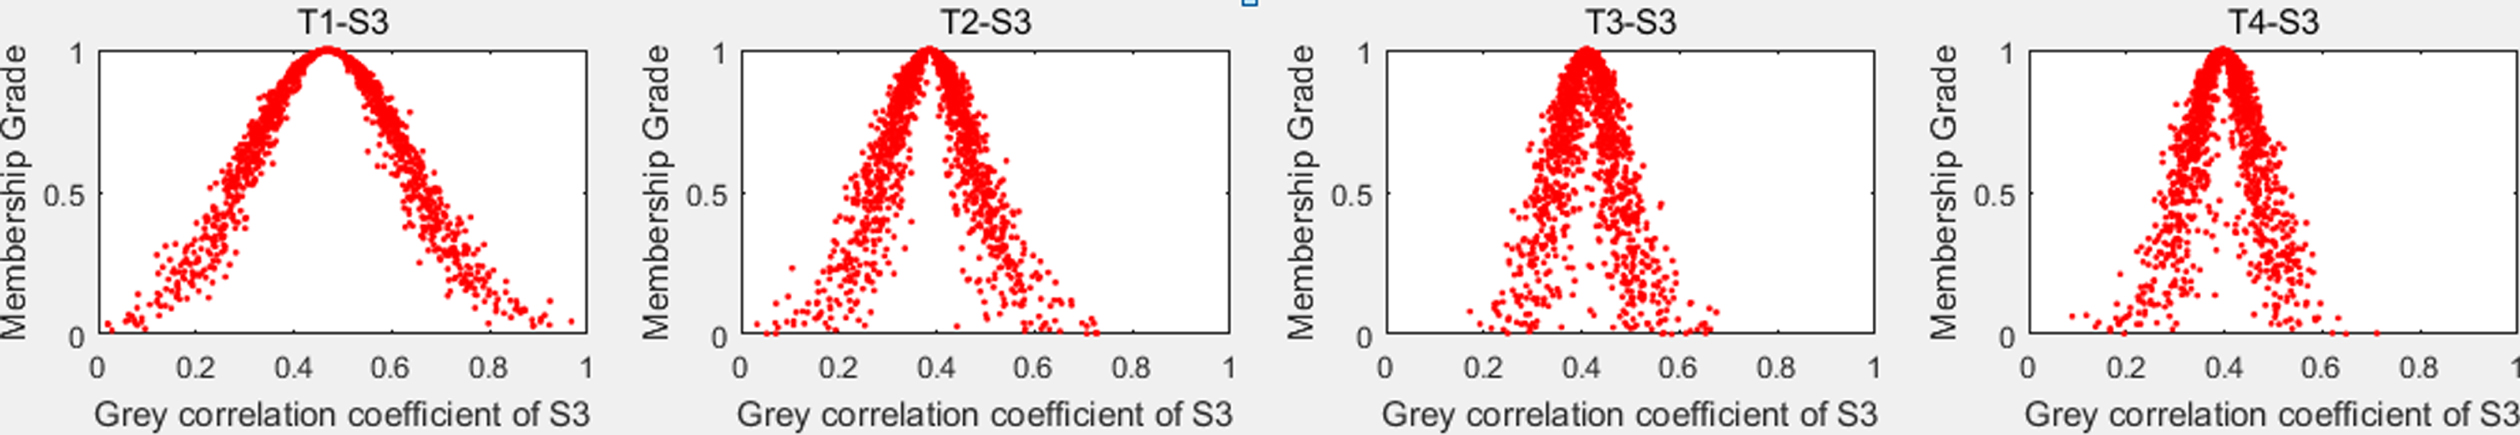
Satisfaction of new R&D organization teams T with scientific and technological talent S3.
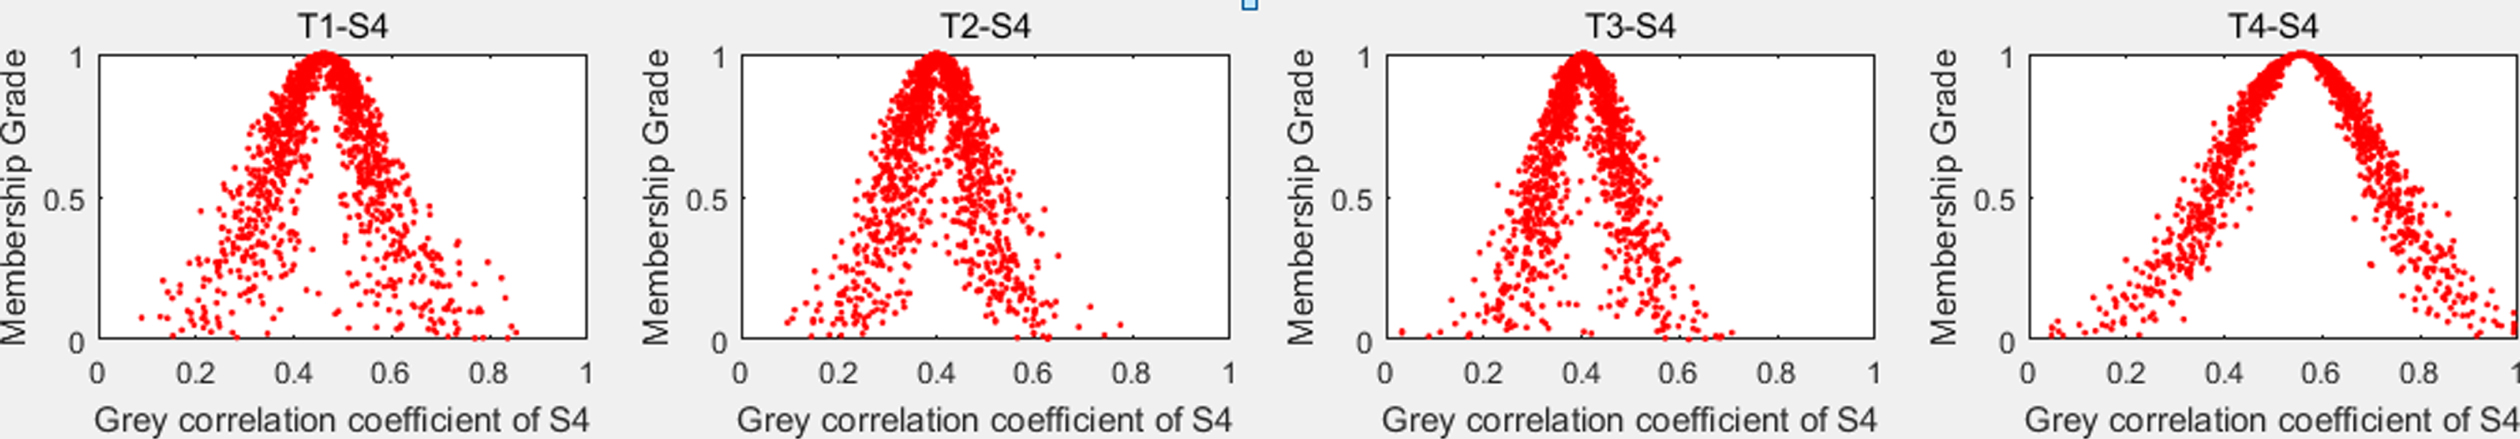
Satisfaction of new R&D organization teams T with scientific and technological talent S4.
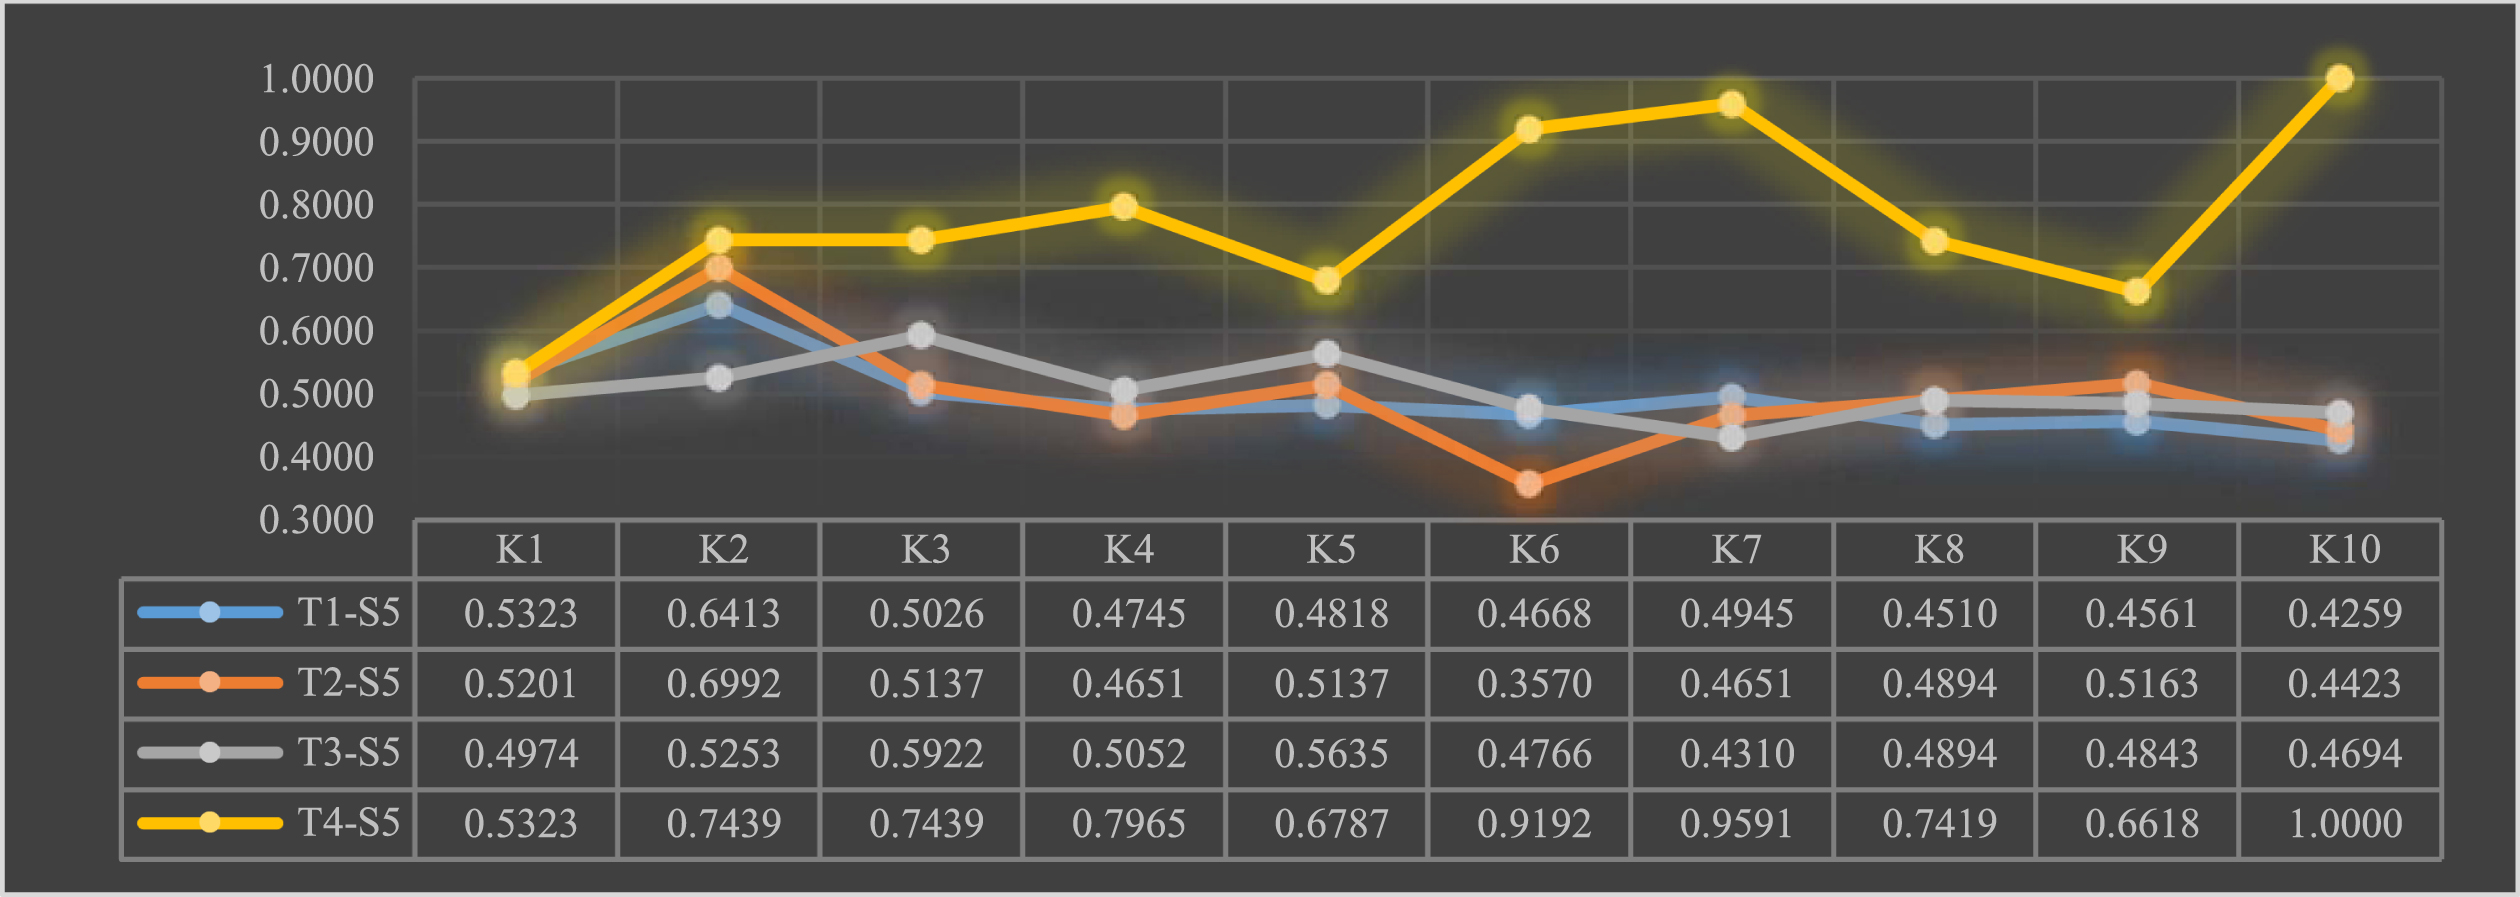
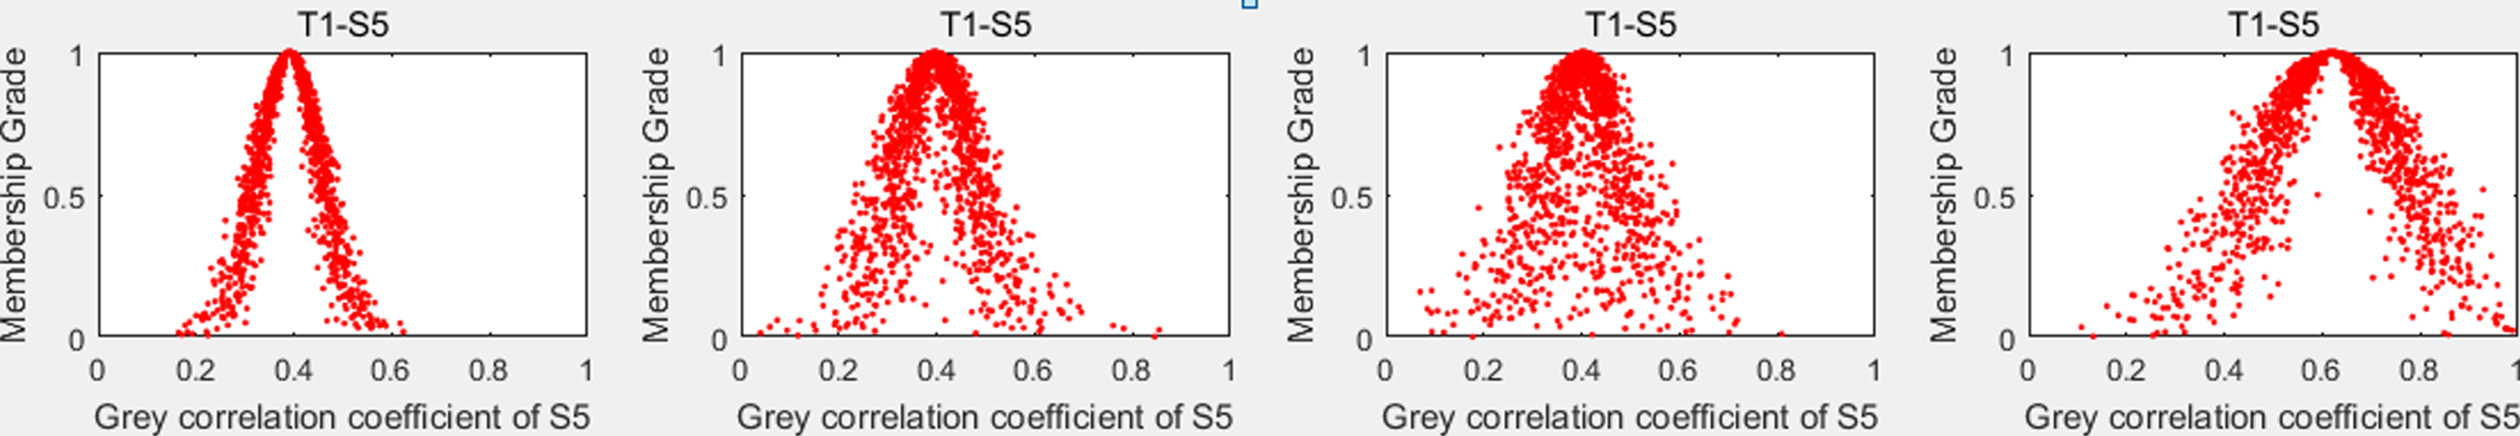
Satisfaction of new R&D organization teams T with scientific and technological talent S5.

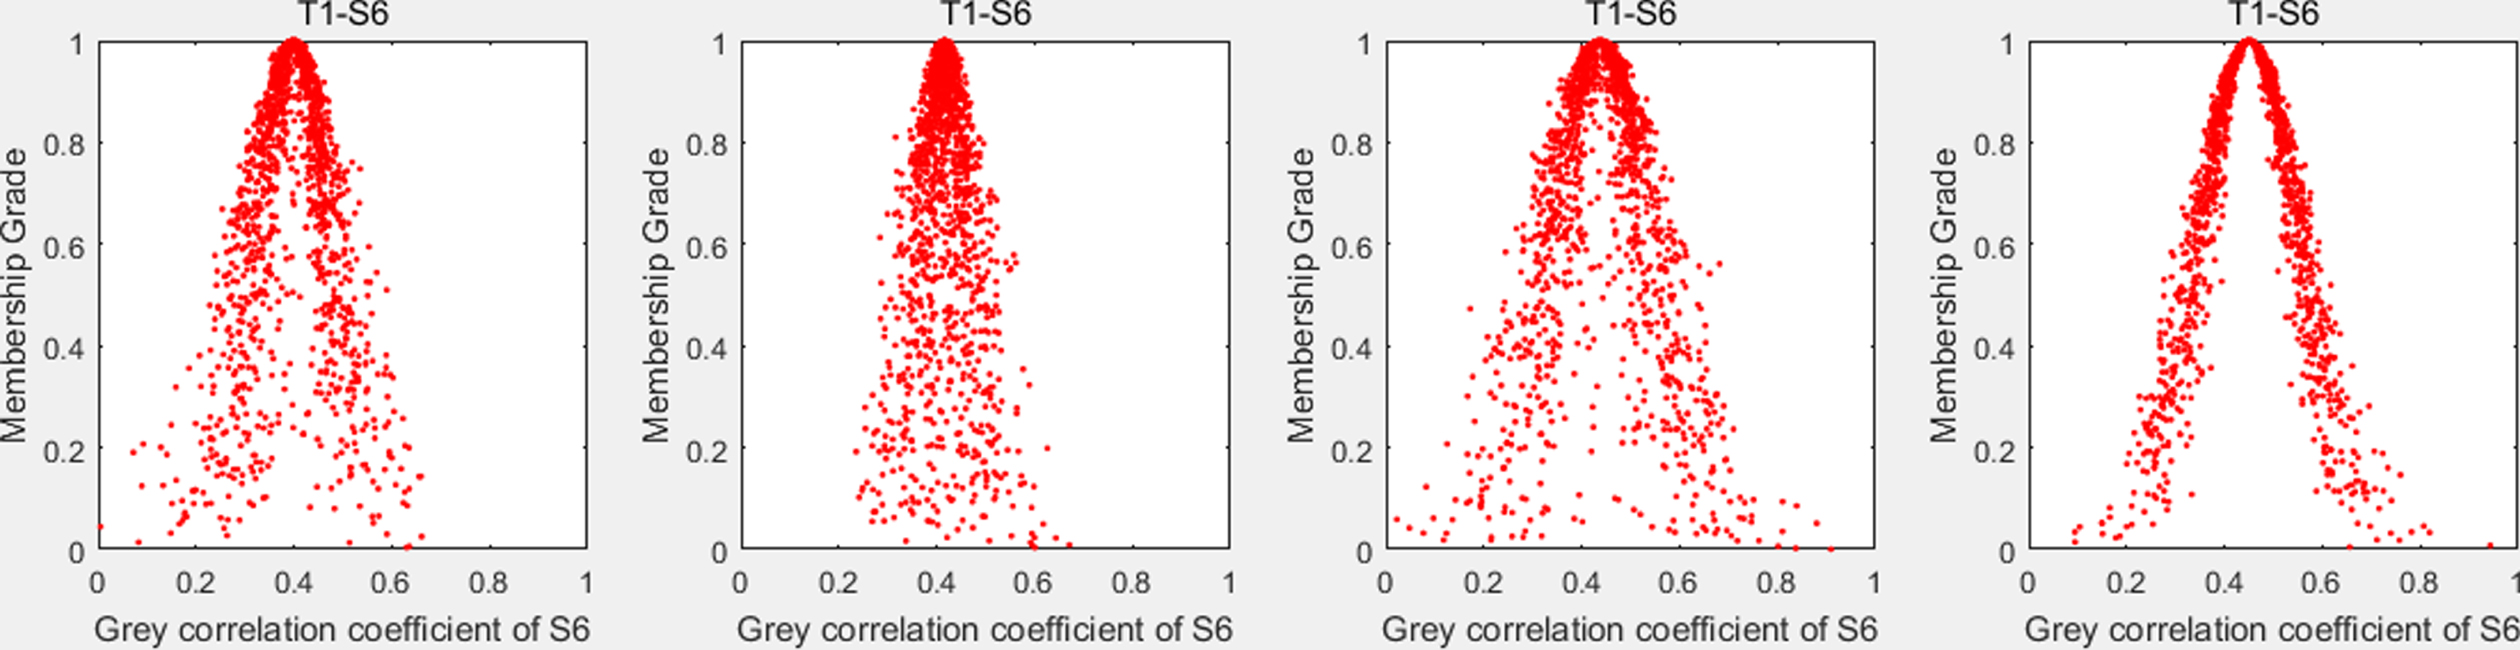
Satisfaction of new R&D organization teams T with scientific and technological talent S6.
As can be seen from the above graph: team T1 rated talent S1 higher on the first 5 indicators and lower on the last 5 indicators; team T2 kept the rating of talent S1 stable and rated higher under the last 2 indicators, considering S1’s technological ability to be stronger; team T3 was more concerned about talent S1 being a graduate of a prestigious university and having strong technological insight; team T4 considered talent S1 to be more self-reliant and self-sufficient.
As can be seen from the above graph: team T1 rated talent S2 low; team T2 focused on talent S2’s innovative achievements and cross-disciplinary background; team T3 thought talent S2 had more innovative achievements and graduated from a prestigious university; team T4 thought talent S2 had a strong will to serve the country and was able to exercise self-control and self-discipline.
As can be seen from the above graph: team T1 thinks that talent S3 has a strong will to serve the motherland, has fruitful innovation results, and values more the fact that it graduated from a prestigious university; team T2 has a low overall rating for talent S2, especially that S2 cannot stand on its own feet; team T3 is concerned about talent S3’s self-awareness and self-confidence to engage in science and technology; team T4 thinks that talent S3 has more scientific and technological cooperation.
As can be seen from the above graph: team T1 perceives talent S4 to be scientifically and technologically knowledgeable and more technologically competent; team T2 has a low overall rating for talent S4; team T3 is concerned that talent S4 also has a low overall rating, particularly perceiving it to be less capable of scientific and technical collaboration; team T4 has a high rating for talent S4, perceiving S4 to be more entrepreneurial and to have a cross-disciplinary background, while being able to exercise self-control and self-discipline.
As can be seen from the above graph: team T1 thinks that talent S5 is self-aware and confident; team T2 also thinks that talent S5 is self-aware and confident, but the ability to cooperate in science and technology needs to be strengthened; team T3 thinks that talent S5 has more innovative achievements and graduated from a prestigious university; team T4 rates talent S5 higher and thinks that S5 has a strong ability to cooperate in science and technology and has a cross-disciplinary background, while being able to be self-sufficient and self-reliant.
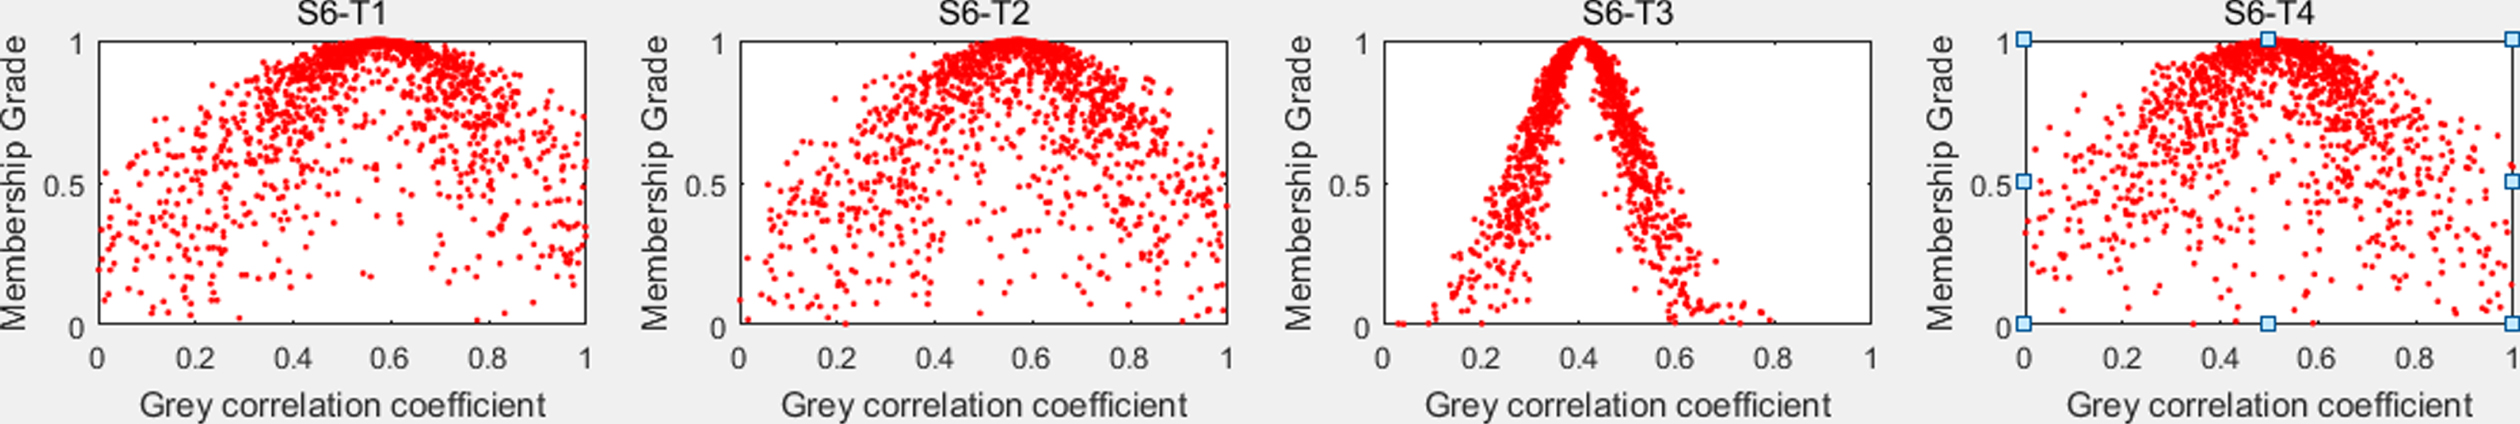
As can be seen from the chart above: team T1 believes that talent S6 has more entrepreneurial achievements and is more self-controlled and self-disciplined; team T2 also believes that talent S6 has more entrepreneurial achievements; team T3 believes that talent S6 has a strong will to serve his country; team T4 believes that talent S6 is self-aware and confident, graduated from a prestigious school and is self-sufficient.
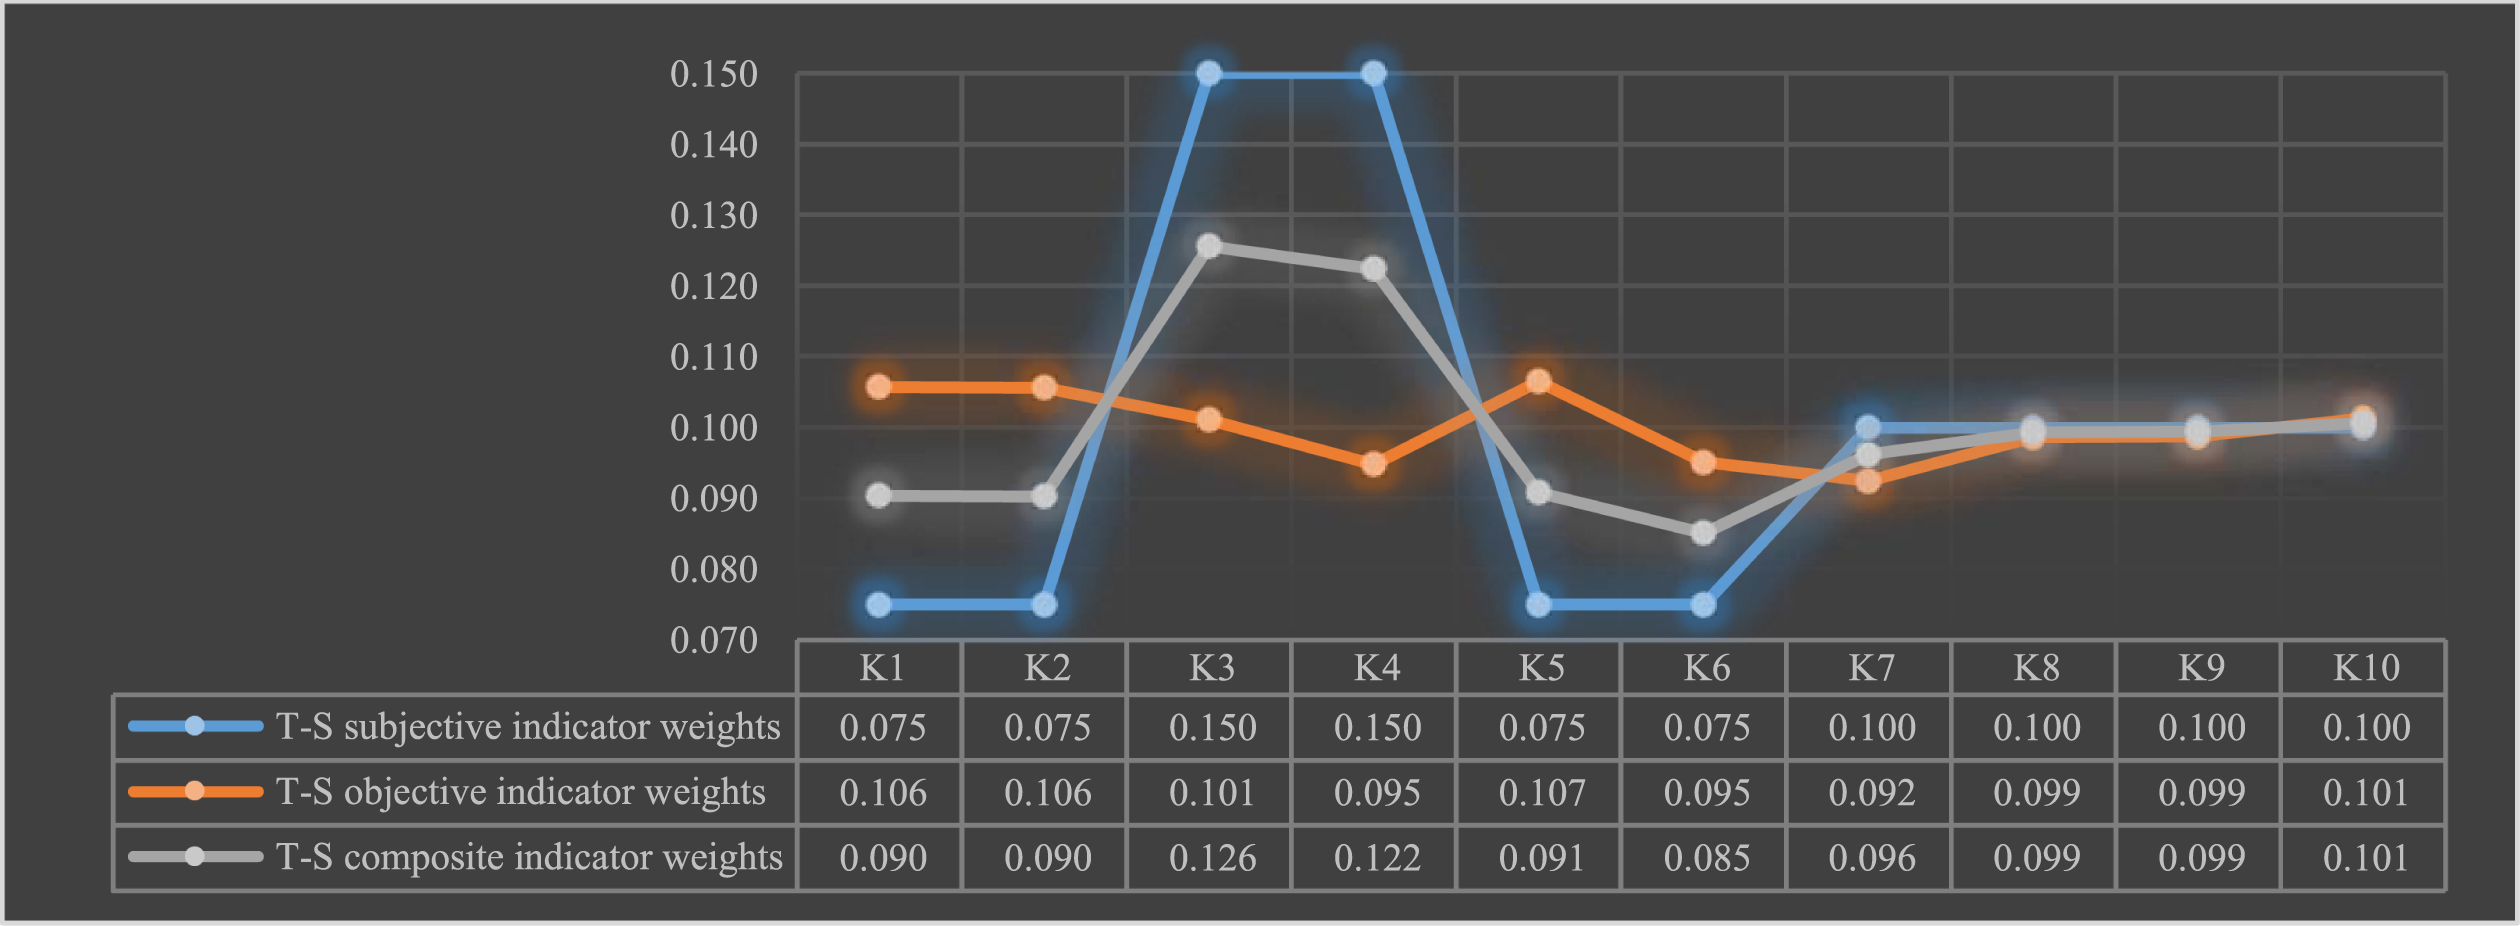
In this paper, 12 experts were consulted to obtain the subjective weights of the indicators ω1j. The objective weights of the indicators are obtained based on the share of the sum of the correlation coefficients ω2j, introduce the parameter adjustment parameter θ = 0.5, the composite indicator weights are obtained ω3j, as shown in Fig. 9.
Subjective-objective-composite indicator weights for team assessment of talent.
From the above Fig., it can be seen that: the T-S subjective weight is more biased towards innovation results and entrepreneurship results, and gives lower weight to serving the motherland, conscious self-confidence, graduation from prestigious schools and scientific and technological cooperation, while the T-S objective weight has little difference and is biased towards serving the motherland, conscious self-confidence, innovation results and graduation from prestigious schools, etc. The T-S combined weight is more reasonable between the subjective and objective weights.
According to the integrated weights, the correlation coefficient based on the weights is calculated and the correlation coefficient matrix under the weights is obtained. According to the 3E cloud model inverse generator operation rules, the cloud data of the new R&D organization team’s assessment of scientific and technological talents are obtained, as shown in Table 10 and Figs. 9–14.
Cloud data for the assessment of S&T talent by the new R&D organization teams T
Cloud data for the assessment of S&T talent by the new R&D organization teams T
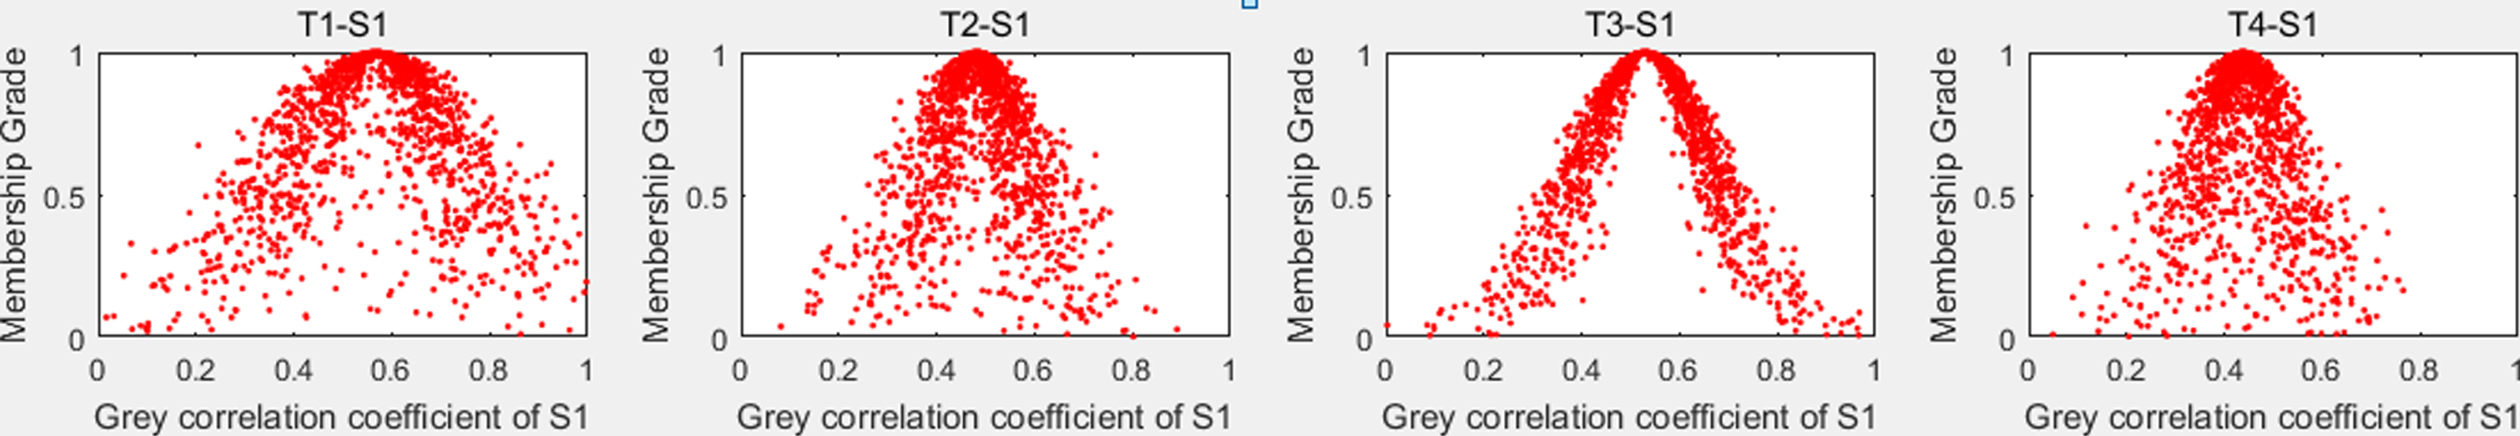
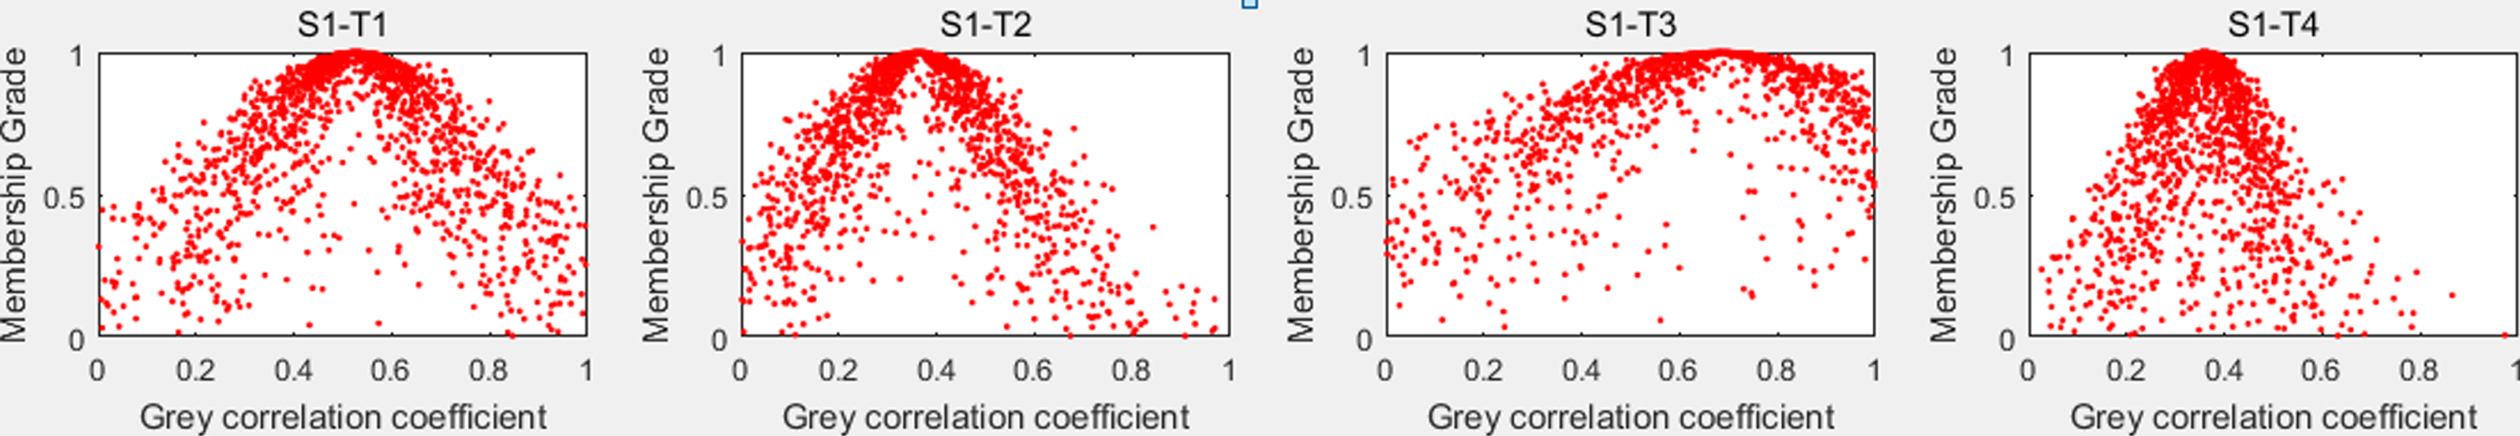
Cloud model diagram for S1 assessment by team T in new R&D organizations.
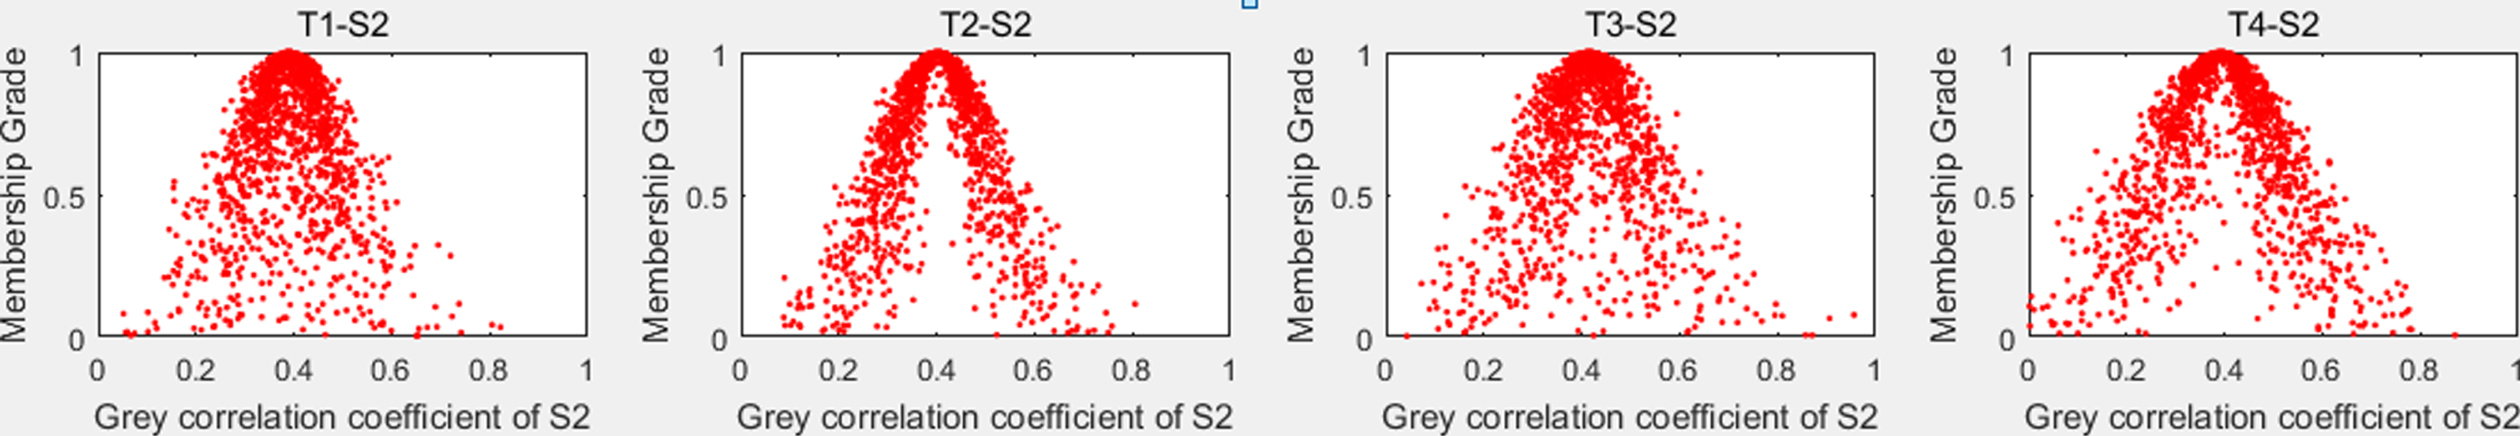
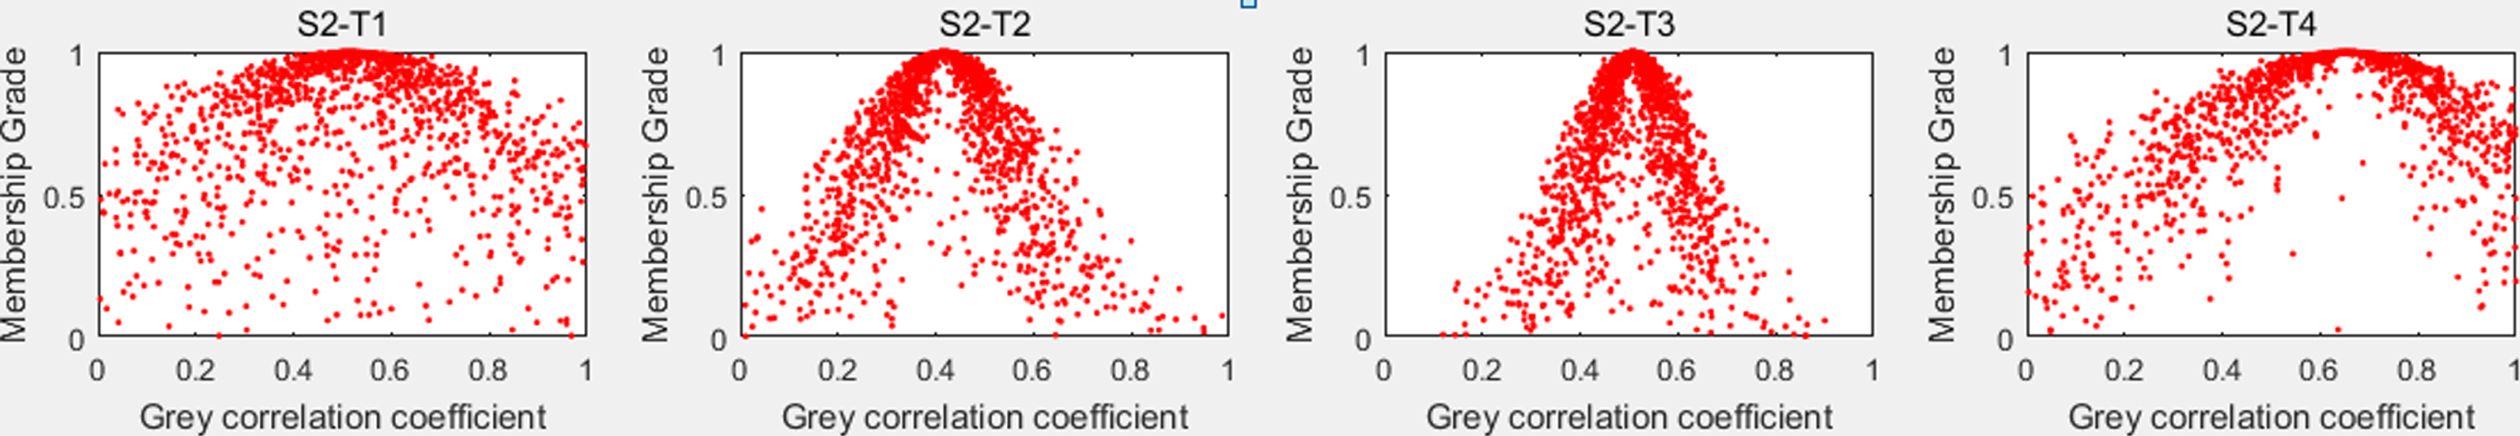
Cloud model diagram for S2 assessment by team T in new R&D organizations.
Cloud model diagram for S3 assessment by team T in new R&D organizations.
Cloud model diagram for S4 assessment by team T in new R&D organizations.
Cloud model diagram for S5 assessment by team T in new R&D organizations.
The cloud data in the table is not intuitive, and in this paper, the weight-based correlation coefficients are input into MATLAB for the simulation of the cloud model, and the cloud model diagram of the assessment of S for scientific and technological talents by the team T of the new R&D organization is obtained, as shown in Figs. 9–15.
Cloud model diagram for S6 assessment by team T in new R&D organizations.
As can be seen from the graph above: teams T1-T4 all have assessment expectations around 0.5 for tech talent S1, and team T3 has a higher degree of cohesive cloud-drop hugging.
As can be seen from the above graph: team T1-T4 all have less than 0.5 assessment expectations for tech talent S2, and team T2 has a higher degree of cloud-drop cohesive hugging.
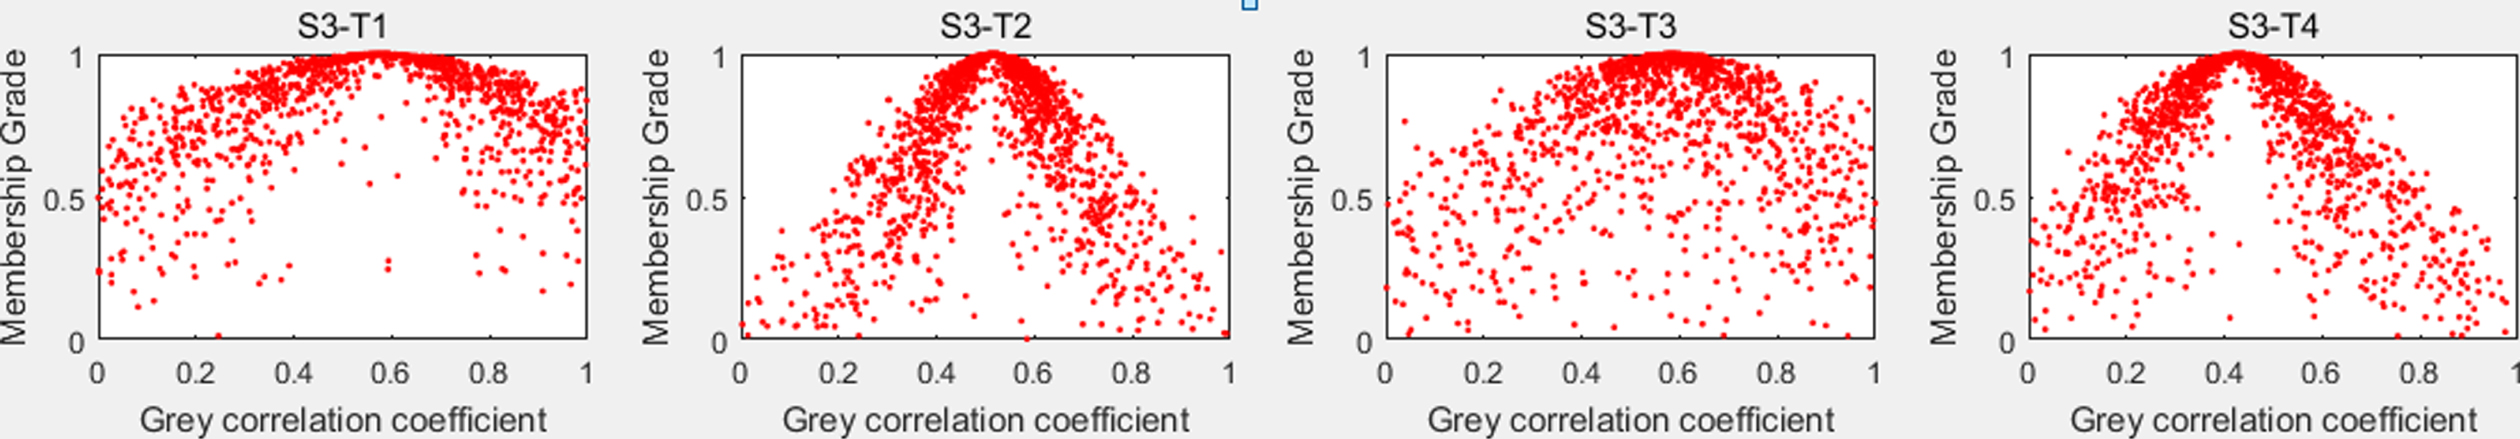
As can be seen from the above graph: teams T1-T4 all have assessment expectations around 0.4 for tech talent S3, with team T1 having a higher level of assessment cloud drops cohesive hugging.
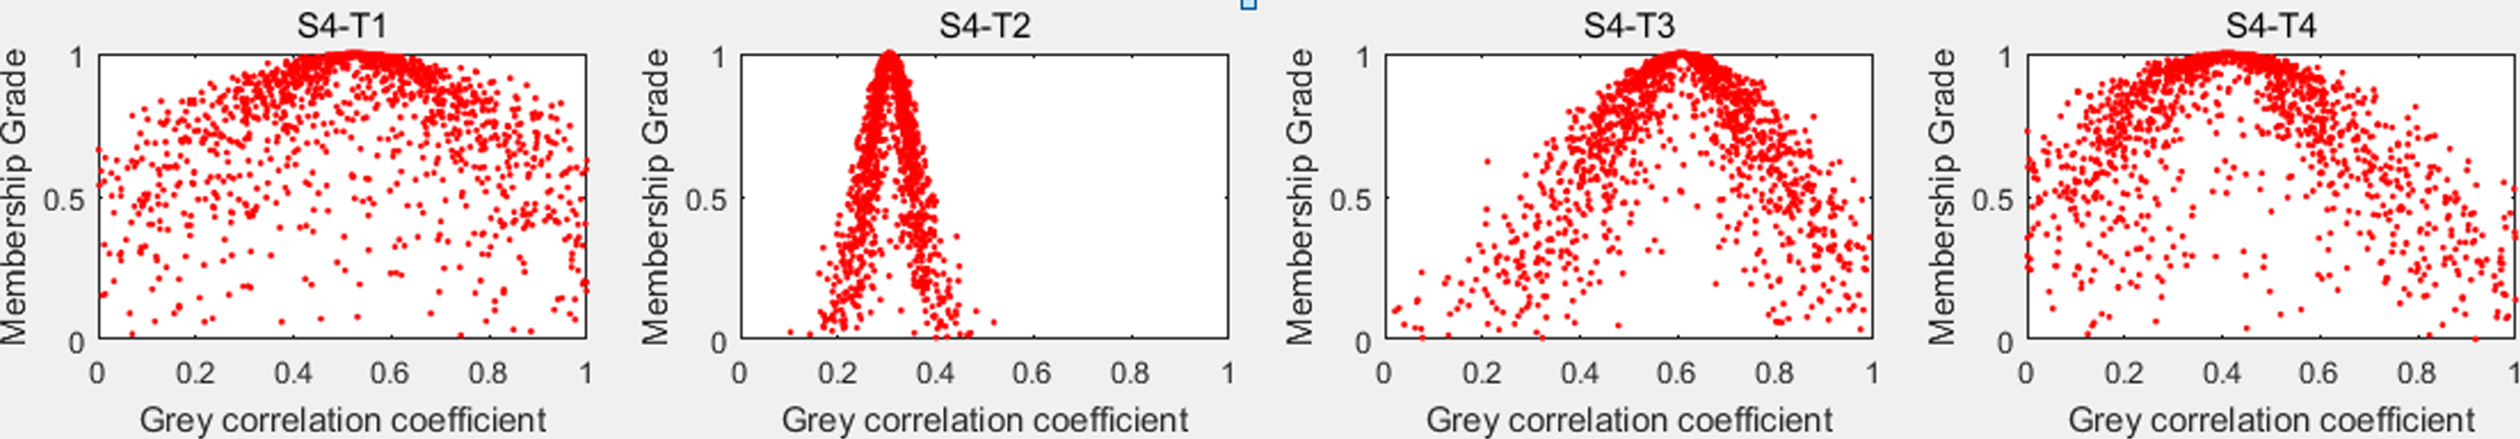
As can be seen from the above graph: none of the team T1-T3’s assessment expectations for tech talent S4 exceed 0.5, team T4’s assessment expectations for tech talent S3 exceed 0.5, and team T4’s assessment cloud drops a higher degree of cohesive hugging.
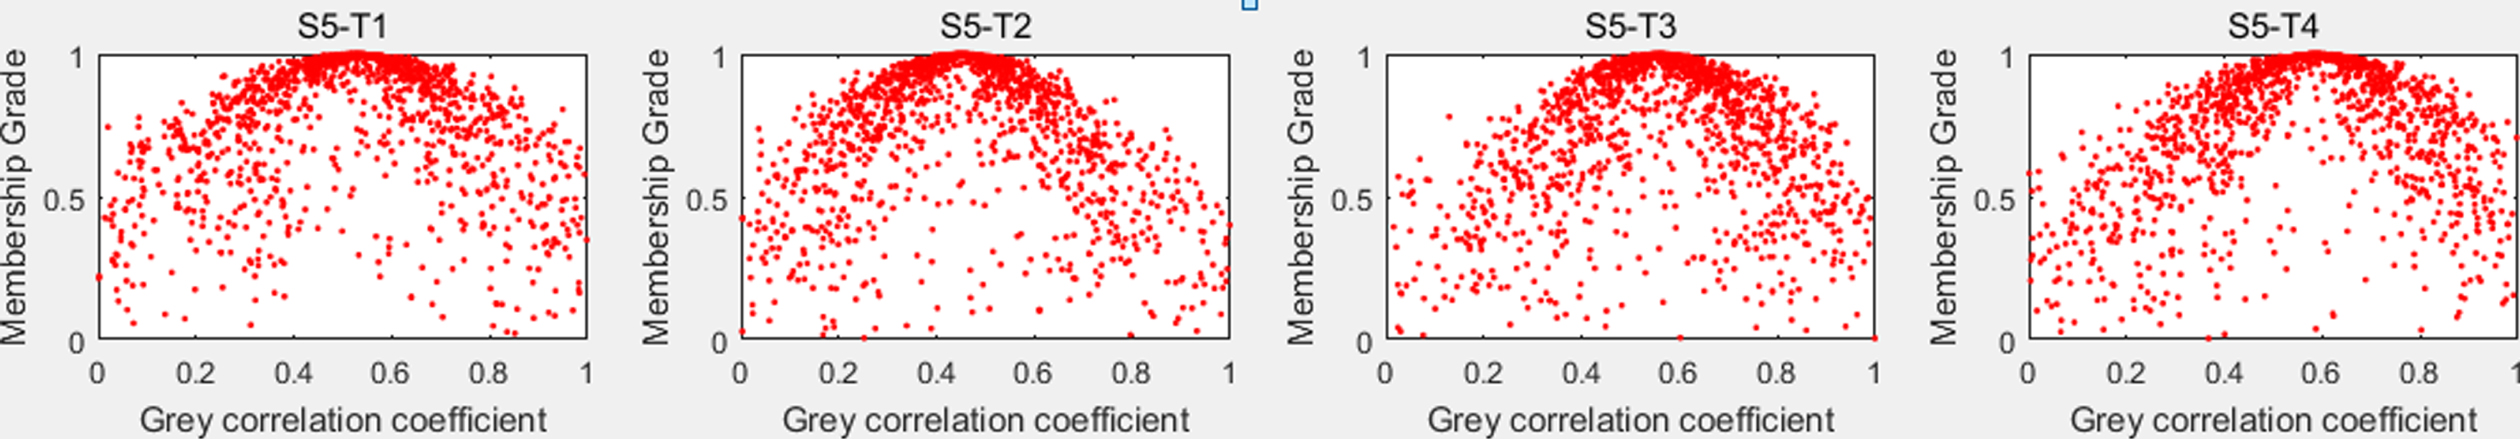
As can be seen from the above graph: team T1-T3 all have assessment expectations around 0.4 for tech talent S5, team T4 has assessment expectations over 0.5 for tech talent S3, and team T1 has a higher level of assessment cloud drops cohesive hugging.
As can be seen from the above graph: the assessment expectations of Team T1-T4 for S5 of tech talent are all around 0.4, and Team T4 has a higher level of cohesive cloud drops hugging.
Collect assessment data and characterize the initial assessment values in the form of a standard cloud
In this paper, a questionnaire was sent out to the scientific and technical talents who participated in the matching team, and the scientific and technical talents were asked to check the measures under the assessment index directly on the questionnaire, which were divided into 5 levels (Very poor, Poor, Fair, Good and Excellent). In the process of returning the questionnaire, it was found that some scientific and technological talents did not limit the results to the 5 levels of measures, for example, S1 checked “poor” and “Fair”, and the assessment value of talent S1 was considered to be between “poor” and “Fair”. This paper considers that the assessment value of talent S1 is between “poor” and “Fair”, so the middle value is taken, which is simple to deal with, and the middle value is more representative, taking into account the two assessment measures. The assessment of scientific and technological talents S on the new R&D organization team T is shown in Tables 11–16.
Assessed values of scientific and technical talent S1 on the new R&D organization teams T1-T4
Assessed values of scientific and technical talent S1 on the new R&D organization teams T1-T4
Assessed values of scientific and technical talent S2 on the new R&D organization teams T1-T4
Assessed values of scientific and technical talent S3 on the new R&D organization teams T1-T4
Assessed values of scientific and technical talent S4 on the new R&D organization teams T1-T4
Assessed values of scientific and technical talent S5 on the new R&D organization teams T1-T4
Assessed values of scientific and technical talent S6 on the new R&D organization teams T1-T4
The language assessment values from Tables 11–16 were found according to the standard cloud to find the expectation values, as shown in Table 17.
Assessment values of talents S1-S6 on the new R&D organization teams T1-T4
The data in the above table do not reveal the overall situation, the comparison of strengths and weaknesses, and the proposed matching characteristics of the assessment of the new R&D organization team T by the scientific and technological talent S. Therefore, certain methods are needed to transform and assemble the data so that the information of the data can reflect the characteristics of the assessment object.
This paper calculates the correlation coefficient of each assessment value with the maximum assessment sequence based on the grey correlation analysis formula, the larger the correlation coefficient, the higher the satisfaction of the scientific and technological talents S with the new R&D organization team T in this index. The correlation coefficient of S-T is shown in Figs. 16–21.
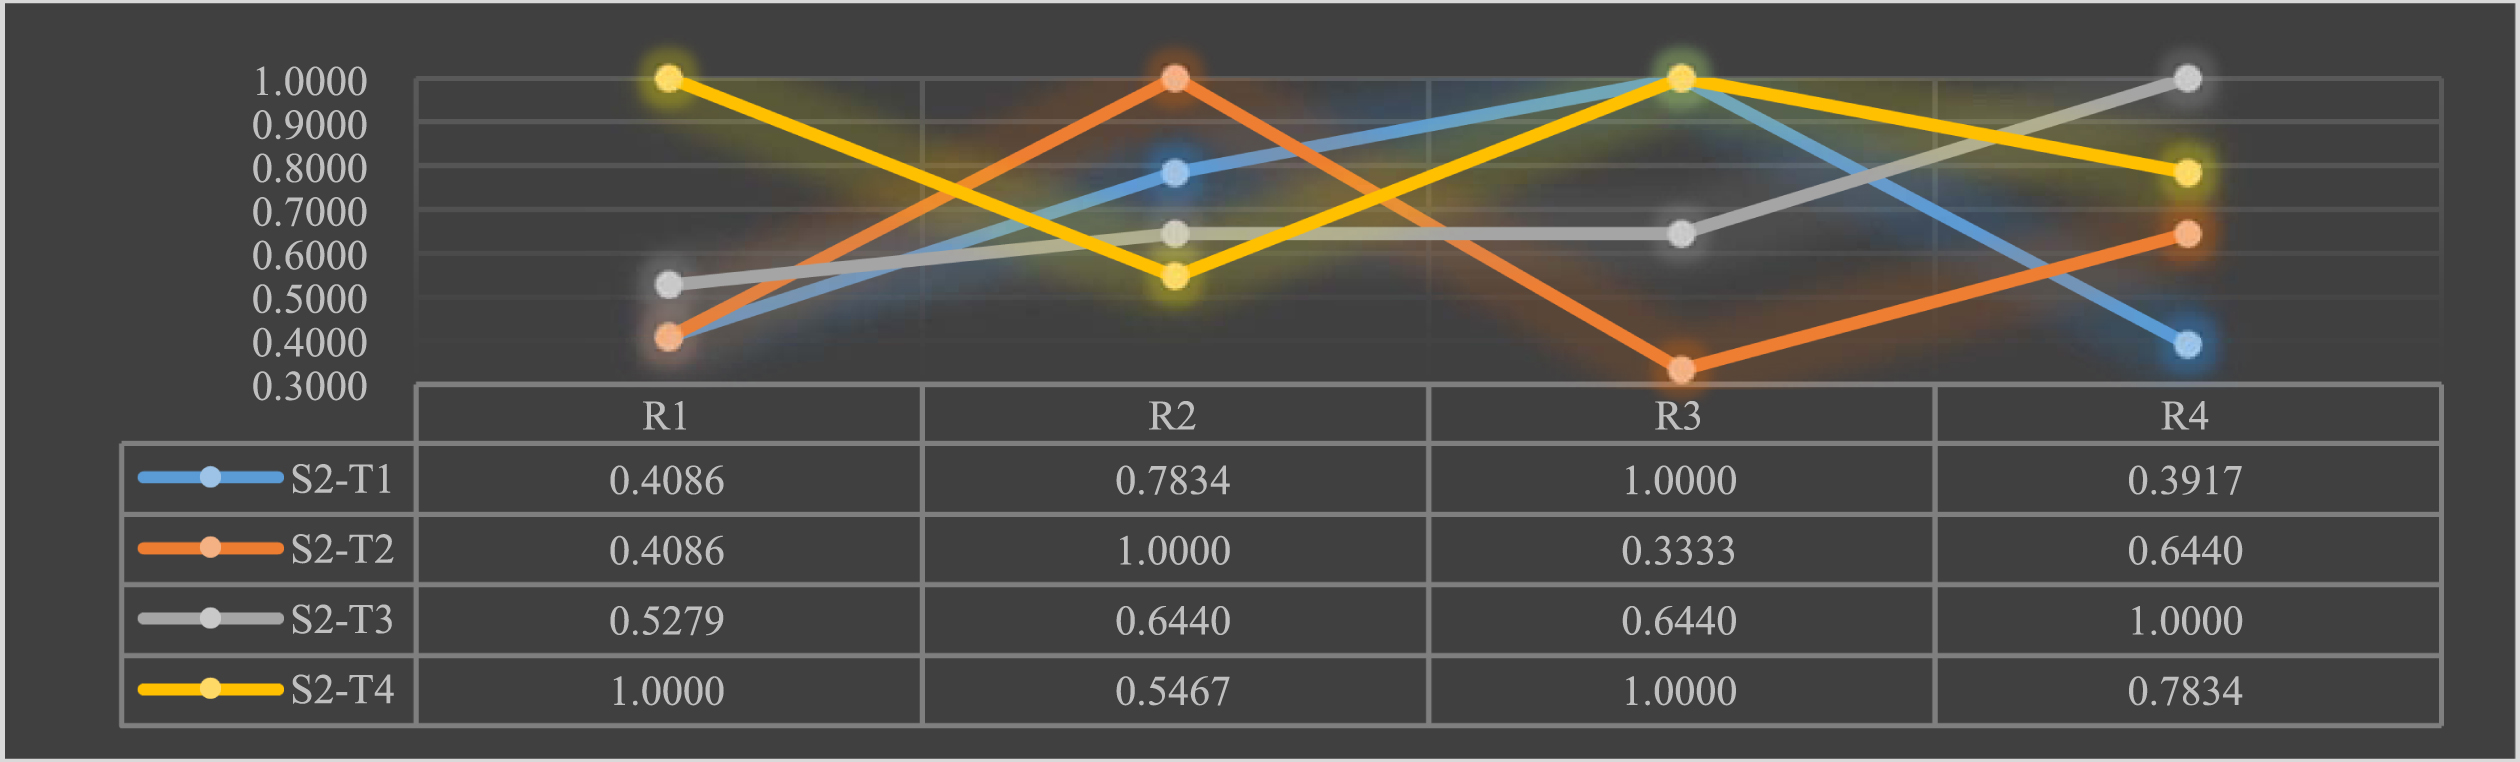
Satisfaction of scientific and technological talents S1 with the new R&D organization teams T.
Satisfaction of scientific and technological talents S2 with the new R&D organization teams T.

Satisfaction of scientific and technological talents S3 with the new R&D organization teams T.
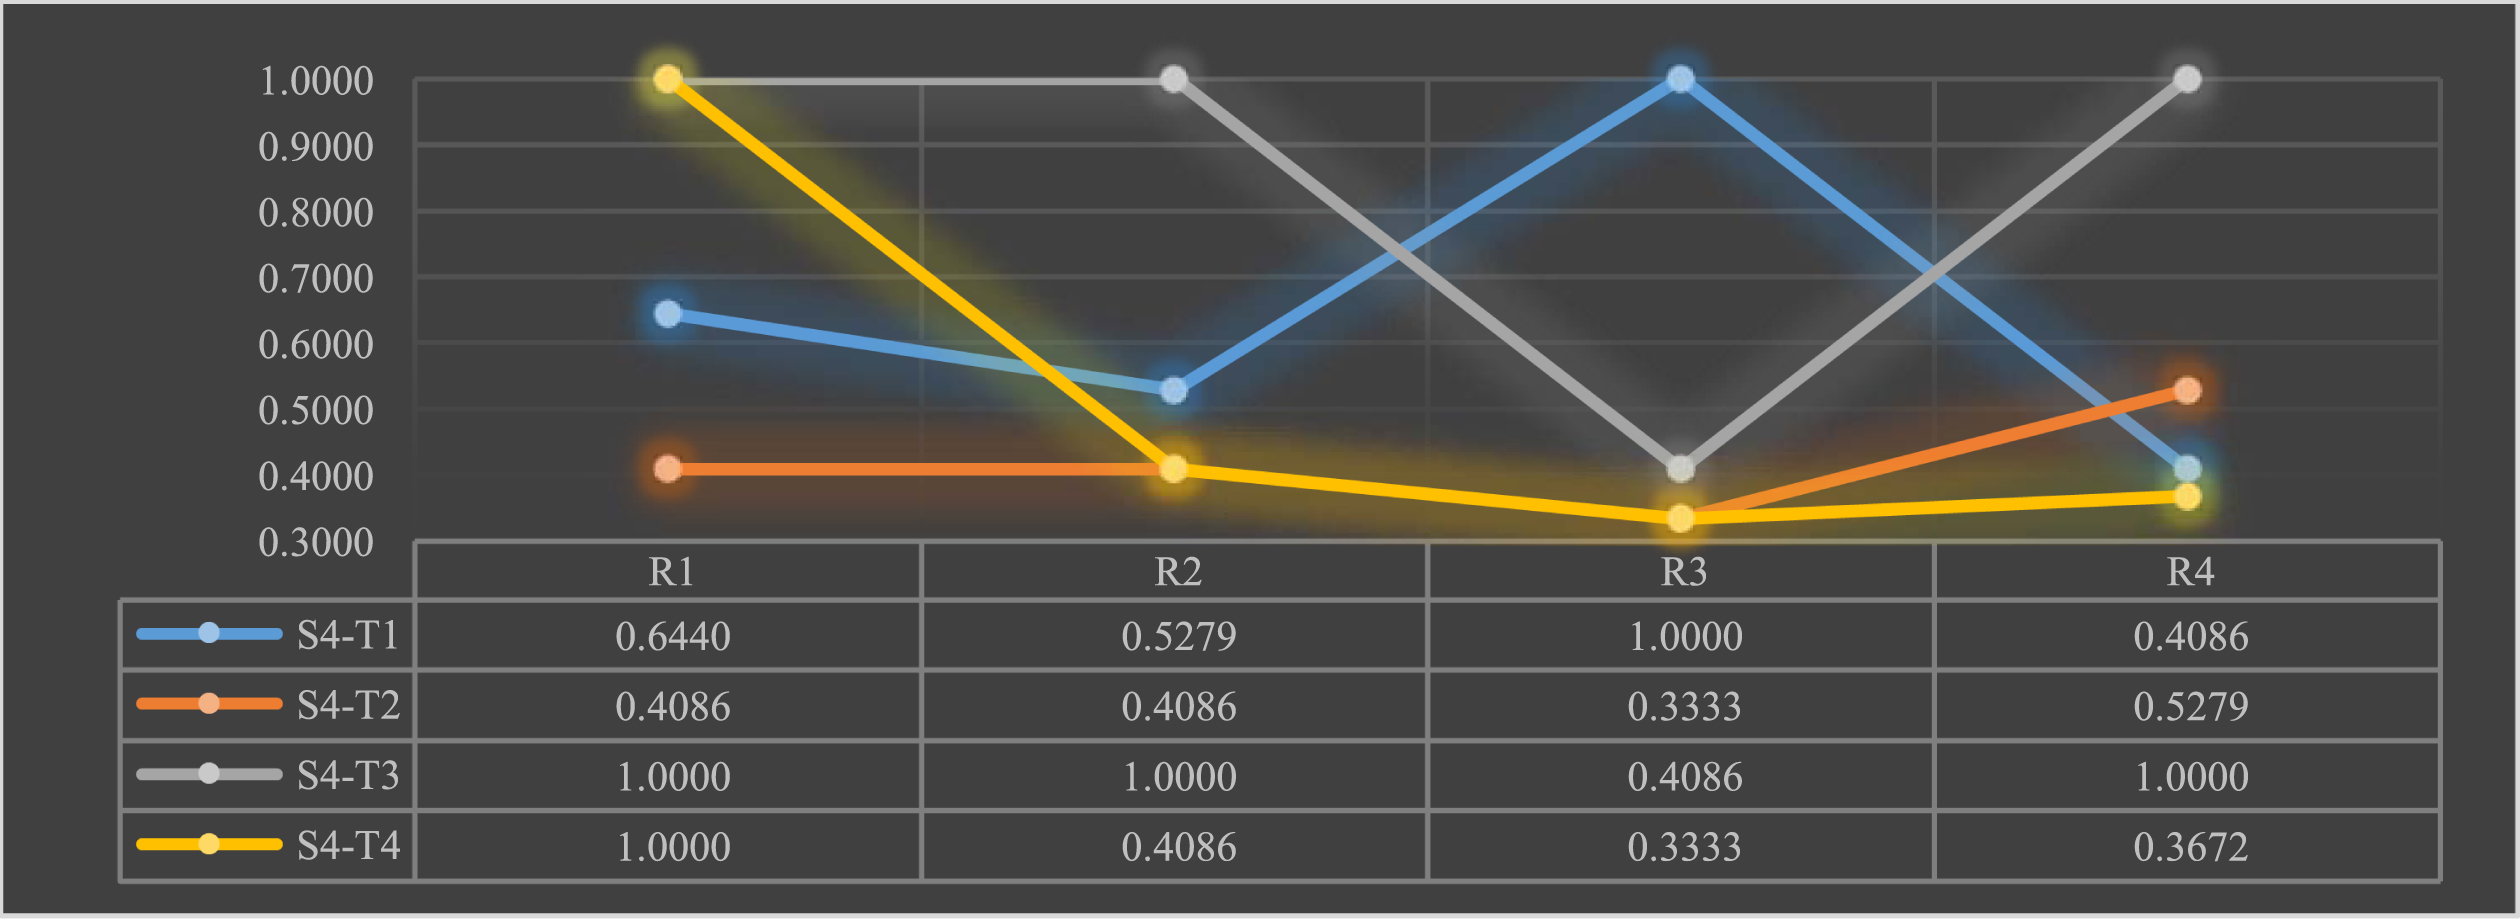
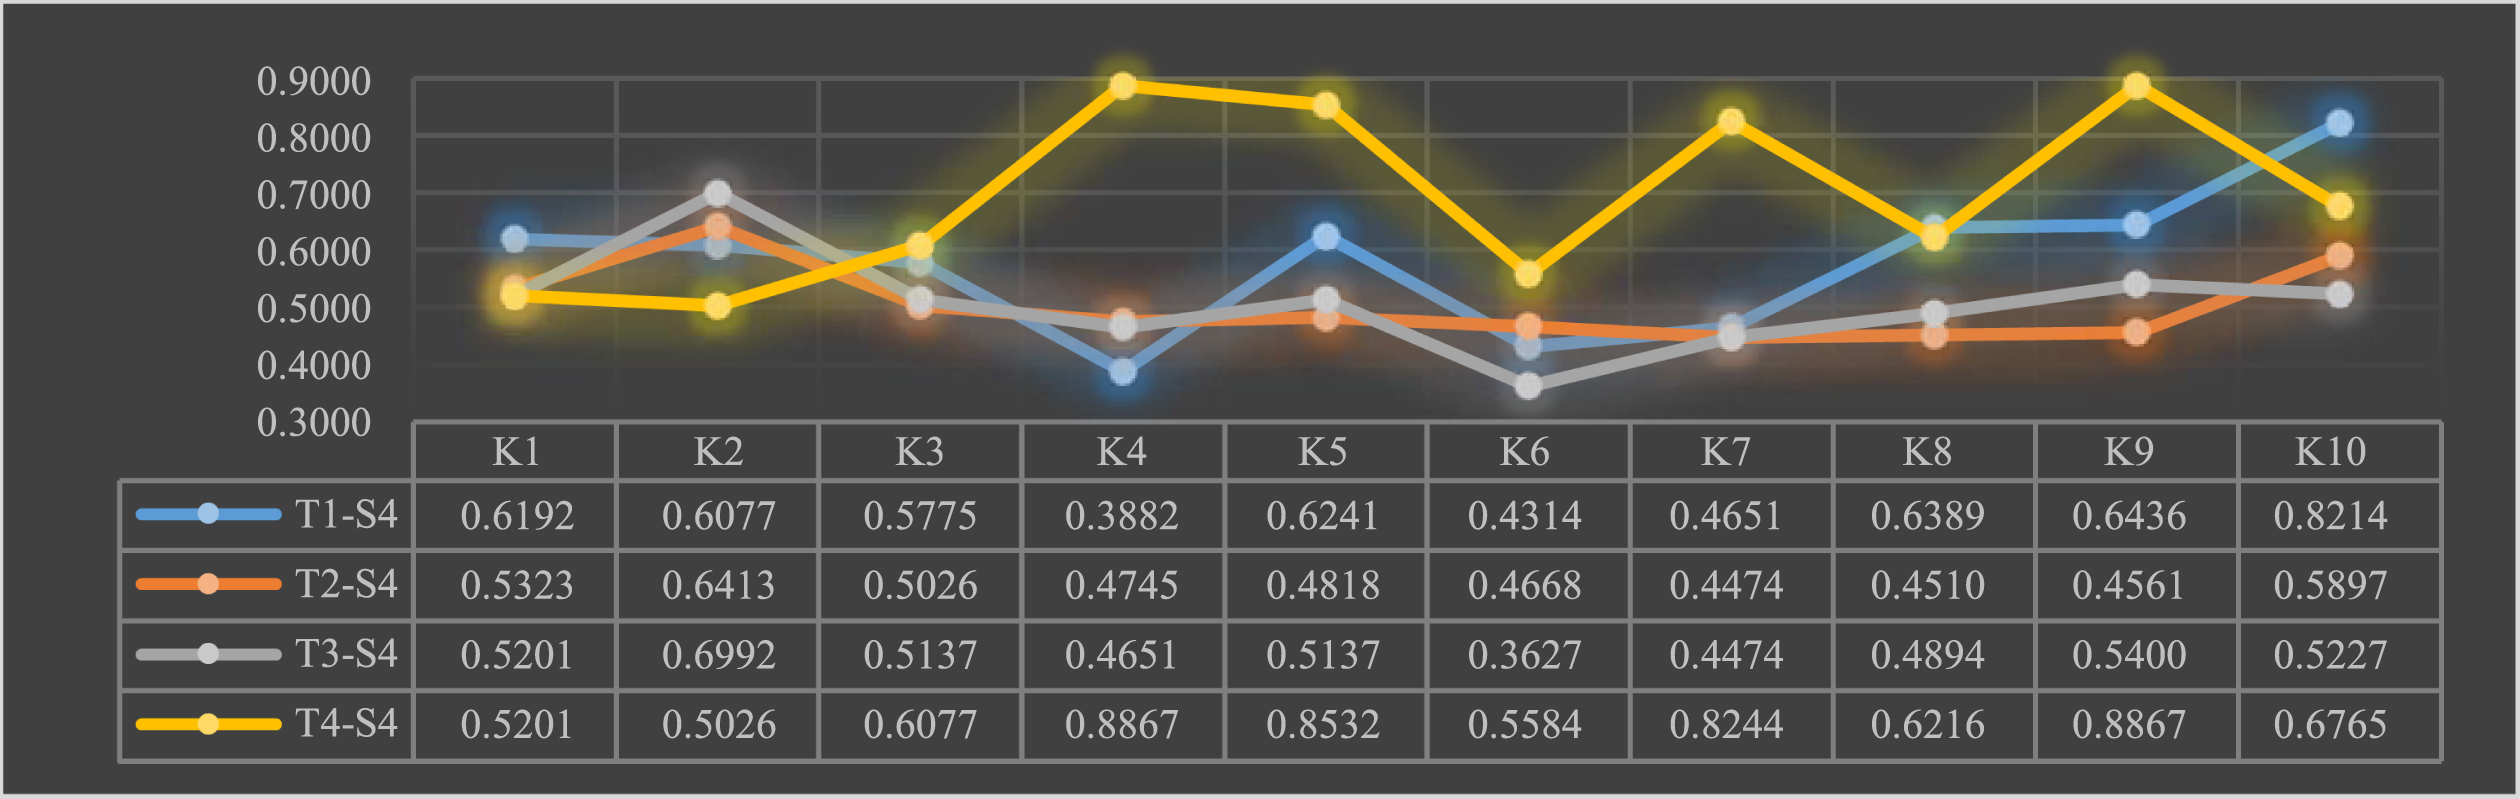
Satisfaction of scientific and technological talents S4 with the new R&D organization teams T.
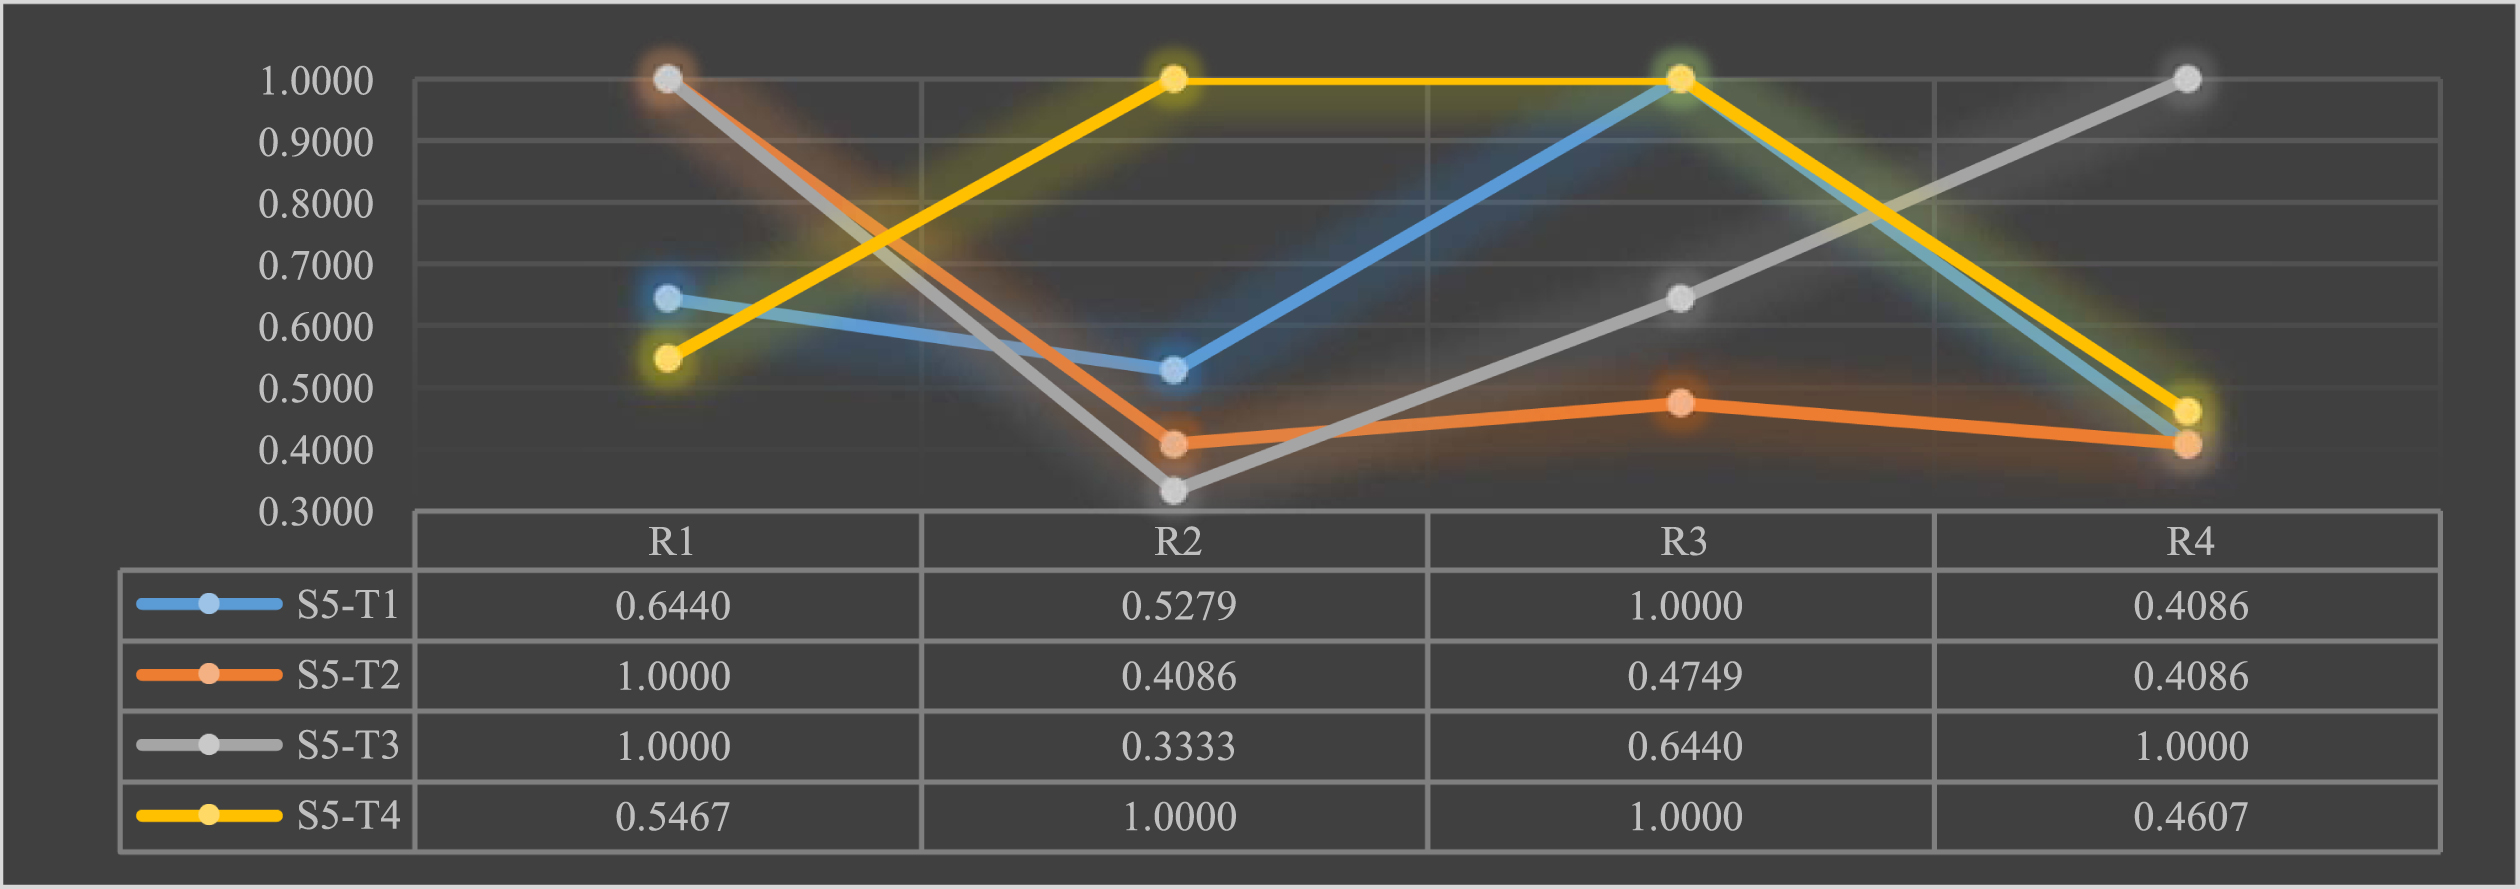
Satisfaction of scientific and technological talents S5 with the new R&D organization teams T.
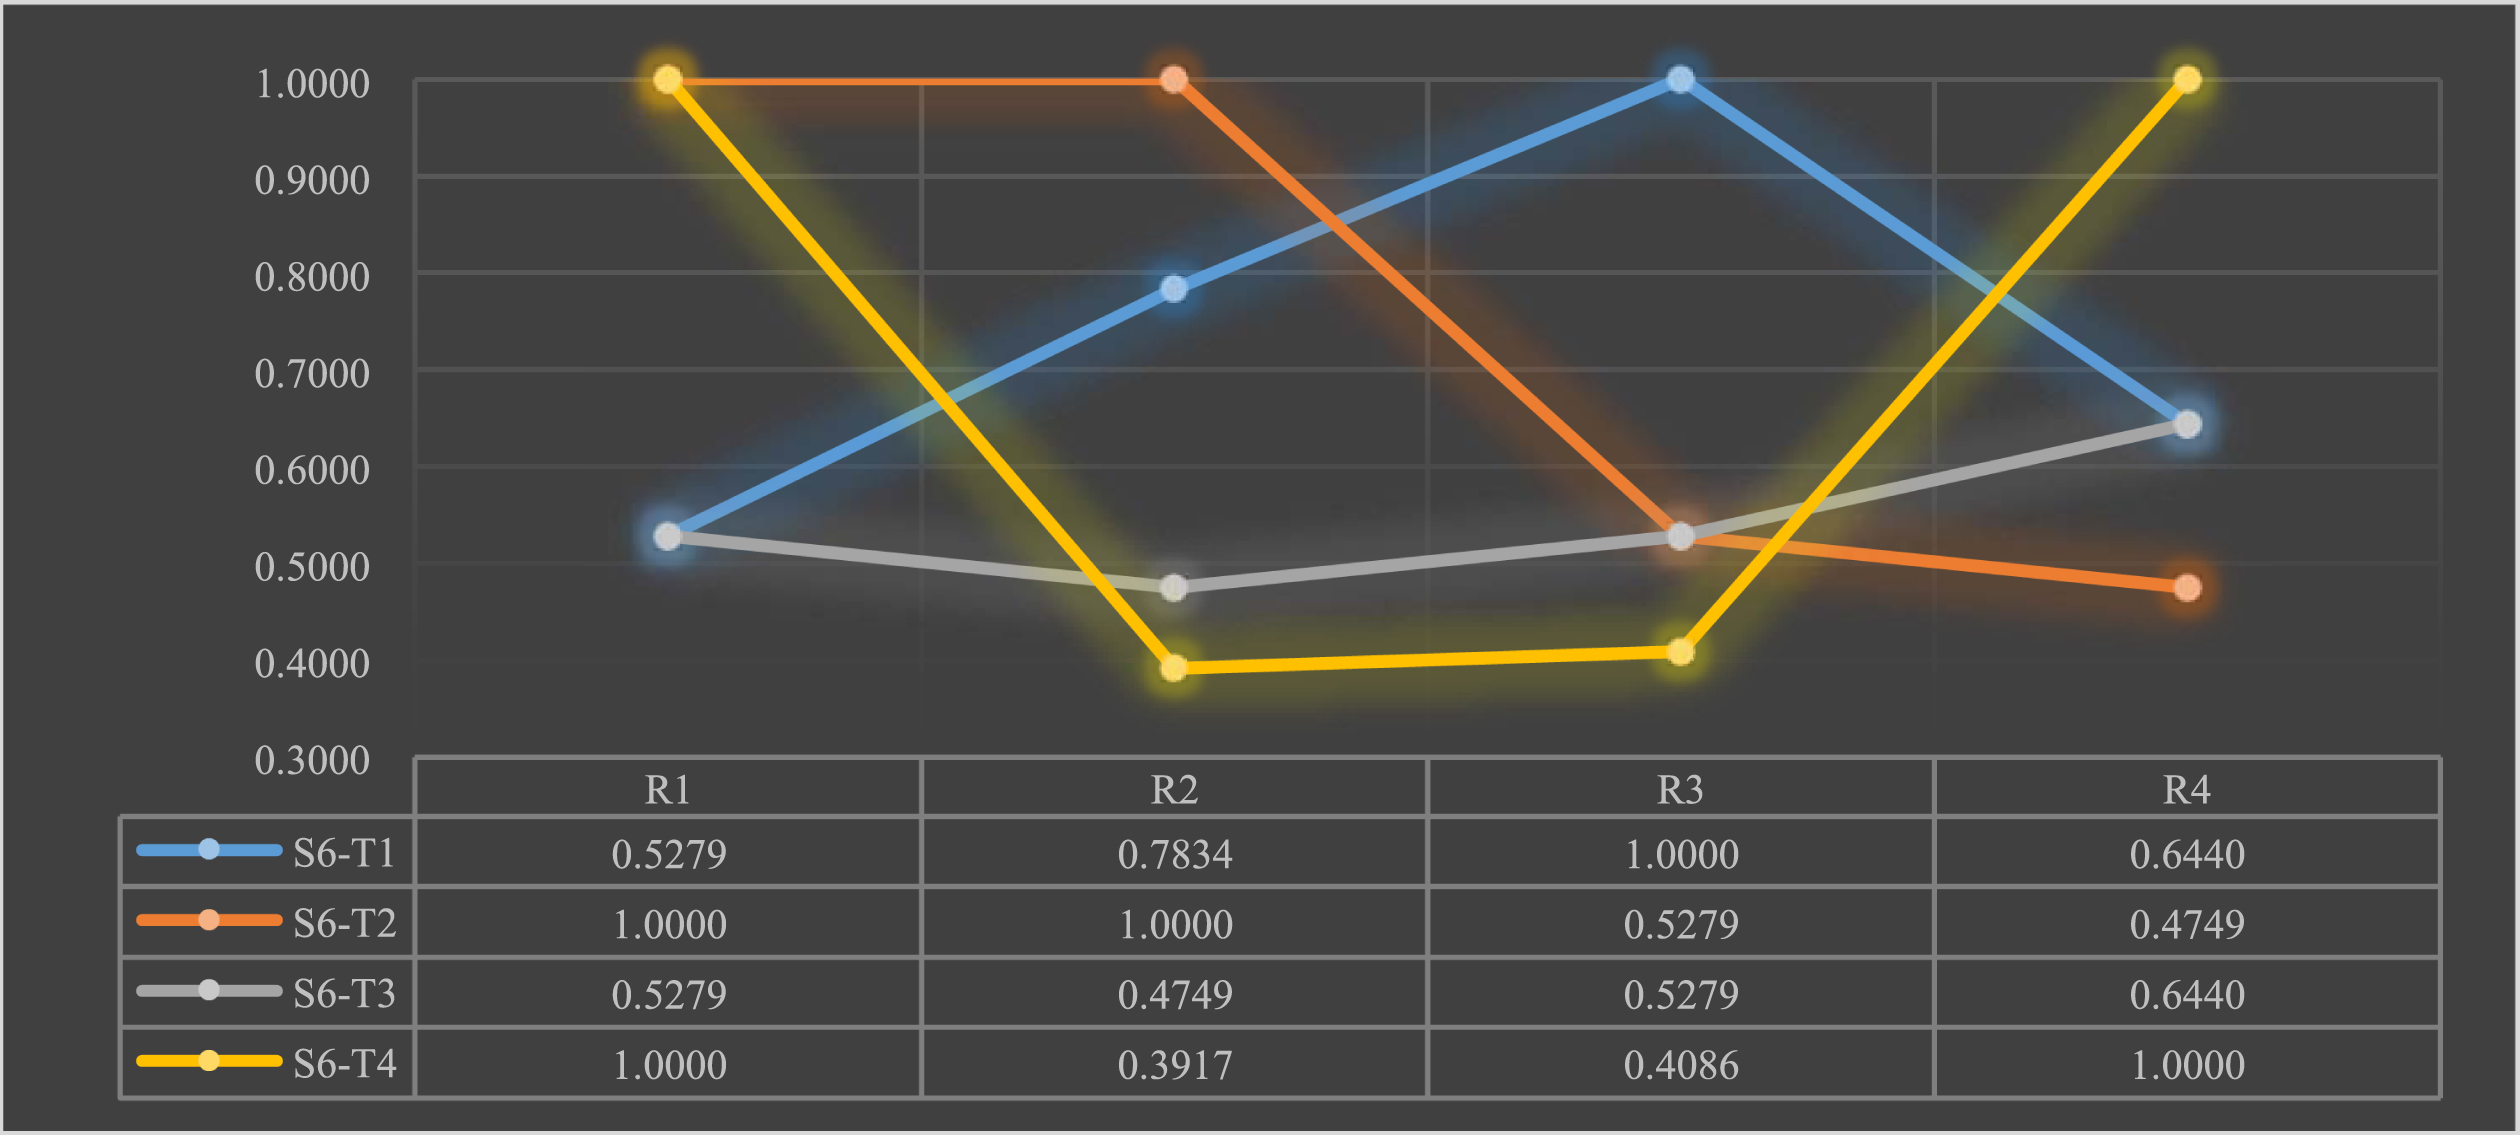
Satisfaction of scientific and technological talents S6 with the new R&D organization teams T.
As can be seen from the chart above: talent S1 is satisfied with team T1’s talent ladder and talent treatment; satisfied with team T2’s talent training and talent motivation and dissatisfied with its talent ladder and talent treatment; satisfied with team T3’s talent treatment and dissatisfied with its talent ladder; and rated team T4 relatively low.
As you can see from the chart above: talent S2 is satisfied with the talent treatment of team T1 and very dissatisfied with their talent incentives; they are satisfied with the talent ladder of team T2 and very dissatisfied with their talent treatment; they are satisfied with the talent training and talent treatment of team T3; and they are satisfied with the talent treatment of team T4.
As you can see from the chart above: talent S3 is very satisfied with the talent training and talent treatment of team T1 and very dissatisfied with the talent ladder; very satisfied with the talent ladder of team T2; very satisfied with the talent treatment and talent motivation of team T3; and rated team T4 relatively low.
The above chart shows that: talent S4 is satisfied with the talent treatment of team T1; dissatisfied with all indicators of team T2; satisfied with the talent training, talent ladder, and talent motivation of team T3 and dissatisfied with its talent treatment; satisfied with the talent training of team T4, but dissatisfied with other indicators.
As can be seen from the chart above: talent S5 is satisfied with the talent treatment of team T1; satisfied with the talent training of team T2 and dissatisfied with its other indicators; satisfied with the talent training and talent motivation of team T3 and very dissatisfied with its talent ladder; satisfied with the talent training of team T4 and dissatisfied with its other indicators.
The chart above shows that Talent S6 is satisfied with Team T1’s talent treatment; satisfied with Team T2’s talent training and talent ladder; rated Team T3 poorly on all indicators; satisfied with Team T4’s talent training and talent motivation, and dissatisfied with its talent ladder and talent treatment.
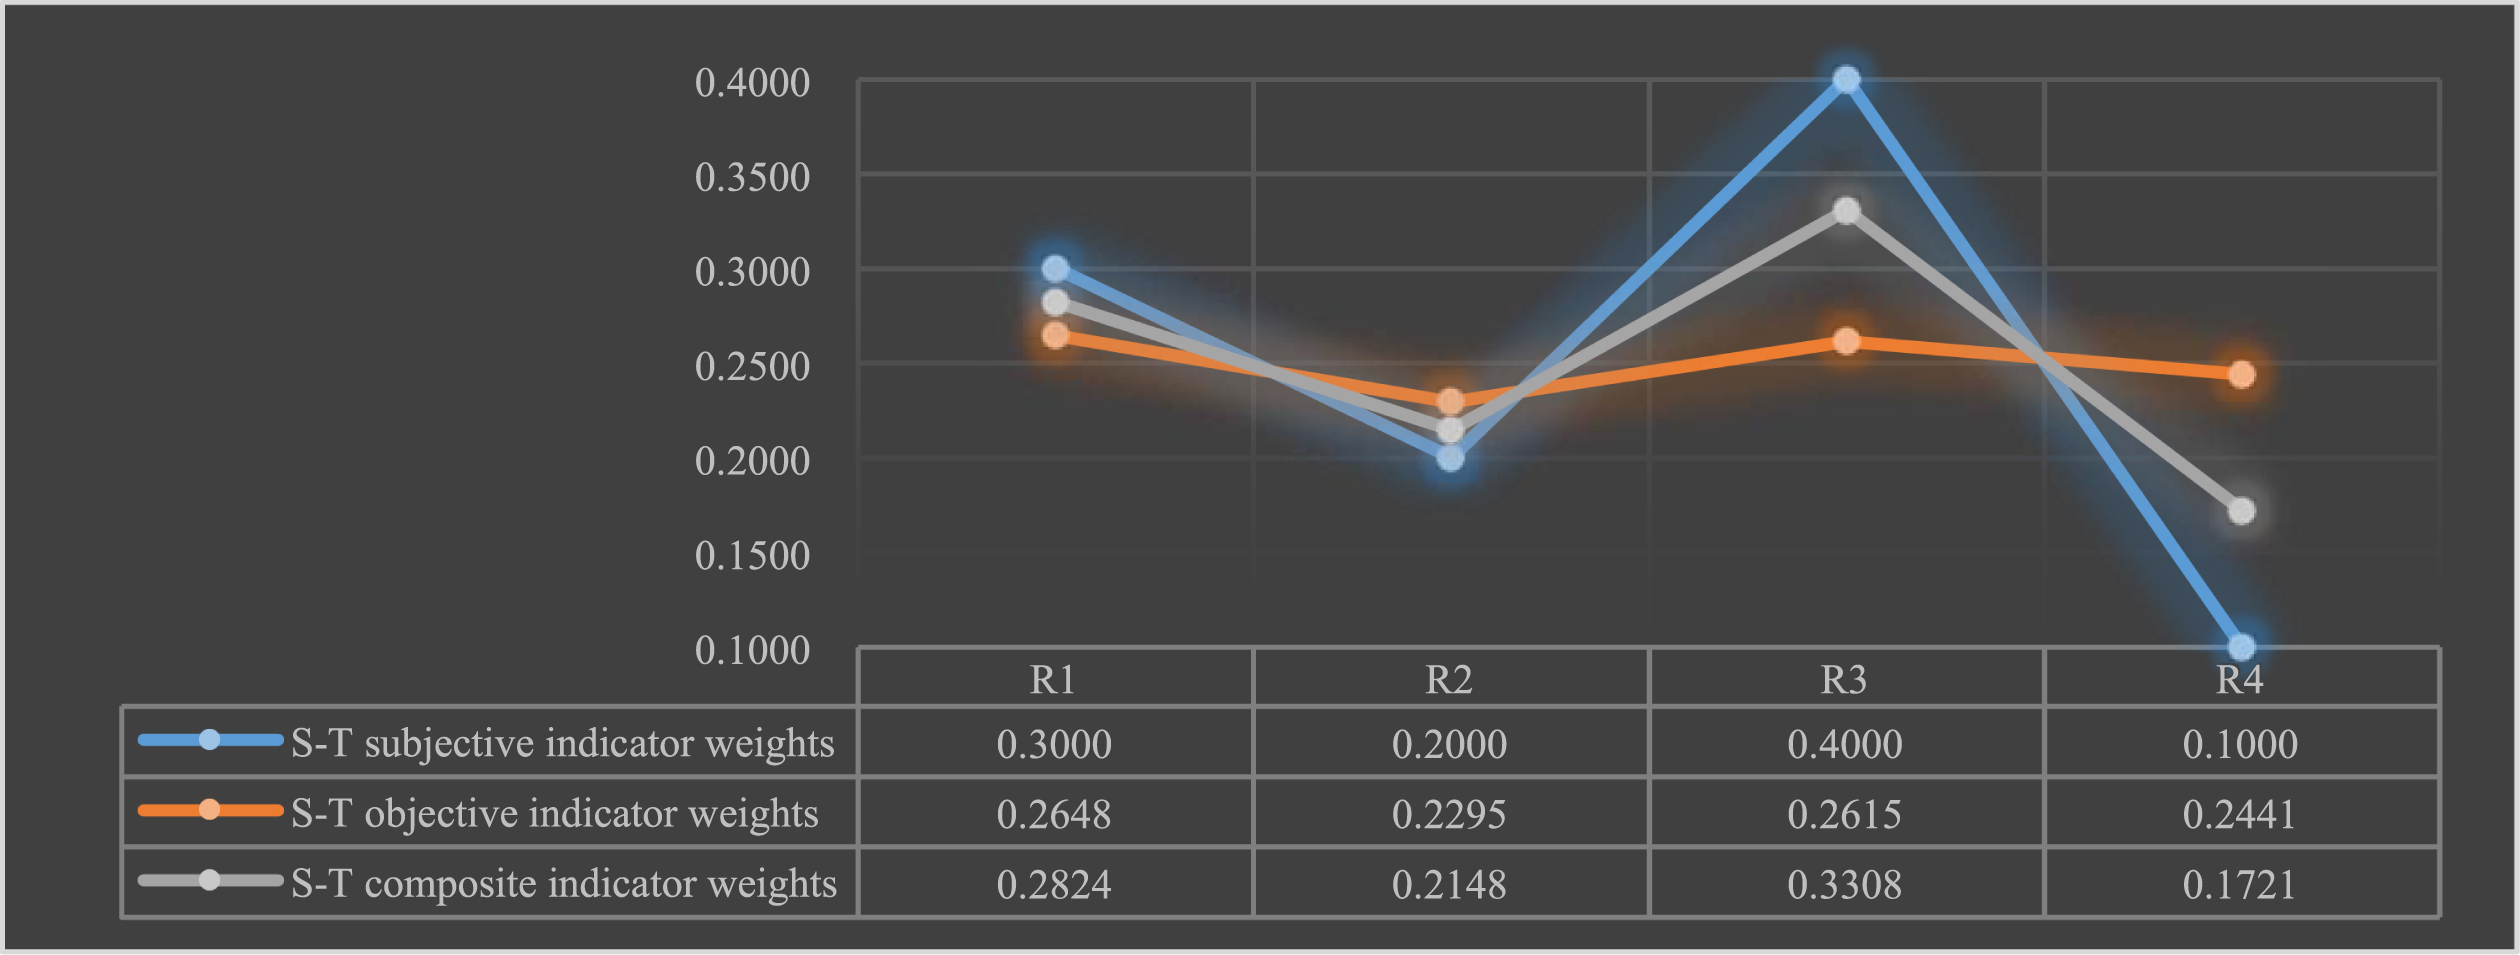
In this paper, some scientific and technical talents were consulted to obtain the subjective weights of the indicators ω4j. The objective weights of the indicators are obtained based on the share of the sum of the correlation coefficients ω5j, introduce the parameter adjustment parameter δ = 0.5, the comprehensive indicator weights are obtained ω6j, as shown in Fig. 22.
Subjective-objective-composite indicator weights for talent-to-team assessment.
As can be seen from the chart above: the subjective weight is more biased towards talent treatment, giving a lower weight to talent treatment, while the objective weight is less disparate and biased towards talent training and talent treatment, and the combined weight is more reasonable between the subjective and objective weights.
According to the integrated weights, the correlation coefficient based on the weights is calculated and the correlation coefficient matrix under the weights is obtained. According to the 3E cloud model inverse generator operation rules, the cloud data of the evaluation of scientific and technological talents to the team of new R&D organization is obtained, as shown in Table 18 and Fig. 23–28. In order to facilitate the bilateral matching later, the cloud data are transposed in this paper.
Cloud data for the assessment of Team T in new R&D institutions by Tech Talent S
Cloud data for the assessment of Team T in new R&D institutions by Tech Talent S
Cloud model diagram for the assessment of team T in new R&D institutions by S1.
Cloud model diagram for the assessment of team T in new R&D institutions by S2.
Cloud model diagram for the assessment of team T in new R&D institutions by S3.
Cloud model diagram for the assessment of team T in new R&D institutions by S4.
Cloud model diagram for the assessment of team T in new R&D institutions by S5.
Cloud model diagram for the assessment of team T in new R&D institutions by S6.
The cloud data in the table is not intuitive, and in this paper, the weight-based correlation coefficients are input into MATLAB for the simulation of the cloud model, and the cloud model diagram of the assessment of S for scientific and technological talents by the team T of the new R&D organization is obtained, as shown in Figs. 23–28.
As can be seen from the above graph: the assessment expectation of tech talent S1 for team T1 exceeds 0.5, the assessment expectation of team T2, T3 and T4 do not exceed 0.5, and the assessment of team T2 has a higher degree of cloud-drop cohesive hugging.
As can be seen from the above graph: the assessment expectations of S2 for tech talent for team T1, T3, and T4 are more than 0.5, the assessment expectations for team T2 are less than 0.5, and the assessment of team T3 has a higher degree of cloud-drop cohesive hugging.
As can be seen from the above graph: the assessment expectations of the tech talent S3 for team T1, T2, and T3 are more than 0.5, the assessment expectations for team T2 are less than 0.5, and the assessment of team T2 has a higher degree of cloud-drop cohesive hugging.
As can be seen from the above graph: the assessment expectations of tech talent S4 for team T1 and T3 are more than 0.5, the assessment expectations for team T2 and T4 are less than 0.5, and the assessment of team T3 has a higher degree of cloud-drop cohesive hugging.
As can be seen from the above graph: the assessment expectations of S5 of tech talent for team T1, T3 and T4 are more than 0.5 and less than 0.5 for team T2, their assessment cloud drops cohesive hugging is about the same and all are more discrete.
As can be seen from the above graph: the assessment expectation of S5 for tech talent is more than 0.5 for team T1 and T2, around 0.5 for team T4, less than 0.5 for team T3, and a higher degree of cloud-drop cohesive hugging for team T3.
The T-S cloud data and S-T cloud data obtained from the above calculation are assembled according to the formula of cloud aggregation. Since the team and scientific and technological talents of the new R&D organization are equally important, the importance weight parameters of team and talents ρ = 0.5, are substituted into the cloud assembly formula to obtain the cloud data for the overall assessment of satisfaction, as shown in Table 19.
Cloud Data on Overall Satisfaction of Teams and Scientific Talents in New R&D Institutions
Cloud Data on Overall Satisfaction of Teams and Scientific Talents in New R&D Institutions
The data in the above table was substituted into the M-1 model and bilateral matching was solved using LINGGO software, and the final matching results were obtained as [T1, S1], [T2, S6], [T3, S2], [T3, S3], [T3, S4], and [T4, S5]. The overall assessed satisfaction for this match was 2.5855 and the match was a stable match.
After calculation, the results are shown in Table 20.
Bilateral Matching Results of Teams and Talents in New R&D Institutions under Different Methods
Bilateral Matching Results of Teams and Talents in New R&D Institutions under Different Methods
From the above table, we can see that: The results of bilateral matching are not exactly the same under different methods. Regardless of the matching method, Team T3 always matches more tech talents, indicating that Team T3 has a strong demand for tech talents, tech talents are more satisfied with the talent environment provided by Team T3, the assessment data of each indicator is more concentrated, and each assessment indicator develops in a balanced way. When considering the dominant power of matching tech talents greater, Team T4 matches more tech talent, indicating that Team T4 satisfies tech talent in talent training, talent ladder, talent treatment, and talent incentive. When directly matched bilaterally using the grey-off coefficient, Teams T1 and T4 match more tech talent, indicating that Teams T1 and T4 have more discrete assessment data and weaknesses in assessment indicators.
In summary, the following conclusions can be drawn.
First, the method of grey correlation and cloud model provides a good basis for the decision of matching scientific and technological talents in the team of new R&D institutions, solves the method of matching assessment values characterized by interval grey numbers and linguistic values, fully considers the different input forms of assessment values while also fully considers the uncertainty of assessment values, is closer to reality, and is simple to calculate.
Secondly, this paper designs an index system for the team of new R&D institutions to assess scientific and technological talents, and at the same time designs an index system for scientific and technological talents to assess the team of new R&D institutions. The comprehensive assessment value derived after the two-way assessment is better than the individual index assessment, which can comprehensively grasp the development of the team of new R&D institutions and the development of scientific and technological talents.
Third, in this paper, the grey correlation coefficients are calculated by correlating with the maximum value of the assessed value of the same batch of new R&D organization teams and scientific and technological talents, which can ensure that each match is a higher correlation among the teams and talents in that batch, that is, a higher satisfaction level, and with some constraints, there will not be a situation that no team or talent can be selected, and if a new batch of teams or a new batch of talents are matched again, the results will change as the teams and talents involve in the match change.
Fourth, this paper considers both subjective and objective weights in calculating indicator weights, determines T-S composite indicator weights and S-T composite indicator weights through subjective-objective weight parameters, and applies composite indicator weights to the cloud model inverse generator set data, and also uses the inverse of the maximum indicator weights to reconcile the data, thus ensuring the normality and effective transferability of the data.
Fifth, in the process of bilateral matching between the team of new R&D institutions and scientific and technological talents, this paper sets the importance degree weight, the importance degree weight is determined by the scarcity of resources, the scarcity degree of different disciplines is still different, the awareness of the scarcity degree is also different, in the method comparison can be seen that the importance degree weight is different and the matching results are not consistent.
Sixth, in the process of bilateral matching of new R&D organization teams and scientific and technological talents, this paper integrates the dual objectives of expectation maximization and entropy minimization in cloud model data, and fully utilizes the features of cloud data to make the results of bilateral matching of uncertainty of new R&D organization teams and scientific and technological talents more reasonable.
Seventh, the method enables the analysis and improvement of teams and scientific and technological talents in new R&D institutions. For example, if a team has high assessment values under a certain indicator, it means that the work is done properly, while the assessment value of a certain indicator is not high, which means that improvement is needed under that indicator; if a talent has high assessment values under a certain indicator, it means that the ability of that indicator is relatively strong, while the assessment value of a certain indicator is not high, which means that the ability of that indicator needs to be improved. The competencies for that indicator need to be improved.
In conclusion, the method in this paper greatly improves the efficiency and effectiveness of matching, avoiding the situation of high willingness of team and low willingness of talent or high willingness of talent and low willingness of team, so that neither the team nor the talent will waste their time on inefficient tracking and negotiation. The new R & D organization team should pay attention to the market dynamics, pay attention to the development of scientific and technological talent, in-depth research on the value of scientific and technological talent to the new R & D organization team assessment and correlation, for the talent with low correlation, to find the root cause of not doing well enough or a large gap with other teams, so that scientific and technological talent to create more scientific and technological output, but also timely adjustment of science and technology policies to reduce costs. Science and technology talents should also pay attention to the team’s assessment of their own situation in a timely manner, so that they can take advantage of their strengths and weaknesses in the team to create more scientific and technological achievements and realize their self-worth.
Footnotes
Acknowledgments
Jiangsu Province Education Reform and Development Strategic and Policy Research Major Project: Jiangsu high-level teacher team construction research, Project No. 202000206. Project of Jiangsu Provincial Education Department: Research on talent management innovation of universities based on big data in the context of “double first-class”, Project No. 72031941028A.