
Abstract
Statistical lifetime distributions play a very important role in modeling data sets in various fields. Extending the existing distributions is of great interest in statistical research. The modification of the distributions provides more flexible model as compared to existing one. In this article, we propose a new probability model using Quadratic Rank Transmutation Map technique, named as Transmuted Lomax Exponential Distribution (TLED). The new distribution can model data sets with increasing, decreasing and bathtub shape hazard rates. Various statistical properties of the proposed distribution such as moments, order statistics, quantile function, mean residual life function and characteristic function are derived. Further, the parameter estimates are obtained through Maximum Likelihood method along with asymptotic confidence intervals. The utility of the new model is evaluated by analyzing two real data sets. In order to access the performance of the new model, several goodness of fit measures is used. The results indicate that the new model best fits the data as compared to the other extensions of the Lomax distribution.
Introduction
Statistical distributions have great significance in predicting and describing the real-world phenomena in various fields such as economics, engineering, insurance and finance, reliability analysis, business and biostatistics. Determining the correct model for data under consideration is essential for reliability of the results [1]. In literature, many statistical distributions have been developed such as exponential, Rayleigh, Gamma, Log-normal and Weibull distribution for analysis of lifetime data. Due to the bulk of modern world data available for analysis, new probability distributions are required for better fit of the data sets. Over the past few years, many methodologies are developed to generate new families of distributions based on existing probability distributions in both discrete and continuous cases. Mostly, the new probability distributions are obtained by adding a new shape parameter through generators or by joining existing probability distributions or by making certain transformations in the original probability distributions. The aim of this development is to make existing distributions more flexible to adequately model the complex phenomena. Many researchers have established different procedures for adding new parameter to the classical distributions. Alpha power transformation method was suggested by Kundu and Mahdavi [2] to add an additional parameter in continuous distribution. A detailed study on techniques of developing continuous univariate distributions was carried out by Lee et al. [3]. Eugene et al. [4] introduced another method for generating new distributions named as beta family of distributions. Jones [5] extended the work of [4] using Kumaraswamy distribution instead of beta distribution. Another class of distributions known as T-X system was also proposed [6]. More recently, a new method was proposed called Quadratic Rank Transmutation Map (QRTM) for adding an extra parameter in existing distribution for making it more flexible to model several types of data more adequately [7]. This method is described as follows:
Let G(y) denote the cumulative distribution function (cdf) of the parent distribution. Then the cdf of transmuted probability distribution, denoted as F(y), is given as
Then corresponding pdf of transmuted distribution is given as
Lomax or Pareto type II distribution was proposed by Lomax in 1954 to model and analyze lifetime data. The distribution is heavy tailed and also a member of family of distributions having decreasing failure rate [13]. It has applications in life testing and reliability problems in economics, engineering, business, biological sciences, actuarial modeling and survival analysis. Lomax distribution was successfully applied to model the data of business failure [14], size distribution of the computer files on servers [15] and also for wealth and income data [16]. Bryson [17] suggested the use of Lomax distribution as an alternate to exponential distribution for heavy tailed data.
Suppose random variable “Y” has Lomax Distribution having cdf
The pdf of Lomax distribution is given by
In the literature, researchers have introduced many extensions of Lomax distribution having different number of parameters. For example, Hassan and Abd-Allah [18] proposed exponentiated Weibull–Lomax. Kilany [19] introduced weighted Lomax distribution. Cordeiro et al. [20] proposed Gamma-Lomax. Hassan and Abd-Allah [21] studied exponentiated Lomax Geometric. Moltok et al. [22] proposed transmuted power Lomax distribution. Abdullahi and Ieren [23] introduced transmuted exponential Lomax distribution. Recently, Ijaz et al. [24] proposed a new extension of the Lomax distribution called Lomax exponential distribution by considering the transformation X = Y exp(Y). The pdf of the Lomax exponential distribution [24] is given by
The corresponding cdf of Lomax exponential distribution is given as
To analyze and model real world data in several fields, various statistical distributions have been proposed but still there is a need of developing new distributions to model the real phenomena which are not best fitted by the existing classical distributions. The main aim of this article is to propose a new flexible model called as transmuted Lomax exponential distribution (TLE) using QRTM technique introduced by [7]. The proposed distribution has many tractable statistical properties and proposed model will provide an adequate fit to real life data as compared to the existing distributions. The article is organized as follows: In Section 2, we define new distribution and give its plots. In Section 3, statistical properties including quantile function, characteristic function, moment generating function and moments are derived. Section 4 provides the maximum likelihood estimates of the proposed model. In Section 5, we discussed order statistics and some entropy measures. Section 6 discusses reliability analysis of the proposed model. In section 7, the utility of the distribution is demonstrated by its application to two real data sets and a simulation study. Finally, conclusion is provided in section 8.
By putting equation (6) into equation (1), we get the cdf of TLED:
And substituting Equations (5) and (6) into Equation (2), we get the pdf of the TLED:
The graphs of pdf with different parameter values are displayed in Fig. 1. The plot of the pdf of TLED is positively skewed.
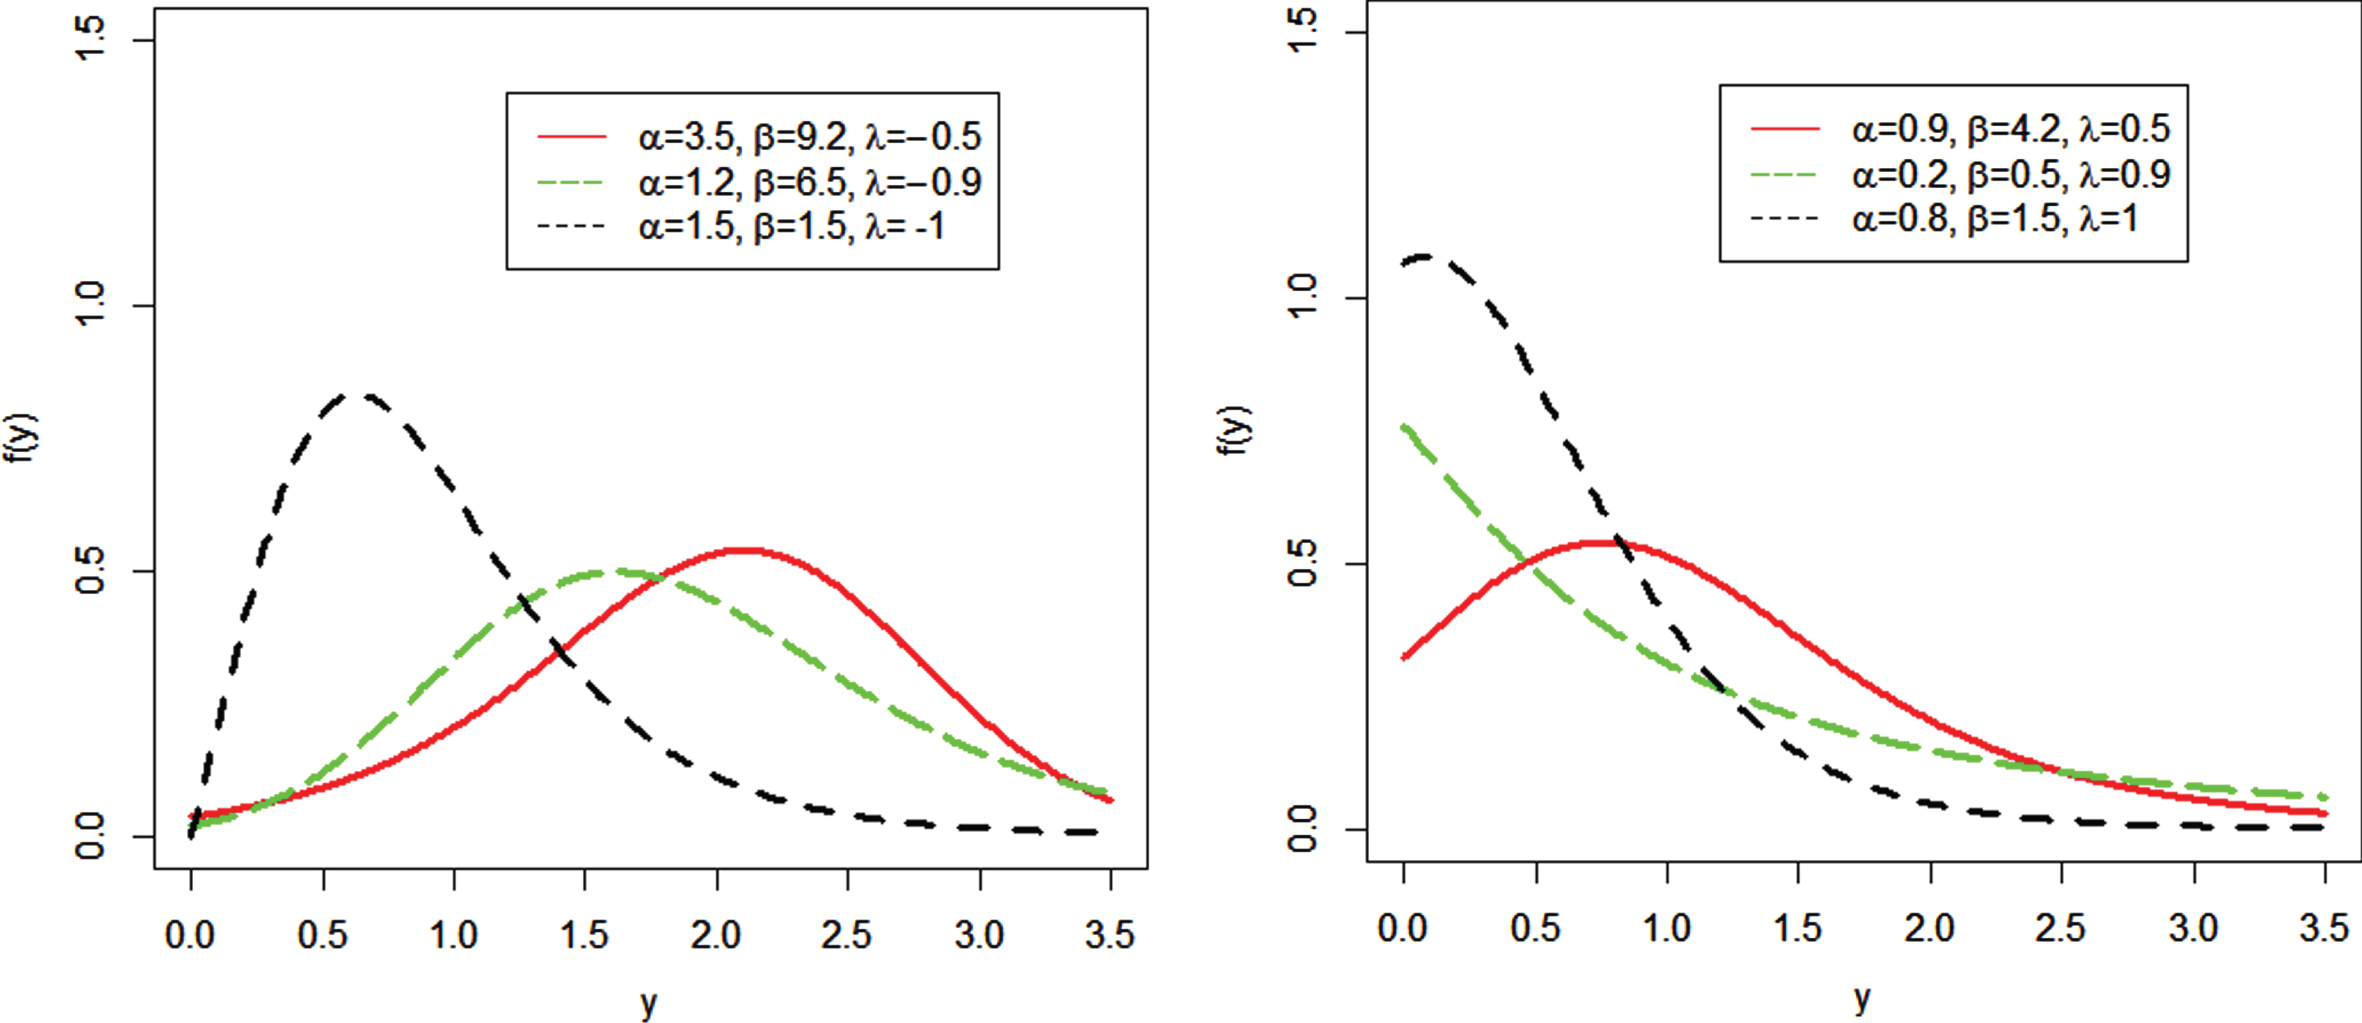
Pdf plots of the TLED for different parameters values.
Quantile function and the median
Quantile function of a distribution is obtained by inverting its cumulative distribution function. If F(Y) is the cdf of Y, such that F (Y) = u then Y = F-1 (u) is the corresponding quantile function where u ∼ U (0, 1) [25]. Quantile function for TLED is given as
where W(.) shows the product log function. Median of the TLED is obtained by putting u = 0.5 in Equation (9) to have
Moments play important role in describing characteristics of the distribution such as central tendency, dispersion, skewness and kurtosis. The rth moment of the TLED is given as
Putting Equations (8) in (11), we have
By using,
In the above equation, solving the integral we get
“Coefficient of variation” (CV), “Coefficient of skewness” (CS) and “Coefficient of kurtosis” (CK) can be find using the following relationship
The Mgf of the TLED is given
The characteristic function of a random variable Y following TLE distribution is given as
By employing simple algebra and power series expansion, we get
In this section, the method of MLE will be used to estimate the parameters of the Transmuted Lomax Exponential distribution.
Maximum likelihood estimation
Suppose a sample Y1, Y2, Y3, ... .,Yn of size ‘n’ is taken randomly from Transmuted Lomax Exponential distribution with parameters α, β and λ. The likelihood function is given as
Taking natural logarithm of the equation (25), we get log likelihood function
Computing partial derivatives of Equation (27) with respect toα, β and λ respectively, we obtain the following equations
Equating the result of (28–30) to zero, i.e
The exact distribution of the MLE cannot be derived due to explicit expressions of above equations. However, asymptotic confidence bounds for unknown parameters of Transmuted Lomax Exponential distribution can be obtained on the basis of asymptotic distribution of MLE. We assume that the MLE’s (
With,
Where,
The estimate of Σ is obtained by replacing all parameters by their MLE’s. We get
Using (31), approximately (1 - ξ) 100% confidence interval can be derived for parameters α, β, λ as
Where Zξ/2 denote the upper (ξ/2) th percentile of standard normal distribution.
In this section, densities for order statistics and entropy measures such as Renyi entropy and q- entropy are considered.
Order statistics
Let a random sample Y1, Y2, ... . Yn is drawn from the TLE distribution and Y1:n, Y2:n, …, Yn:n be corresponding order statistics of this sample in such a way that Y1:n ⩽ Y2:n ⩽ , … . , ⩽ Yn:n. Then the pdf of jth order statistics, (j = 1,2,3, ... .,n) is given by
Where B(.,.) is beta function [26].
Or
Substituting Equations (7) and (8) in (33), we get
By putting j = 1 in (34), we get pdf of minimum order statistics Y1:n
By putting j = n in (34), we get pdf of maximum order statistics Yn:n
The Renyi entropy for TLED is given as
Where,
Havrda and Charvat [27] defined q- entropy as
The q- entropy for a random variable Y from TLED is given as follows
Where,
Survival function
This function gives the likelihood of an object, individual or a system living longer than a given time. The survival function is given as
The hazard rate function plays a fundamental role in lifetime modeling. It is also known as force of mortality or failure rate.
If λ = 0, then the failure rate is same as Lomax exponential distribution.
Figure 2 represents different shapes of hazard rate function of TLED for several values of the parameter. The following figure shows that the monotonic as well as non-monotonic hazard rate shapes can be modeled through TLED. Therefore, the suggested distribution has more flexibility for modeling different lifetime datasets.

Plots of hazard rate function of Transmuted Lomax Exponential Distribution.
This function determines the expected additional lifetime of a unit given that the unit has lasted up to a fixed time t. The MRL say u (t) is given as
Using (13) and solving integral of above equation using upper incomplete gamma function
The mean waiting time reflects the waiting period that has elapsed after a unit failed on the condition that the failure happened in [0, t] interval. The mean waiting time, denoted by
Simplifying (46) and then solving integral using lower incomplete gamma function,
Let Y1 and Y2 be the independent and continuous random variables from TLE distribution such that Y1 ∼ TLE (α1, β, λ1) and Y2 ∼ TLE (α2, β, λ2), then the stress strength parameter, say S is given as
where
Simulation study
Simulation study has been carried out by generating random data from TLED using equation (10). The simulation experiment was performed W = 100 times at different sample sizes n with different parameter combinations. Mean Square Error (MSE) and bias are calculated using the following formula
where, a = (α, β, λ). Table 1 shows the values for average bias and MSE. From Table 1, it can be clearly seen that the values of bias and MSE decrease by increasing the sample size.
Average MSE and Bias
Average MSE and Bias
The flexibility of the proposed distribution is demonstrated through its application to two real data sets.
2, 2, 2, 2, 2, 2, 2, 2, 2, 2, 2, 2, 3, 3, 3, 3, 4, 4, 4, 5, 5, 5, 5, 6, 6, 6, 6, 8, 8, 9, 15, 17, 22, 23, 24, 24, 25, 27, 32, 43.
3.70, 2.74, 2.73, 2.50, 3.60, 3.11, 3.27, 2.87, 1.47, 3.11, 4.42, 2.41, 3.19, 3.22, 1.69, 3.28, 3.09, 1.87, 3.15, 4.90, 3.75, 2.43, 2.95, 2.97, 3.39, 2.96, 2.53, 2.67, 2.93, 3.22, 3.39, 2.81, 4.20, 3.33, 2.55, 3.31, 3.31, 2.85, 2.56, 3.56, 3.15, 2.35, 2.55, 2.59, 2.38, 2.81, 2.77, 2.17, 2.83, 1.92, 1.41, 3.68, 2.97, 1.36, 0.98, 2.76, 4.91, 3.68, 1.84, 1.59, 3.19, 1.57, 0.81, 5.56, 1.73, 1.59, 2.00, 1.22, 1.12, 1.71, 2.17, 1.17, 5.08, 2.48, 1.18, 3.51, 2.17, 1.69, 1.25, 4.38, 1.84, 0.39, 3.68, 2.48, 0.85, 1.61, 2.79, 4.70, 2.03, 1.80, 1.57, 1.08, 2.03, 1.61, 2.12, 1.89, 2.88, 2.82, 2.05, 3.65.
A comparison is made between the proposed distribution and various extensions of Lomax distribution such as power Lomax [30], exponential Lomax [31], transmuted power Lomax [22], weibull Lomax [32], transmuted exponential Lomax [23], Kumaraswamy-Generalized Lomax [33], Lomax exponential [24]. The usefulness of the proposed model is demonstrated by using various goodness of fit criteria such as “Akaike Information Criterion” (AIC), “Hannan-Quin Information Criterion” (HQIC), “Consistent Akaike Information Criterion” (CAIC), “Bayesian Information Criterion” (BIC), Anderson–Darling (AD), Kolmogorov-Smirnov (K-S) statistics and its p-value. Generally, model having minimum value of all these tests and maximum p-value would be considered best model to fit the given set of the data. Tables 2 and 4 represent the maximum likelihood estimates while Tables 3 and 5 show the corresponding goodness of fit measures, i.e., AIC, BIC, HQIC, CAIC, K-S, AD for the data sets 1 and 2. Tables 3 and 5 show that TLED adequately fits the data in comparison with the other fitted models. Figures 3 and 4 represent the Q-Q and P-P plot of the TLED for data sets 1 and 2 respectively.
MLEs with standard errors (in brackets) for data set 1
MLEs with standard errors (in brackets) for data set 1
Goodness of fit measures for fitted distributions for data set 1
MLEs with standard errors (in brackets) for data set 2
Goodness of fit measures for fitted distributions for data set 2
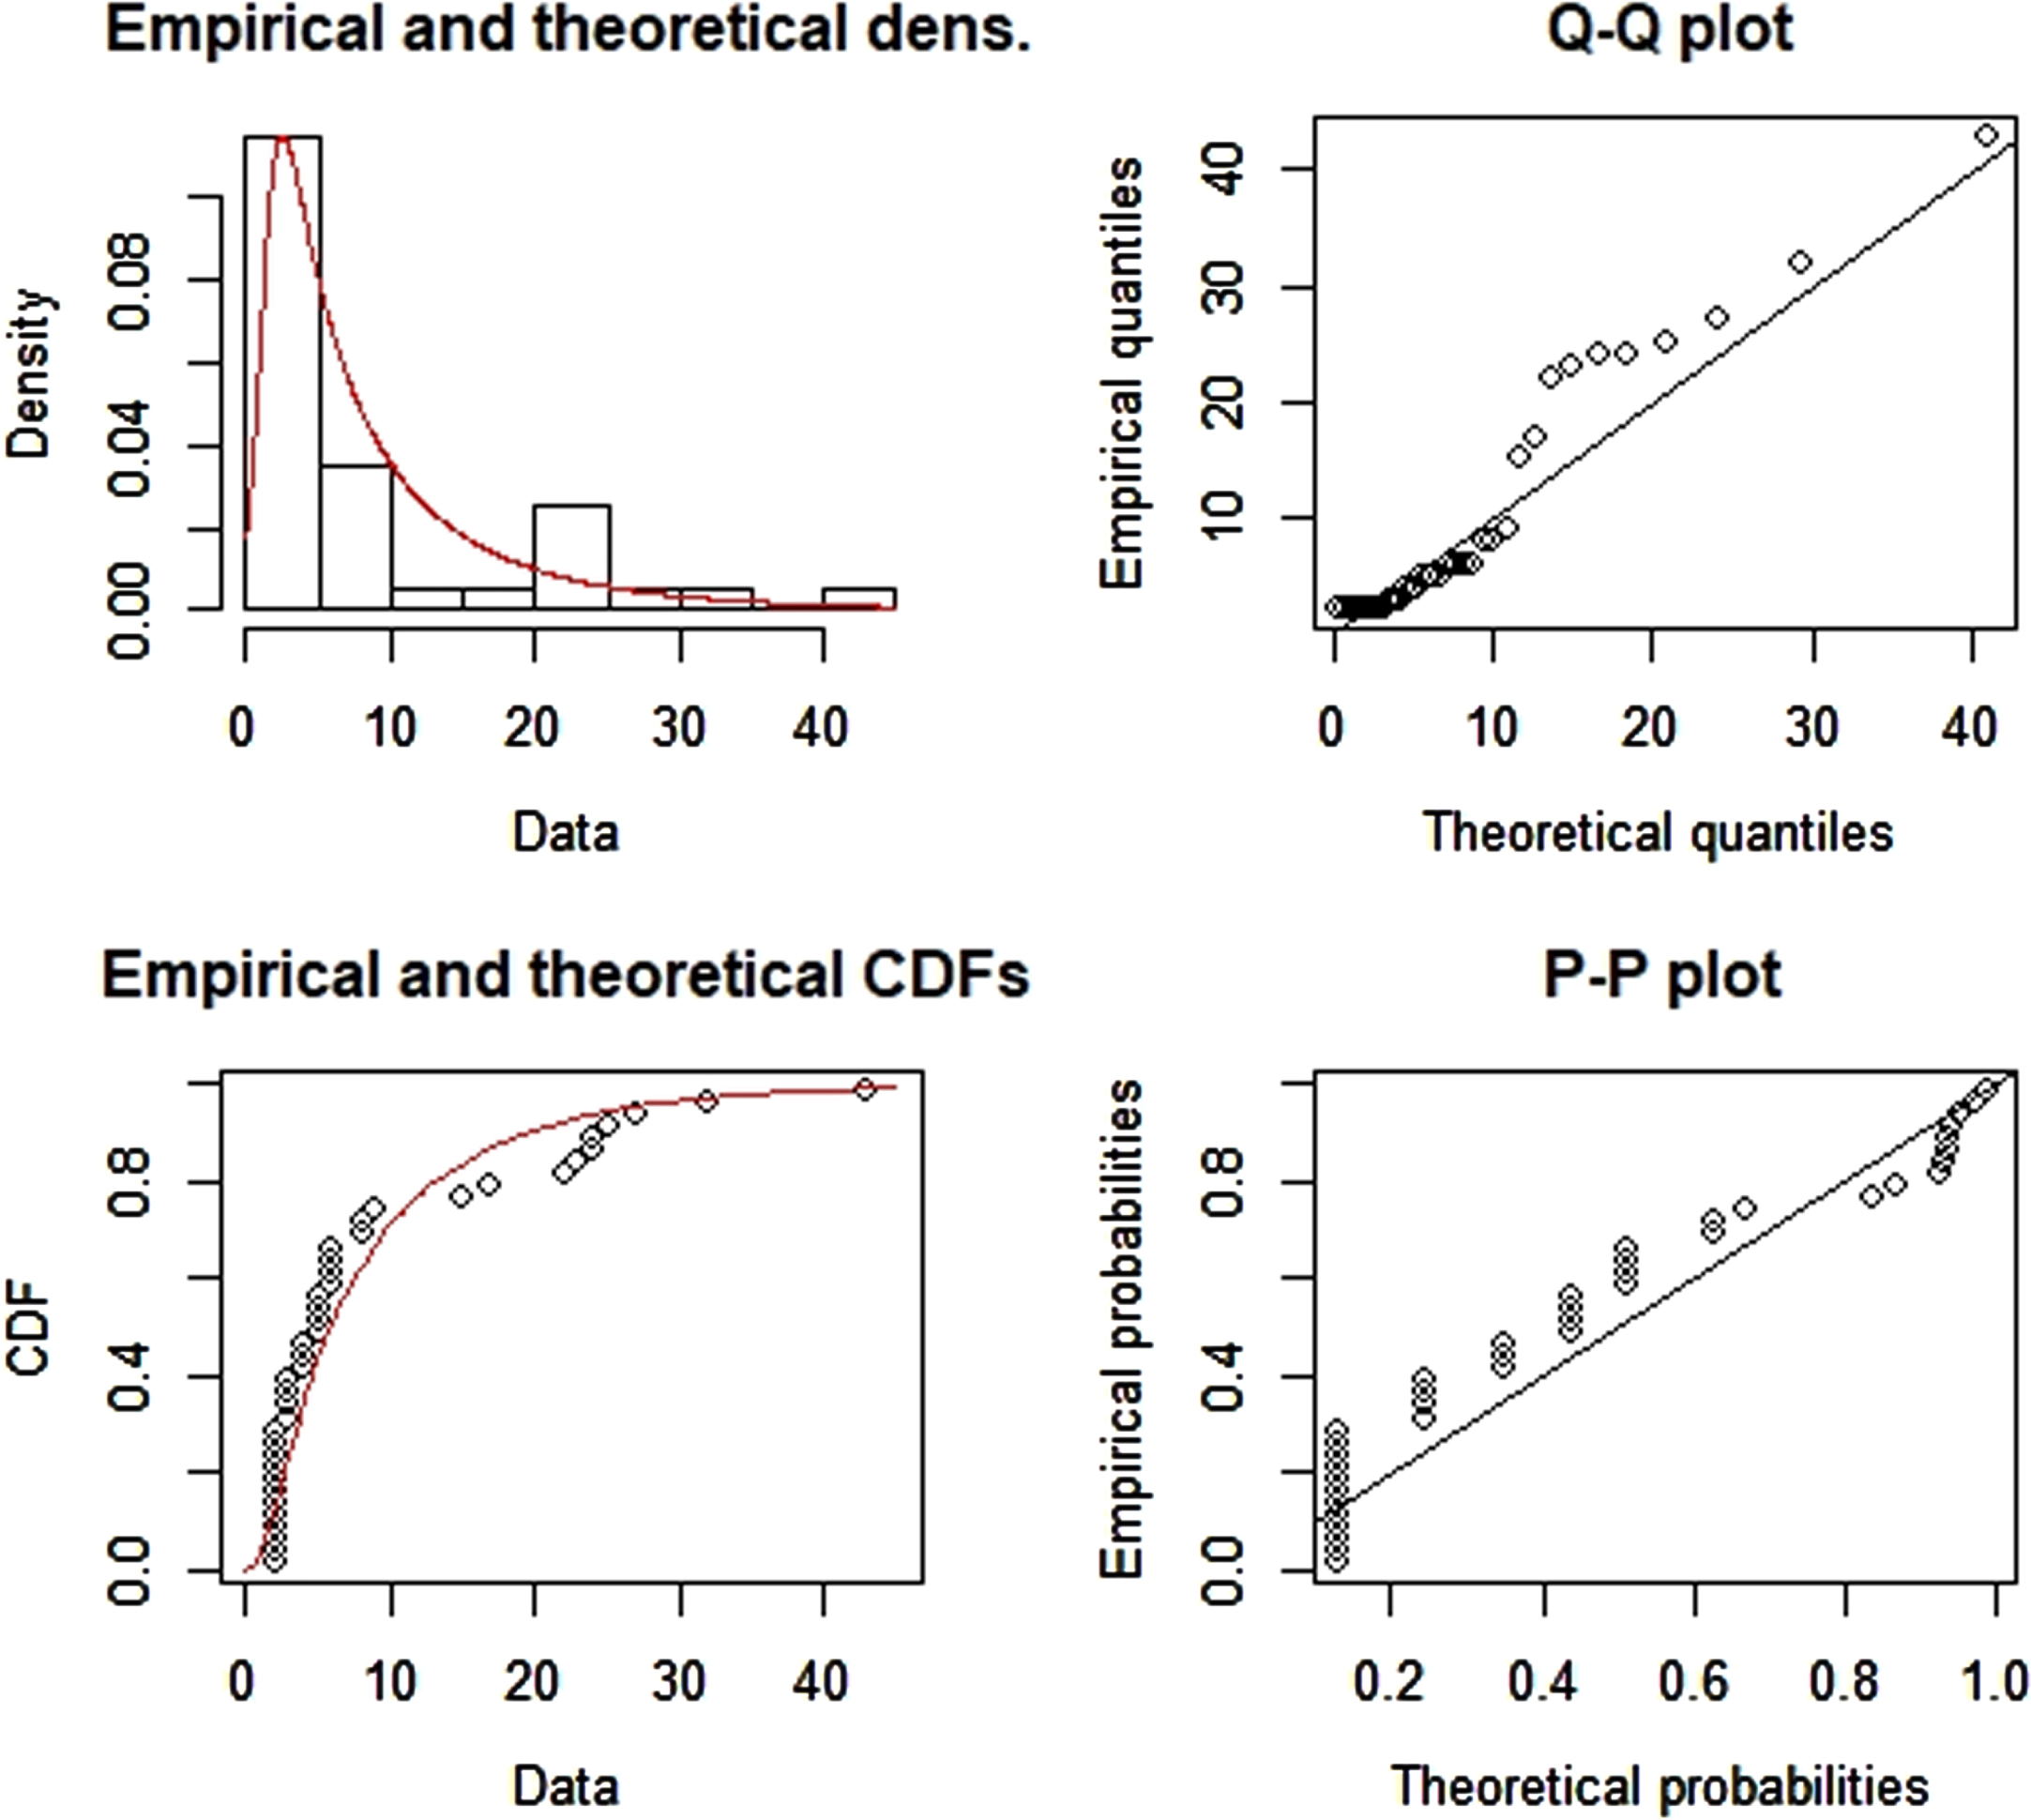
Theoretical and empirical pdf and cdf along with Q-Q and P-P plot for data set 1 (losses from wind disaster).
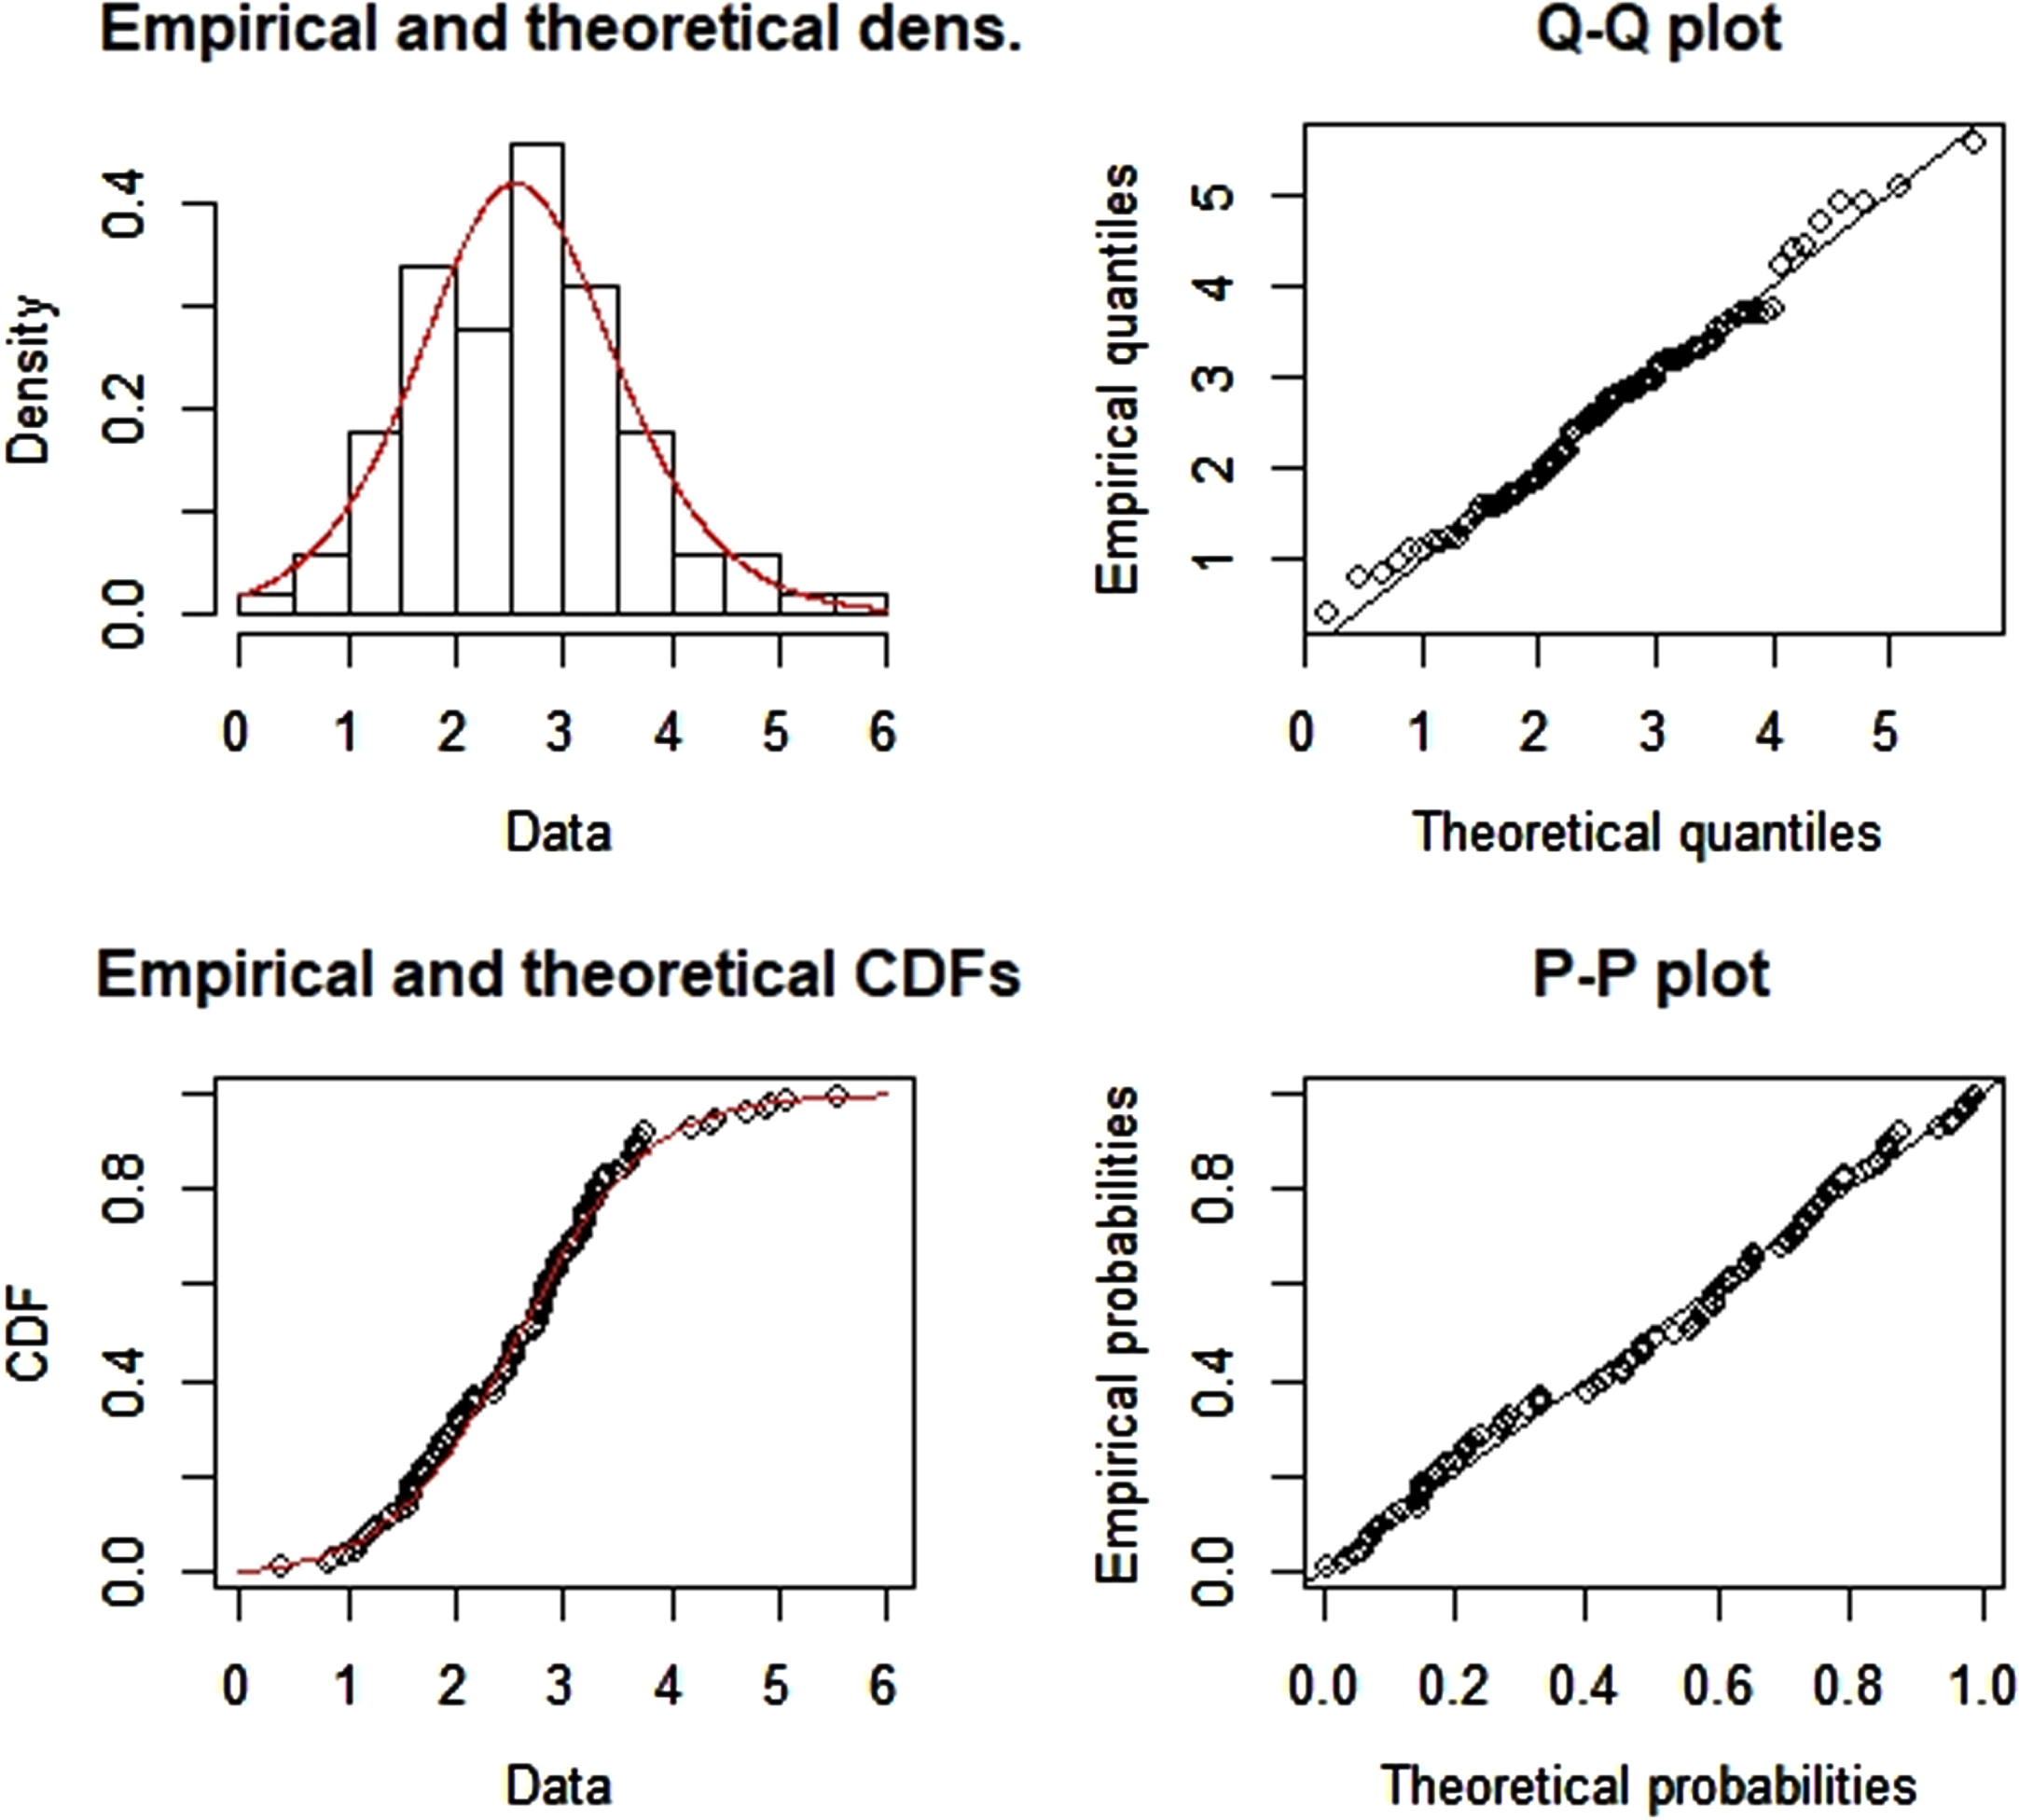
Theoretical and empirical pdf and cdf along with Q-Q and P-P plot for data set 2 (breaking stress of carbon fibers).
Where yi:n shows order statistics.
The TTT plot for data sets are given in the Fig. 5. From the Fig. 5 (a and b), it is clear that both monotonic and non-monotonic shapes of hazard function can be modeled by the new distribution.

(a) TTT plot for 1st data set (b) TTT plot for 2nd data set.
A new three parameter distribution called, Transmuted Lomax Exponential Distribution (TLED) was proposed and studied in this article. The suggested distribution is the extension of Lomax exponential distribution. The expressions of characteristic function, moments, quantile function, mgf were derived for TLED. The pdfs of order statistics and some entropy measures such as Renyi entropy and q-entropy were obtained. For estimation purpose, MLE method was used and also asymptotic confidence bounds based on asymptotic distribution of MLE were obtained. Reliability measures including survival function, stress strength parameter, hazard rate function and mean residual life function were derived for TLED. Plots of the pdf, cdf and hazard rate function, TTT plot were made to visualize the performance of the new model. TTT plot demonstrated that TLED can model data sets with different hazard rate shapes. Simulation results were conducted to examine the performance of the MLE. Finally, applications of the real data sets clearly showed the potentiality of the model. Goodness of fit criteria were used and results reveal that TLED is best fitted model with minimum AIC, BIC, CAIC, HQIC, K-S and AD statistics.
Conflict of interest
The authors have no conflict of interest.
Footnotes
Acknowledgment
This project was supported by the deanship of scienti?c research at Prince Sattam bin Abdulaziz University, Al-Kharj, Saudi Arabia.