
Abstract
The adoption of a new transmission line is extremely complex because of its socio-economic problems such as environmental clearances. Thus, there is a prominence of better utility over available transmission infrastructure. The Flexible Alternating Current Transmission System (FACTS) devices can offer transmission capability enhancement, power compensation, and stability as well as voltage improvement. However, the FACTS devices have a higher penetration impact of wind generation for the dynamic stability of power networks. In this work, an efficient Intellectual Control system has been proposed to stabilize the FACTS devices placement. The Squirrel Search Optimization is adapted with an intellectual control system to enhance the steady-state voltage stability of FACTS devices. The proposed system has been evaluated with the assist of IEEE 14 and 26 standard bus systems to handle the multi-objective functions like cost, reduction in power loss, reducing risks, and maximizing user’s benefit. These multi-objective functions facilitate to attain the optimal placement and load flows at various sites. The simulation can be carried out with MATLAB/SIMULINK environment and the results manifest that the proposed system outperforms well when compared with existing approaches.
Introduction
The growing restrictions towards energy resources and economic constraints tremendously influence the functionality of power systems towards load ability and stability [1]. To apply maximal capacity of transmission lines during overloaded lines, utilities encounter more time-consuming solutions and expenses like the construction of newer lines [2]. Some operational measures attempt to fulfill the goals like active/reactive power flow control and topological variations in line switching. Therefore, this goal can be achieved by the FACTS Devices (FD).
There was a greater need for alternative technology made of solid-state devices with fast response characteristics. The need was further fuelled by the worldwide restructuring of electric utilities, increasing environmental and efficiency regulations, and difficulty in getting permits and the right of way for the construction of overhead transmission lines. This, together with the invention of the Thyristor switch (semiconductor device), opened the door for the development of power electronics devices known as FACTS controllers [3]. The path from historical Thyristor-based FACTS controllers to modern state-of-the-art voltage source converters-based FACTS controllers was made possible due to rapid advances in high-power semiconductors devices. FACTS controllers have been in use in utilities around the world since the 1970 s when the first utility demonstration of the first family of FACTS named as Static Var Compensator (SVC) was accomplished. Since then a large effort was put into the research and development of FACTS controllers.
The FD can match with this aforementioned alternative solution for enhancing the efficiency of the prevailing network models by re-dispatching line flow patterns with a limited thermal capacity. This can be carried out during the contractual needs among system load and stakeholders [4]. Typically, the FD works by absorbing or supplying reactive power, thereby controlling transmission lines series impedance and increasing or decreasing voltage or by phase angle [5]. But, the advantages of the FD rely over the type, size, location, and number in the transmission system. Various research works have been examined and analyzed in the field of FD placement to enhance the functionality of power systems [6].
When considering these two factors, the heuristic approaches are considered first to determine the effectual solution (number, location, type, and value) for a provided objective or fitness function [7]. In particular, FD placements are based on placement algorithms that include Tabu Search, Genetic Algorithm, Particle Swarm Optimization, and Harmony Search algorithm. Likewise, the analytical approaches are also considered for placement or allocation of FD to fulfill the system requirements [8]. For instance, Jacobian Matrix methods and Line Flow Index are also utilized for the placement process. The power-angle characteristics are also exploited for FD placement. Further, Mixed Integer Linear Programming, Extended Voltage Phasors approach, and Locational Marginal Price are some other approaches employed for FD placement [9–11].
Single-type devices are generally considered over chosen locations. The FD placement process is initiated for determining the optimal values and locations for chosen devices like Thyristor-Controlled Series Compensation (TCSC) and Unified Power Flow Controller (UPFC) [12, 13]. The adaptation of various mixed devices of FD gives advantages to some single devices. The optimization approaches are applied for demonstrating optimal locations, types, and values of diverse FD simultaneously [14, 15]. Hence, the appropriate optimization algorithm is required to achieve the optimal placement of FD.
In this paper, a new Intellectual Control (IC) system has been formulated with the assist of Squirrel Search Optimization (SSO) to stabilize the FD placement. In the proposed IC-SSO system, the parameters are tunable based on users’ requirements. The placement process can be carried out in FDs and users have to choose the desired types and numbers. The power network is chosen based on the number of IEEE bus systems. In this work, the IEEE 14 and IEEE 26 are exploited as IEEE bus systems where the factors like angle, load, and voltage are considered in the system. The proposed SSO algorithm facilitate to determine the load flow analysis and bus data in the FD system. These functionalities are carried out to maximize the power system stability. Thus, the proposed IC-SSO system stabilizes the internal dynamics by rotor voltage control and improves the dynamic behavior of FD after clearing faults.
The significant contributions of the proposed model are as follows: The steady-state analysis of the IEEE test power system has been conducted by incorporating two FDs, namely: UPFC and TCSC. Such FDs are most popularly applicable to compensate transmission losses, reactive power, improve power transmission capability within the specified voltage profile. A mathematical formulation has been performed for UPFS and TCSC static model. A novel squirrel-based optimizer is designed to achieve better fitness for the modeling of an intellectual controller. It also stabilizes the internal dynamic to enhance the dynamic nature of the FDs. Further, it improves the global stability of the model without any loss. The proposed IC-SSO system deals with multi-objective functions such as power loss reduction, cost, maximizing user’s benefits, and reducing risks. The minimization of voltage deviations and cost functions are evaluated with IEEE 14 and IEEE 26 standard bus systems.
The remainder of the work is formulated as follows: Section 2 explains the background studies based on FD model. Section 3 depicts the proposed IC-SSO system for optimization and effectual placement of FD. Section 4 demonstrates the numerical results and discussions. Section 5 illustrates the conclusion and future research directions.
Related works
The following section summarizes the various background studies related to FD.
In [16], a network planning problem has been introduced to merge the Remote Power Panel and TCSC device allocation. The ultimate objective of this work is to determine the reduced transmission lines based on investment costs, TCSC devices, total cost generation, and load curtailment penalty. Wind and load scenarios are included in the anticipated model with the use of linear AC power flow. It is acquired from outcomes to determine TCSC devices for the network to diminish investment costs and objective function values of transmission lines. Therefore, balance among installation costs and CWE is acquired at lesser objective function by initiating TCSC.
A Static synchronous compensator (STATCOM) has been presented to address the clearing power uncertainty problem of FD [17]. Risk towards load loss, branch overflow, and wind limitation are determined in both constraints (with limitation) and objective function (penalties). The term related to risk towards the UC model is linearized and realized using convex functional characteristics. Descriptive samples and case studies determine the model enhancement constructive schedule using risk recognition with diverse branch power flow and reserve margins. The linearization model provides no stronger assumptions over uncertainty distribution and therefore extensively applicable. The anticipated model resolves the wind power uncertainty in a denser manner where the model can be resolved with superior efficiency and can be adapted to larger power systems.
In [18], a new stochastic optimization approach has been proposed for optimal bidding methods of EV aggregator. Numerical outcomes of modified 118-bus system and 6-bus system specifying efficacy of anticipated approach for examining aggregator’s optimal bidding approach. The outcomes also determine the larger percentage of aggregators pay off that stem out regulation services and aggregator that could effectually determine risk with the use of CVaR. The anticipated approach is utilized for EV aggregator for carrying out risk-payoff analysis with stochastic market operations.
A SVC has been developed to attain efficient FD. A data-driven approach to construct appropriate intervals among distribution factors maintain the physical relationship between constant hour average power and wind speed [19]. This approach is more appropriate for uncertainty sets in RCC-OPF and RUC that are interpreted based on WPG uncertainty and variability. Some case studies determine the RCC-OPF model with uncertainty sets that work well with numerous benchmarks with reliability and cost metrics.
In [20], a new method has been presented for Static Synchronous Series Compensator (SSSC) and Interline Power Flow Controller (IPFC) that optimally provide the diverse FD in the de-regulated market environment. It is dependent on the complete cost approach to determine the FD’s annual cost, customer benefits, and operational cost. The consequences of load growth and wind generation are resolved. The process is designed as a two-level mixed-integer non-linear optimization crisis. The annual cost is considered an objective function where line flow constraints, voltage constraints, and generator capacity constraints are considered as preliminary constraints. The consequences towards optimal allocation of FD comprises reduced cost compensation and increased social welfare to market participants owing to the generation of load shedding and re-scheduling.
An approach for evaluating line-based overloading risk with a correlation of load-power and wind generation considerably. The possible line overload has been evaluated through PEM and PLF calculation [21]. By merging the probability towards line overload severity, risk indices are attained. The efficiency of the anticipated model can be validated with modified IEEE 18 and IEEE 30-bus systems. Numerical outcomes demonstrate that the anticipated model is more appropriate for assessing line overload risks in wind-based PS. It is noted that uncertain wind speed distribution parameters and types may influence risk indices of overload line. Consequently, nominal scaling and shape factors of the Weibull distribution have to be changed more appropriately.
In [22], a new optimization approach has been introduced for demonstrating parameter settings and optimal UPFC and TCSC location in a de-regulated power market. The anticipated model is applied over modified IEEE 118 and IEEE 14 bus systems. Tested outcomes proved the efficiency of the anticipated model. Here, maximizing the social welfare, reducing objective function, and maximizing profit are achieved with UPFC and TCSC cost model and wind power generator. It is noted: a) UPFC and TCSC are applied for resolving crisis after installing generator over entire systems; b) SW enhances UPFC and TCSC installation in modeling pool; c) Locational marginal price of systems are considered for reduction of TCSC/ UPFC with WPG; d) Voltage is enhanced during UPFC operation during WPG.
In [23], a risk evaluation with an adaptive USTWPP model has been proposed that is anticipated for refining the prediction approach and reflects diverse preferences over WPP models of certain systems. The efficiency of the anticipated model is proven during the simulation process. It is observed that the anticipated online model matching framework and offline optimization are enlarged with the wind speed prediction model for spatial correlations. Initiation of NWP data improved the sample pertinence for every subset model. In [24–27], a Complex Dynamical Networks (CDN) has been evaluated to analyze the complex systems. It manipulates the dynamic characteristics of the complex model. The control design parameters are tuned in order to enhance the sensitivity and stability of the complex systems.
Based on the aforesaid analysis, several existing models are failed to attain the optimal placement of FD. The inappropriate placement causes instability and reduces the steady-state performance of FD. Moreover, the parameters are not properly tuned during the optimization process. The existing models are also lagged to concentrate on the multi-objective functions of FD. This will affect the load flow and bus data analysis of wind power generators. To overcome this crisis, a new IC-SSO system has been introduced to manage the multi-objective functions and attain the effectual placement of FD.
Proposed methodology
The proposed IC-SSO system can be employed to determine the load flow analysis and bus data in the FD system. It also stabilizes the internal dynamic by rotor voltage control and improves the dynamic behavior of FD. Initially, the mathematical formulation of UPFC and TCSC are analyzed with cost computation and social welfares parameters in the proposed IC-SSO system. Subsequently, the SSO optimization approach is designed to achieve better fitness for the modeling of an IC. Finally, the IEEE 14 and 26 bus systems are considered for the computation process.
Mathematical formulation
The static modeling of UPFC and TCSC is considered for enhancing the FD voltage stability. The economic profit determination can be carried out by optimal allocation of UPFC and TCSC with wind power generators over the market.
UPFC static model
A UPFC model can be performed as flexible FD for power and voltage flow regulation over the transmission line. It shows competency to adopt control variables like phase and magnitude angle of reactive current and series injected voltage by shunt connected voltage source converter independently or simultaneously. It operates as inductive or capacitive compensation by altering series reactance over transmission line towards shunt reactive power injection to the connected bus. In this work, the reactance is connected in series for altering reactance of variable shunt reactive sources and transmission lines added towards the connected bus of the same line. This model also includes two back-to-back voltage source converter connected via the DC link. The UPFC reactance will be transmission line reactance and it is formulated as:
The UPFC series reactance-based working range is fixed as –0.7 X LINE and 0.2X LINE . With 100%compensation, it causes a series reactance problem over the system. It is 70%normally line reactance for compensation. UPFC shunt converter shows operating characteristics known as capacitive or inductive. When inductive, it absorbs the system’s reactive power whereas the reactive power is given to the system during capacitive. Here, Q UPFC is extracted or injected reactive power by voltage source converter from bus line where UPFC is placed. The operating function of Q UPFC is considered as -100 ⩽ Q UPFC ⩽ 100 .
The TCSC comprises a capacitor parallel to an inductor that is connected with opposite-poled thyristors. By variation thyristors angle, inductor reactance is changed and causes change ineffectual TCSC impedance. When TCSC is in series with the line, it diminishes transfer line reactance is associated with bus ′i′ and ′j′. It improves maximal power moved to the line for reducing the reactive power losses. It works as inductive or capacitive compensation by changing reactance directly of the transmission line. The TCSC static model is measured for the construction of variable reactance connected with the transmission line. It is a transmission line reactance which is expressed as:
The cost computation of FD is extremely significant over the financial circumstances of the power system. Because of the higher cost for placing FDs, it is essential to apply cost-based optimization for determining UPFC or TCSC are cost-effective when placing them in various locations during device installation. The cost computation process is formulated as:
The overall cost investment of FD are computed as:
The hour-wise and annual cost computation of FDs is expressed as:
In this work, the interest rate and lifetime is assumed as 0.10 and 25 years respectively.
A cost-based on social welfare metric is determined as the difference of energy benefits to social willingness to pay the energy cost and demand. When it is provided by a particular supplier, power quality and price is formulated as:
The benefits towards customers are expressed as:
Therefore, the cost computation based on social welfare is mathematically expressed as:
Based on the above equation, social welfare is expressed as the integration of customer benefits and power generation cost. To enhance the system performance, the customer benefits should be maximized and minimizing the power generation cost. The objective function is measured based on assumptions like power network with total generators NG, total buses NB and loads ND. It is provided for maximizing customer benefits and reducing system cost generation and reducing UPFC and TCSC investment costs. It is expressed as follows:
In this work, the objective functions include customers’ benefits, FD investment cost, and power generator installation cost. The generator specifies the variable capacities of wind generators. The essential function is to reduce the objective function. In particular, it reduces the cost function, maximizes the customer benefits, and reduces the investment cost of UPFC and TCSC.
The objective function will be determined as equality constraints where the power flow equation is formulated as below:
The real & reactive power limits are expressed as:
The UPFC and TCSC constraints are expressed as:
Next, an optimization approach is implemented to examine the cost and optimal location of UPFC or TCSC to acquire the minimal objective function value. In this work, a new SSO optimization is applied for locating UPFC or TCSC and changing every parameter for certain ranges and acquires an optimal solution. The optimal location of UPFC or TCSC are determined based on objective function with minimal values.
The following section discusses the optimization approach utilized for FD placement in order to recognize the stability of the device. Typically, the SSO algorithm is a powerful optimization approach inspired by the natural foraging characteristics of flying squirrels.
The key feature of the SSO algorithm is the search space exploration based on seasonal monitoring conditions with respect to normal, oak, and hickory tree. It maintains the population diversity and improves the exploration condition. It helps in real-time controller design problems and suffers from local optimal and pre-mature convergence. The convergence rate of SSO is completely designed for exploitation and exploration. The performance of the model relies on fine-tuning of exploitation and exploration problem. Thus, there is room for improving the convergence rate and accuracy.
Initialization
In the n- dimensional optimization issues, the position of squirrels is represented by d-dimensional vectors as follows:
The fitness function of every squirrel f (X i ) will be computed based on user-defined fitness function and corresponding values are determined using search of food source (acorn tree, hickory tree, and normal tree).
Diffusion and spatial variation
The N i tree lies in the certain range where i th squirrel identifies the tree over the land to fulfill the optimal food source that lies over the range. This is termed as a spatial variation which is formulated as:
The position-based fitness values for all squirrels are sorted in ascending manner. The squirrel over the hickory tree is considered to have lesser fitness value. The squirrel over acorn tree is considered to the best fitness value, this will move to the hickory tree. The remaining squirrel moves to the normal tree. This is also considered to move towards a hickory tree by random selection after fulfilling the daily needs. Some of the remaining squirrels will move to acorn trees for fulfilling daily requirements.
Moving to the new location
The foraging characteristics of squirrels are influenced by predators, and their natural characteristics are designed with the updated mechanism of predator probability (P d ) which is represented as 0.1. The diverse characteristics are encountered in the foraging characteristics of squirrels. It is assumed that, while in the absence of predators, these squirrels pretend to move smoothly and start searching for food in their corresponding location. During the presence of predators, it is intended to be cautious and shows random walk towards the hidden nearby locations.
In case 1: Squirrel in acorn tree moves to hickory tree and position is determined as:
In case 2: Squirrel over normal tree moves to acorn tree and its position is provided as in Eq. (26). Here, R2 ranges from [0, 1].
In case 3: Certain squirrels over normal trees are fulfilled with their daily needs and move towards the hickory tree for storing the nuts over there. This is eaten during a shortage of food sources. The value of R3 ranges from [0,1]. The newer locations are as follows:
The foraging moves of squirrels are drastically influenced by seasonal changes encountered. Hence, the observations towards this condition are considered based on conventional squirrel search. It is trapped with local optimal solutions. The characteristics are considered as follows:
where
The squirrels are unable to search for food in forest regions actively in winter and look for food in newer directions. The squirrels are randomly relocated to acquire the finest winter food sources. The squirrels are relocated and levy flight is expressed as follows:
The Levy distributions offer superior search space exploration and mathematically expressed as follows:
The convergence normalization, maximal number of iterations, fitness function accuracy, and maximal running time are generally utilized as convergence criteria. Afterward, the maximal amount of convergence normalization and iterations are utilized as stopping criteria. The maximal amount of iterations and convergence normalization is specified as follows:
The flow diagram of the proposed system is depicted in Fig. 1 and the step-by-step process of Fig. 1 is as follows:
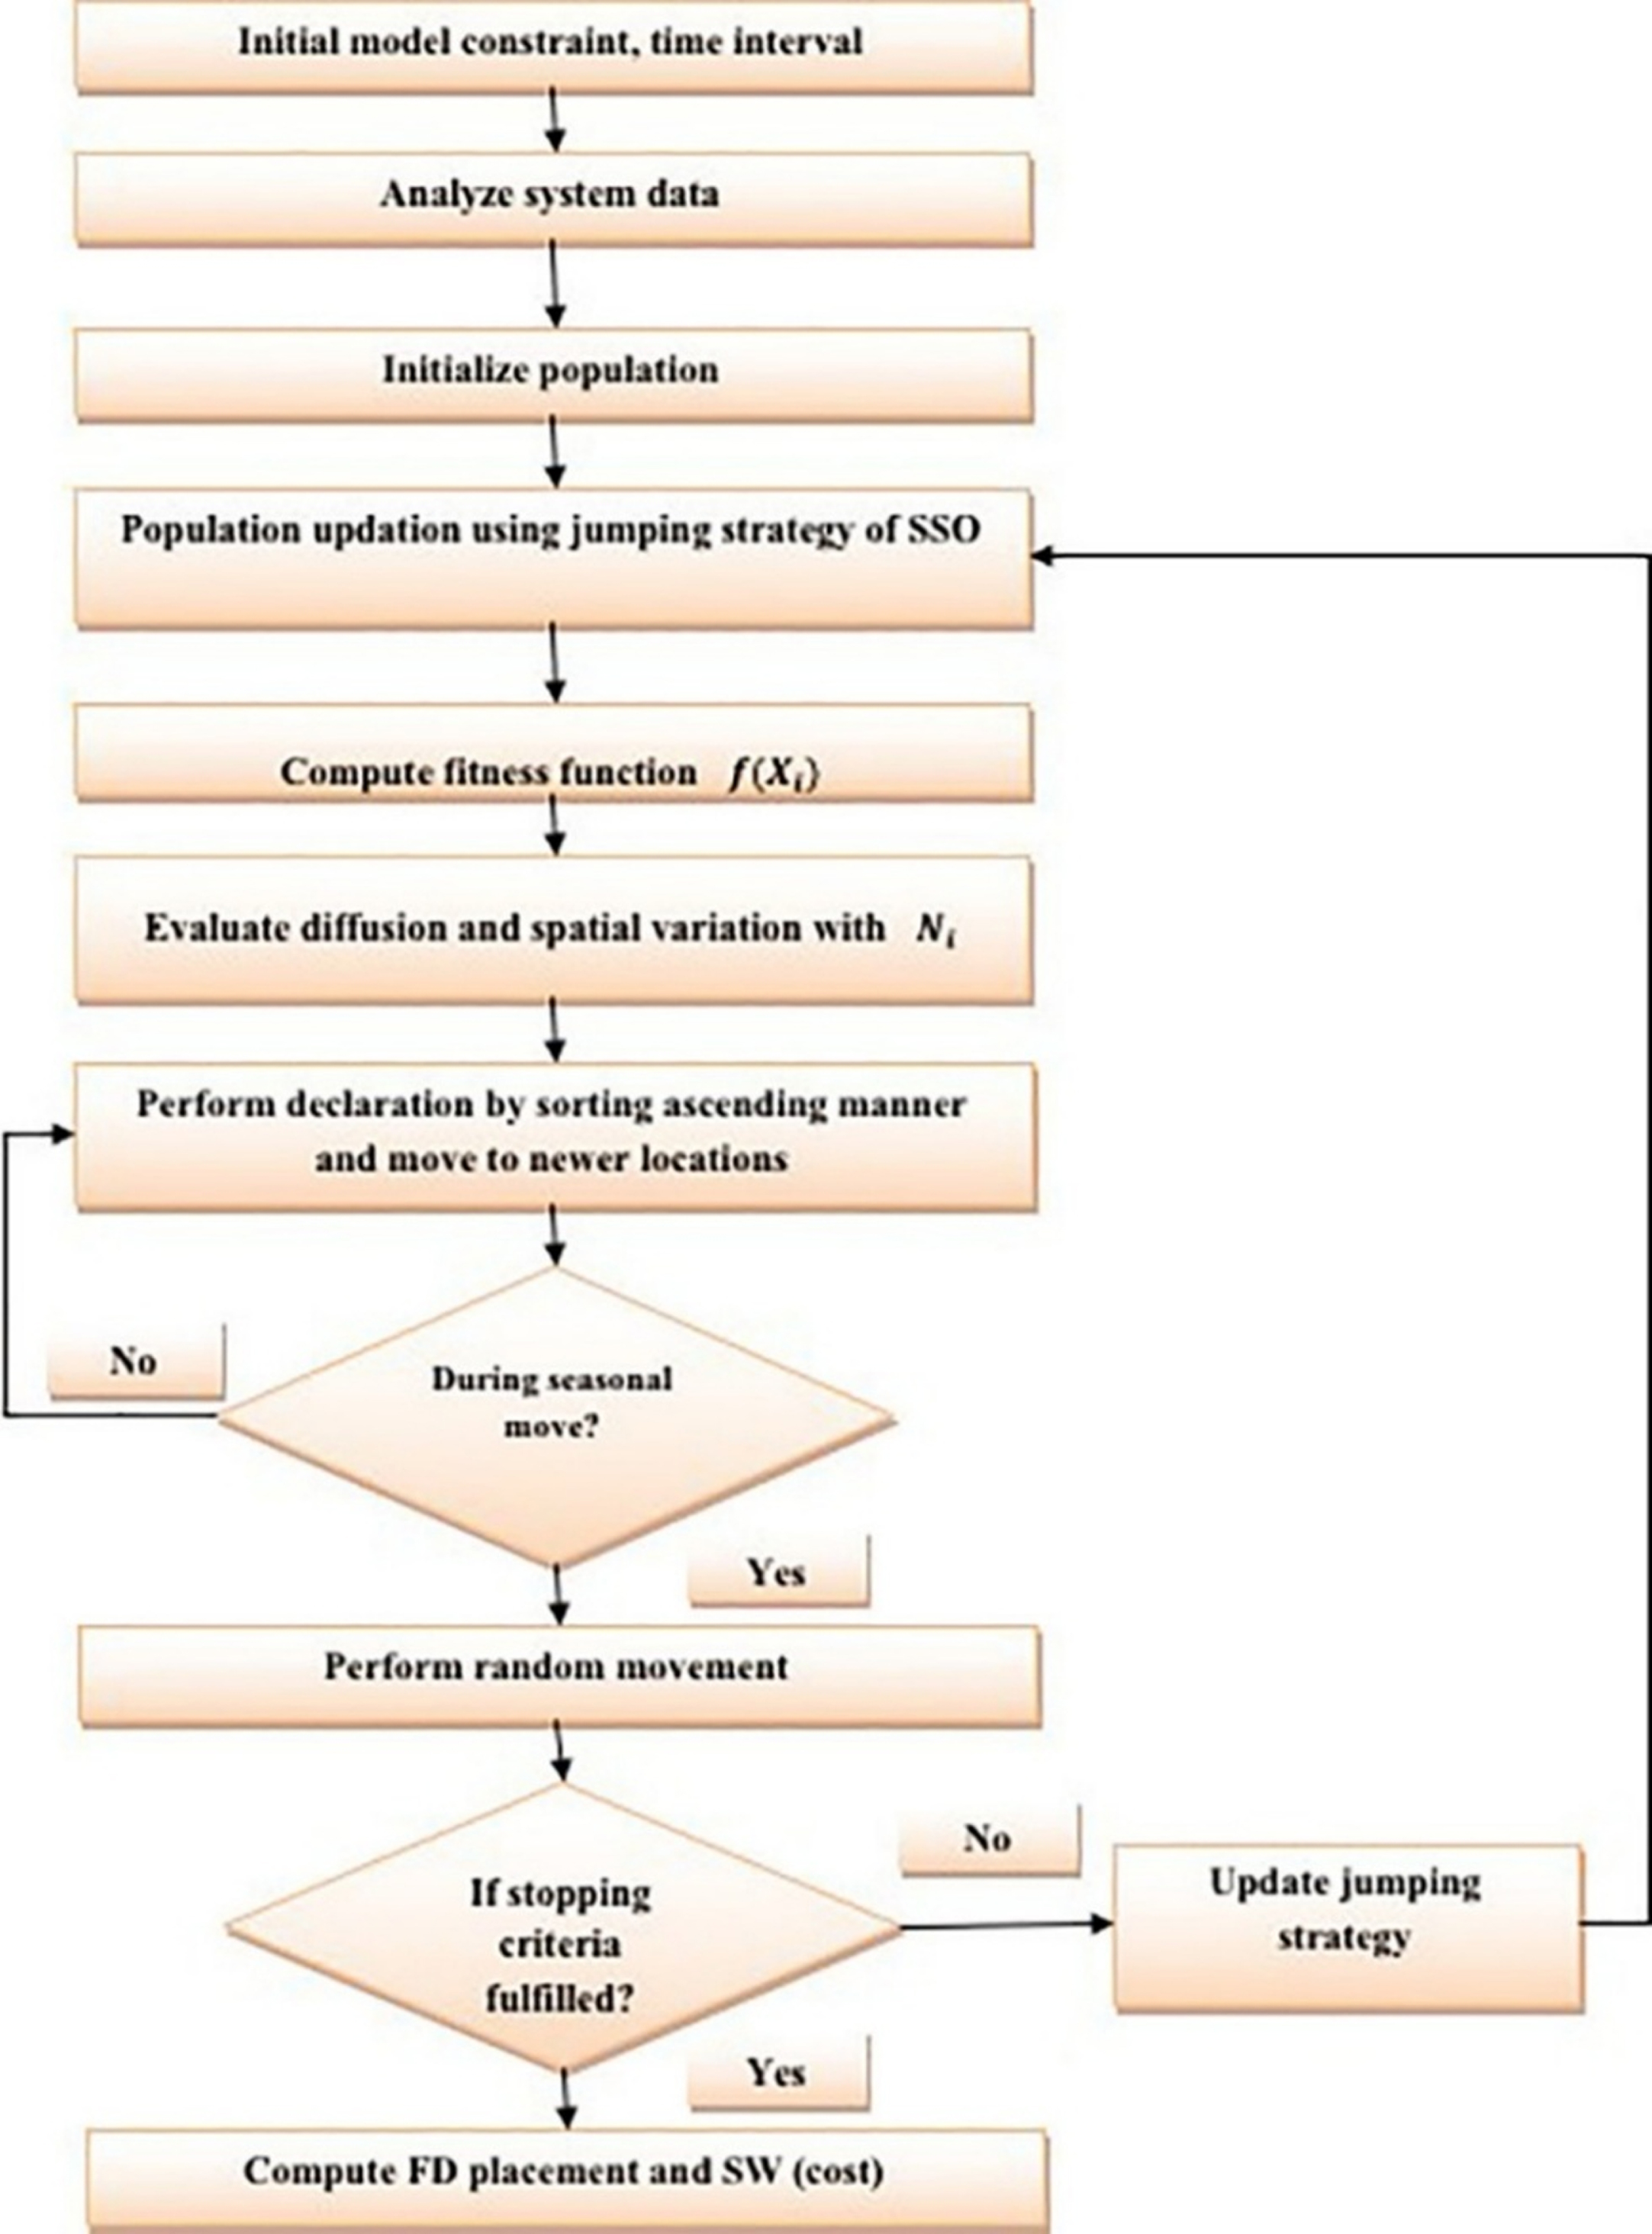
Flow diagram of proposed model.
Initialize the parameters of SSO i.e., number of squirrels, dimension, and maximum number of iterations (parameter initialization, constraint, and time intervals).
Initially generates the random location for the squirrels.
Calculate the fitness for each location of flying squirrels and then sort them in accordance with their fitness values.
The fittest value will be of that flying squirrel, located at hickory nut tree, then next three fit values will be of flying squirrel which is on acorn trees and then remaining will be on normal trees.
Select any of the flying squirrels located at normal trees and target them to direct toward hickory nut tree and remaining to the acorn trees.
Finally, evaluate the FD placement and SW.
The functions regarding generators, line limits, and demands are deliberated in this section. The system includes a 20 MW wind generator (bus 8). It can be attained with the support of bus voltage, real and reactive power. The load is grouped as buses 5, 10, and 12. Then, the successive load is grouped as buses 4, 11, and 13. The capacity and optimal locations of FD work under normal operating conditions. The benefits and cost of FD are based on FD installation. When adding FD, the social welfare is increased. Similarly, the power losses and load ability are extremely improved. It greatly mitigates risk towards line congestion and voltage violations that facilitate higher loads. The enhancement in supplied load owing to FD is proven for the certain time period with growth towards customer loads.
The average uninterruptible and interruptible load at every bus has to be exposed. When the system is FD connected, the bus voltage is enhanced and maintains 0.95 p.u. Congestion occurs in line under loading conditions. Power flow towards transmission line improves FD installation increased by system load ability. Average active power loss is diminished drastically after FD installation. Owing to FD capabilities, the performance outcomes are changed slightly. It is proven rounding-up may not avoid FD from assisting system stability, security, and enhancement in social welfare. It is practical to consider FD placement for contingency states which is alike of the normal state. The optimal FD state has to be identified during the contingency state. It is noted that total essential FD size changes from one state to another. Generation cost for load shedding and re-scheduling are diminished for contingencies owing to FD placement. Here, Social Welfare (SW) is enhanced for contingency towards FD.
UPFC and TCSC installation with IEEE 26 bus system
IEEE 26 bus system comprises of 20 load buses, 6 generating buses, and total active power generation avoiding slack bus system with 2140 MW. Total load is equal to 1276 MVarand 2526 MW, base power is considered as 100 MVA where total reactive power compensation is 22 MVar. It has 46 transmission lines and 7 transformers. Bus 1 is determined as a slack bus. At load bus, reactive power is raised with collapse system point. Reactive power differences among loading point and collapse point are determined as stability margin chosen as voltage stability index. By increasing the bus load, it leads to system collapse which is faster than other bus systems. The contingency analysis includes one transformer and transmission line to identify outage cases. The wind farm connected to bus 2 and voltage stability is analyzed and evaluated with traditional systems.
Numerical results and discussions
The simulation can be carried out in the MATLAB environment. The modified IEEE 26 and IEEE 14 bus system have been determined to be an effectual method when implemented with the proposed IC-SSO. This system comprises 5 generators, 20 transmission lines, 14 buses, and 10 loads. Overall execution is considered to fulfill the following cases. a) The relationship among objective functions (IC-SSO) and customer benefits; b) Selection of the appropriate bus for generator placement; c) Congestion line measurements in FDs; d) placement based on FDs based on economic risks.
Various scenarios are generated based on transmission lines, loads, and generators. The degree of risk is identified by MVar and MW respectively where the MVar and MW are inversely proportional to the system risk. It shows that the objective function is inversely proportional to MVar and MW with maximal and minimal values. The objective function is related to system costs. Therefore, the risk is reduced with minimal objective function is desirable.
Similarly, the customer benefits are also proportional to MW and MVar. The wind farm is selected and positioned for reducing risk and gets reduced system cost. The wind power is expressed as follows:
Table 1 depicts the IEEE 14 bus system for FDs placement by measuring voltage magnitude, angle degree, load generation injection (MW and MVar) respectively. Table 2 shows the IEEE 26 bus system applied for FDs placement. Table 3 depicts the power at bus and line flow and line loss transformer by measuring MW, MVar, MVA, and Tap respectively. Table 4 demonstrates the load flow analysis with power at buses and line flow, line loss transformers.
IEEE 14 bus systems
IEEE 26 bus systems
Power at bus and line flow
Load flow analysis
From the aforesaid Tables, it is manifest that the generator placement is more sufficient for reducing system risk by maximizing risk factors. The optimal FDs have reduced the risk based on power flow via transmission lines. It identifies the congestion of system lines where FDs are placed. MVar and MW values are considered to be more optimal for placement. The values are positive after FDs devices. The system risk is reduced with FDs presence. However, MW and MVar values for UPFC (less negative) are lesser than TCSC. It is observed that UPFC is extremely powerful than TCSC. Hence, it is concluded that risks are minimized to a higher rate after FD placement. The optimal FDs placement provides reduced cost generation and maximal user benefits. According to the proposed IC-SSO feature construction, UPFC is extremely effective to reduce system risks in line flow and economical risks.
Figure 2 depicts the wind generator installation cost at every bus without generators and FDs. The x-axis shows the bus number and the y-axis plots the cost with 1010. The cost seems to hit the peak with bus number 2 and drops gradually. Figure 3 illustrates the FDs installation cost without generators. The x-axis shows the bus number and the y-axis shows cost where the cost over bus 2, 4, and 6 is 0 while the hit is identified in bus number 8 and gradually drops.
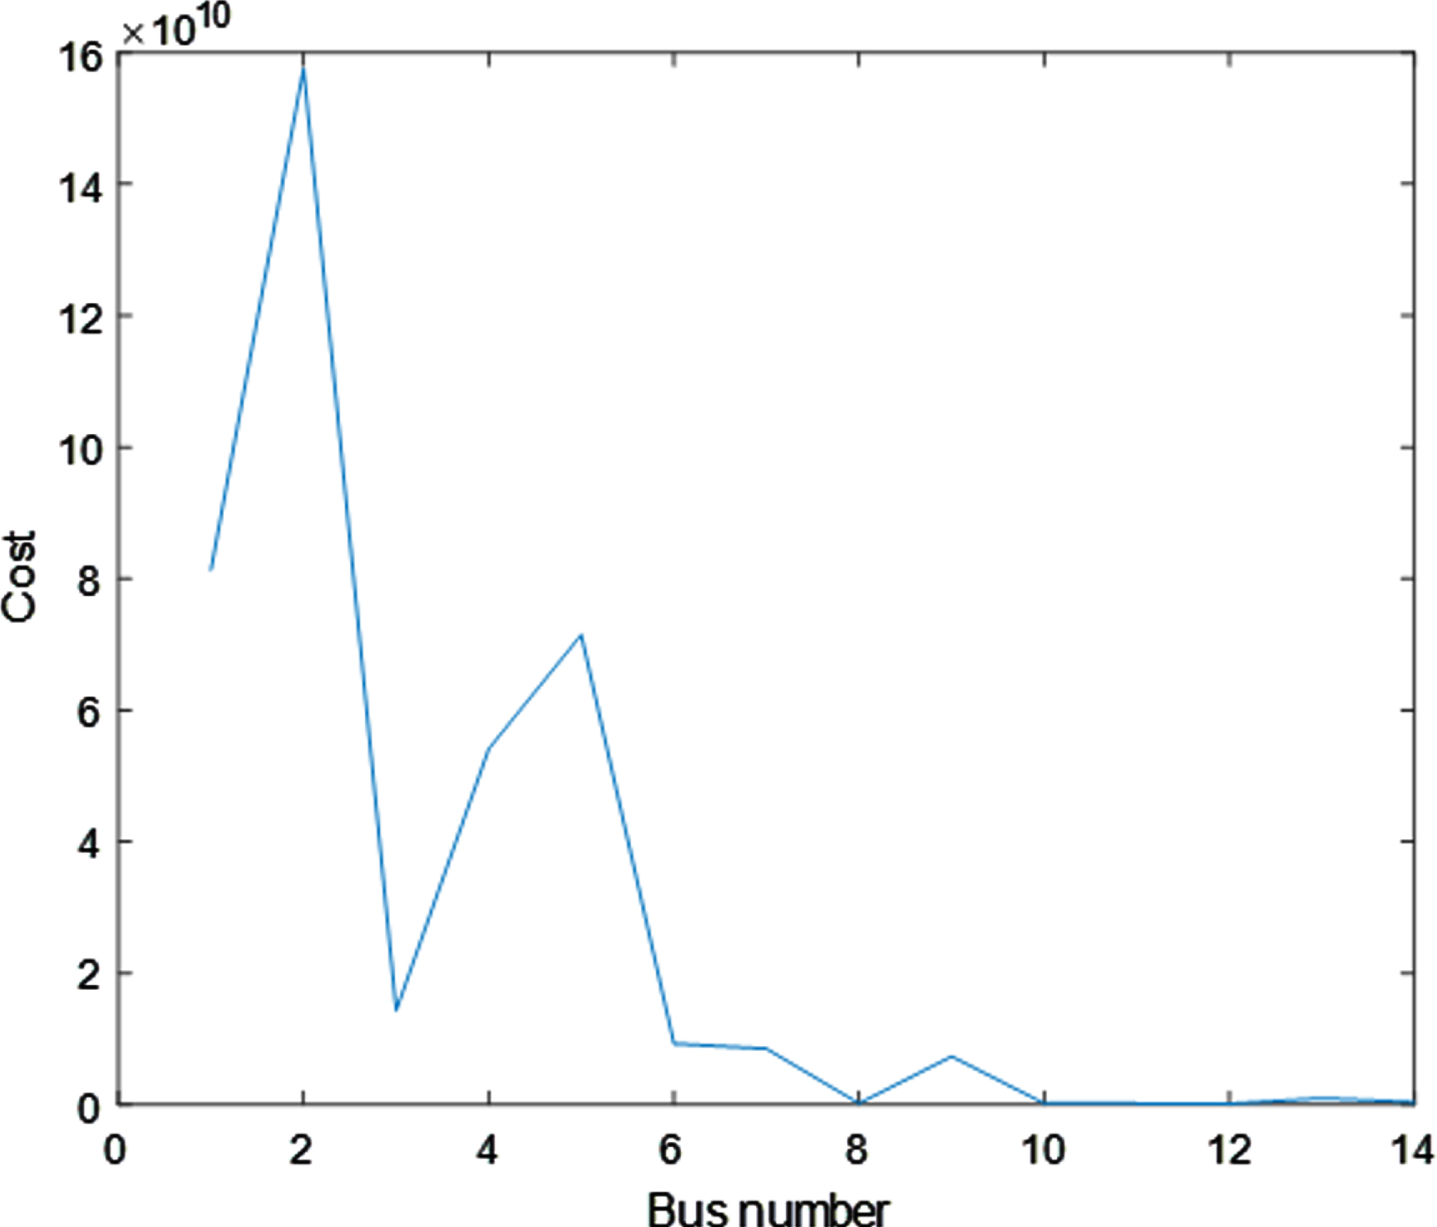
Wind generator installation cost at each bus without generator and facts.
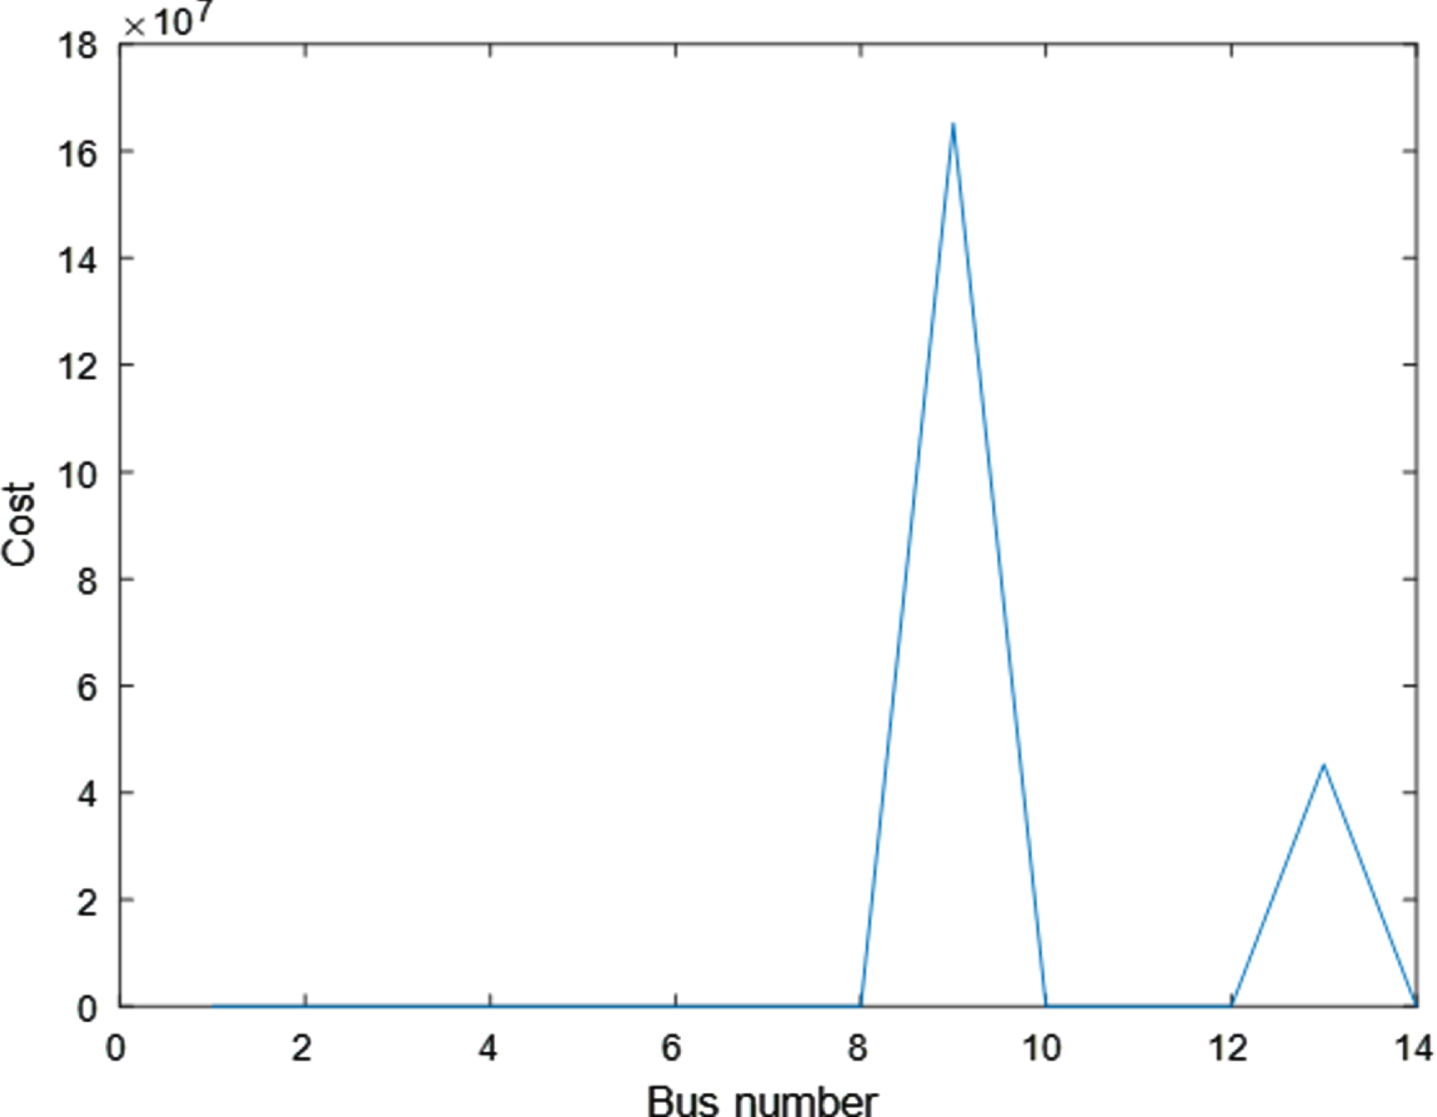
FDs installation cost without generator.
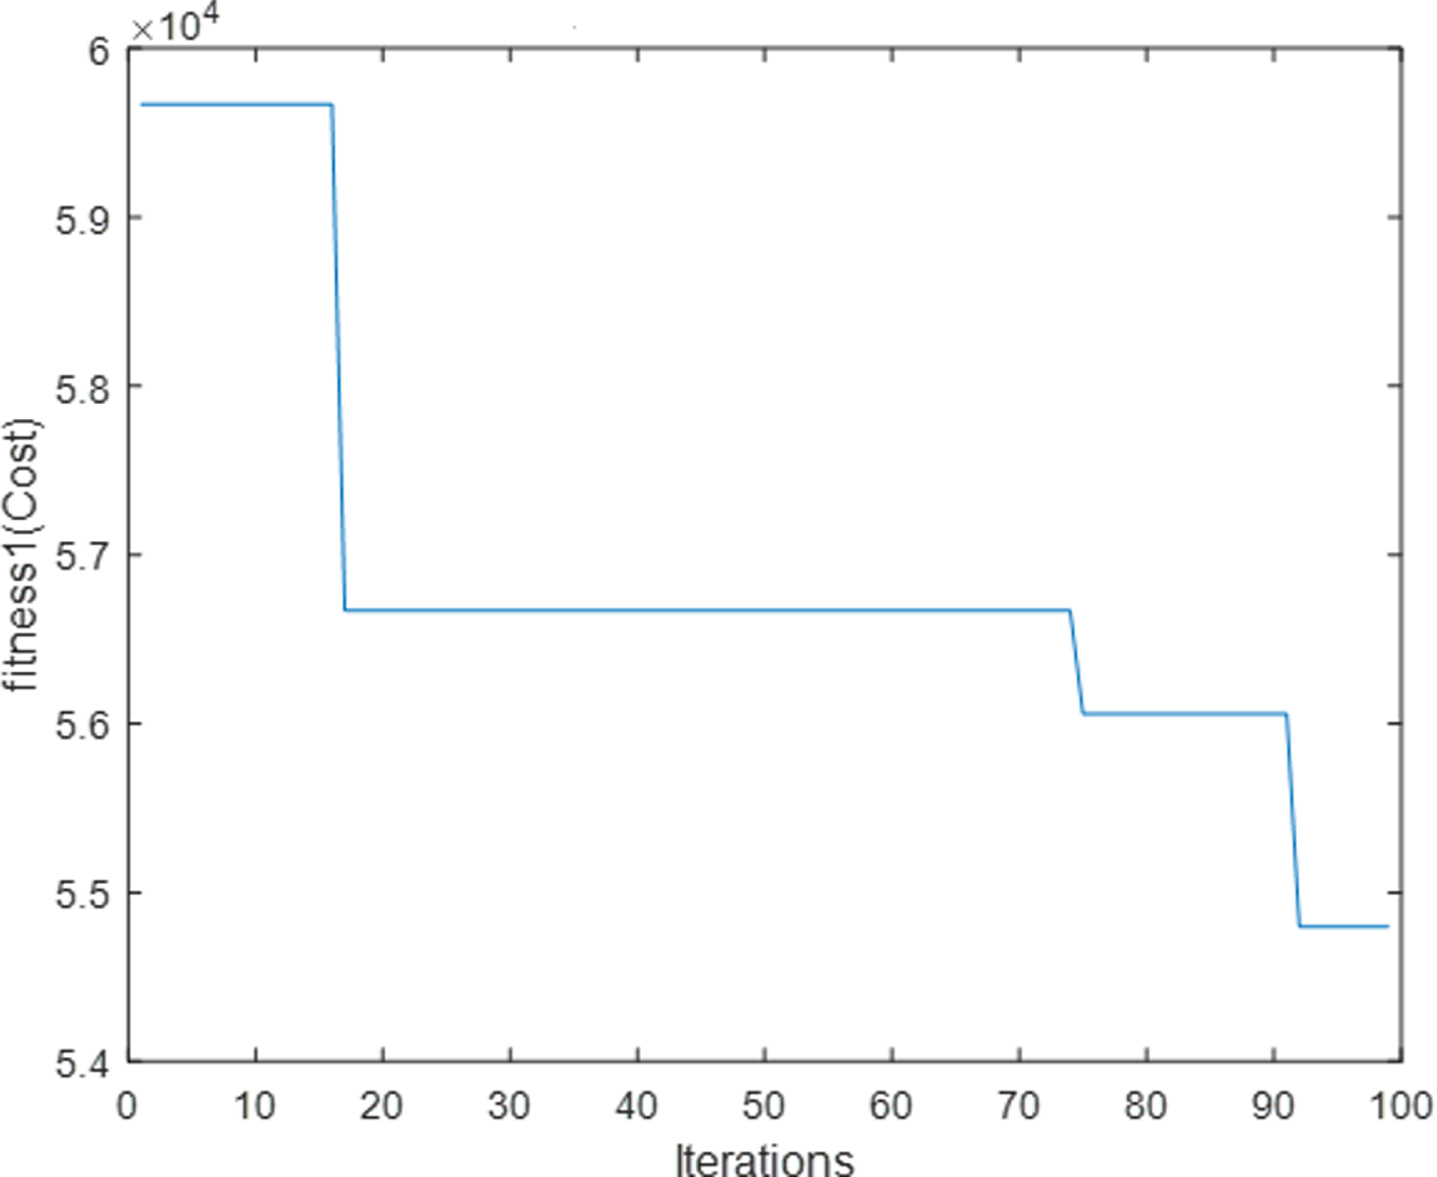
Figure 4 depicts the TCSC based FDs with 14-bus system (Fitness 1 cost) with the generator. Here, x-plots the total number of iterations as it ranges from 1 to 100. While the y-axis plots fitness function 1 (cost) based cost evaluation. SSO-TCSC based 14 bus system shows 38350 for generator cost.

TCSC FDs 14-bus system (Fitness 1 Cost) with generator.
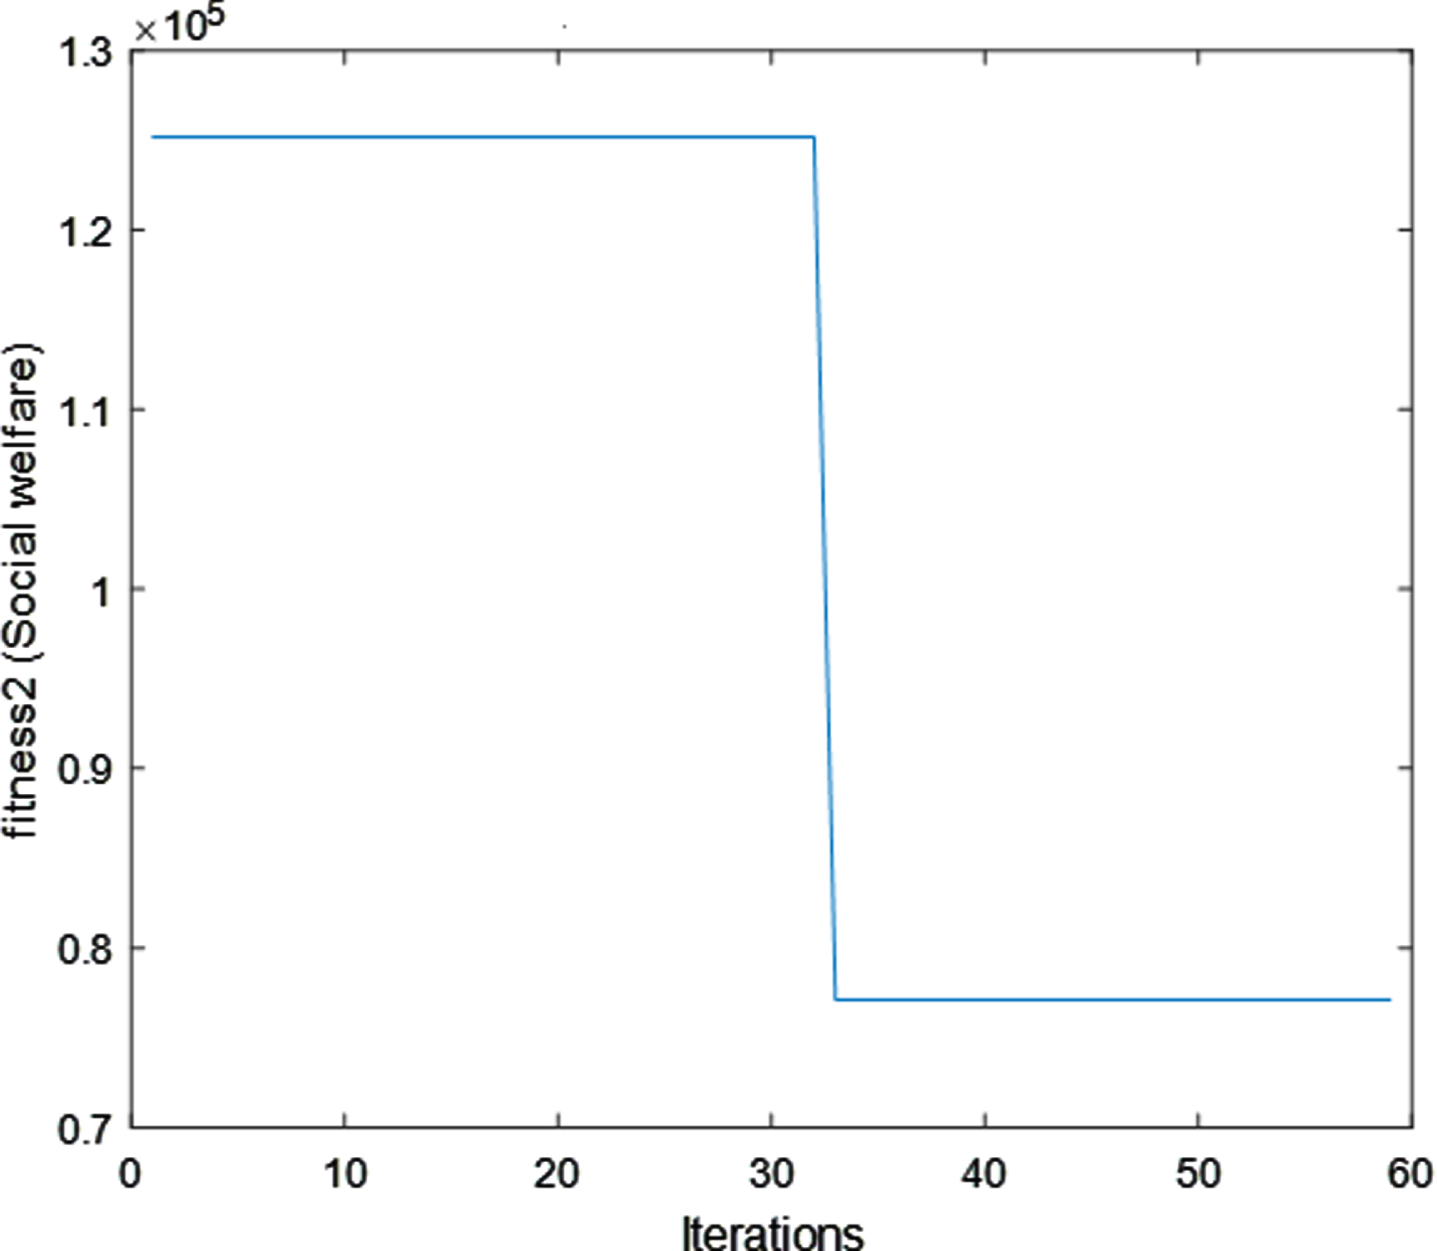
Figure 5 depicts the SSO-based UPFC with the 14-bus system (Fitness SW) where the x-axis plots 60 iterations and the y-axis plots fitness 2 (social welfare). The minimum SW of this model is 929780 with 19 buses. Figure 6 depicts SSO-UPFC 14 bus system (Fitness 1 cost) where the x-axis plots 100 iterations and fitness value 1(cost) where the fact cost is 364330 with 2 buses.
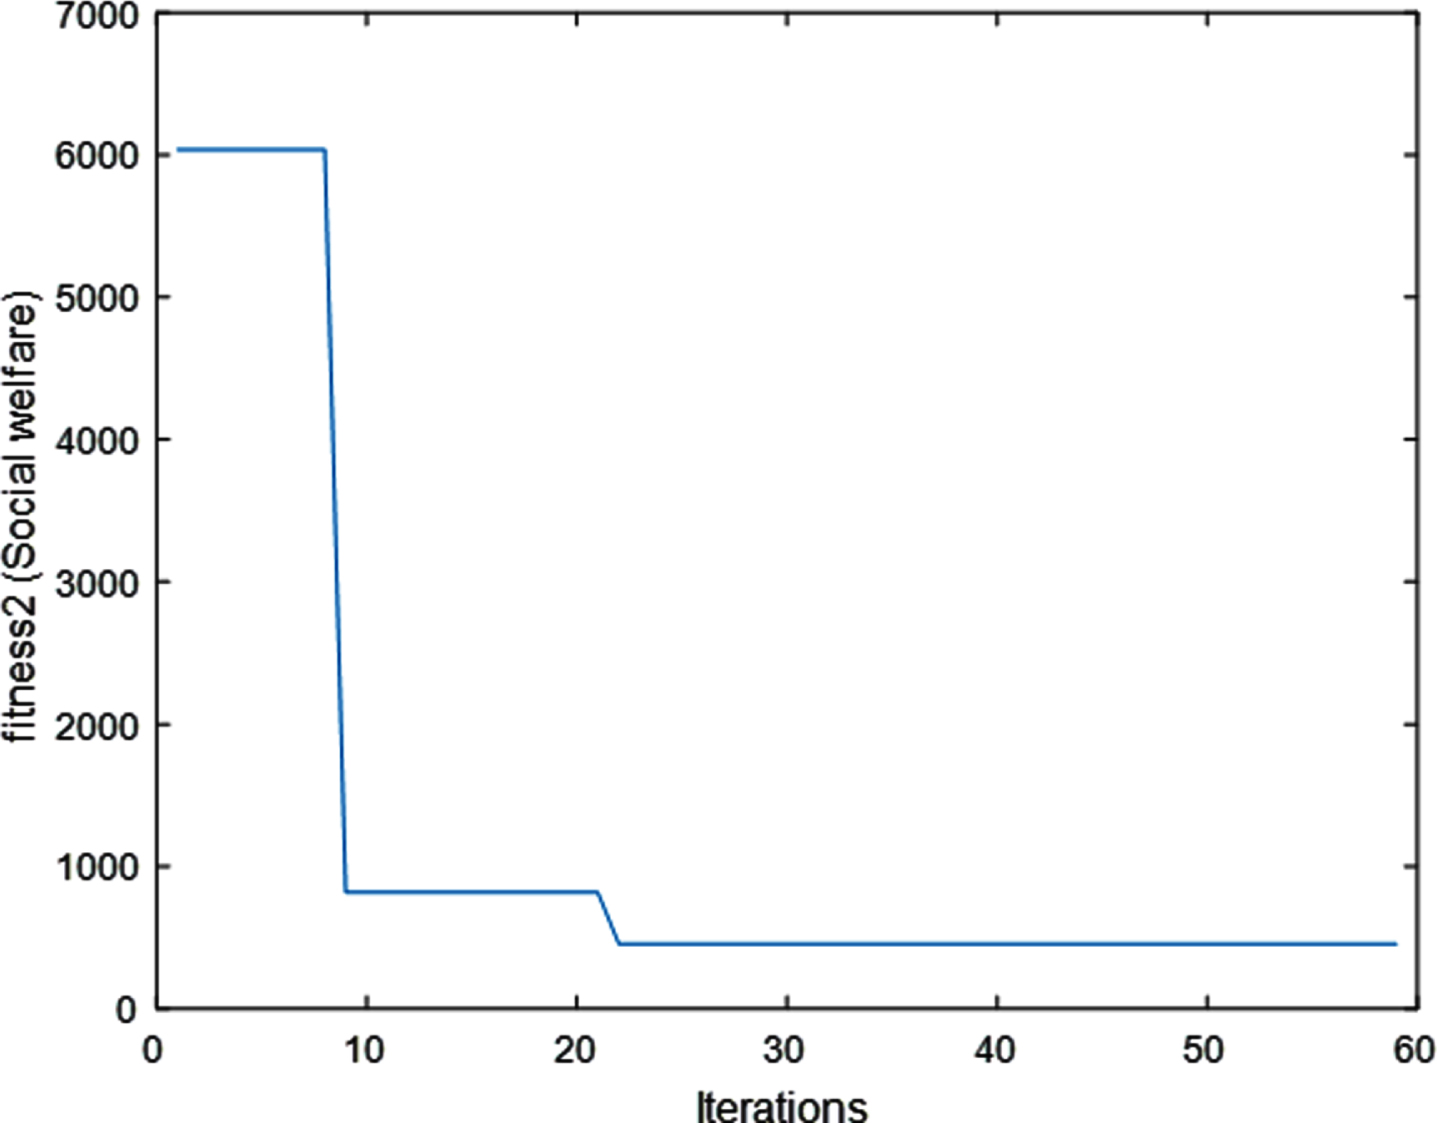
SSO-UPFC-14 bus system (Fitness 2 SW).
SSO-UPFC-14 bus system (Fitness 1 cost).
Figure 7 demonstrates the SSO-TCSC 26 bus system (Fitness 2 SW) where the x-axis plots 60 iterations and the y-axis plots fitness 2 (social welfare) for 26 buses. Here, the minimum SW cost is 438280 for 10 buses. Figure 8 depicts the SSO-TCSC IEEE 26 bus system (Fitness 1 cost) where the fact cost is 2594200 with 10 buses.
SSO-TCSC-26 bus system (Fitness 2 SW).

SSO-TCSC-26 bus system (Fitness 1 cost).
Figure 9 demonstrates the SSO-UPFC-IEEE 26 bus system (Fitness 1 cost) and Fig. 10 illustrates the SSO-UPFC-IEEE 26 bus system (Fitness 2 SW) where the SW cost is 438280 for 10 buses and maximum social welfare cost is 49532000. Figure 11 shows the SSO-UPFC-26 bus system based on cost estimation (CVar) value (Fitness 2 cost) where the CVar value is 438280 and Var value is 350630.

SSO-UPFC-26 bus system (Fitness 1 cost).

SSO-UPFC-26 bus system (Fitness 2 SW).
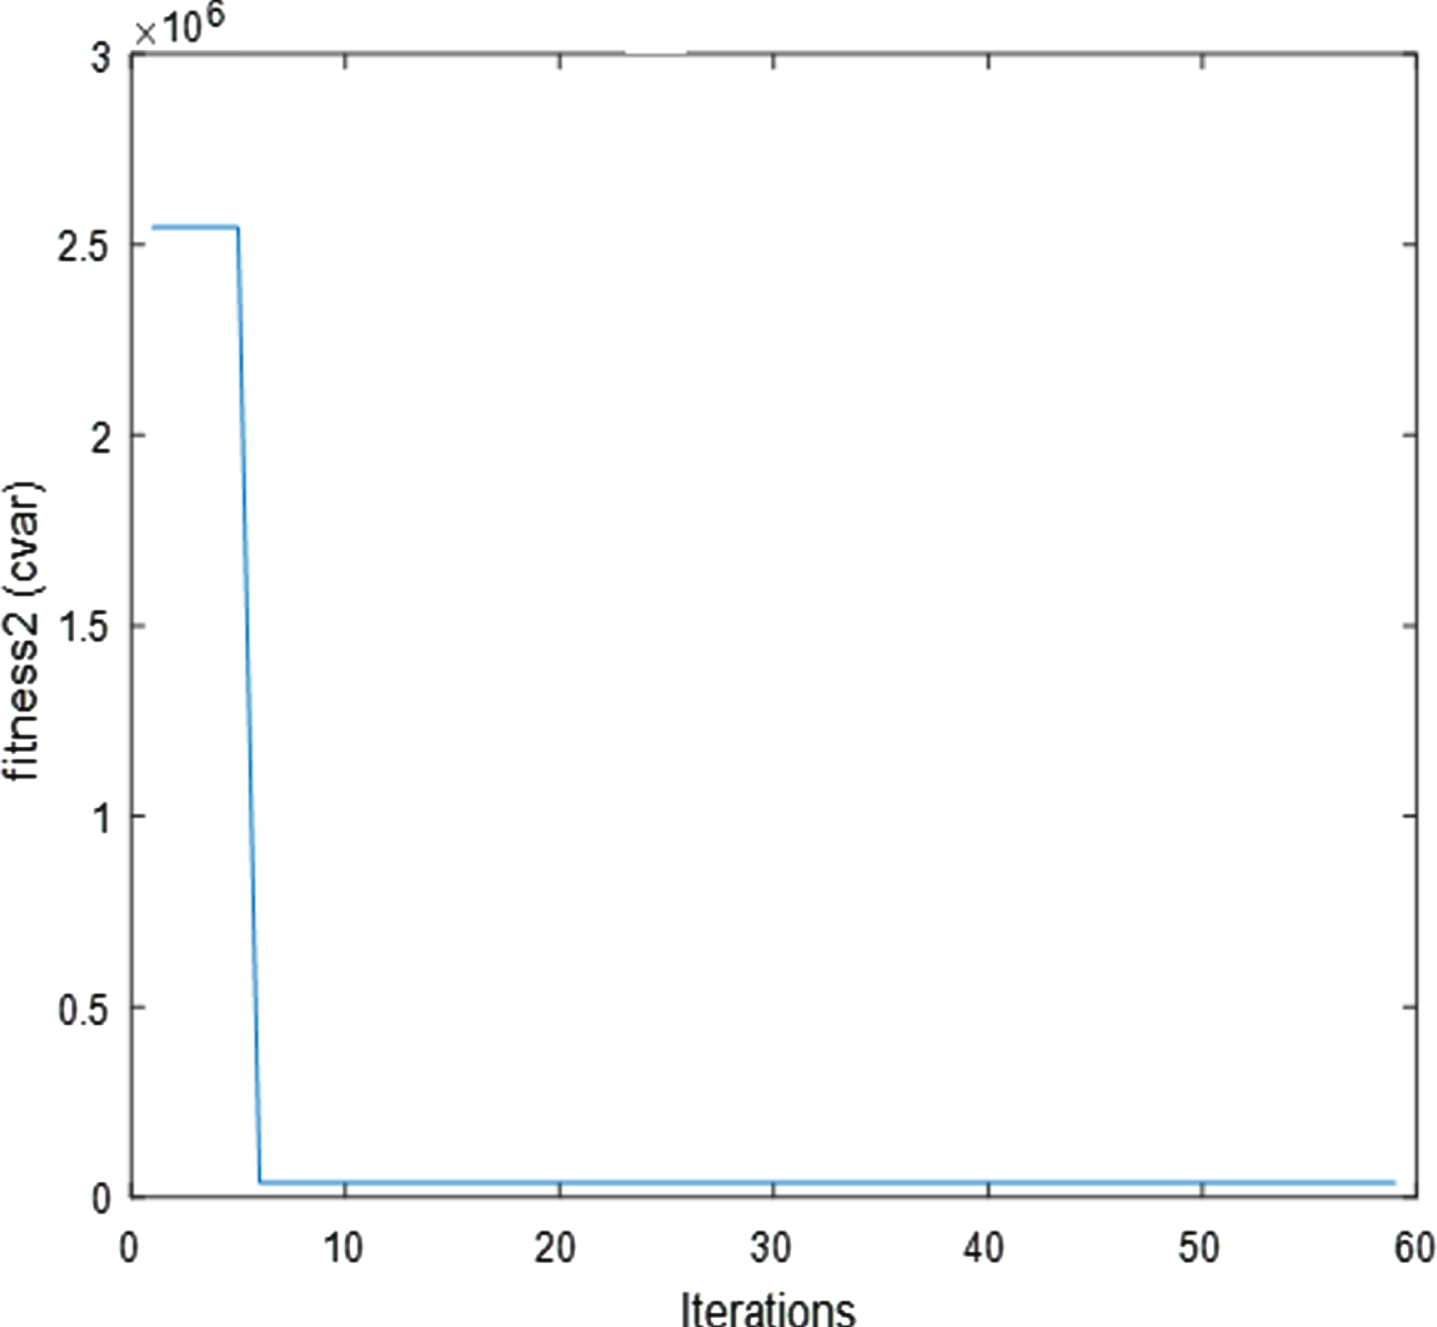
SSO-UPFC-26 bus system based on CVar value (Fitness 2 cost).
The cost estimation of wind generator without FDs placement is demonstrated in Table 5. When IEEE 14 bus system is interconnected, the generator cost is 276520 in bus 6, Fact cost is 252190 in bus 13, Minimum and Maximum SW cost is 2312700 and 1072500 respectively. Similarly, when interconnecting IEEE 26 bus, the generator cost is 20347000 in bus number 11, Fact cost is 3582700 with bus number 16, Minimum and Maximum social welfare cost is 182540000 and 7889700 respectively.
Cost estimation without device placement
Table 6 depicts the cost computation of wind generator with TCSC FDs placement. When IEEE 14 bus system is interconnected, the generator cost is 38350 in bus 3, Fact cost is 177777 in bus 1, Minimum and Maximum social welfare cost is 147360 and 1635500 respectively. Similarly, when interconnecting IEEE 26 bus, the generator cost is 44840 in bus number 26, Fact cost is 130800 with bus number 20, Minimum and Maximum social welfare cost is 929780 and 53268000 respectively.
Cost computation with TCSC placement
The cost calculation of wind generator with UPFC FDs placement is shown in Table 7. When IEEE 14 bus system is interconnected, the generator cost is 83077 in bus 3, Fact cost is 364330 in bus 1, Minimum and Maximum social welfare cost is 329250 and 1957800 respectively. Similarly, when interconnecting IEEE 26 bus, the generator cost is 83701 in bus number 26, Fact cost is 2594200 with bus number 20, Minimum and Maximum social welfare cost is 438280 and 49532000 respectively.
Cost estimation with UPFC placement
From Table 5–7, it is evident that the sensitive buses are recognized by the proposed IC-SSO system for optimal wind farm placement. The IEEE buses are over priority buses and not considered for wind farm placement. The optimal FDs placement reduces the system risk considerably. Moreover, the power flow via transmission lines is reduced after FDs placement appropriately. This appropriate placement of the proposed IC-SSO system minimizes the cost and shows better robustness towards risk mitigation and congestion.
The sensitivity analysis has been computed for finding the optimal location of FDs. Table 8 shows the sensitivity computation of the proposed method. Real Power Flow Performance Index Sensitivity Indices. The severity of the system loading under normal and contingency cases can be described by a real power line flow performance index.
Sensitivity computation of the proposed method
The FDs should be placed on the most sensitive line. The following criteria can be used for deciding optimal placement. In the real power flow performance index method, the FACTS devices should be placed in a line having the most negative sensitive index. Here, two factors are utilized to evaluate the sensitivity: Voltage Angle (VA) sensitivity and voltage magnitude sensitivity.
The proposed method has been compared with various existing methods like SVC [19], STATCOM [17], SSSC [20], IPFC [20], and CDN [24]. According to Table 9, it is manifest that the proposed method achieves higher performance than existing methods. This is because of the selection of the suitable optimizer in the proposed method which intends to handle both exploration and exploitation. The good optimizer should ensure the attainment of the global solution without any over-fitting or under-fitting issues with a faster convergence rate. It is observed that the UPFC is extremely powerful than TCSC. Hence, it is concluded that risks are minimized to a higher rate after FD placement. The optimal FDs placement provides reduced cost generation and maximal user benefits. Based on the proposed IC-SSO feature construction, UPFC is extremely effective to reduce system risks inline flow and economical risks.
Comparison of proposed method over existing methods
The sensitivity comparison of the proposed method over existing methods is depicted in Fig. 12. It is noticed from Fig. 12 that the proposed method has achieved superior sensitivity results with optimized objective functions. The sensitivity metric results validated that the proper weighting for the objective functions can be acquired by the proposed method. The optimized parameters of FDs could be obtained using the proposed SSO algorithm. Considering the capability characteristics of the UPFC and TCSC analyzed their impacts on composite power system reliability by using the evaluation method.
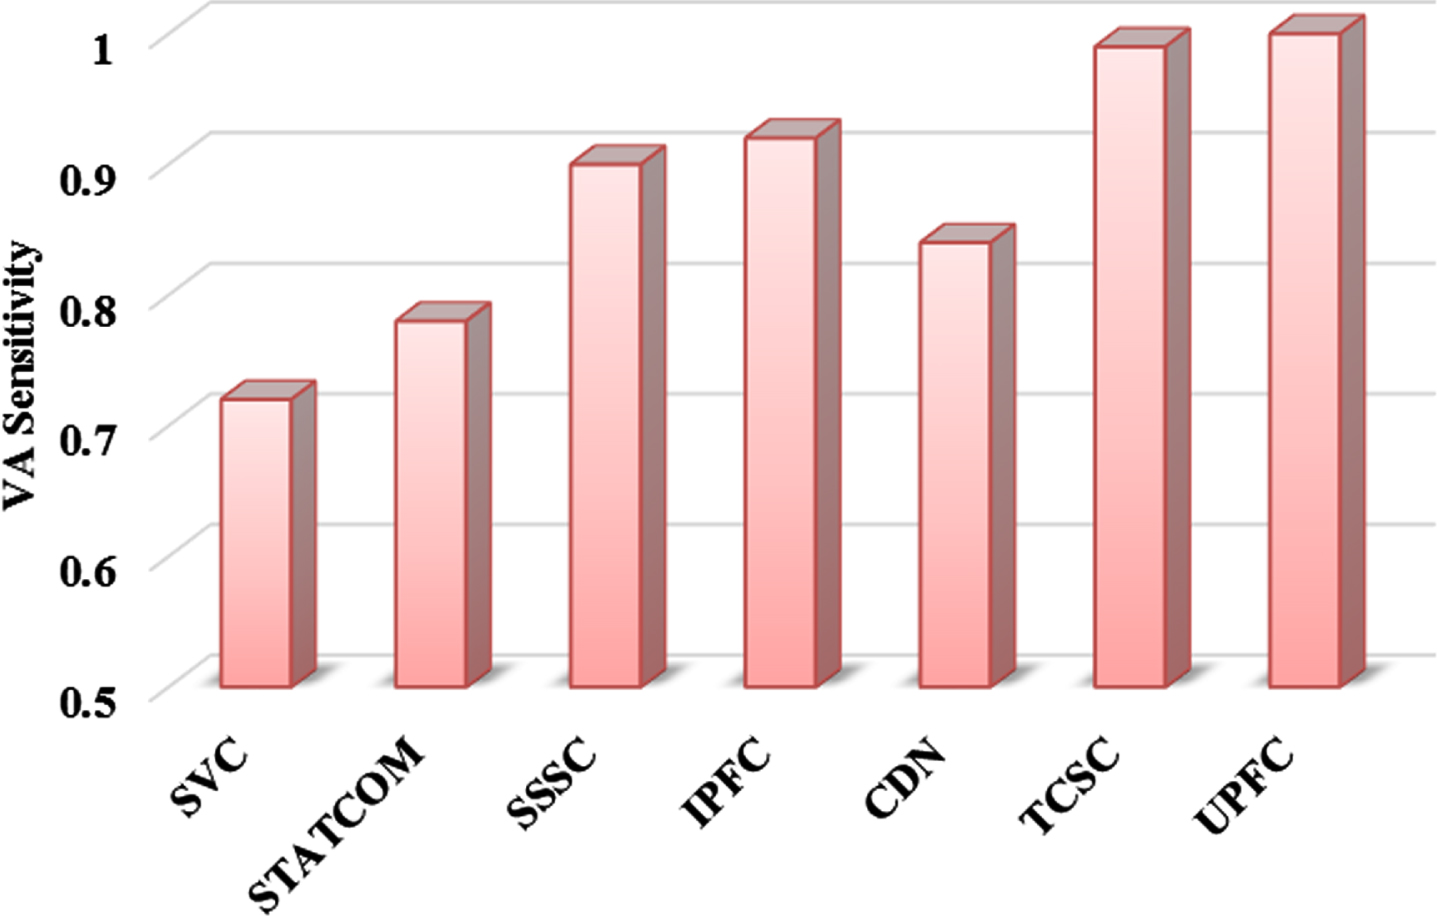
Sensitivity comparison of the proposed method over existing Methods.
To minimize the real power losses and improve voltage profile, a novel SSO was proposed to select the optimal locations and control parameters of multi-type FDs. Considering different scenarios and using SSO for placement of multi-FDs verified that FDs could improve the power system stability margins, maximum voltage stability margin, and reduce losses in the network. The objective functions of maximum system load ability of power system and minimum investment cost were achieved by using SSO, which solved the optimal location and parameter settings of multiple UPFC and TCSC problems. Respectively, the effects of FACTS on improving the system load ability using SSO had been discussed.
The aforesaid obtained results of the proposed method can be utilized in the basic applications of FDs such as power flow control, increase of transmission capability, voltage control, reactive power compensation, stability improvement, power quality improvement, and interconnection of renewable as well as distributed generation along with storages.
In this work, a novel IC-SSO system has been introduced to reduce the economic risks and provide optimal FD placement. The appropriate optimization algorithm is utilized for placing FDs and wind generators in the system towards the cost and risk minimization. The proposed IC-SSO system is applied to modify the IEEE 14 and IEEE-26 bus systems. Subsequently, the SSO optimization approach is designed to achieve better fitness for the modeling of an IC. The objective functions of maximum system load ability of power system and minimum investment cost were achieved by using SSO, which solved the optimal location and parameter settings of multiple UPFC and TCSC problems.
The performance of the proposed system can be evaluated using MATLAB simulation. The simulation results manifest that the FDs and wind generator of the proposed system reduced the system risk and profit is maximized when system congestion is reduced. The system placement is improved after UPFC placement where the cost estimation (CVar) of TCSC device placement is provided for both IEEE 14 and IEEE 26 bus systems as CVar = 147360 and CVar = 929780 respectively. The CVar of UPFC device placement is offered for both IEEE 14 and IEEE 26 bus systems as CVar = 329250 and CVar = 438280 respectively. Therefore, the proposed IC-SSO system shows better robustness towards risk mitigation and congestion.
In the future, this research can be extended with the analysis of the other two FDs using meta-heuristic optimization approaches. Moreover, one of the most important issues related to power quality improvement is total harmonic distortion reduction; however, the optimal locations and sizing of the FDs optimization problem in power transmission networks lack this feature as an objective function. Thus, total harmonic distortion could be considered as an additional objective function in future research. Afterward, the optimal placement and sizing of the FDs optimization problem on a balanced power transmission system. Hence, the optimal placements and settings of the FDs optimization problem could be investigated for an unbalanced power transmission network system as a recommendation for future research.