
Abstract
The denial-of-service (DoS) attacks block the communications of the power grids, which affects the availability of the measurement data for monitoring and control. In order to reduce the impact of DoS attacks on measurement data, it is essential to predict missing measurement data. Predicting technique with measurement data depends on the correlation between measurement data. However, it is impractical to install phasor measurement units (PMUs) on all buses owing to the high cost of PMU installment. This paper initializes the study on the impact of PMU placement on predicting measurement data. Considering the data availability, this paper proposes a scheme for predicting states using the LSTM network while ensuring system observability by optimizing phasor measurement unit (PMU) placement. The optimized PMU placement is obtained by integer programming with the criterion of the node importance and the cost of PMU deployment. There is a strong correlation between the measurement data corresponding to the optimal PMU placement. A Long-Short Term Memory neural network (LSTM) is proposed to learn the strong correlation among PMUs, which is utilized to predict the unavailable measured data of the attacked PMUs. The proposed method is verified on an IEEE 118-bus system, and the advantages compared with some conventional methods are also illustrated.
Introduction
In the power grids, state estimation is a necessary process for monitoring and control [1]. The state estimators utilize an available set of measured data to produce a precise and dependable state sequence [2], which can be further used in the Economic Dispatch, Contingency Analysis (CA), Optimal Power Flow (OPF), etc. [3]. However, DoS attacks may greatly degrade the performances of the estimators by infringing the availability of the measured data, which may result in poor accuracy or even unstable of the estimation [4]. With parts of unavailable measured data, the predicting algorithm is an effective solution for the state estimation against DoS attacks [5].
Recently, a considerable amount of work focused on the investigation of DoS attacks on state estimations. For instance, Chen et al. proposed using the distributed filter to reflect the impact from both DoS attacks and gain perturbations. The upper bound of filtering error covariance is derived by resorting to matrix inequalities [6]. Chen et al. [7] described a switched system approach for fusion state estimation under DoS attacks, one of the subsystems utilise a dynamic model with unit state transition matrix and zero control input, and the other uses a pseudo-dynamic model derived from the linearization of the power flow equation. Involving the estimation performance, Ding et al. analyzed the effect of DoS attacks against state estimation from the game-theoretic perspective [8]; a stochastic Bayesian game model between the sensor and the attacker is constructed and provided the unique mixed strategy equilibrium for this game. To enhance the performance, various signal processing and machine learning based approaches have been applied in the area of state estimation [5]. For instance, Hossain et al. [9] analyzed the effect of the cyber attacks against state estimation and addressed data recovery by a data-driven approach with linear Minimum Mean Squared Error (MMSE) estimation. Hasnat et al. [5] developed a data-driven approach to estimate the system’s state under DoS attacks exploiting the bus-to-bus cross-correlations. Zhang et al. [10] proposed a deep unrolled neural network for the power system state estimation and this prox-linear net requires a minimal tuning effort.
Phasor measurement units(PMUs) are regarded as one of the most promising measuring instruments in supervisory control and planning of the smart grid, which perform real-time monitoring of the system by providing accurate and instantaneous measurements using the GPS [11–14]. The placement of PMU is the main factor in improving the observability and the accuracy of the state estimation. However, the cost of PMU installation is high. Hence, a tradeoff between the cost of PMU placement and the performance of state estimation should be made in the system optimization while ensuring observability [15, 16]. Many researches investigate the optimal placement problem of PMU in power system [17, 18]. For example, Phadke et al. [19] developed an approach based on graph theory to obtain the optimal PMU placement, and Simulated Annealing(SA) has been used to solve idealistic communication constrained. In [20], the PMUs are placed optimally using a Greedy Algorithm(GA) for cost reduction while ensuring the system completely observable. In [21, 22] have described the optimal placement formulation of PMU is achieved by integer programming, which eliminates the critical measurements in the whole system which detects the bad data. Ali Abur and Bei Gou propose an integer linear programming algorithm to optimize PMU placement for maximizing network observability [23, 24].
To address these issues, considering the optimal PMU placement, LSTM based state prediction method is proposed against DoS attacks. The optimal placement problem takes into consideration of spatial-temporal correlation and installation cost. The optimal PMU placement is computed with a 0-1 integer linear programming algorithm while ensuring system observable. Then, the LSTM network is adopted to learn the correlation of states that predict the states of the attacked area using the highly correlated buses. It is worth noting that the highly correlated buses can be obtained by the optimal PMU placement. Therefore, the proposed method is capable of predicting states accurately, which the system can not only deploy PMUs at the lowest cost but also ensure the system completely observable. The contributions are summarized as follows: The optimal PMU placement is obtained by considering the cost of PMU deployment and the spatial-temporal correlation among buses while ensuring system observable. Based on the optimal PMU placement, the LSTM network is adopted to train the time derivative of the state data for learning the strong nonlinear correlation among PMUs. Then, the states of the power grid system can be accurately predicted for recovering from DoS attacks.
The remainder of this paper is organized as follows: Section 2 introduces a system model for network dynamics under DoS attacks and problem description. Section 3 introduces PMU placement under spatial-temporal correlation. In Section 4, we present a method for predicting states using LSTM networks. In Section 5, simulations are performed on the IEEE 118-bus system. In Section 6, we conclude the paper.
System model and problem formulation
This section introduces a system model under DoS attacks and problem description.
Power system model subject to DoS attacks
The power system is described by differential-algebraic equations [25], where the dynamics are given by.
where x (t) ∈ R
n
is the states of the network, u (t) ∈ R
m
is the control inputs, and d (t) ∈ R
p
is the stochastic disturbance. A is the system transition matrix; B1 is the gain of control inputs and B2 is the stochastic disturbance gain.
where x k and xk-1 are the sampled values of x at discrete time kT and (k - 1) T, and T is the sampling period.
PMU is able to enhance the information exchange of the power grid system, which also brings cyber threats [27]. Cyber attacks will result in huge damage to the cyber physical system(CPS). DoS is one of the most likely threats to CPS, which is the core of the current research on CPS security issues. In a power grid control system, the adversary usually launches DoS attacks by blocking communication channels, endangering devices to prevent them from sending data, and attacking routing protocols. The DoS attack results in the communication failure between the sensor and the control center [28], which weakens the control effect, thereby undermining the security and stability of the CPS. When the adversary launches DoS attacks over the PMUs installed on buses (see Fig. 1), the control center cannot receive measured values from PMUs. Similar to [28–32], we consider the support and impact of the information side business on the physical side functions and, based on the direct and indirect dependence of cyber-physics, explore CPS network attack defense. We use sequences to describe the attacker’s actions. Given such constraints, the power system over a time horizon k = 0, …, Z - 1 with measurement subject to DoS attacks s
i
is defined as follow:
where x
k
∈ R
n
denotes the state.
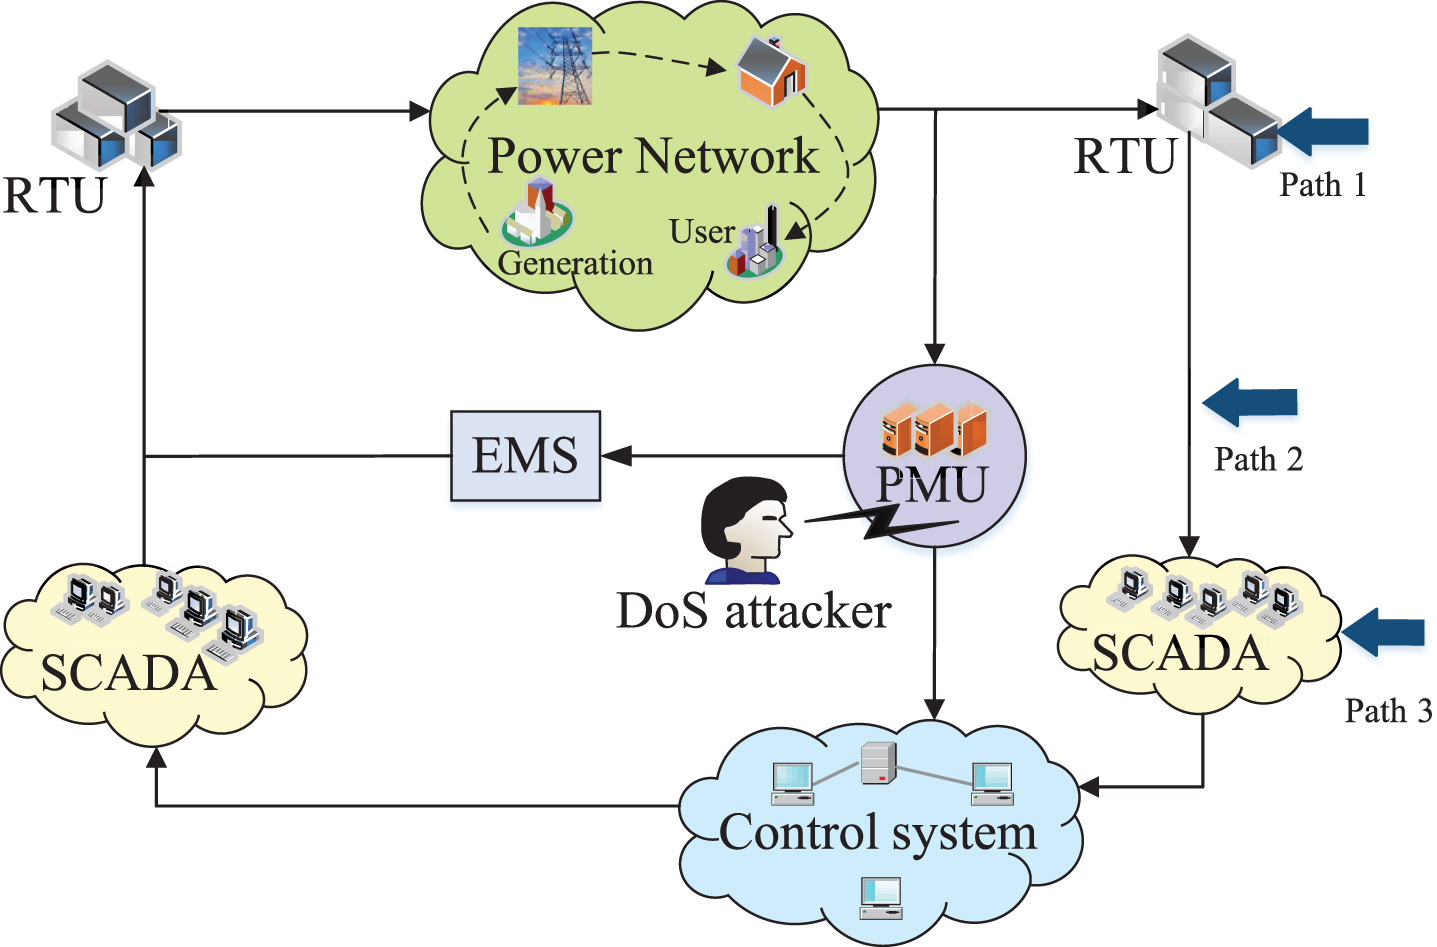
Power grid control system under DoS attacks.
We note that due to (3), the control center receives x i (kT) when si = 1. When si = 0, the control center cannot receives x i (kT). Where x i (kT) is the state of the bus i at time kT, i < n. And ∑si (t) = n - m.
In this paper, we are interested in the optimal PMU placement and using LSTM networks to predict the missing states of the system, thus capable of resisting DoS attacks. This paper minimizes the number of PMU by taking into consideration of spatial-temporal correlation and the cost of PMU installation, by which the system not only ensures the observability of each bus at the lowest cost but also obtains highly correlated buses. For an N-bus system, the PMU placement problem can be formulated as follow:
Based on the optimal PMU placement, we use LSTM networks to predict the missing measured states of PMUs, thus capable of resisting DoS attacks. We assume DoS attacks on the communication system of the power grid result in the unavailability of data from the attacked zone from a subset of the PMUs associated with the buses [5]. Let, D ={ 1, 2, 3, …, n } be the set of the PMUs installed on the buses, which computed by an optimization algorithm, n < N. Assume that y represents voltage or phase angel from a PMU,
where y
j
= [V (kT) , θ (kT)]
T
is the state of the bus j at time kT, j ≤ m and
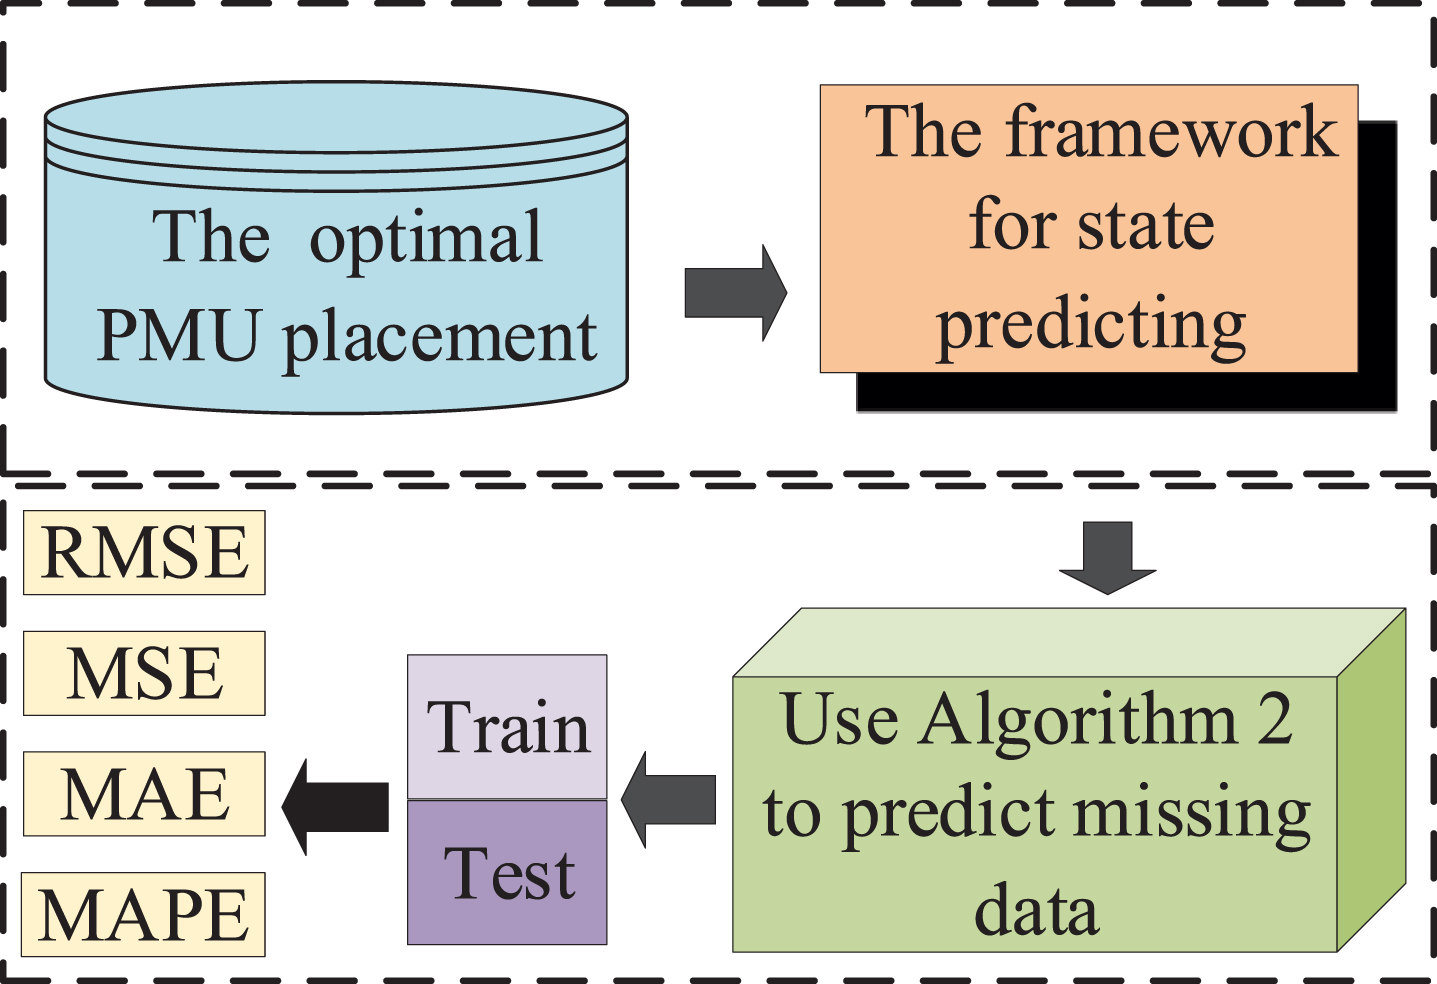
It is impractical to install PMU devices on all buses. We now investigate an optimal PMU placement, by which the system can not only achieves the goal at the lowest cost but also ensures observability of the system, summarized in Fig. 2. To find the optimal PMU placement, we take spatial-temporal correlation among the buses and installation cost of PMU into account.

Flow chart of the optimal PMU placement.
In this paper, the electrical centrality and the electrical node significance are used to measure node importance. It determines the dependencies between buses. The relative degree of the time correlation between the node voltages’ phase angles can be obtained from the literature [4]. Besides, the importance of node can be ranked by the active power injected by the nodes. The relative degree of spatial correlation between the nodes’ voltage phase angles can be obtained according to the above two measures. The definition of bus i electrical centrality [1] is shown in eq. 10.
where N is the total number of node, xi,j is the (i, j) element of X
bus
, and the node electrical centrality order can be obtained by eq. 10. The stronger (weaker) the node’s electrical centrality, the stronger(weaker) the node’s electrical connectivity, the stronger(weaker) the time correlation between the voltage phase angle and the node’s amplitude. By injecting the active power of other network nodes, the node importance order is obtained. Koç. [3] determined the importance of electrical nodes, as shown in eq. 11.
where N is the total number of node, and P i is the active power injected by the i node. It is worth noting that the electrical node significance of all buses is not fixed. When the power injected into the bus changes, the electrical node significance will be updated.
In general, on the basis of ensuring the system observability, the proposed method selects to deploy PMU at the nodes that are more highly correlated and have a lower cost. c
i
is the cost of the installing PMU at bus i, which is determined according to the installation difficulty of buses. The optimal PMU placement is obtained using eq. 12 by a 0-1 integer linear programming algorithm. ω
i
is computed by electrical centrality and the importance of electrical node according to eq. 10 and eq. 11, respectively. Note that each node is configured with at most one PMU. The PMU installation vector λ
i
is obtained as follow:
where
There are advantage reasons that both the cost of PMU installation and spatial-temporal correlation among buses are considered optimal PMU deployment. It guarantees the optimized placement of PMU at a lower installation cost. Moreover, the method selects to deploy PMU at the nodes that are more highly correlated [4]. Thus, the system can not only achieve the goal at the lowest cost but also ensure the observability of the system.
We obtain the optimal PMU placement in this section. The reason behind calculating the optimal PMU placement is for utilizing the PMU measurement sequence to predict the missing measurement sequence. The LSTM network is one of the most suitable approaches to this time series forecasting(TSF) problem [36–38]. Since the memory cell of LSTM has special gates, LSTM can model time dependence on a larger scale [36]. In addition, the LSTM network can obtain accurate forecasts and predicts missing time series with suitable computation time [39]. The process of utilizing the LSTM network to predict the state is discussed in the following subsections.
Algo.1 illustrates the optimization process of the proposed scheme.
1: Calculate the spatial-temporal correlation index by eq. 9 and eq. 10;
2: Obtain the index
3: Calculate the optimal PMU placement by eq. 4;
4:
The proposed state prediction using LSTM networks aims to predict the missing measured states of PMUs under DoS attacks. Fig. 3 shows the structure of the proposed method. It consists of the framework of state prediction with LSTM, and the process of predicting state.
Flow chart of state prediction with LSTM.
Figure 4 shows the LSTM based state prediction framework. The framework performs a forward passing which involves two LSTM layers, a Dropout layer, and one fully connected layer, which predicts the missing states of the attacked PMUs installed on buses by learning the complex correlation of the states. According to the time derivative
The state prediction framework takes the PMU measurements {x
i
,1, x
i
,2, … , x
i
,ct-1 } of normal buses as input. The time derivative
where
In this paper, we assume the correlation among PMUs under DoS attacks be considered unchanged. Different from conventional prediction methods such as periodic factor, linear regression, etc. [38]. LSTM network is one of the most suitable methods to solve the time series prediction (TSF) problem. From the perspective of forecasting accuracy, the LSTM networks can fully learn the correlations between states so as to obtain accurate forecasts. In terms of computation time, the LSTM networks have high prediction performance and can ensure the appropriate computation time. In addition, the selection of LSTM model parameters has little impact on the prediction accuracy, which can reduce the cost of performing extensive grid searches [36]. Therefore, LSTM is employed to forecast the measurements of the attacked PMUs installed on buses in this paper. The proposed LSTM block consists of four gates. The forget gate f
k
and input gate i
k
are updated by
where
As shown in Fig. 4, the normal PMUs’ measurements {x
i
,1, x
i
,2, … , x
i
,ct-1 } are the input of the state prediction framework. The time derivative
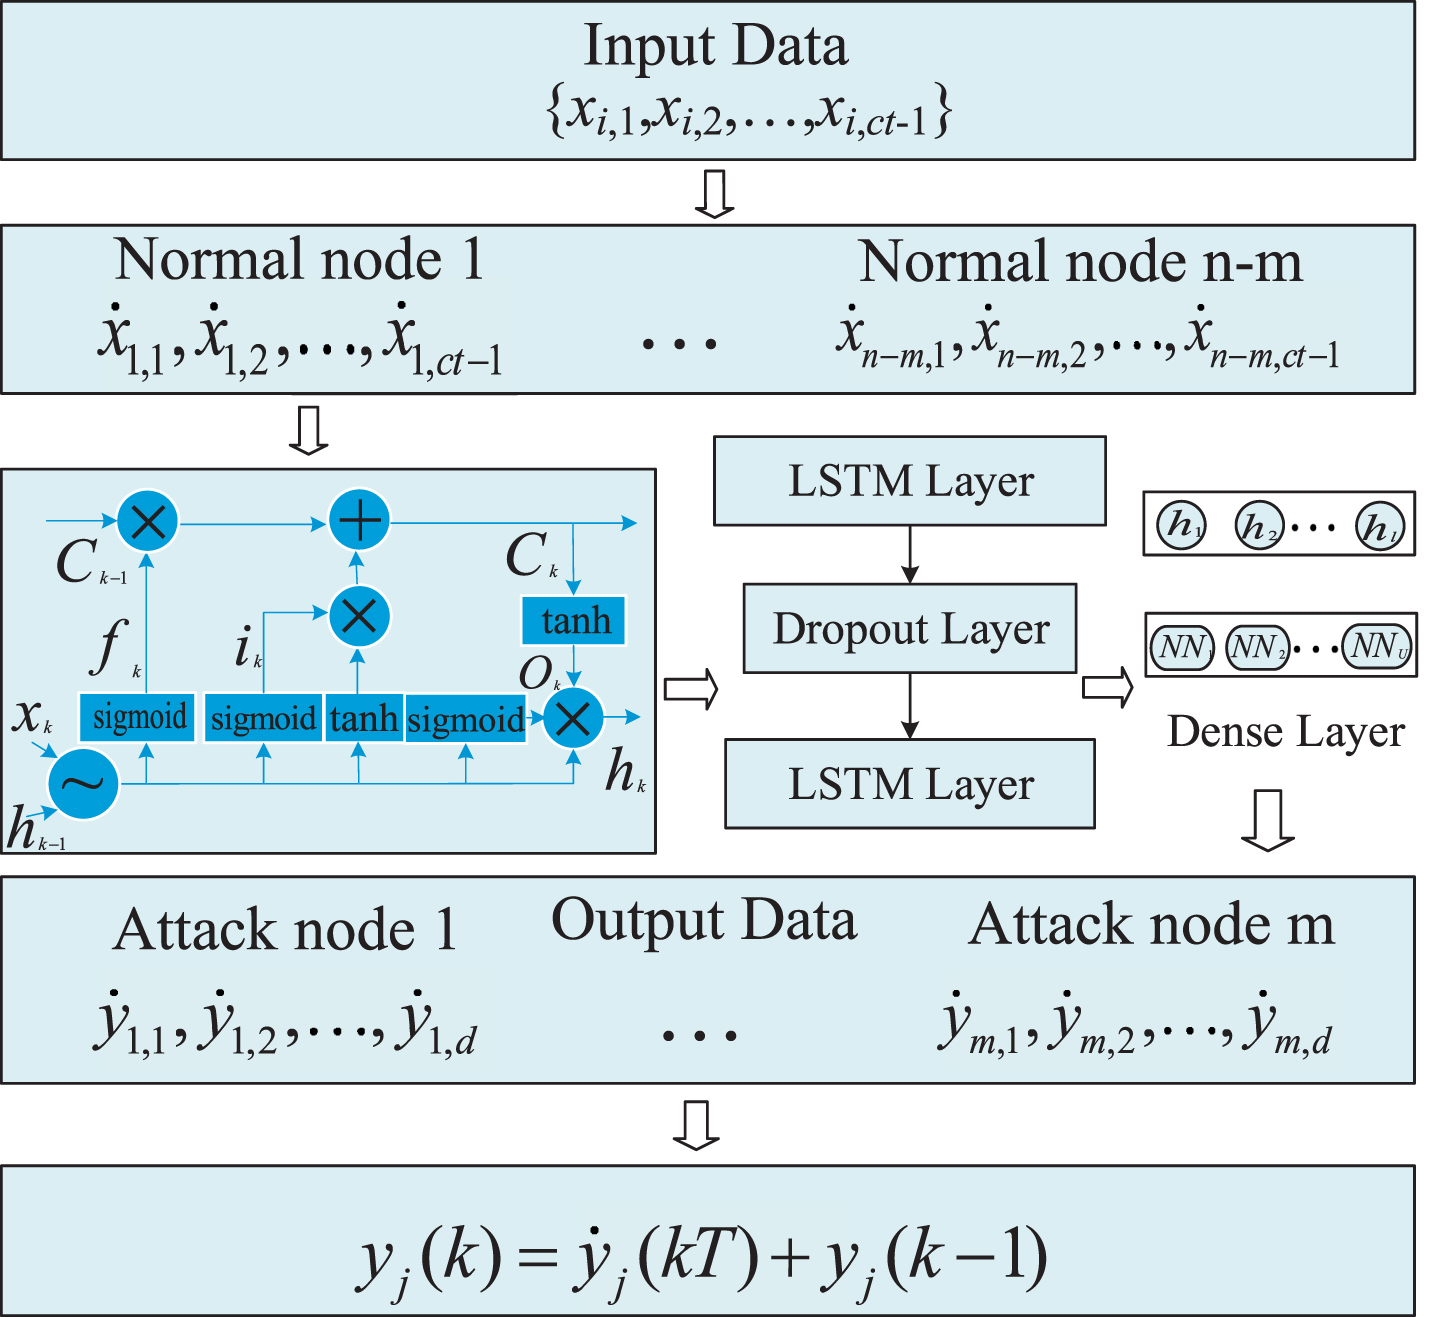
The architecture of the proposed LSTM-based state prediction.
where yj,k = [V (kT) , θ (kT)]
T
is the state of the bus j at time kT, j ≤ m;
The proposed method can predict the missing measured states of PMUs installed on buses under DoS attacks, thus mitigate the performance degradation of state estimation results from DoS attacks. In practice, the state prediction has three stages: data preprocessing, the training phase, and the testing phase. The data processing is to obtain the appropriate input data of the networks. During the training process of predicting state, the proposed method avoids the overfitted training by judging train error. In the test process of predicting the state, the proposed method can obtain the optimal scalar parameter ɛ by comparing the performance of each ɛ. Each stage is further discussed in the following sub-sections.
1.Data preprocessing: According to the time of collecting datasets, the data is divided into the training set and test set. The training data accounts for 60%, and the test data accounts for 40%. The similarity between data. Therefore, adjusted the input before the input is fed into the network. The data is rescaled to a reasonable range with normalization, which ensures measurement data matches the output of the activation function [40]. The normalization definition can be expressed as follows:
2.The LSTM network training iteration: In the LSTM networks training process, the input matrix with size (n - m) × (c
t
- 1) (the collected data of the normal PMUs installed on buses) and the output matrix with size m × d (predicted data of the attacked PMUs installed on buses). The training error is continuously computed during training. When the training error is less than the η, stop the train, and perform the test. Training iteration within a certain range is beneficial to data training. Therefore, η is set as the value when the point of the overfitted training. The loss function is used to measure the training effect, the definition eq. 17.
3.The LSTM network testing iteration: During the LSTM network testing process, the number of network layers ɛ is increased to 5. The algorithm limits the maximum value of ɛ up to 5. The prediction accuracy is lower when ɛ is greater than 5. Choose the best ɛ by comparing the performance. First, the single attack experiment is performed to verify that the proposed method can predict the measurement of the single PMU installed on the bus, then increase the number of attacked PMUs. The predicted states V j and θ j can be updated with eq. 14 and eq. 15. To achieve the state prediction, we rescaled the normalized data to its original space.
The missing measured states of PMUs installed on buses can be predicted by using the spatial-temporal correlation among buses, which emphasizes high spatial-temporal correlation buses. The effect of learning the spatial-temporal correlation among buses depends on the optimal scalar parameter ɛ. The normal buses states V i and θ i and network model parameters ɛ, η, h l , n, m, d, c t and learning rate as input; n is the number of PMU installed on the buses; m is the number of the attacked PMUs installed on buses, (m < n); d is the time step of state prediction. Algorithm 2 illustrates the state prediction process of the proposed method.
1:
2: Calculate train error eq. 16;
3:
4: Obtain the number of network layers ɛ;
5:
6:
7:
8:
9: Calculate
10: Generate the attacked buses states for
11: Update y j (k + 1) by eq. 14;
12:
13:
14:
The purpose of this paper is to predict the system states as accurately as possible which PMUs are under DoS attacks. The reason behind using the proposed method is to emphasize the spatial-temporal correlation of the PMU measured states. However, direct implementation of LSTM in state predicting will not necessarily obtain significant improvement, and the prediction accuracy also depends on the scalar parameter, ɛ [38]. The number of network layer ɛ is selected by comparing the performance of each ɛ, and the influence of setting different values for parameter ɛ has been illustrated in the experimental section. When the number of network layers is larger than the optimal value, the network will start to capture the noise and fit the training data too well, which will have a negative influence on the prediction state [38]. In this paper, the training process will stop if the tarin error is less than η so as to find the optimal number of training iterations. When increasing the DoS attacks strength, the prediction accuracy decreases due to the spatial-temporal correlation among the PMUs measured states will change. Therefore, further, exploit the potential LSTM networks for state prediction by considering the topology change can be prospective future work.
In this section, we first present the experimental design and then show the proposed LSTM-based state prediction evaluation results. The IEEE 118-bus system shown in Fig. 5 is used as a test system in this paper, which has been widely used in smart grids. For the IEEE 118-bus system, which cnsists of 91 load buses [41]. This paper uses load data from New York Independent System Operator (11 regions) 5-min interval data, and PJM (9 regions) hourly data [41]. In order to obtain such an amount of load, we simulate load profiles for those 91 load buses by combining the available data for the different regions. We choose 3 regions of the NYISO(11 regions) and 4 regions of the PJM(9 regions) to synthesize the load data for the IEEE 118-bus system. We down-sampled real load data every five minutes and then interpolated these data to generate a time series in which the sampling rate of the series is 0.033Hz [41]. Meanwhile, the training data accounts for 60%, and the test data accounts for 40% sample from the time series. The MATPOWER toolbox is used to solve the power flow for the IEEE-118 bus. The experiment is implemented with Matlab and runs on a high-performance HP workstation equipped with a computable GPU unit. The proposed LSTM-based state prediction code is designed based on an open-source code framework. The parameters for the test system are shown in Table 1. The number of LSTM layer is set to be 2 for the 118-bus system. Moreover, the attacked PMU size is the number of PMU under DoS attacks. The batch size is set to c t - 1. The two decay parameters are set to be 0.01 and 0.2, respectively. Each LSTM network layer with 150 hidden units.
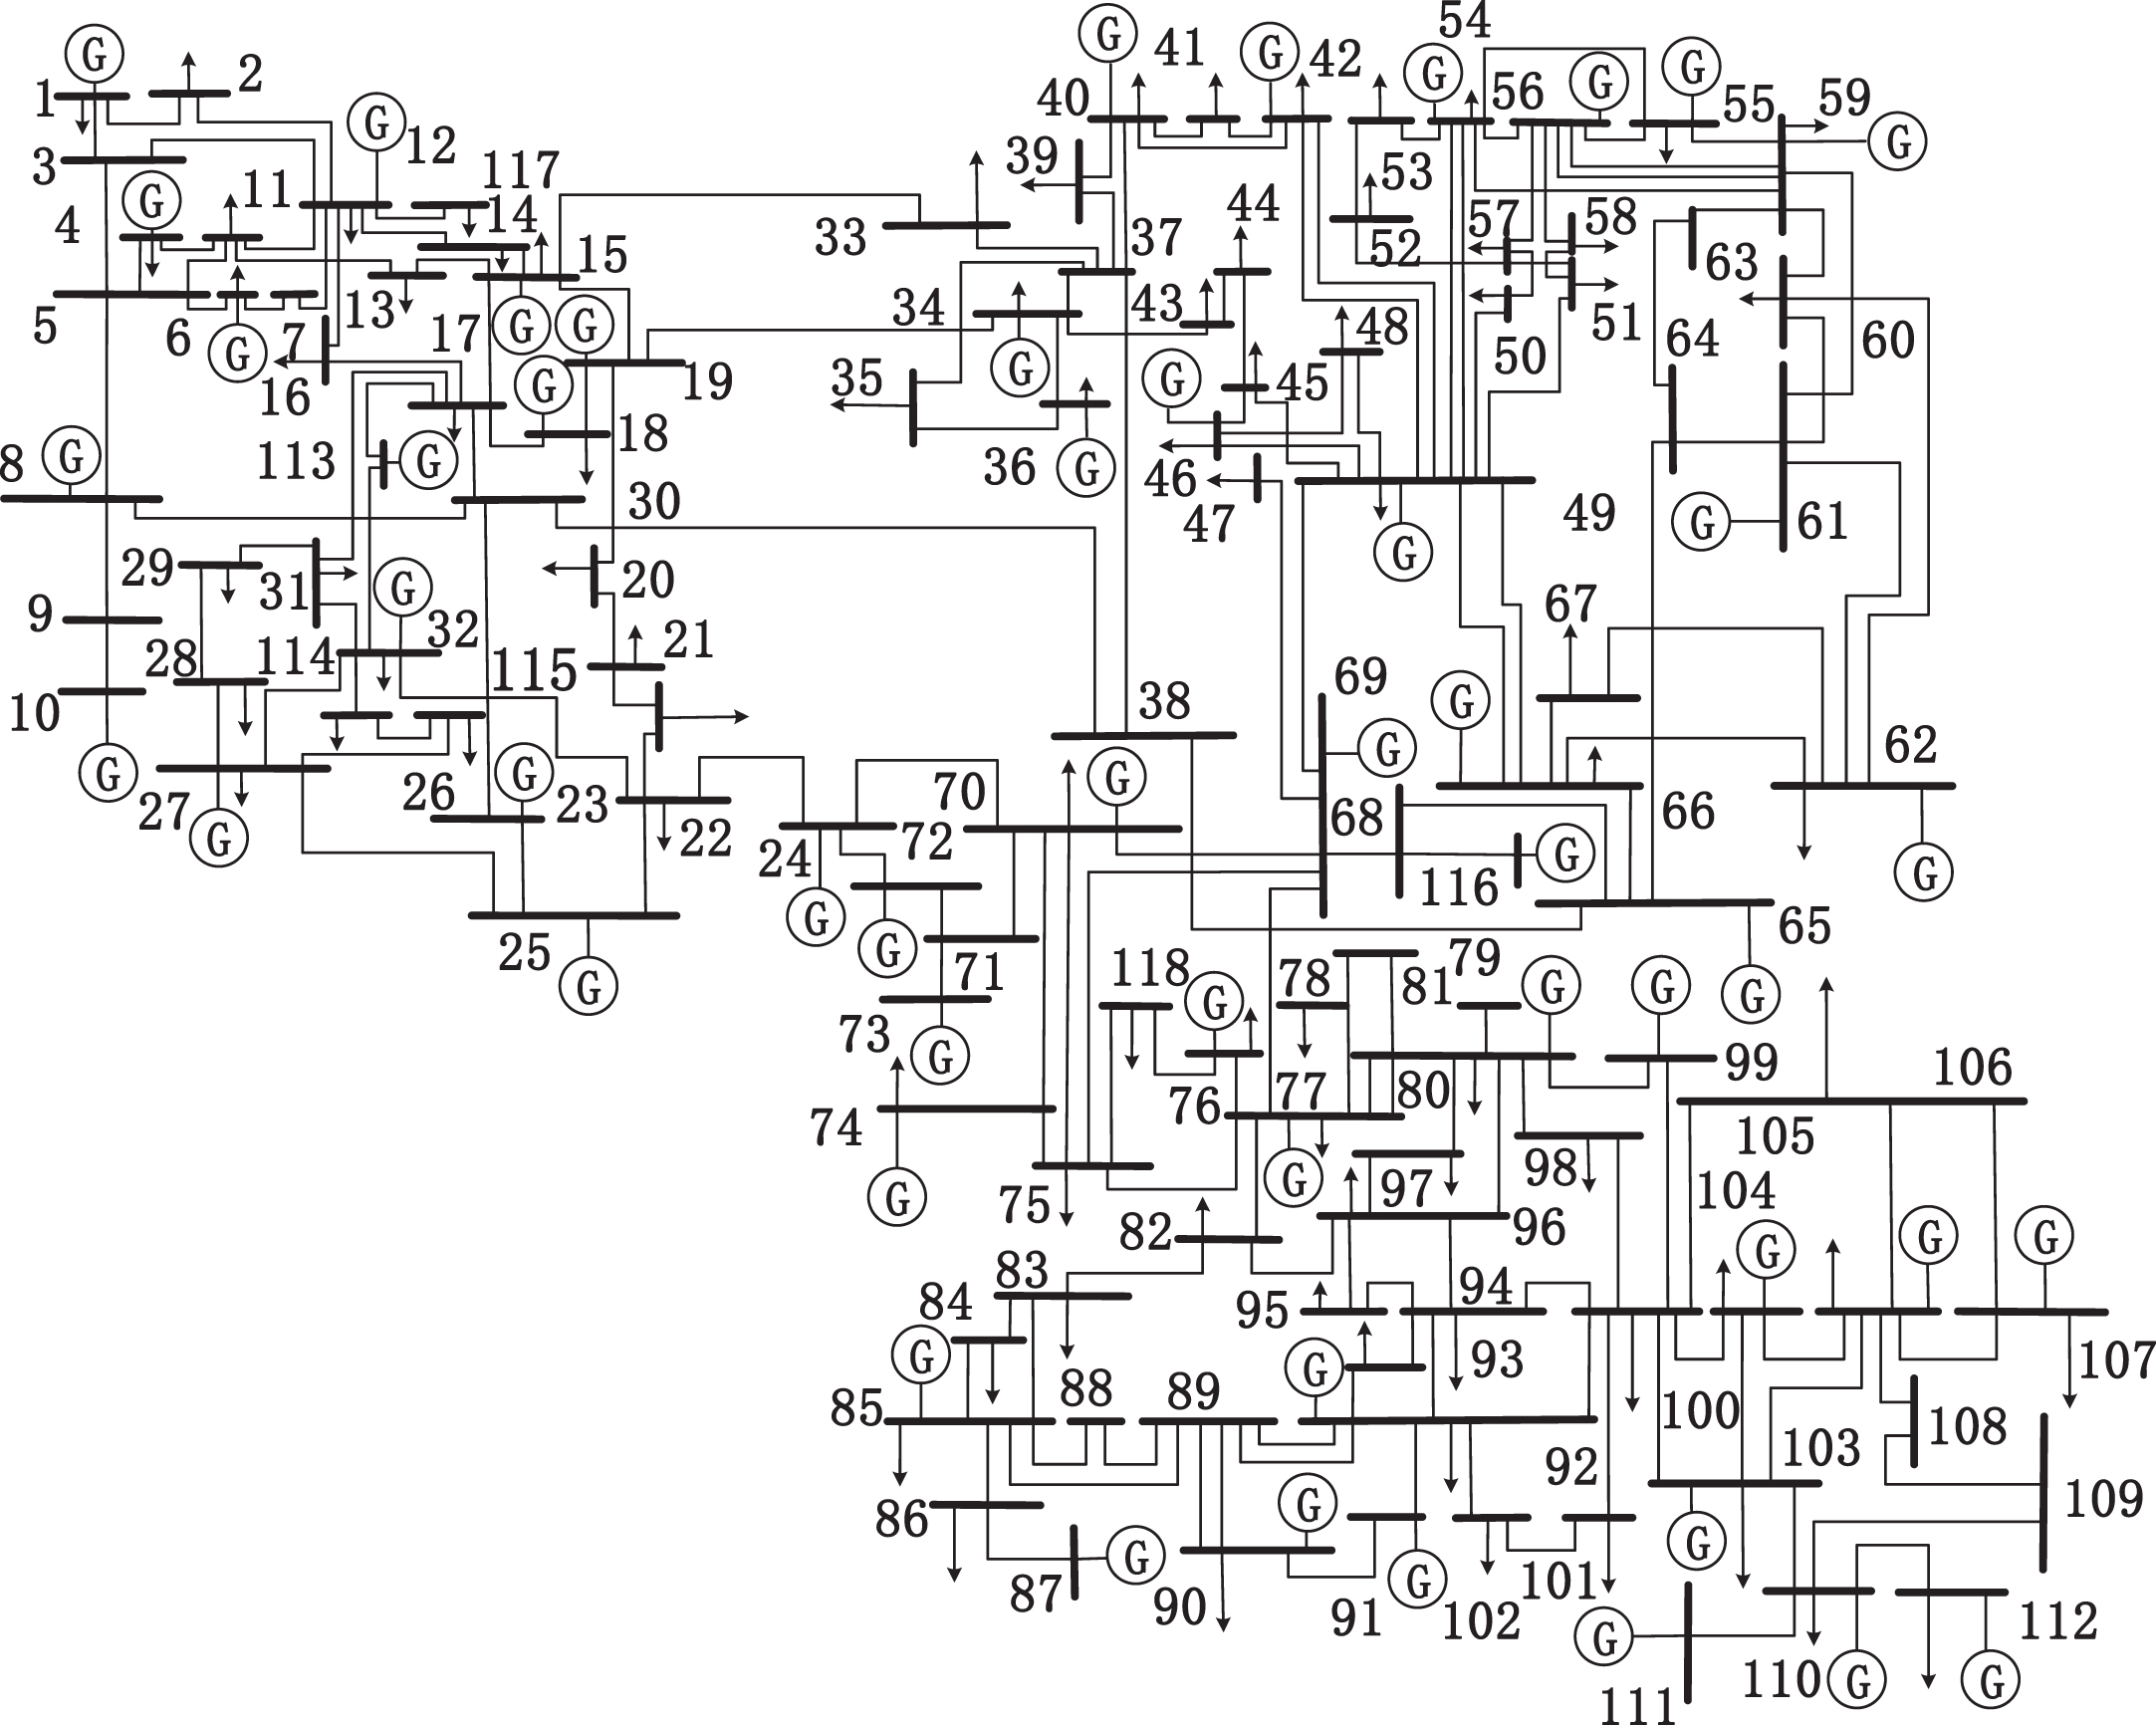
The system diagram of IEEE 118-bus.
The experimental parameters
We discuss the effect of the number of the network layer on predicting and evaluate the performance of the proposed LSTM-based state prediction. We validate the performance of the proposed method using the voltage magnitudes (per-unit) errors and angles (degree) errors. The RMSE, MAE, MAPE are used and are defined as follow:
where N denotes the total number of bus. In addition, y predict and y target are predicted state values and real state values, respectively.
Figure 6 indicates the sorted electrical node significance absolute values for the IEEE118-bus system. Electrical connectivity and electrical node significance are used to obtain the spatial-temporal correlation among buses in this paper. Note that the buses with stronger electrical node significance have stronger spatial-temporal correlation among states, which are determined by the physical topology. Fig. 7 shows the spatial-temporal correlation among the PMU measurements in terms of voltage angles for the IEEE 118 bus system. The electrical node significance of the IEEE 118 bus system has been represented in Fig. 7 by the node colors while the spatial-temporal correlations among the voltage angle PMU measurements have been represented by the color of the connected line. The value on the left of Fig. 7 measures electrical node significance, while the value on the right measures the spatial-temporal correlations of the physically connected buses in terms of voltage angle. It is clear that the PMU measurements of some buses have very strong spatial-temporal correlations. The optimal PMU placement can be computed by combining spatial-temporal correlation for buses with the installation cost of PMU. The result of optimal PMU placement for the IEEE 118 bus test system is illustrated in Table 2. For the IEEE 118 bus test system, the number of deploying PMU is 32.
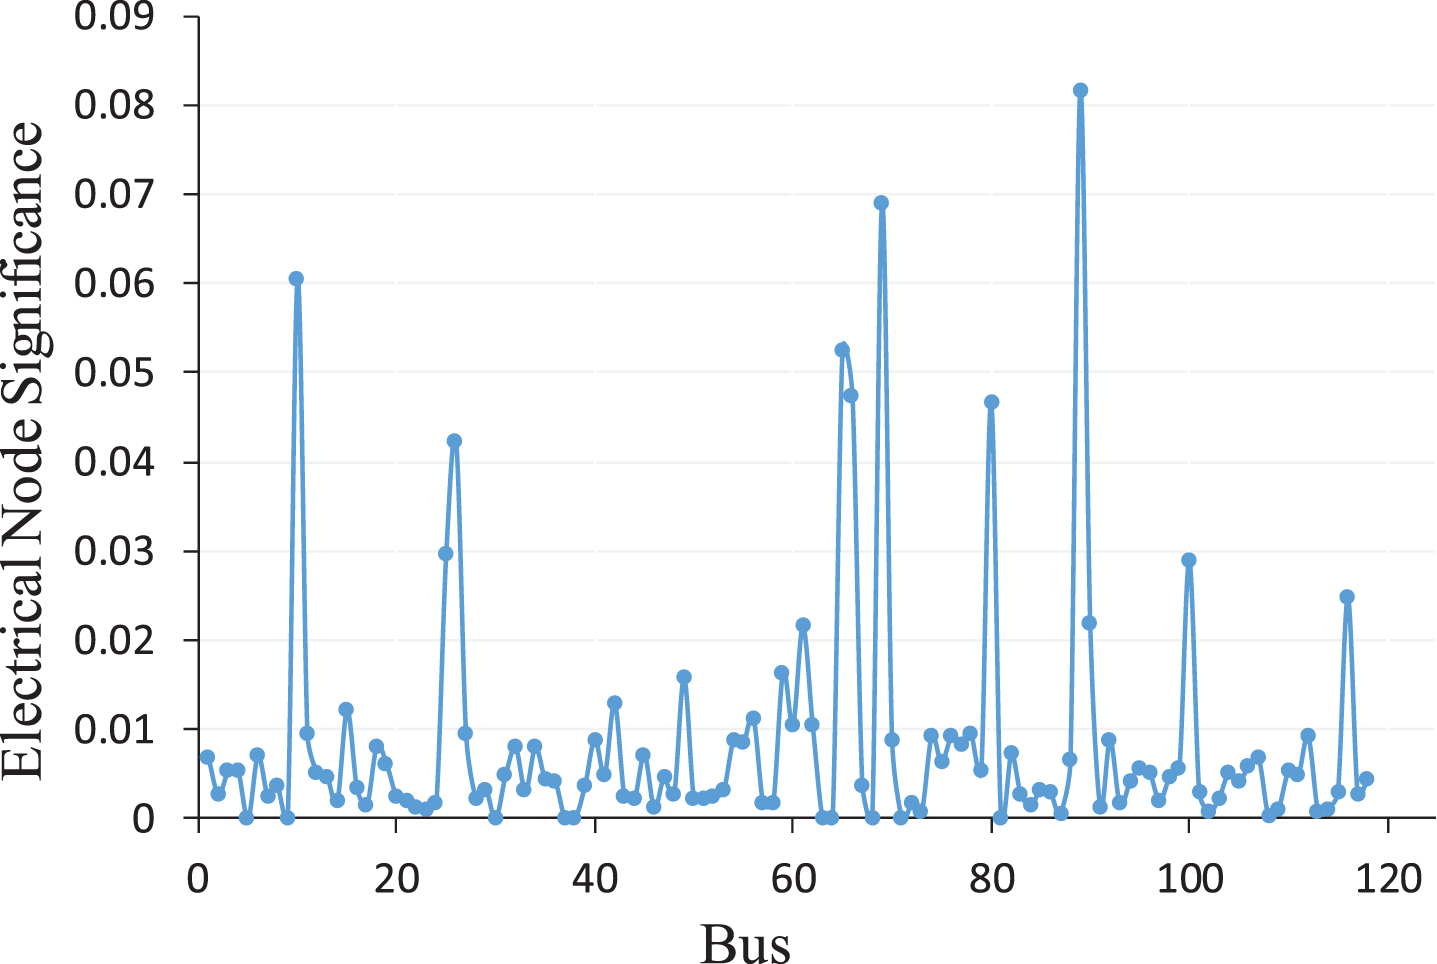
The absolute value order of electrical node significance of IEEE118 buses.

The spatial-temporal correlation of the physically connected in IEEE 118 buses.
The result of optimal PMU placement for the IEEE 118 bus test system
Figure 8 shows the results of the timing prediction of voltage phase angle and voltage amplitude. The red curve denotes the prediction time series by the proposed method, and the blue curve represents the time series of PMU measurements, while the black line represents the time of the attack. In Fig. 8(a), it can be seen that the result of predicting states is much close to the true states, which the RMSE of this case is 0.3065. The true voltage amplitude and the predicted voltage amplitude when PMU installed on bus 29 is under DoS attacks are depicted in Fig. 8(b). As far as the 1, 4, 8, 12, 16 number of attacked PMUs are concerned, the prediction of voltage phase for bus 29 is depicted in Fig. 8(c), respectively. Evidently, the result of the prediction of voltage phase angle under single attacked PMU is best, while the prediction is worst under 16 attacked PMUs.
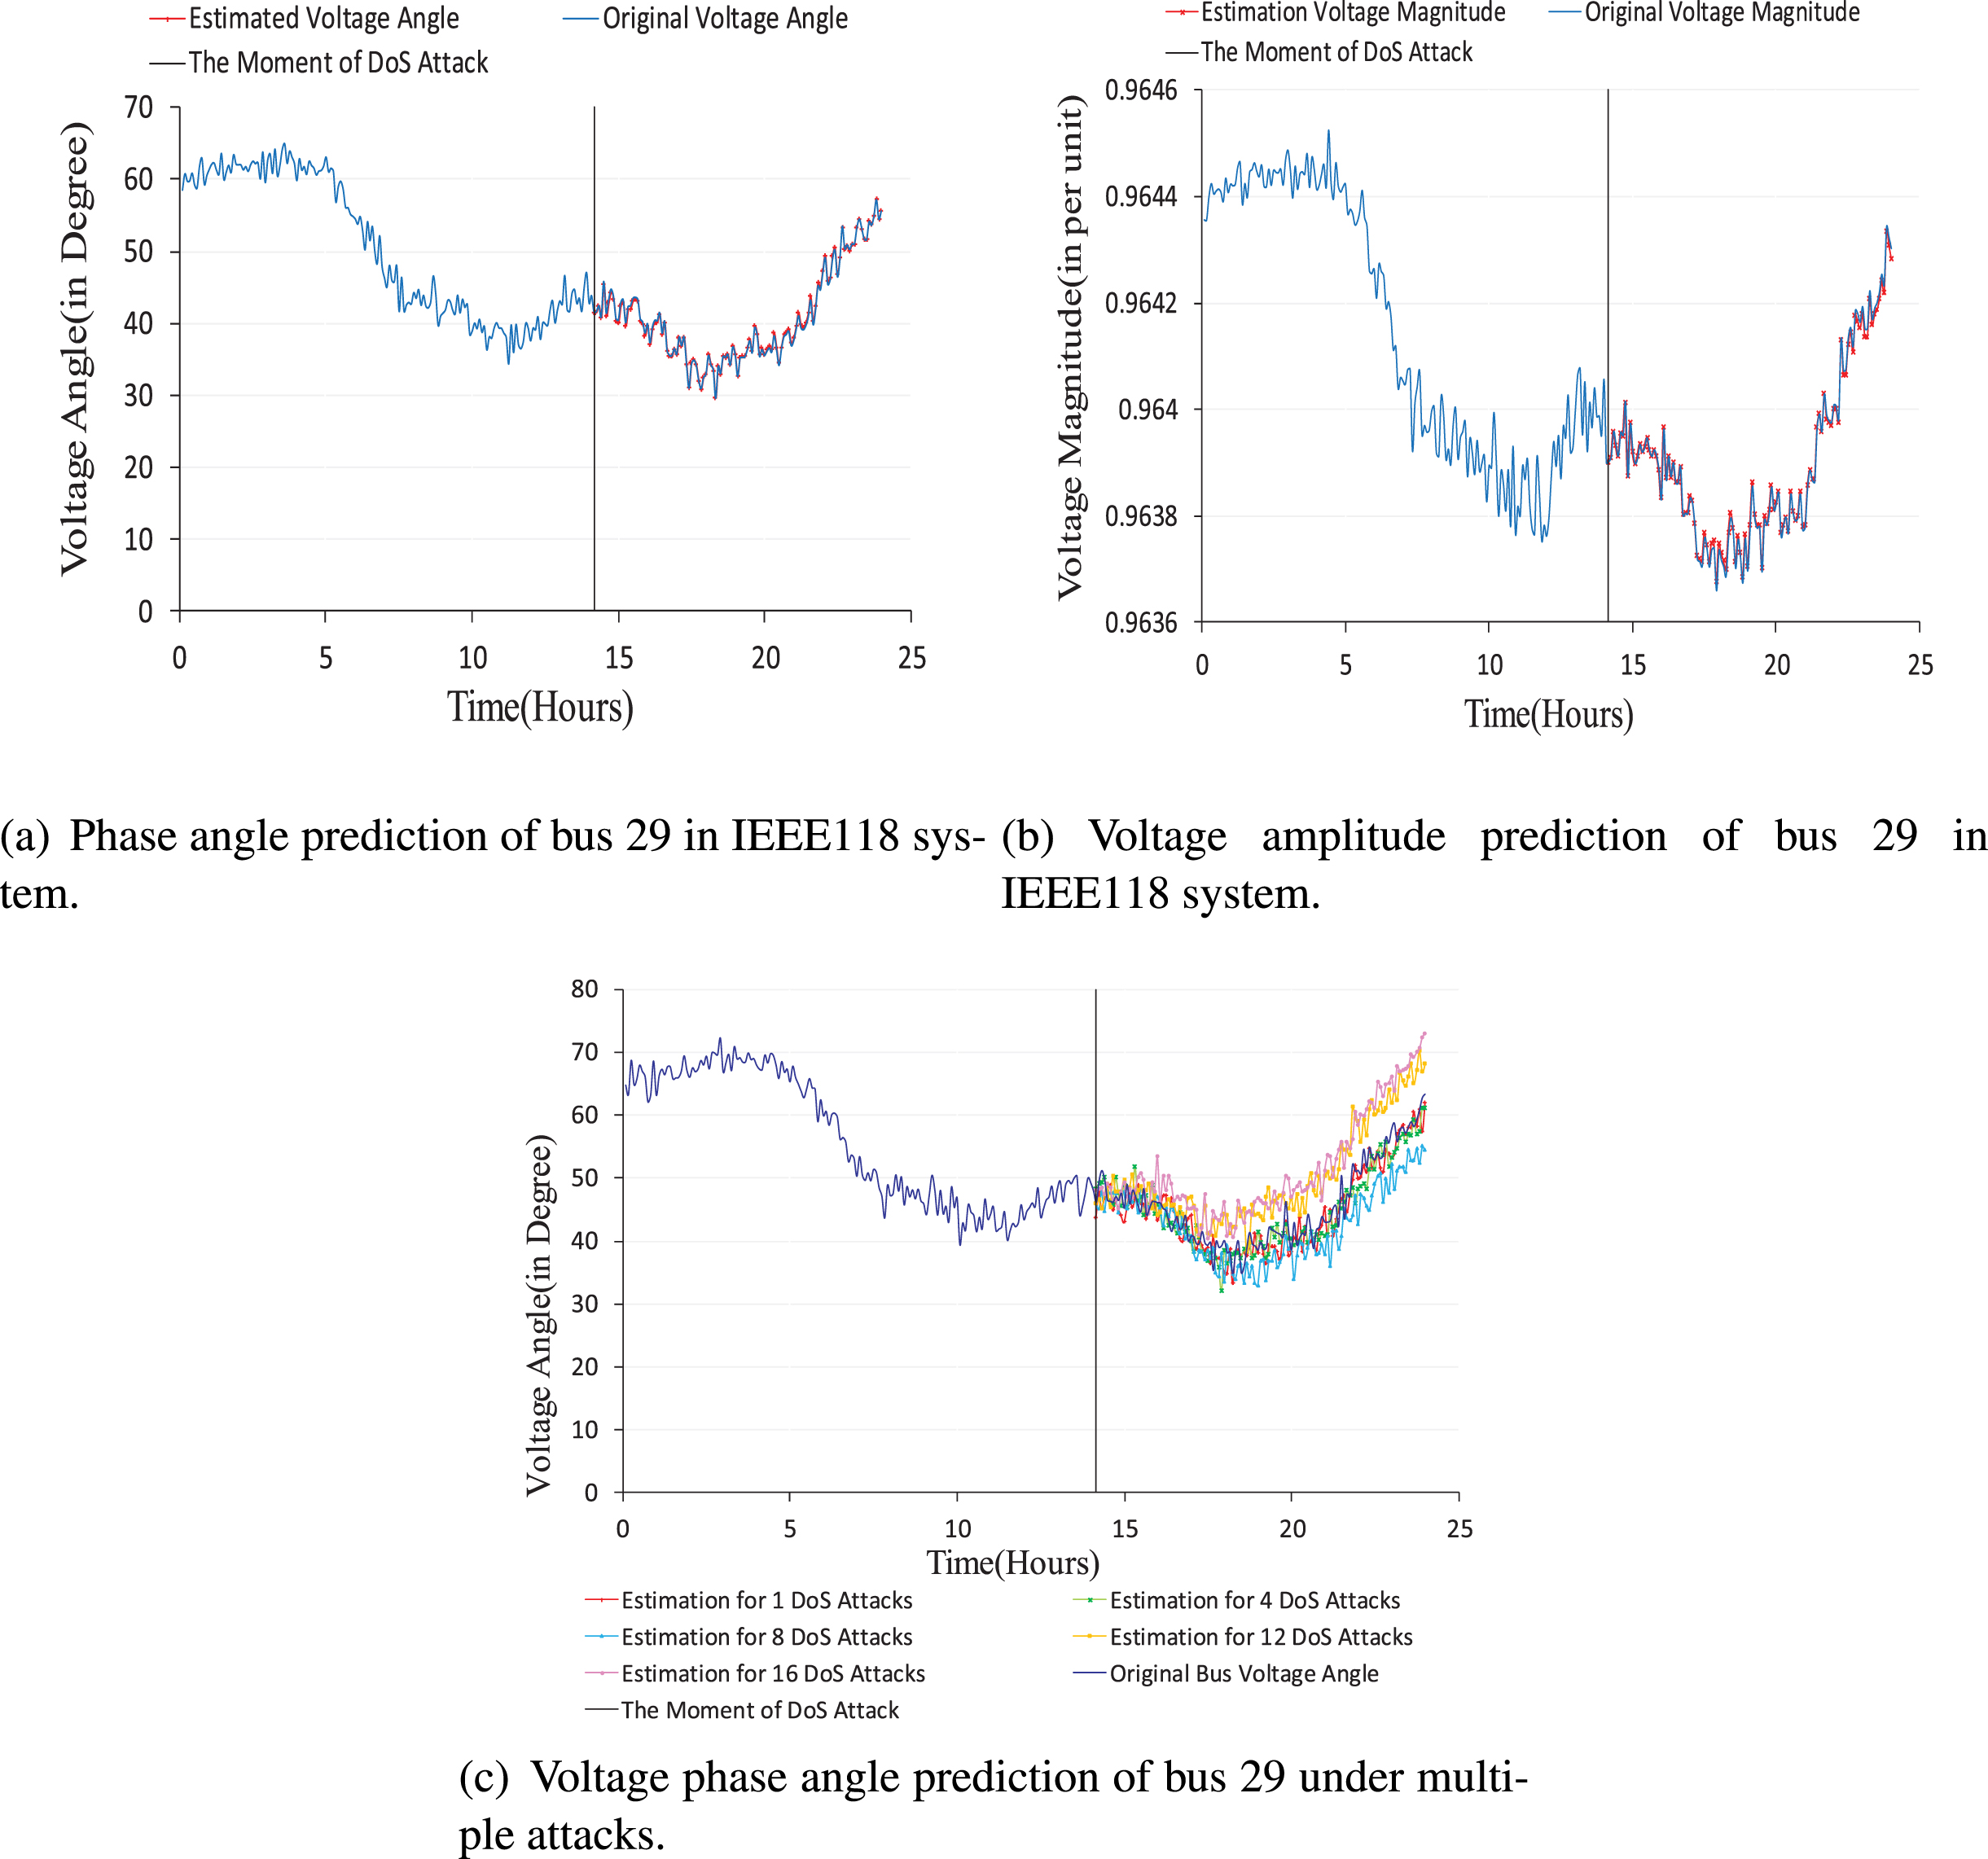
Voltage phase angle and voltage amplitude prediction under DoS attacks.
To provide more points of comparison, Table 3 shows the RMSEs, MAEs, MSEs, MAPEs of voltage angle prediction for bus 2. It is clear that the prediction accuracy of the method is declining as the number of attacked PMUs installed on buses increase. Moreover, the prediction curve is consistent with the trend of the true state curve, although 16 PMUs are under attacks. The observations in Table 3 support the implication of Fig. 8(c). Therefore, the proposed method has a good performance of state prediction within a certain range of attack times.
Comparison of voltage angle prediction accuracy
The number of network layers has a considerable effect on the result of the state prediction. We analyze the accuracy of the state prediction by the different layers. We set the step of increasing ɛ as 1 to find an optimal number of layers when the ɛ is between 1 and 5. Fig. 10. shows the accuracy of the prediction for five different ɛ values. From the figure, as the ɛ increases, the forecast accuracy increases before two layers in terms of the RMSE, MAE, MSE, MAPE. In contrast, the forecasting accuracy decreases for ɛ value larger than 2. It demonstrates the occurrence of data overfitting when the ɛ value reaches 2. The forecast results of some buses in different network layers in Table 4. support this point. It is clear that the prediction accuracy of two layers network is higher than that of four layers network. Moreover, the two layers network also has more advantages in terms of the required time. Therefore, the optimal ɛ value for the proposed method is 2 when the lowest point.
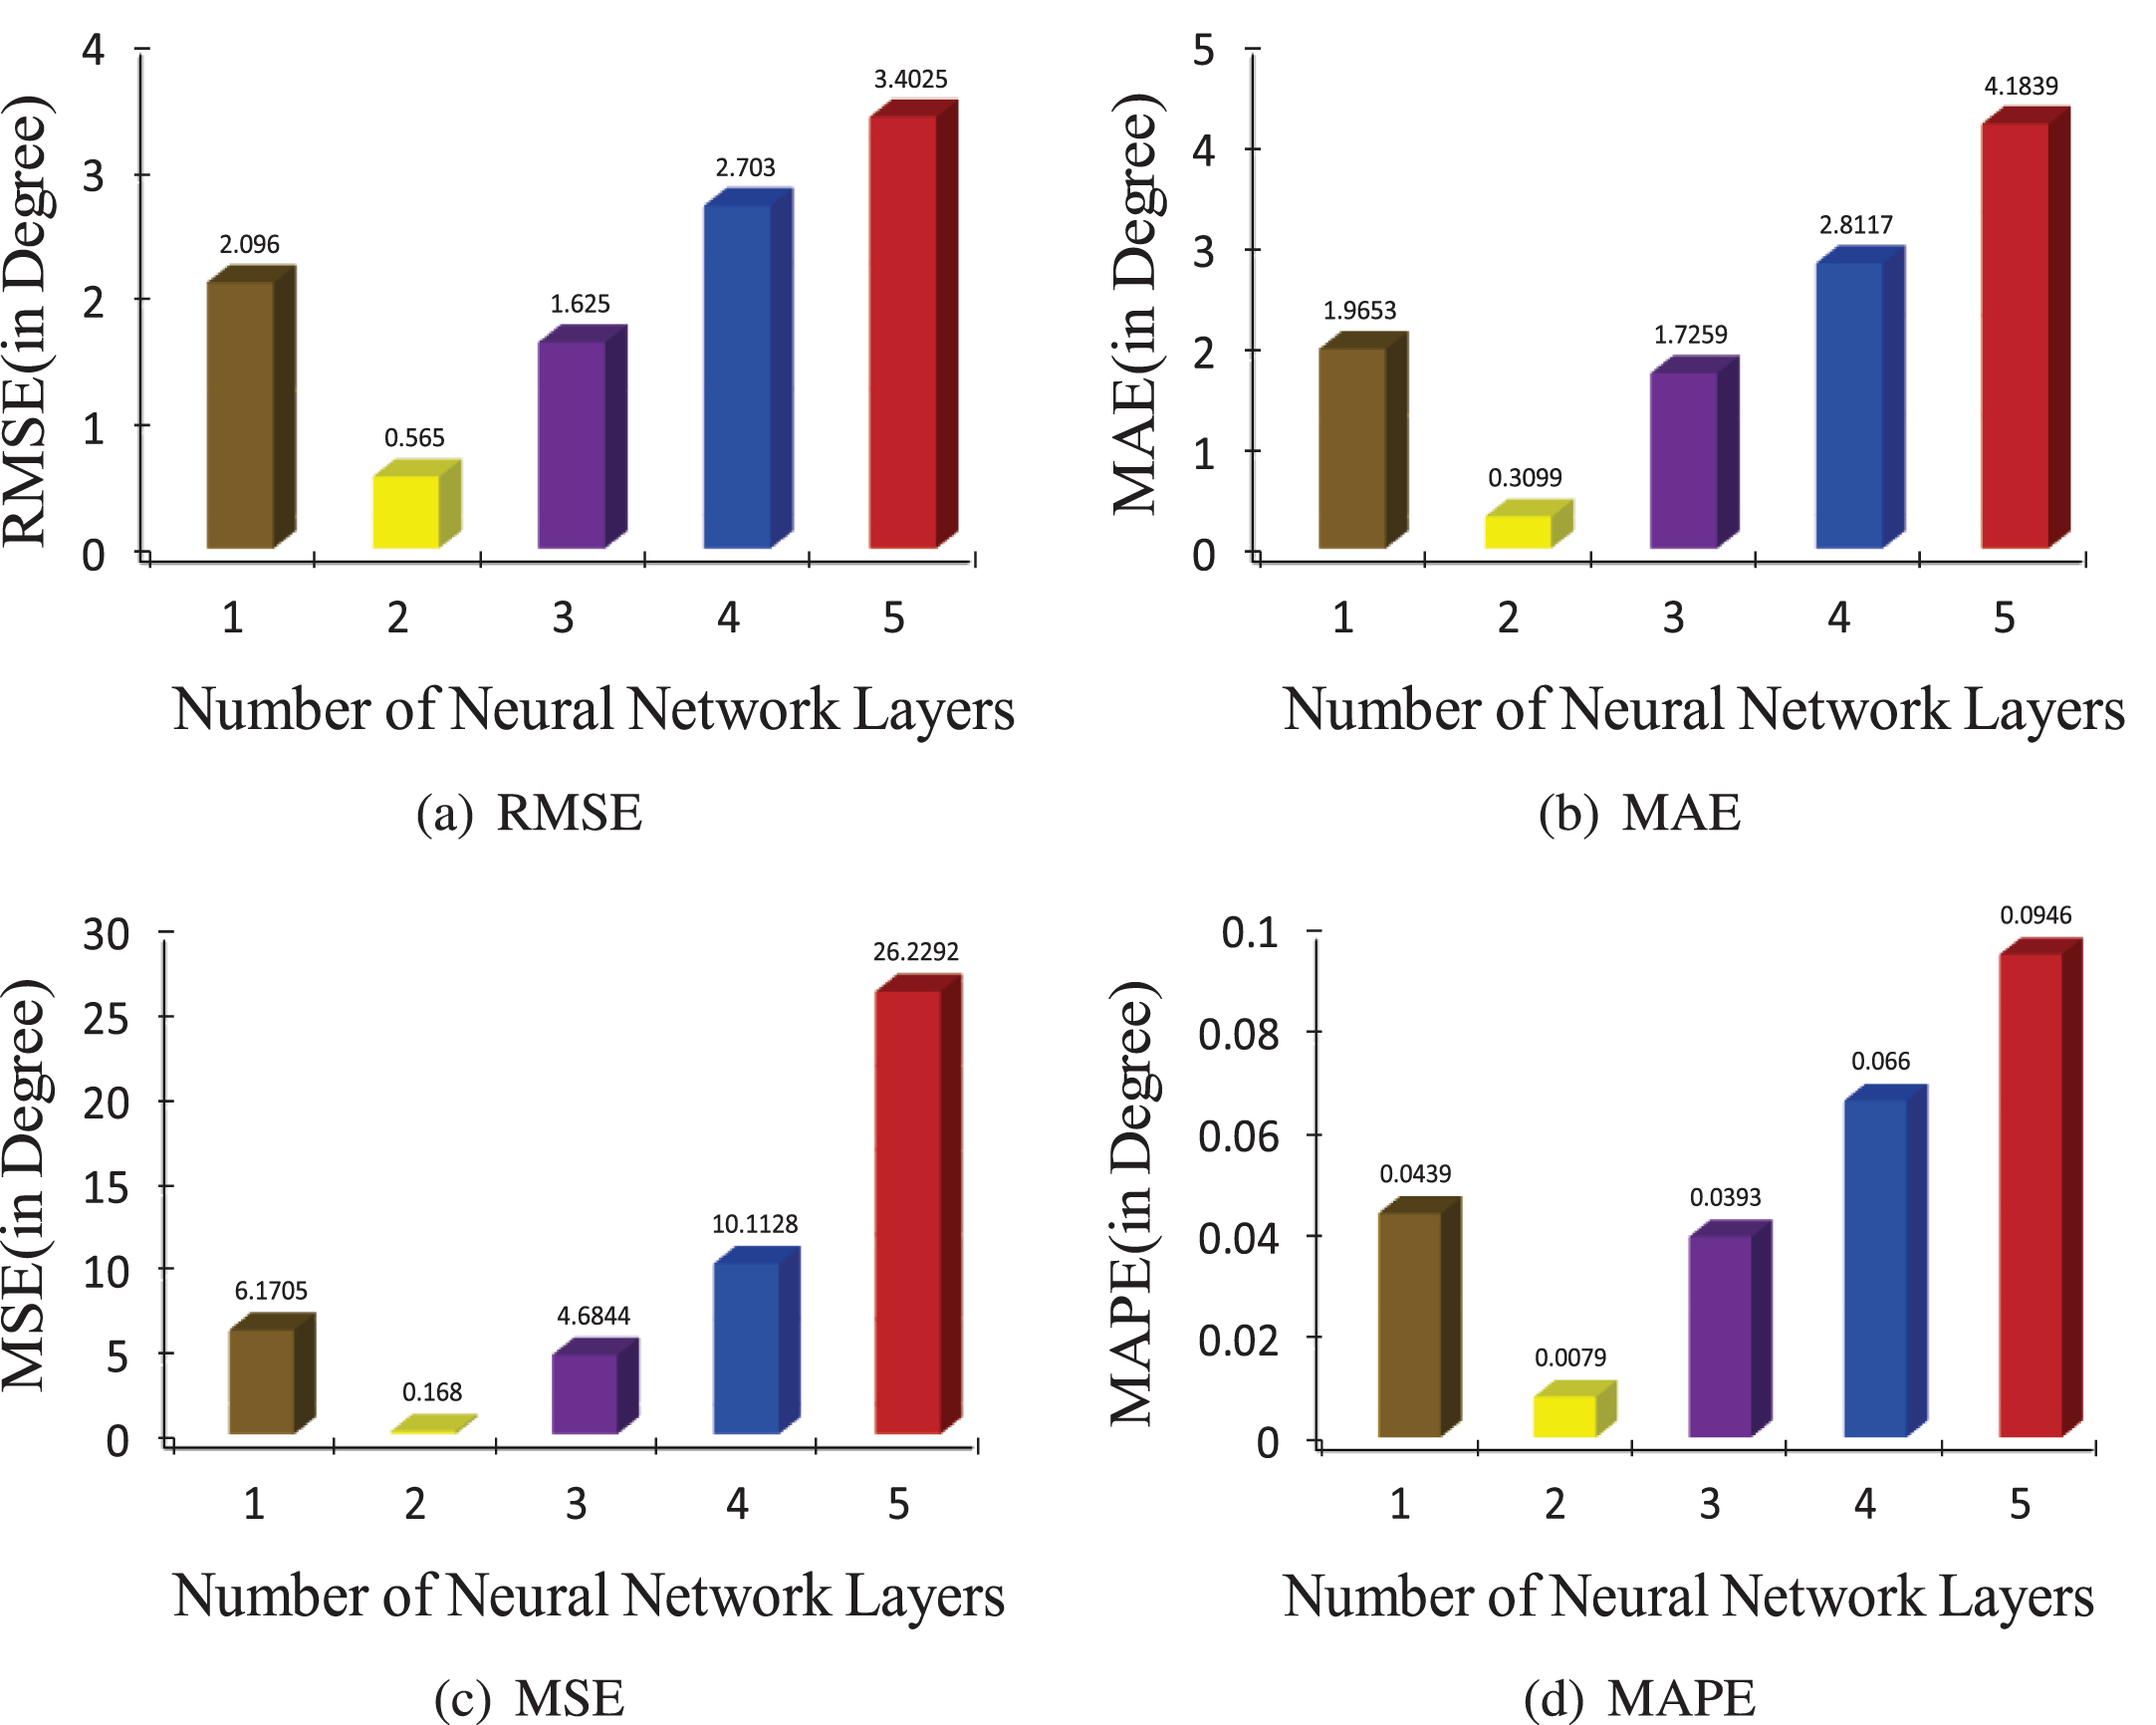
The influence of layer number of neural network on state prediction.

The boxplots of forecasting error under single DoS attack.
The forecast results of some buses in different network layers
The extent of the vulnerable attack of the bus can be identified on the voltage phase forecasting accuracy. Fig. 11. shows the boxplots of forecasting error under a DoS attack. The abscissa represents the order of optimal PMU placement results. From Fig. 11., these results show that forecasting errors are slightly higher in 16-bus, 17-bus, and 28-bus. That is, it can create more of the unobservable risk of the system when the adversary launch attack at PMU installed on bus 16. On the other hand, this bus may attract the adversary’s attention, which increases the probability of attack. These results have important implications for using neural networks for predicting the missing states of the system and implementing defend DoS attacks in this paper. Considering the extent of the vulnerable attack, how to deploy PMU to improve the robustness of the system is a critical issue.

Comparison of state prediction based on LSTM with other methods.
In this section, we examine the effect of applying LSTM/ARIMA/BP/RNN/TCN networks for state prediction. The input and output settings of these algorithms are the same as the utilized LSTM network in this paper. In order to achieve the optimal performance of the ARIMA algorithm, the ARIMA model order is determined by the Akaike Information Criterion (AIC) [42]. The learning rate and maximum iteration number of the BP algorithm are set to 0.01 and 1000 in this paper. When the RNN network layer number is set to 2, the learning rate is set to 0.001, and the hidden neuron number is 150, the utilized RNN algorithm reaches optimal performance. The utilized TCN networks model of this paper is set as follows. The number of filters is 32, the kernel size is 3, the dilation is [1, 8], the epochs is 120, and the window size is 20.
Figure 12 indicates the prediction accuracy of voltage angle for all buses when there are DoS attacks. From Fig. 12, the observations can be drawn: (i) LSTM shows the best performance compared to ARIMA, BP, and RNN; (ii) RNN performs slightly better than ARIMA and BP in terms of RMSE;(iii) The results of based ARIMA method show a higher error on voltage angle prediction but closer to true voltage angle at certain nodes.
Comparison of prediction performance of bus 29 phase angle.
In order to provide more points of comparison, the voltage angle RMSEs, MSEs, and MAEs for LSTM/ARIMA/BP/RNN are presented in Table 5. As illustrated, LSTM outperforms ARIMA, RNN, and BP in all metrics used. Specifically, LSTM is seen at RMSE approximately 1.5, 1.9, and 2.3 times that of RNN, ARIMA, and BP, respectively, at bus 56. In terms of MAE, LSTM shows approximately 1.1, 6.5, and 7.1 times that of RNN, BP, and ARIMA, respectively, at bus 29. Moreover, the RMSE obtained using LSTM is the lowest at bus 29 and bus 56; the MSEs and MAEs obtained using RNN and LSTM are relatively close at bus 29 and bus 56. The observations in Table 5 support the implications of Fig. 12.
Compare the prediction accuracy of different methods under the 29-bus and 56-bus
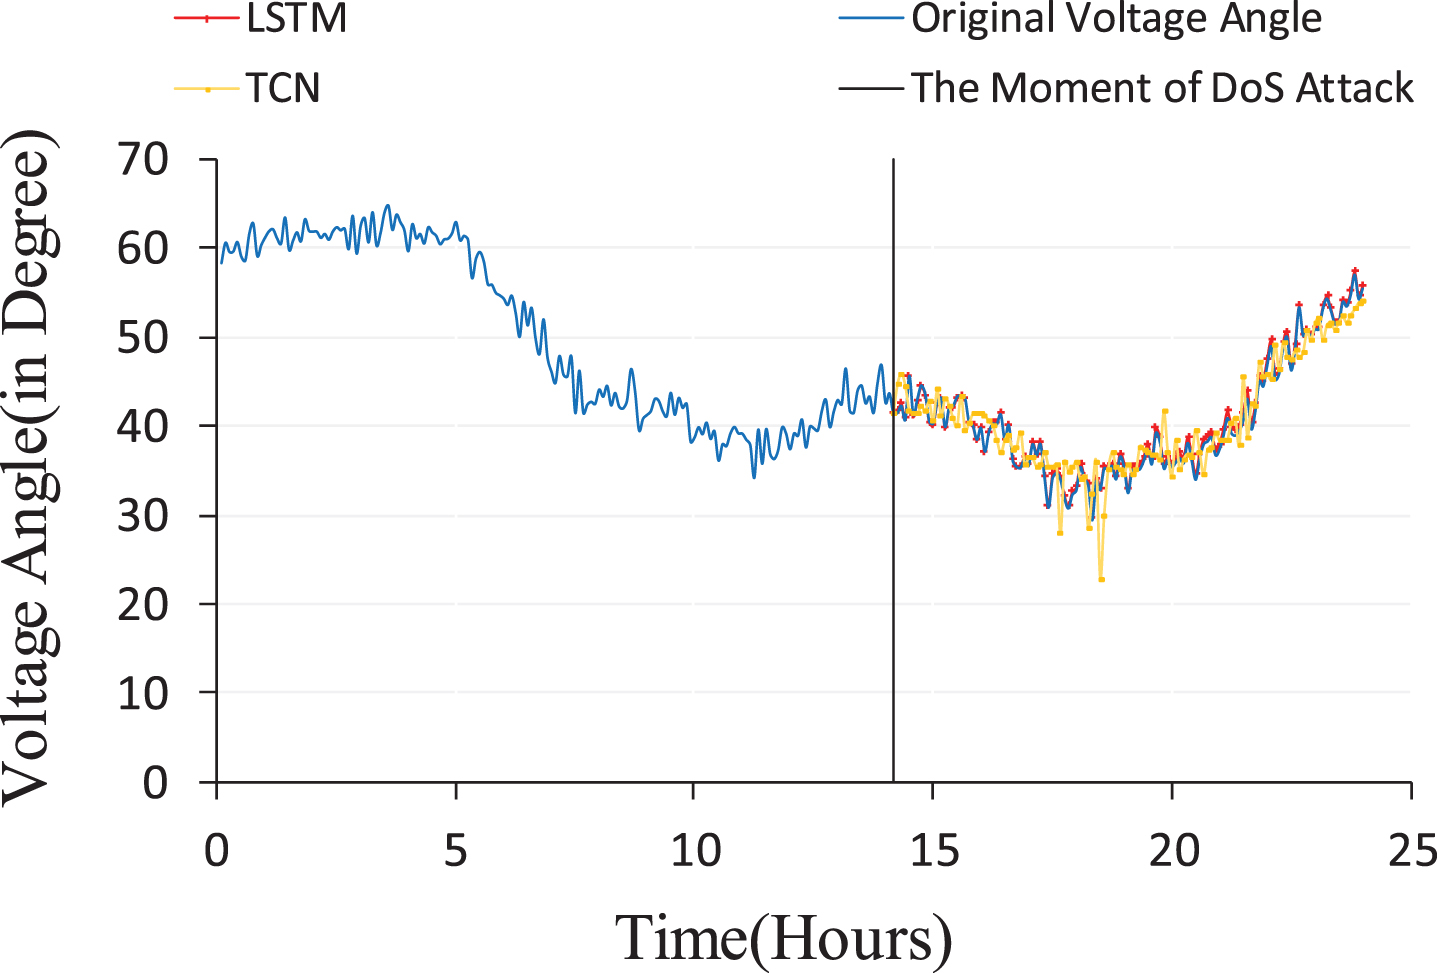
Figure 13 shows the comparison of the prediction performance of the phase angle of bus 29 under a DoS attack. The blue curve represents the true time series, the red curve represents the predicted time series using LSTM, and the yellow curve represents the predicted time series using TCN. The black vertical line represents the time of the attack. In Fig. 13, it can be seen that the prediction curves of LSTM and TCN seem to track the true curve accurately. In terms of prediction accuracy, the RMSE of LSTM is 0.3065, and the RMSE of TCN is 1.01. In addition, the prediction curve of TCN has large deviations at individual times. In terms of computation time, the LSTM networks required 21s, and the TCN networks required 23.08s in this paper.

Comparison of the prediction performance of the phase angle of bus 10 under multiple attacks.
Figure 13 shows the comparison of bus 10 phase angle prediction performance under a different number of DoS attacks. The blue curve represents the actual time series, the red curve represents the predicted time series using LSTM, and the green curve represents the predicted time series using TCN. The black vertical line represents the time of the attack. The observations in Fig. 13 support the implications of Fig. 12. In addition, the prediction accuracy of LSTM and TCN both decrease with the increase of the number of DoS attacks. But the utilized LTSM networks of this paper are more robust than the TCN networks. Therefore, the LSTM networks can also be employed to predict PMU data to improve the performance of the system even within a certain number of DoS attacks.
In this paper, we propose a method for accurately predicting the missing states using the LSTM method. This paper proposes a method that enables learning of spatial-temporal correlations among PMU measurements and reducing the cost of PMU deployment. The proposed method is tested on IEEE 118-bus. The simulation indicates the proposed method has a good performance of state prediction within a certain range of attack times. By comparing the prediction accuracy for various layers, the most optimal number of layers is determined. Compared with other methods, the proposed method outperforms ARIMA by 1.9%, RNN by 1.5%, and BP by 2.3% in terms of RMSE. In summary, the proposed technique shows high performance in state predicting. Future work includes: To exploit neural network model for state prediction by considering the more complex DoS attack model. To further exploit the potential LSTM network for state prediction by considering the topology change.
Footnotes
Acknowledgments
This work was supported by National Natural Science Foundation of China (Grant 61703347); Fundamental Research Funds for the Central Universities (Grant XDJK2020B010); Chongqing special fund for technological innovation and application development (Grant cstc2019jscx-fxydX0017); Natural science foundation of chongqing (Grant stc2021jcyj-msxmX0416).