



Abstract
Globally, the second most common cause of death for female cancer patients is breast cancer. In the United States, about 11,000 females aged below 40 are diagnosed with invasive breast cancer each year. Early detection of breast cancer is the foundation for preventing the progression of the disease, and the diagnosis can be conducted using intelligent systems for quicker detection. Based on the FUZZYDBD method and bootstrap aggregation (bagging) technique, the Bagging fuzzy-ID3 algorithm (BFID3) was proposed for this study. This method combined the techniques of the fuzzy system, ID3 algorithm and bagging. For BFID3’s data fuzzification, the automatic fuzzy database definition method, known as the FUZZYDBD method, would assist in developing the fuzzy database. One of the weaknesses of the ID3 algorithm is its incapability to handle continuous data. The problem was resolved via the linguistic variable replacement and data fuzzification in the BFID3. Meanwhile, this paper’s implementation of the bagging technique improved the generalization ability and reduced overfitting. Additionally, BFID3 was verified through an extensive comparison with several existing methods to investigate the competency of the proposed method. The study identified that BFID3 was proficient in breast cancer classification.
Introduction
Breast cancer is one of the most aggressive types of cancer, and in the United States alone, about 11,000 females aged below 40 years were diagnosed with invasive breast cancer. Breast cancer is one of the most aggressive types of cancer, and in the United States alone, about 11,000 females aged below 40 years are diagnosed with invasive breast cancer each year [1]. Breast cancer is the most common non-dermatologic malignancy, with up to 80% of invasive breast cancer is infiltrating ductal carcinoma, while invasive lobular carcinoma comes in second [2]. Breast cancer is largely caused by a family history of the illness and inheritance of genetic abnormalities, but obesity, hormone therapy (progestin and oestrogen), increasing breast tissue density, alcohol consumption and physical inactivity could all be the risk factors. [3]. Several complications were connected with breast cancer because of the primary tumor’s metastasis through lymphatic spread to other distant organs [4]. The pathogenesis of breast cancer is still unknown, but the tumor microenvironment and breast cancer stem cells (CSCs) have been associated with breast tumorigenesis [5]. In recent years, the death rates from breast cancer have decreased due to advancements in treatment. Nevertheless, the young breast cancer patients had aggressive biological traits and were commonly identified at an advanced stage, resulting in worse results than elderly premenopausal and postmenopausal women [6]. Thus, early detection of breast cancer is the foundation to prevent the progress of the disease [7].
The utilization of an intelligent system to detect breast cancer is beneficial in the medical field as it can assist in early detection. Various machine learning techniques are available for cancer detection [8]. The more commonly known machine learning techniques, such as the Neural Network, Decision tree and Support Vector Machine, can be used to classify cancer [9, 10]. The algorithm, known as Bagging fuzzy-ID3 (BFID3), was proposed in this paper to improve the efficiency of the classification of breast cancer. The advantages of this method include the ability to endure information uncertainty and inaccuracy in the fuzzy representation, reducing high variance, and avoiding multicollinearity. However, BFID3 requires defining the fuzzy database to conduct the data fuzzification. Formal methods, such as fuzzy clustering and genetic algorithms, were commonly used for the automatic fuzzy database definition. Nevertheless, they have high computational cost and complexity, and they do not necessarily show the best result, as there are no general rules to select the most suitable method for each specific domain [11].
Therefore, this paper implemented the automatic fuzzy database definition method proposed by Marcos Cintra and Heloisa Camargo, known as the FUZZYDBD method, to define the BFID3’s fuzzy database. BFID3 conducted data fuzzification and replaced the numerical values with the fuzzy sets’ linguistic values with the highest degree of compatibility. Thus, it resolved the limitation of Iterative Dichotomiser 3 (ID3) that could not classify continuous data. The bagging technique was implemented in this study to solve the overfitting and poor generalization issue in the traditional ID3 algorithm. The implemented bagging technique improved the generalization, solved overfitting, reduced the high variance and increased the algorithm’s stability. The proposed method’s performance was validated by implementing verification and testing processes. The following contents of this paper covered topics on the materials and methods, experimental results, discussions and the conclusion for this study.
Materials and methods
Fuzzy system
Lotfi A. Zadeh (1965) proposed the fuzzy system as a precise imprecision logic based on the degree of truth [12]. The system worked with logical variables with values ranging from 0 to 1 and was typically used to resolve the issues of data imprecision by utilizing the fuzzy set theory. It encompassed a multitude of critical attributes, whereby fuzzifier, inference engine, fuzzy base, knowledge base and defuzzifier denoted four of the key features. In general, fuzzy systems necessitated the domain features to be granulated to undertake fuzzification using the fuzzifier, in which they comprised fuzzy sets and membership functions [13]. A single distinct membership function uniquely defined each fuzzy set [14], and the resulting labels corresponding to the fuzzy sets were typically employed to represent the membership functions. Furthermore, every fuzzy set was allocated an input factor comprising a range of values [15], whereas the degree of membership implemented for the measurement of membership grade of the fuzzy sets was stored in the membership functions. A Rule-Based Fuzzy System consisted of components, namely a knowledge base and an inference mechanism [16]. A fuzzy rule base (FRB) holds a set of fuzzy rules for the dataset, while a fuzzy database depicts the fuzzy set definitions, in which linguistic variables incorporated in the FRB were included [17]. Alternatively, the inference mechanism (otherwise termed inference engine) opted for fuzzy reasoning to generate the system outputs, whereby fuzzy rules were employed for input-to-output mapping. It generated the most appropriate consequences for each rule accordingly. Besides, the rules and membership functions denoted fuzzy parameters, which were interdependent and necessary in establishing a fuzzy inference system (FIS) [18].
The application of linguistic variables, the dependency of variables through conditional rules, and the validation of complex dependency using the fuzzy method are the most prominent characteristics of the fuzzy system [19]. The use of linguistic variables indicates that the variables can be interpreted in the natural language using the fuzzy technique. The interdependence of variables through conditional rules means that linguistic variables express attributes in the antecedent part of the fuzzy rules, while classes are represented in the subsequent part. The interrelationship of class and linguistic variables can be justified with fuzzy logic when complex interdependence is validated using fuzzy methods. Finally, defuzzification is performed when crisp values are required, and the results are aggregated to produce crisp output. Defuzzification, which occurs in the defuzzifier, is a process that uses the fuzzy set and membership degree to convert fuzzy output to crisp output [15, 20]. The center of gravity, mean of maximum and center average methods are the most well-known defuzzification methods [21]. The fuzzy system is a popular machine learning method because it is easier to use than other methods while still producing high accuracy rates [22].
According to research conducted by [23], the fuzzy technique effectively detected breast cancer, with an accuracy of over 98%. According to a study by [24], the fuzzy technique’s classification accuracy was achieved at 94.26% by classifying the histopathology image dataset. Meanwhile, the classification results of the breast cancer thermogram dataset achieved a diagnostic accuracy rate of 80% using the fuzzy technique [25]. The method’s efficiency in solving classification problems was demonstrated by the high accuracies obtained in previous studies.
Decision tree: ID3 algorithm
A decision tree (DT) is one of the most famous classification methods in machine learning. Implementing DT in classification has several benefits, including the suitability to be applied with large sample sets [26]. The ID3, C4.5 and CART algorithms are the three most well-known decision tree learning algorithms. The research on the ID3 algorithm was conducted in this paper because it was the most widely used learning algorithm [27–29]. Quinlan (1986) created the Iterative Dichotomiser 3 algorithm known as the ID3 [30, 31]. The ID3 algorithm implements recursive partitioning in which the current training data is split into subsets, and the subsets are then divided into partitions, which make up the decision tree [26, 32]. Shannon’s entropy and information gain was used as attribute selection criteria in the ID3 algorithm [33]. The ID3 algorithm selected the highest value of information gained in every tree branching to identify the most suitable attributes. The decision tree branches recursively used a top-down greedy approach until the termination conditions were met, such as all dataset’s attributes were fully utilized or all balance instances had the same class. The ID3 algorithm could be used for classification only if the dataset has more than one class. The ID3 algorithm generated the class prediction rules while highlighting the attributes or features of each class [34]. The algorithm would also generate a smaller tree size because it used quality measures and logical reasoning.
For the classification of the domain of breast cancer, the research conducted by [35] tested the ID3 algorithm’s capability and performance using the MRI mammogram image dataset. This dataset comprised three-class features, namely normal, malignant, and benign. ID3 algorithm’s average classification accuracy was 99.9%, while it took 0.03 seconds for training time. Therefore, it indicated that only a short training time was required for this method to achieve good classification results. Furthermore, based on the research in [36], using the Wisconsin Breast Cancer Dataset (WBCD), the algorithm could achieve 90.56% of prediction accuracy. The researchers in [37] found that the ID3 algorithm outperformed the classification accuracy of classifiers like C-PLS and Naïve Bayes for the Wisconsin Prognostic Breast Cancer (WPBC) dataset. Therefore, implementing the ID3 algorithm could lead to several benefits, especially a shorter execution time [38, 39].
The automatic fuzzy database definition (FUZZYDBD) method
The fuzzy automatic definition method is a key to developing a fuzzy database faster. Notably, the fuzzy database’s automatic definition involved three elements [40]. They were the membership functions’ shape, the number of fuzzy sets corresponding to every domain’s feature and the distribution of the fuzzy set corresponding to every feature [41]. Several techniques could be applied to define the fuzzy databases that determined the number of fuzzy sets, like the artificial neural network, KNN, and the genetic algorithm. However, despite the existence of numerous methods, the number of fuzzy sets was defined through empirical testing in various studies, whereby the fuzzy sets were evenly distributed due to the adjustable fuzzy logic flexibility that could lead to better performance and the availability of mostly high complexity methods. Additionally, the guidelines and consensus regarding the best existing methods for every domain and application remained lacking [42].
The FUZZYDBD method introduced in [43] was studied in this research in light of its efficiency, simplicity and rapidity in defining the fuzzy database [44]. Empirical testing in numerous domains had been carried out using this method, inclusive of breast cancer. All required elements (e.g., fuzzy sets distribution) were aggregated via the FUZZYDBD method to define the fuzzy database [16, 45]. The usage of the Wang-Mendel method for the number of fuzzy sets definition [46], the utilization of the method known as the Equalized Universe method for the fuzzy sets’ distribution to all domains’ features and the implementation of triangular membership functions were the FUZZYDBD method’s approaches, as depicted in Fig. 1.
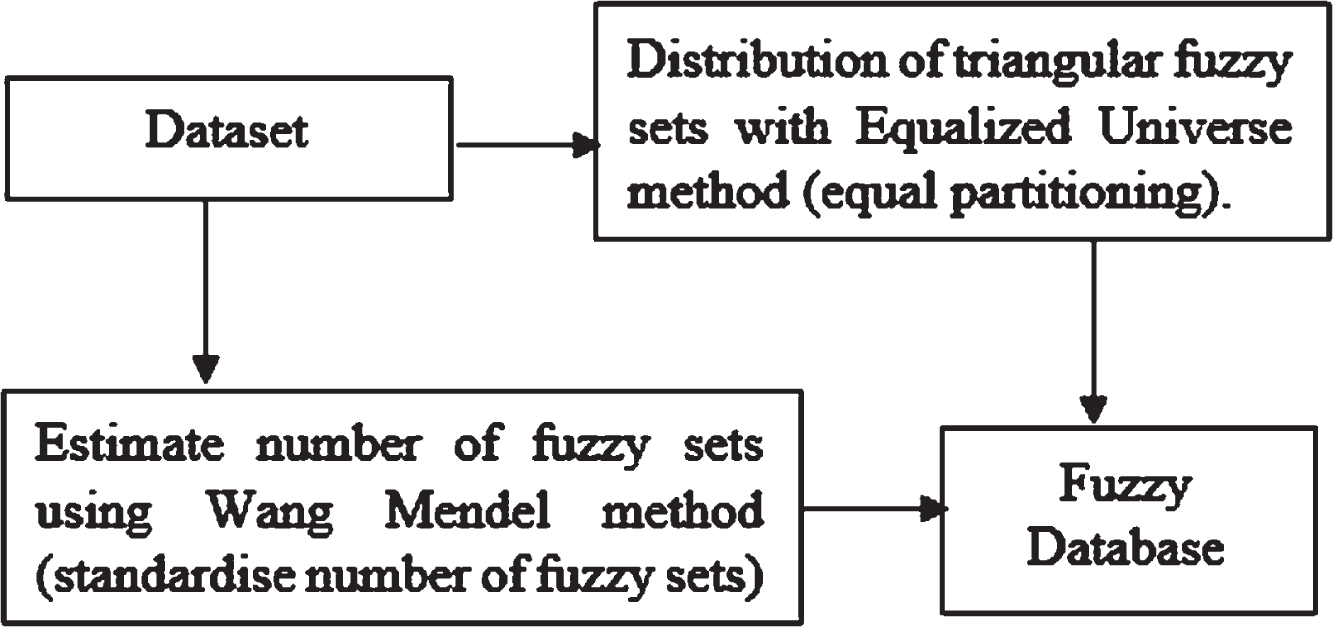
Approaches of FUZZYDBD method.
The number of fuzzy sets could be from two to ten triangular membership functions, and the number of fuzzy sets was standardized and identical for all the features in the dataset. Empirical testing was utilized to determine the most fitting value for the number of fuzzy sets within the defined range. A domain expert could define more appropriate values for the fuzzy sets corresponding to the dataset’s features [44]. In order to define the fuzzy sets, a similar number of fuzzy sets, the shape of fuzzy sets and distribution throughout the domain were applied by the Wang-Mendel method. The numbers three, five, and seven were generally utilized in the FUZZYDBD method, although the number of fuzzy sets ranged between two and ten could be used [42, 47]. For the breast cancer datasets, two and three represented the most accurate estimated number of fuzzy sets, whereby the error rate was the lowest [41, 43].
FUZZYDBD applied the Equalized Universe method concept that Chen and Wang had developed in 1999 [41]. In this method, every fuzzy set had similar width to ensure that the fuzzy sets were equally partitioned for the features of the domains. The triangular membership function’s leftmost peak was where the minimum value was placed, while the rightmost peak was where the maximum value was placed. This method has been extensively utilized in the existing literature [13, 47]. In FUZZYDBD, every membership degree of the domain’s area was not more than 0.5, whereby the triangular shape membership functions were applied, as every membership function had a half overlap between themselves. The effortless production of fuzzy databases was one of the significant advantages of this method.
Bootstrap aggregation, also known as bagging, refers to an ensemble technique capable of improving the instability of weak classifiers [48]. It allows the reduction of variance in the base classifiers to perform variable selection and variable fitting in a linear model. Such a technique generates numerous versions of base classifiers, following which the outcomes are aggregated for predicting the results [49]. In general, the bootstrap sampling technique with replacement guarantees the independence of each bootstrap. Similarly, the generalization capacity of the base classifiers may be enhanced due to its utilization of majority voting for predicting the categorical class, while the base classifier outputs are averaged for projecting a numeric outcome [50]. The primary advantage of bagging lies in its ability to enhance the model stability, minimize overfitting and improve the capacity for handling small datasets due to lesser sensitivity for outliers and noise [51–53]. For example, the bagging CART algorithm equipped with feature selection had yielded a higher accuracy of 95.96% in contrast to the standard CART’s accuracy level of 94.72% using the WDBC (Diagnostic) dataset [54]. Alternatively, bagging random tree had generated an area-under-the-curve (AUC) of 98.82%, whereas random tree had obtained a value of 96.9% by employing the Srinagarind Hospital’s breast cancer dataset. Meanwhile, a classification accuracy of 73.8182% and 72.37% were obtained for the bagging Naïve Bayes and Naïve Bayes algorithms, respectively, through the UCI repository’s breast cancer dataset [55, 56].
Proposed method: bagging fuzzy-ID3 algorithm (BFID3)
The BFID3 implemented the bootstrap sampling with replacements with ID3 algorithm as the base classifiers handling the fuzzified data, whereby the FUZZYDBD approach was utilized to define the fuzzy set parameters that were necessary for fuzzification processes. The reasoning process incorporated in BFID3 was easily comprehended in which inductive reasoning was employed for each tree, whereas the majority voting was applied in determining the final predicted class. In particular, BFID3 computed the fuzzification process for each continuous and integer attribute available in the dataset. The majority voting was implemented using aggregated predictions from each tree to obtain the most suitable final predictions for the test data. Besides, fuzzification was applied by BFID3 to the entire dataset and ensured favorable preservation of patients’ privacy as accurate data on this matter, which was well-concealed. Undoubtedly, sustaining the security and confidentiality aspects of patients’ records for medical privacy. Thus, the linguistic terminologies encompassing the complete domain were collectively supported and ensured that the decision trees yielded better classification performance [57].
The steps for BFID3 implementation commenced with a listwise deletion in handling any missing data, following which the membership function for continuous and discrete (integer) attributes in the dataset was defined via the FUZZYDBD method. The definition of the membership functions was undertaken by the triangular equal partitioning membership functions and a standardized figure of fuzzy sets for each attribute (i.e., all attributes displayed an identical fuzzy set count). Prior studies detailing the FUZZYDBD method had mostly opted for three, five and seven fuzzy sets [42, 47]. Furthermore, the value of three was associated with the breast cancer domain as the best-projected fuzzy set number together with the value of two. Henceforth, the current study opted for the value of three across all attributes, except for the case in which a medical expert’s advice for an alternative fuzzy set number being employed for respective attributes. Furthermore, the fuzzy sets were established by positioning the maximum and minimum attribute values at the peak of the rightmost and leftmost triangular membership functions, respectively, for the respective attributes. The values were then substituted with the fuzzy set linguistic labels with the highest degree of compatibility to the input values, transforming the dataset into a linguistic format. Integer-valued attributes were also undertaken with the processes to ensure higher classification accuracy. Thereafter, a division of the training and test data was done by implementing a 10-fold cross-validation technique, wherein the training data was then subjected to bootstrap sampling with the replacement. Accordingly, BFID3 employed the ID3 algorithm as the base classifiers incorporated the information gained as the criteria for the attribute selection. Subsequently, multiple versions of fuzzy decision trees were obtained from the fuzzified bootstrapped training data in which the reasoning mechanism was employed in each tree to ascertain the test data projection. Thereafter, predictions from each tree would be aggregated, and the final predicted class for the test data was identified via majority voting. Fig. 2 displays the flow of BFID3.
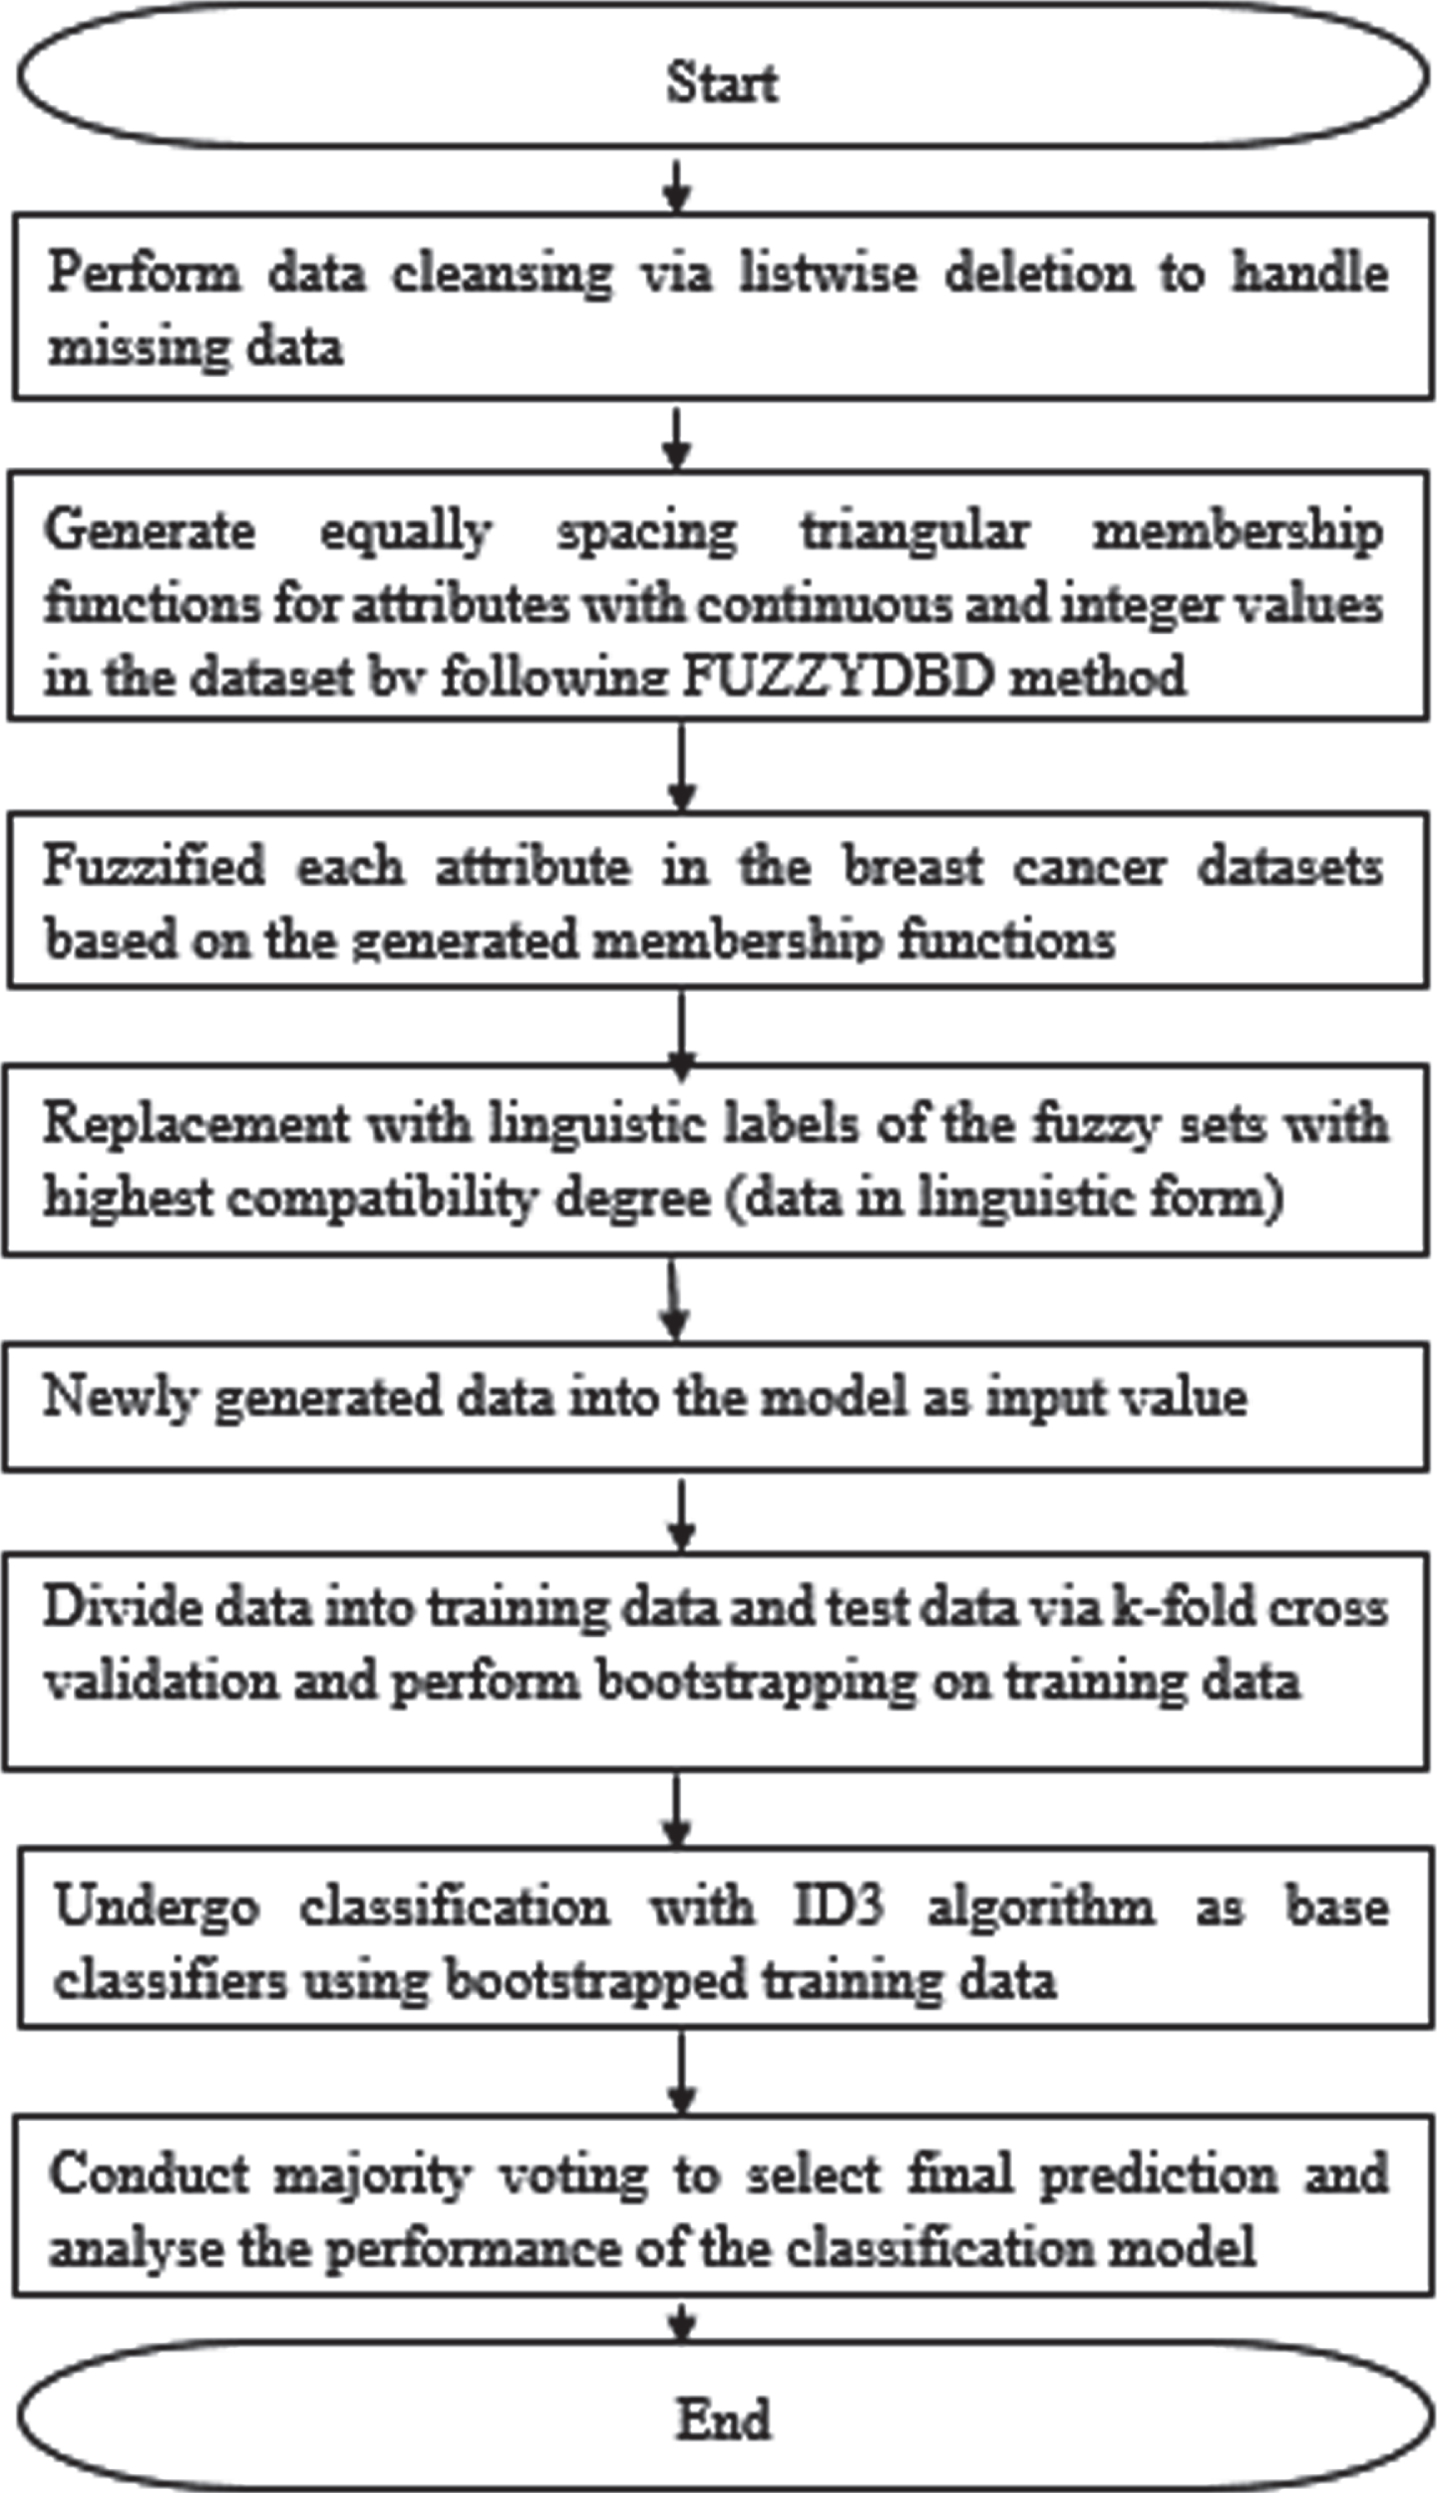
Flow of BFID3.
The fuzzy values of this study were set to three linguistic variables, which are “low”, “medium”, “high”, where all attributes in the collected datasets would undergo transformation to be in terms of a linguistic variable. Thus, the automatically generated fuzzy rules acquired from the fuzzy decision tree model are comprehensible. Thus, the generated fuzzy rules acquired from the fuzzy decision tree model are comprehensible. In BFID3’s data fuzzification, it was possible for both the fuzzy values (e.g., medium and high) to achieve 0.5. Hence, the algorithm should be set up to randomly choose between the two linguistic labels or set up value standardization. Nonetheless, the circumstances in which both fuzzy values achieved 0.5 were rare. If the situation in which the newly tested data value exceeds the value of the peak, whereby the rightmost triangular membership occurs, then it is automatically set at “high”, while if the value is less than the peak of the leftmost membership function, then it is set at “low”, which corresponds to the use of “low”, “medium”, “high”.
All the breast cancer datasets were collected from the UCI machine learning repository: WBCD (Original), WDBC (Diagnostic) dataset, Coimbra and Mammographic Mass. WBCD (Original), WDBC (Diagnostic), and Mammographic Mass datasets differentiate between benign and malignant, whereas the Coimbra dataset determines healthy controls and patients. Table 1 displays the information of the datasets.
The information of the datasets
The information of the datasets
The efficiency of the proposed method was tested by applying the 10-fold cross-validation technique, and the number of bootstrapped training data was set as 100. Listwise deletion was used to handle all the missing data. For the definition of all datasets’ features, three equally distributed triangular fuzzy sets were considered for fuzzification because the three fuzzy sets were most commonly used in previous research on FUZZYDBD and showed the most accurate estimation number of fuzzy sets for many breast cancer datasets [41, 43]. The proposed method’s ability with regard to classification was acknowledged through the implementation of the confusion matrix. Recall, F1-measure, accuracy and precision were calculated based on the confusion matrix. After ten runs, the average results were determined, and the macro-average method was applied. The results of the experiments, including precision, recall, F1-measure and accuracy standard deviation of BFID3, were recorded in Table 2.
Experimental results of BFID3 with the datasets
The analyses between BFID3 and other methods were carried out to find out the proposed method’s capability. Tables 3–6 showed the accuracy between the proposed method, BFID3 and existing methods for each dataset. The proposed method showed better classification results than other existing methods when implemented with the collected breast cancer datasets.
Accuracy results of WBCD (Original) dataset
Accuracy results of WDBC (Diagnostic) dataset
*(-): The method could not handle the classification.
Accuracy results of Coimbra dataset
*(–): The method could not handle the classification.
Accuracy results of MM dataset
The overall classification performance was reviewed and compared between the existing algorithms and BFID3 by constructing the radar chart. The Coimbra and WDBC dataset classification cannot be done using the ID3 algorithm as it cannot handle continuous values. Therefore, the two methods’ performance results could only be compared using the WBCD dataset, which consisted of integer data ranging from 1–10 and the Mammographic Mass dataset, which had one discrete in the form of integer feature. The classification results of the BFID3 and ID3 with the WBCD dataset are shown in Fig. 3. Then, the classification results for the Mammographic Mass dataset are shown in Fig. 4. BFID3 was also compared with the FID3 algorithm implemented by [70] that did not apply the bagging method in both radar charts. BFID3 displayed better performance than the FID3 algorithm and ID3 algorithm for both datasets in F1-measure, precision, accuracy and recall. The improvement in terms of generalization ability and reduction of overfitting can be seen with the application of the bagging method that applies bootstrapping and majority voting compared to [70]. In bagging, all the base classifiers would undergo a learning process with the bootstrapped training data, and by averaging the samples, the model would have a smaller variance than one sampling from the same distribution. By reducing the variance, there will be a reduction of overfitting in the decision trees and simultaneously increase the generalization ability [71].

Results of ID3, FID3 and BFID3 with the WBCD dataset.

Results of ID3, FID3 and BFID3 with the Mammographic Mass dataset.
To discover if the classification accuracy between the two methods of ID3 and BFID3 is statistically different, the t-test, a type of statistical test, was utilized. The study considered ten runs of accuracy results per sample in order to identify the p-value and t-value. The two-tailed test was applied, whereby a significance level (α) of 0.05 was considered for the t-test. The null hypothesis (H0) would be accepted if the p-value was larger than α, whereby H0 claimed that the difference between BFID3 and the ID3 algorithm was not significant. On the other hand, an alternative hypothesis (H1) would be accepted if the p-value was smaller than α, whereby H1 claimed that the two algorithms were significantly different. The p-value was < 0.00001, and the t-value was 18.35769 in the t-test of the WBCD dataset classification. Since the p-value was < 0.05, the classification results difference was considered to be significant. The p-value was < 0.00001, and the t-value was 24.53365 in the t-test of the Mammographic Mass dataset classification. Since the p-value was < 0.05, the Mammographic Mass dataset classification results difference were also significant. The significance level was higher than all p-values in these studies. Therefore, H1 was accepted while H0 was rejected, as all the p-value results were < 0.05, which represented a significant difference between the two algorithms.
The error rate graphs had been plotted to acknowledge the efficiency of BFID3 in improving the overfitting issue that existed in ID3. In order to find out the reduction of overfitting in the model, the variance would be analyzed, where the error rate difference between training error and test error would be obtained in this study. The collected breast cancer data samples would be reduced from 100%, 80%, 60%, 40% and 20%, and each sample would undergo k-fold cross-validation and classification. The error rate calculation uses the formula of Error rate = 100% -training/test accuracy. The error rate difference uses the formula: Error rate difference = test error-training error. Fig. 5 displays the error rate graph of ID3, while Fig. 6 displays the error rate graph of BFID3. Both graphs are results for the WBCD(Original) dataset classification, and the bolded values in the graphs represent error rate differences. The dotted lines represent the optimum point, while the black arrow represents 100% of the data used.
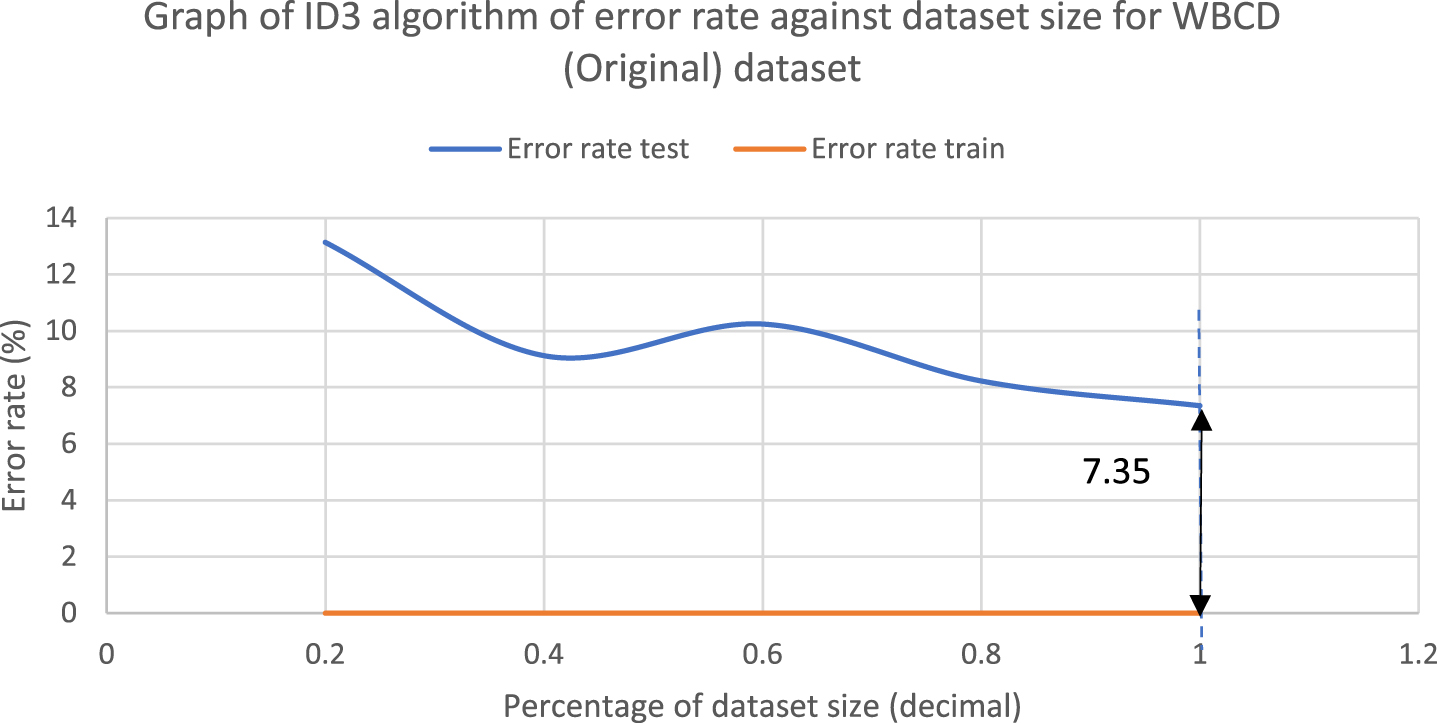
Error rate difference graph of ID3 with WBCD (Original) dataset.
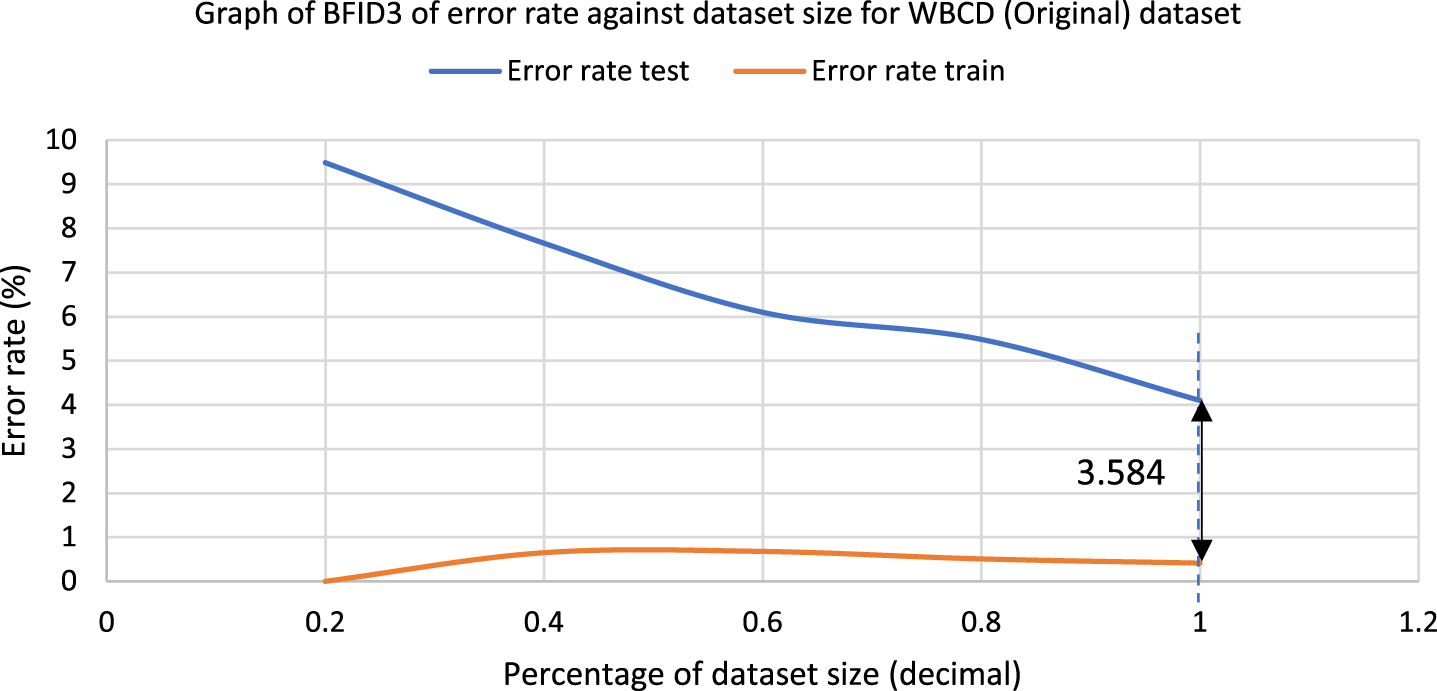
Error rate difference graph of BFID3 with WBCD (Original) dataset.
The error rate difference graphs in Fig. 5 and Fig. 6 show that BFID3 has a lower variance than ID3 as it obtained a much lower error rate difference. Lower variance in the model leads to reduction of overfitting issue. The performance of the BFID3 model consistently outperformed ID3 in all percentage of dataset size as BFID3 obtained a much lower test error rate with WBCD(Original) dataset. The study also performed the following experiment with the Mammographic Mass dataset that was able to undergo classification with ID3. Fig. 7 displays the error rate graph of ID3 while Fig. 8 displays the error rate graph of BFID3. Both graphs of Fig. 7 and 8 are for the classification of the Mammographic Mass dataset, and the bolded values in the graphs represent error rate difference. The error rate difference graphs in Fig. 7 and Fig. 8 also shows that BFID3 acquired a much lower error rate difference than ID3. The analysis shows that BFID3 is managed to reduce overfitting and high variance in ID3. BFID3 is practically more stable and robust than ID3 as it consistently obtained better results in the various percentages of dataset size.
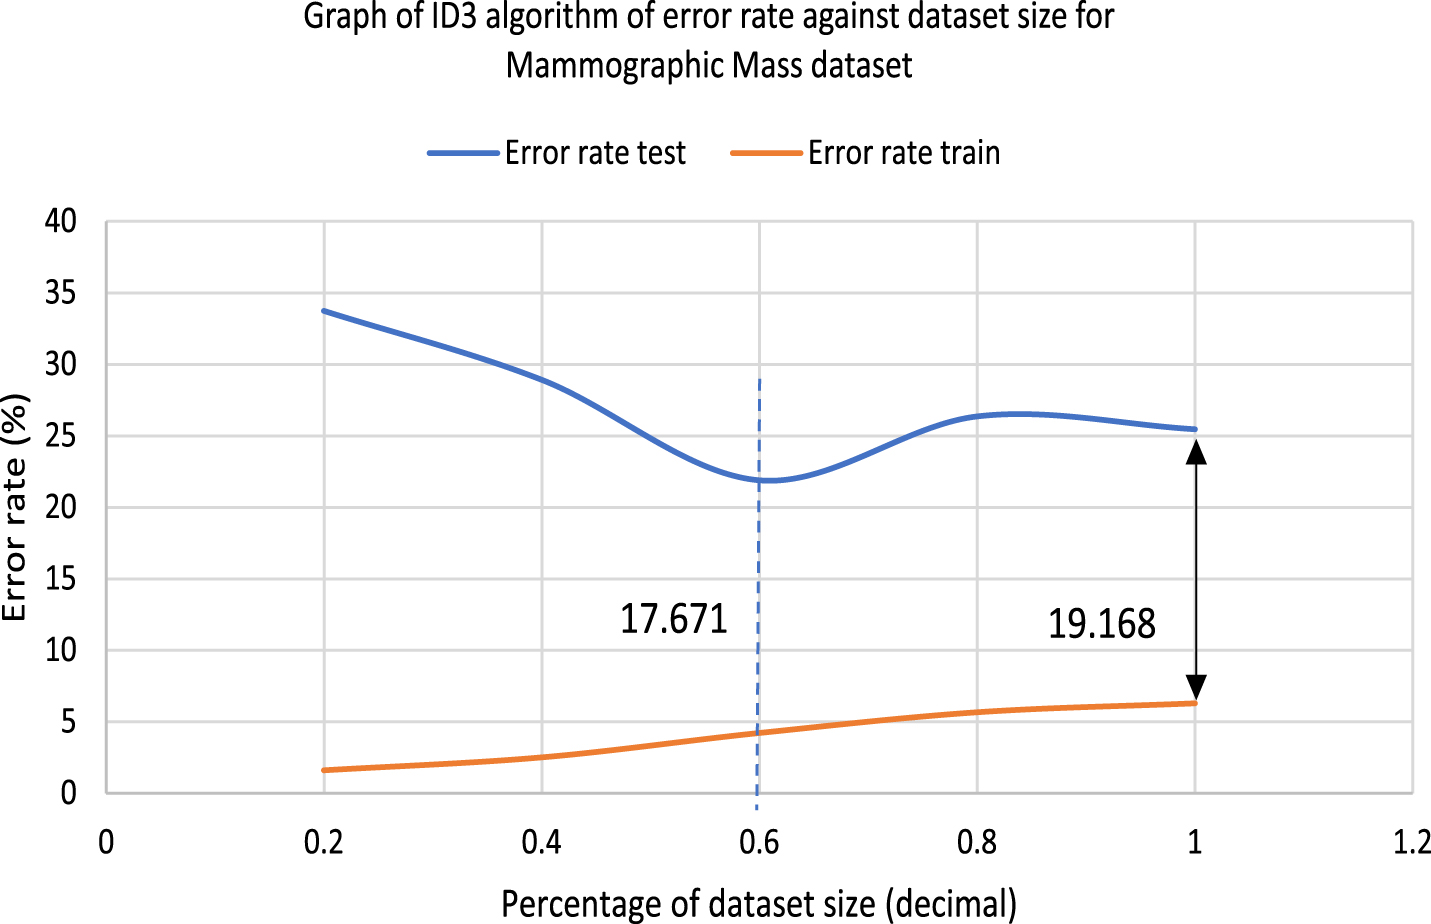
Error rate difference graph of ID3 with Mammographic Mass dataset.
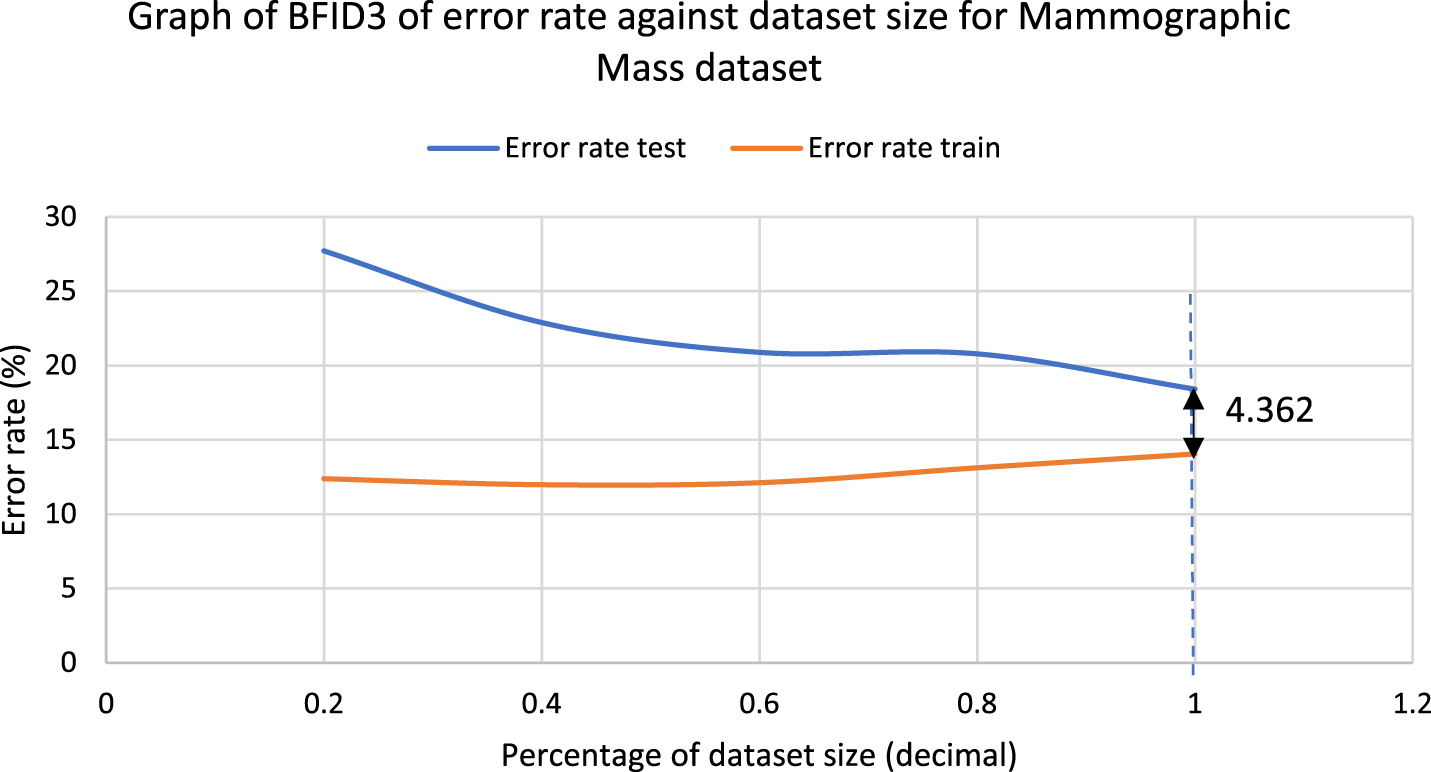
Error rate difference graph of BFID3 with Mammographic Mass dataset.
The BFID3 obtained an accuracy of 96.003% when tested with the WBCD (Original) dataset, 95.273% with the WDBC (Diagnostic) dataset, 68.966% with the Coimbra dataset and 81.59% with the Mammographic Mass dataset. The BFID3 algorithm performed better compared to various existing methods. The traditional ID3 algorithm could not conduct classification with datasets that contained continuous data, such as the WDBC and Coimbra datasets. Compared to the traditional ID3 algorithm, BFID3 was a more practical solution to solve classification problems for breast cancer, as it had shown better classification results and was capable of handling continuous data. The widely used FUZZYDBD method implemented for the data fuzzification process produced impressive performance upon testing with the datasets for breast cancer. The fuzzy set parameters were set up using the FUZZYDBD method in BFID3 to elevate the effectiveness and suitability of data fuzzification. A replacement process with the fuzzy sets’ linguistic values, which had the best compatibility degree, was conducted via the BFID3, in which the dataset’s continuous and integer features would be modified to be in linguistic forms. Thus, the ID3 algorithm could classify all the collected datasets as the base learners, even though the datasets originally contained continuous data. The application of data fuzzification and replacement of the linguistic variable process in BFID3 allowed the decision trees to use logical reasoning for the new instances class predictions. Moreover, majority voting was used to decide the final predicted classes for the test data. The implementation of the bagging ensemble solved the conventional ID3 algorithm’s weaknesses, which had high variance, improved generalization and overcame overfitting. In comparison with the ID3 algorithm, BFID3 that conducted data fuzzification, was also more robust. A difference of 0.01 in the data’s continuous values could lead to different classes and pathways in the tree for the ID3 algorithm and other decision tree learning. On the other hand, a particular input’s membership degree was considered in the BFID3, whereby data uncertainty could be tolerated. It is suggested that the feature selection technique be carried out for future studies to improve the classification performance.
Conclusion
The BFID3 was capable of producing good classification results. A fast fuzzification process occurred when the FUZZYDBD method was implemented in the fuzzy decision tree’s fuzzification process. The proposed method showed good classification performance, overcame overfitting and improved generalization in the standard ID3 algorithm. Furthermore, BFID3 also resolved the problem of the ID3 algorithm that could not handle the continuous-valued data. Overall, the use of BFID3 for breast cancer data classification was beneficial and efficient.
Footnotes
Acknowledgments
This work was supported by the Postgraduate Research Grants Scheme (PGRS) with grant No. PGRS200397 from the Universiti Malaysia Pahang.