
Abstract
The Advanced Persistent Threat (APT) attack is a form of dangerous, intentionally and clearly targeted attack. Currently, the APT attack trend is through the end-users and then escalating privileges in the system by spreading malware which is widely used by attackers. Therefore, the problem of early detection and warning of the APT attack malware on workstations is urgent. In this paper, we propose a new approach to APT malware detection on workstations based on the technique of analyzing and evaluating process profiles. The characteristics and principles of our proposed method are as follows: Firstly, processes are collected and aggregated into process profiles of APT malware; Secondly, these process profiles are used by Graph2Vec graph analysis algorithm to extract the characteristics of the process profile. Finally, in order to conclude about the sign of malicious APT, this paper proposes to use Long short-term memory (LSTM) and bidirectional LSTM (BiLSTM) algorithm. With the proposed approach in the paper, we have not only succeeded in building and synthesizing APT malware behavior on Workstations as a basis to improve the efficiency of predicting APT malware, but also have opened up a new approach to the task of synthesizing and analyzing anomalous behavior of malware.
Introduction
Problem
APT is currently the most dangerous cyber-attack technique in terms of the attack scale and extent of the damage inflicted on organizations. The dangers of this attack technique are shown in three main aspects including [1, 2] Advanced; Persistent; Threat. In addition, the study [3] presented the concept and definition of the APT attack characteristics, process and life cycle. In the study [3], the authors pointed out the dangers of APT attacks that are reflected through two main factors including attack assist technology and attack launching method. In particular, the attack assist technology used in the attack campaigns is mainly developed by the attacking team, including malware, the search engine for Zero-Day vulnerability, etc. As regards the method of launching the attack, recognized APT attack campaigns often use phishing and spear-phishing techniques aimed at the end-user. Thus, we can see that a characteristic of the attack method of the APT attacker is to try to spread malware to the end-user and then escalate and take control over systems that store sensitive data. The studies [1–3] indicated that in order to prevent and detect APT attacks, it is only necessary to focus on one life cycle or process of attack campaign because if a process or a life cycle is detected, the whole APT attack campaign will collapse. Besides, according to the statistics [4, 5], most of the recorded APT attack campaigns are through the form of spreading malware on workstations. For the above reasons, the problem of early detection and warning of the APT malware on the workstations is very necessary today in the context of recorded campaigns of this attack type growing in both quantity and degree of damage [6].
Evaluating some approaches for detecting APT malware on Workstations
The two main methods to detect APT malware that are commonly studied and applied are the signature-based method through the rule set and anomaly-based method based on behavior analysis to find anomalies [4]. Malware detection approaches combining anomaly-based with machine learning or deep learning techniques have been highly effective in identifying new APT malware samples. The studies [2, 8] listed two main methods to extract features and behaviors of malware including the static analysis method and the dynamic analysis method. The current trend of detecting cyber-attacks using machine learning or deep learning often applies dynamic analysis methods with the support of Sandbox tools to analyze and extract the features and behaviors of APT malware. However, we found that these approaches have some problems [9–15]: The features and behaviors of malware: Virtualization tools such as Sandbox [1] assist in collecting and extracting the features of malware. They usually work well with simple samples but not very effective for APT malware types because this malware often has Identifying Functions and anti-Sandbox, hibernating, etc. Therefore, the APT malware features that are collected and extracted from the sandbox log usually do not make much sense [16]. The malware detection time: We noticed that applying machine learning or deep learning methods based on features and abnormal behaviors would only detect malware at later stages of the attack campaign. That is when the attackers are able to steal information from the victim. Lack of correlation between events [10, 17]: As regards conducting malware signature and behavior based on virtualization tools, it is not only difficult to fully collect features and behaviors of malware but also lead to the situation in which the system can not seek and synthesize the correlation among single events of malware. This is due to the fact that the APT malware often uses a variety of exploit and propagation techniques at different timelines when the collected signs and behaviors are completely benign. However, if we concatenate the events, we will see that this is the hiding and concealing behavior of malware.
The studies [1, 19] also showed that one of the problems that made detecting APT attacks much more difficult than other attack techniques was the lack of correlation in the events of the attack.
The proposed method of this paper
From the above analysis and evaluation, in this paper, we propose the method of detecting APT malware on workstations based on the process profile analysis technique using deep learning method. Our proposal has the following steps:
Step 1: Build the process profile in graph form: This process will include 2 phases: Phase 1: Data standardization. First of all, the processes generated from the operating system kernel of the workstations will be collected and standardized into a process profile in graph form. To achieve this goal, we propose to use the Sysmon tool [20] on the workstations to gather information about the processes generated by workstations. Then, based on the information about the processes that Sysmon provides, we standardize them into features of each process. Details of the process of collecting and standardizing information about the processes are described in Table 1 in Section 3.2.1. Phase 2: Building process profiles. Finally, based on the features of each process extracted in stage 1, we proceed to build process profiles. Characteristics of our method of building process profiles in graph form are: each process is a node of the graph, and the edge of the graph is that the parent process calls the child process. Details of the process of building processes profiles in graph form are described in section 3.2.2.
List of features in a process
List of features in a process
Step 2: Analyzing process profiles: At this step, we will find a way to analyze the process profile built in phase 2 to seek signs of abnormal behavior of APT malware. To perform this task, we propose to use the Graph2Vec algorithm [21] to convert the process profile from the graph form into a vector representing that graph. The method of analyzing the process profile based on the Graph2Vec algorithm is the procedure of extracting the attribute of the process profile.
Step 3: Classifying process profiles: Finally, in order to conclude about signs of the APT malware in the process, we use some advanced deep learning algorithms such as LSTM and BiLSTM. With this approach, our proposal will solve the problems that we think need to be optimized as follows: Regarding the problem “features and behaviors of malware": In this paper, instead of using Sandbox tools to collect malware behavior, we recommend collecting and extracting malware behavior based on processes that were recognized on the operating system kernel. Thus, The approach of this research is finding a way to collect and analyzing the processes that malware generated instead of defining the behavior of the malware [1, 19]. With this approach, we realized that regardless of whether malware is transformed or hidden, the processes that they generated will be fully recognized based on the process of extracting information from the operating system kernel on the workstation [17]. Regarding the problem “When the malware was discovered": In order to conclude the signs of APT attack malware in the system, we find a way to collect and extract the processes and then build into a process profile of each object. Therefore, as long as the malware adds a new process, that process is immediately recognized and added to its process profile. That process profile is then analyzed and evaluated to conclude about the APT malware. Based on this approach, we ensure fast and accurate detection of APT malware [12, 22]. Regarding the problem “Lack of correlation among events": With the construction of process profiles based on discrete processes that are collected and extracted on the workstations as the basis for APT malware detection, we have shown the correlation among the events that the malware generated. These events and processes may be judged to be normal by monitoring systems, but when combined, they form process profiles that represent the behavior sequence of the malware. With this approach, our method is able to record and represent a sequence of events and processes at different times of malware.
Proposing a new approach for selecting and extracting features and abnormal behaviors of APT attack malware based on process profile analysis using the Graph2Vec model. This is a new proposal for the task of detecting APT malware on workstations. With this approach, we have found and synthesized APT malware’s behavior on the processes that the system generates as evidence to conclude about the process profile. Our proposal not only partially solves the problem of lack of behaviors from APT attack malware but also calculates the impact and correlation among processes, thereby improving the ability to accurately conclude about the APT malware on the workstations. Proposing a new approach for detecting APT malware on workstations based on process profiling analysis techniques using some advanced deep learning networks such as LSTM, BiLSTM. Accordingly, in this proposal, in addition to using the Graph2Vec deep learning model to extract the features based on behavior of malware from the process tree, we have also proposed to use two different deep learning algorithms to classify process profiles to improve the efficiency of the APT malware classification. The experimental results have proven the effectiveness of LSTM and BiLSTM models compared to other deep learning models.
The rest of the paper is organized as follows: in part 2, we study and examine some previous studies for the task of detecting APT malware. The contents related to the proposed method are analyzed and presented in Section 3. The experimental results and evaluations of the effectiveness of the proposed method are presented in Section 4. Finally, conclusions and future development directions are presented in Section 5 of the paper.
Related work
Detecting APT attacks using graph
In the study [23], Cho et al proposed a method of detecting APT malware on Workstations using Graph Isomorphism Network (GIN). In their research, the authors proved that the proposed method is more efficient than some other deep learning graph networks including Graph Convolutional Networks (GCN) and Dynamic Graph Convolutional Neural Network (DGCNN). However, we noticed that this model is relatively cumbersome and complex. Shifu Hou [24] proposed the Deep4MalDroid model for malware detection on Android operating systems based on Kernel System Call Graphs. In the experimental section, the authors used some basic machine learning algorithms to classify malware.
In addition, Zhen Ma [25] also proposed for the first time a method of detecting APT malware connected to the control server via graph-based domain analysis. Specifically, the authors used 257,535,071 DNS requests and 73,136 domain names to evaluate the proposed model. In the study [26], Pektaş et al presented an Android malware detection method using API call graph embeddings. In their research, the authors listed some classical graph embedding models such as DeepWalk, Node2vec, Structural deep network embedding, Higher-order proximity preserved embedding.
The study [27] presented ATLAS which is a framework that constructs an end-to-end attack story from off-the-shelf audit logs for detecting signs of APT attacks. Specifically, in their research, the authors proposed the ATLAS model including causality analysis, natural language processing, and machine learning techniques. The characteristics of the ATLAS model are that ATLAS constructs a set of candidate sequences associated with the symptom node, uses the sequence-based model to identify nodes in a sequence that contribute to the attack, and unifies the identified attack nodes to construct an attack story. Research [18] proposed an APT IP detection method based on the GCN network and the BiLSTM deep learning algorithm.
Some other methods
In the research [28], the authors proposed a combined deep learning model for APT attack detection based on network traffic. Specifically, the authors combined single deep learning networks, namely Convolutional Neural Network (CNN) and LSTM, into a CNN-LSTM model. Experiments show that this model detects APT attack IPs more accurately than other individual deep learning models. This result has opened up a research direction on information representation of IPs based on network traffic. The study [29] proposed several ATTENTION models to optimize the CNN-LSTM combined deep learning models [28]. Specifically, the authors used the CNN-LSTM network as the base network, and the outputs of this network were further analyzed by the ATTENTION network to highlight important information of IPs, instead of being used directly for the classification process. Experimental results showed that the proposed method has better performance than the combined deep learning models.
The study [30] developed a method to detect traces of APT attacks based on Provenance Graph and Metric Learning. In the experimental section, the authors compared their research with some other approaches and found that the average accuracy increased by 11.3% and the True positive rate increased by 18.3%.
The research [31] listed, compared, and evaluated some tools and solutions for detecting APT malware on Endpoint systems. In that study, some Endpoint Detection and Response (EDR) tools and solutions were proposed such as Carbon Black; Kaspersky Endpoint Detection and Response-KEDR; McAfee Endpoint Protection.
R. Coulter [32] proposed a method of detecting APT malware on Windows machines based on 15,259 APT indicators of compromise (IoC) and basic machine learning algorithms such as Random Forest (RF), Support Vector Machine (SVM), K-Nearest Neighbors (KNN), Naive Bayes (NB). Similarly, research [33] proposed an integrated EDR model for APT malware detection based on the strategies of Miter attack. However, we noticed that the studies [32, 33] face a problem that the rule sets built on Miter attack and IoC are very limited, so it cannot cover APT malware’s behaviors. The study [34] proposed an APT attack detection model based on the belief rule base and IP Packets.
The proposed method
The model architecture
Figure 1 shows our proposed model for detecting APT malware on the workstations. The main components in this model include:
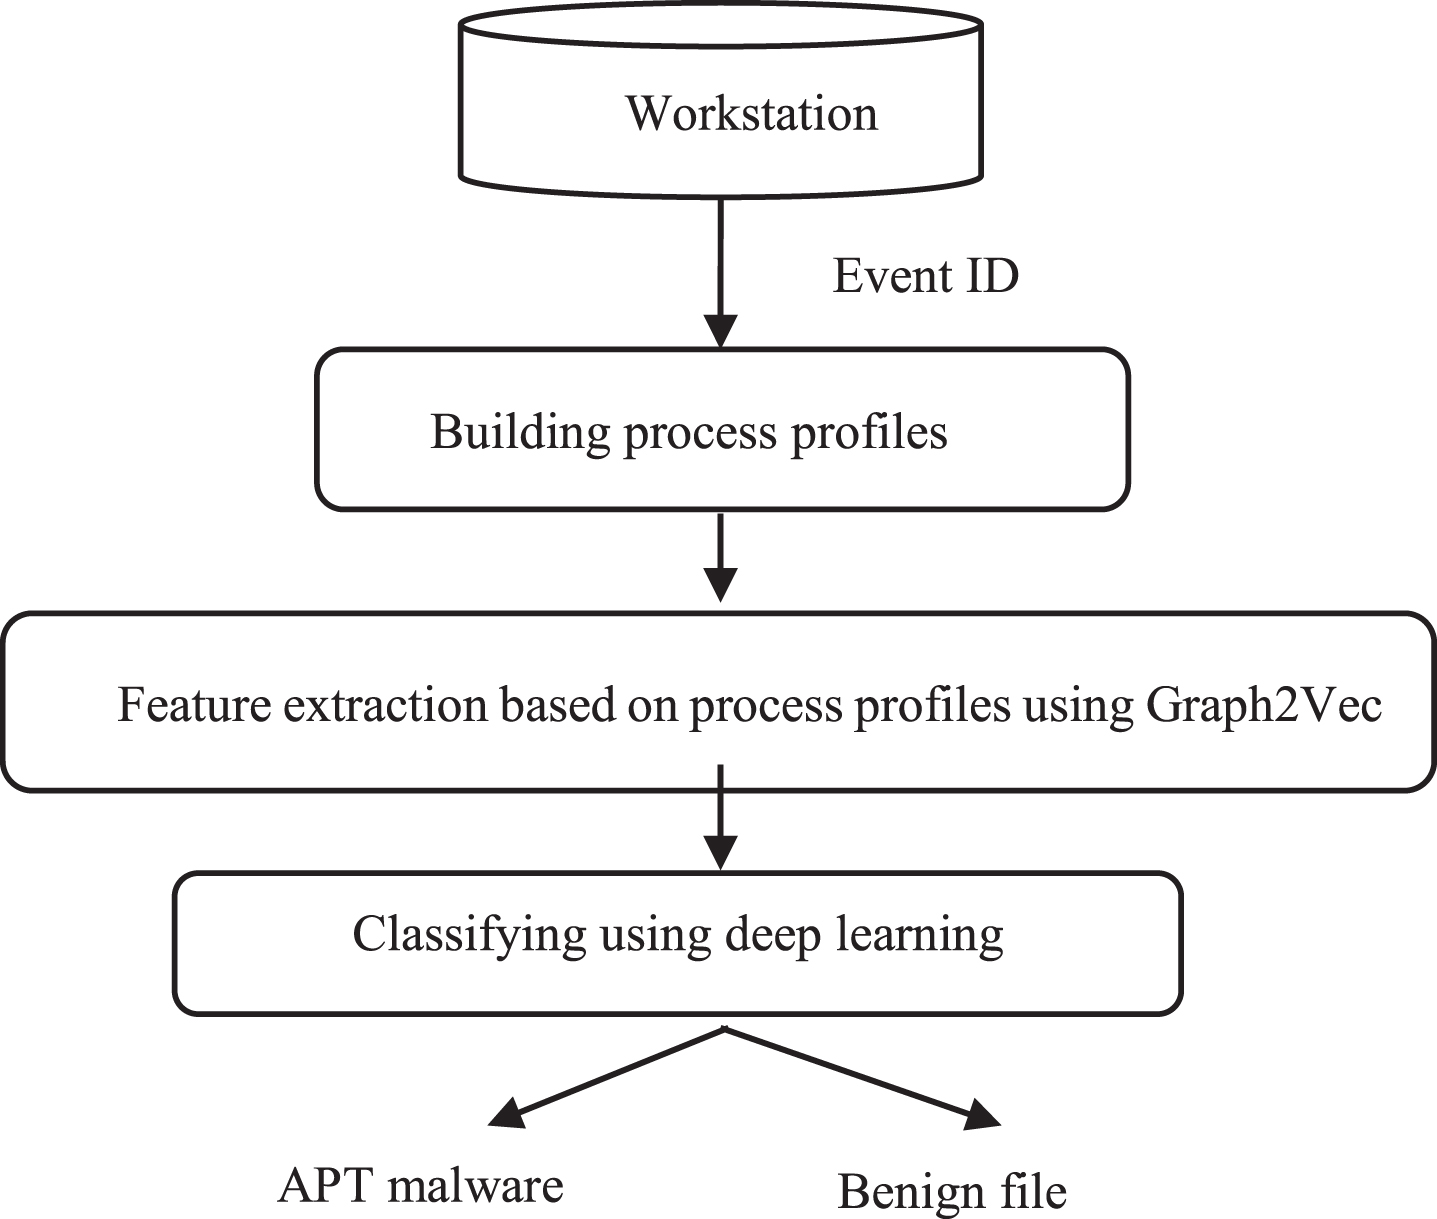
The model of detecting APT malware based on workstations and analyzing the process profile using deep learning.
Data standardization
As mentioned above, the Sysmon tool will collect 23 different Event IDs on the Windows kernel [35]. In this paper, based on the collected Event IDs, we analyze and evaluate them to build a process profile of the malware. Research [36] pointed out a number of important behaviors that are often used by malware to exploit and attack systems. Therefore, in this paper we choose to use the following 3 main components to analyze and build the process profile of malware: Process Create: The process creation event provides extended information about a newly created process. In this study, we find a way to analyze this process because of the fact that this process contains a lot of important information that identifies the process. That information will be used to analyze and track subsequent behaviors (Event IDs). Some key components in Process Create are ProcessID, ProcessGuid, parent process code, absolute path of executable file, hash code, etc. In particular, ProcessID is re-granted by the operating system for the purpose of managing and monitoring subsequent behavior. ProcessGuid is a unique value identified for each process. The parent process code is used to define relationships among processes generated from an object. Process Terminated: The process terminate event reports when a process terminates. After receiving this event, we will update to complete information of the remaining 21 events for the process. Mitre ATT&CK: MITRE ATT&CK is a globally-accessible knowledge base of adversary tactics and techniques based on real-world observations [35]. The framework focuses on adversary tactics, techniques and procedures instead of typical indicators such as file hashes, IP addresses, domains, etc. Thus, MITRE ATT&CK identifies behaviors in a life cycle, the relationship between one action and another, and their sequence for targets of malware. In addition, MITRE ATT&CK also provides a topology with threat data which gives context for how malware is used [35]. The MITRE ATT&CK matrix describes an overview of the relationship between tactics, techniques, and sub-techniques. Each tactic can be performed by individual techniques. Some techniques may be available in different tactics for different purposes. A technique can be broken down into more specific sub-techniques to achieve the attack purpose. Based on the description of the characteristics and action mechanism of each technique supported by MITRE ATT&CK, we define the set of conditions corresponding to each attack technique. In this study, we use MITRE ATT&CK to evaluate all information of processes, thereby identifying and measuring the correlation between the collected Event IDs and the techniques defined by the MITRE ATT&CK. Each discovered technique will represent an abnormal behavior of malware with File, Network, RemoteThread, Registry, etc. Thus, with this approach, we quickly summarize and generalize malware behavior in each process. Table 1 below lists features of the process used to build a process profile of each object in detail.
Table 1 shows the main components of each Event ID group that we use. Of which, features in group 1 are collected from Event ID 1: Process creation, the TerminationTimestamp feature is updated when we receive Event ID 5: Process terminated. During this process, the remaining 21 Event IDs are respectively updated and lab eled through the MitreAttacks framework. The result is a set of labels corresponding to each respective technique used in the process defined by MitreAttacks.
Building the process profile
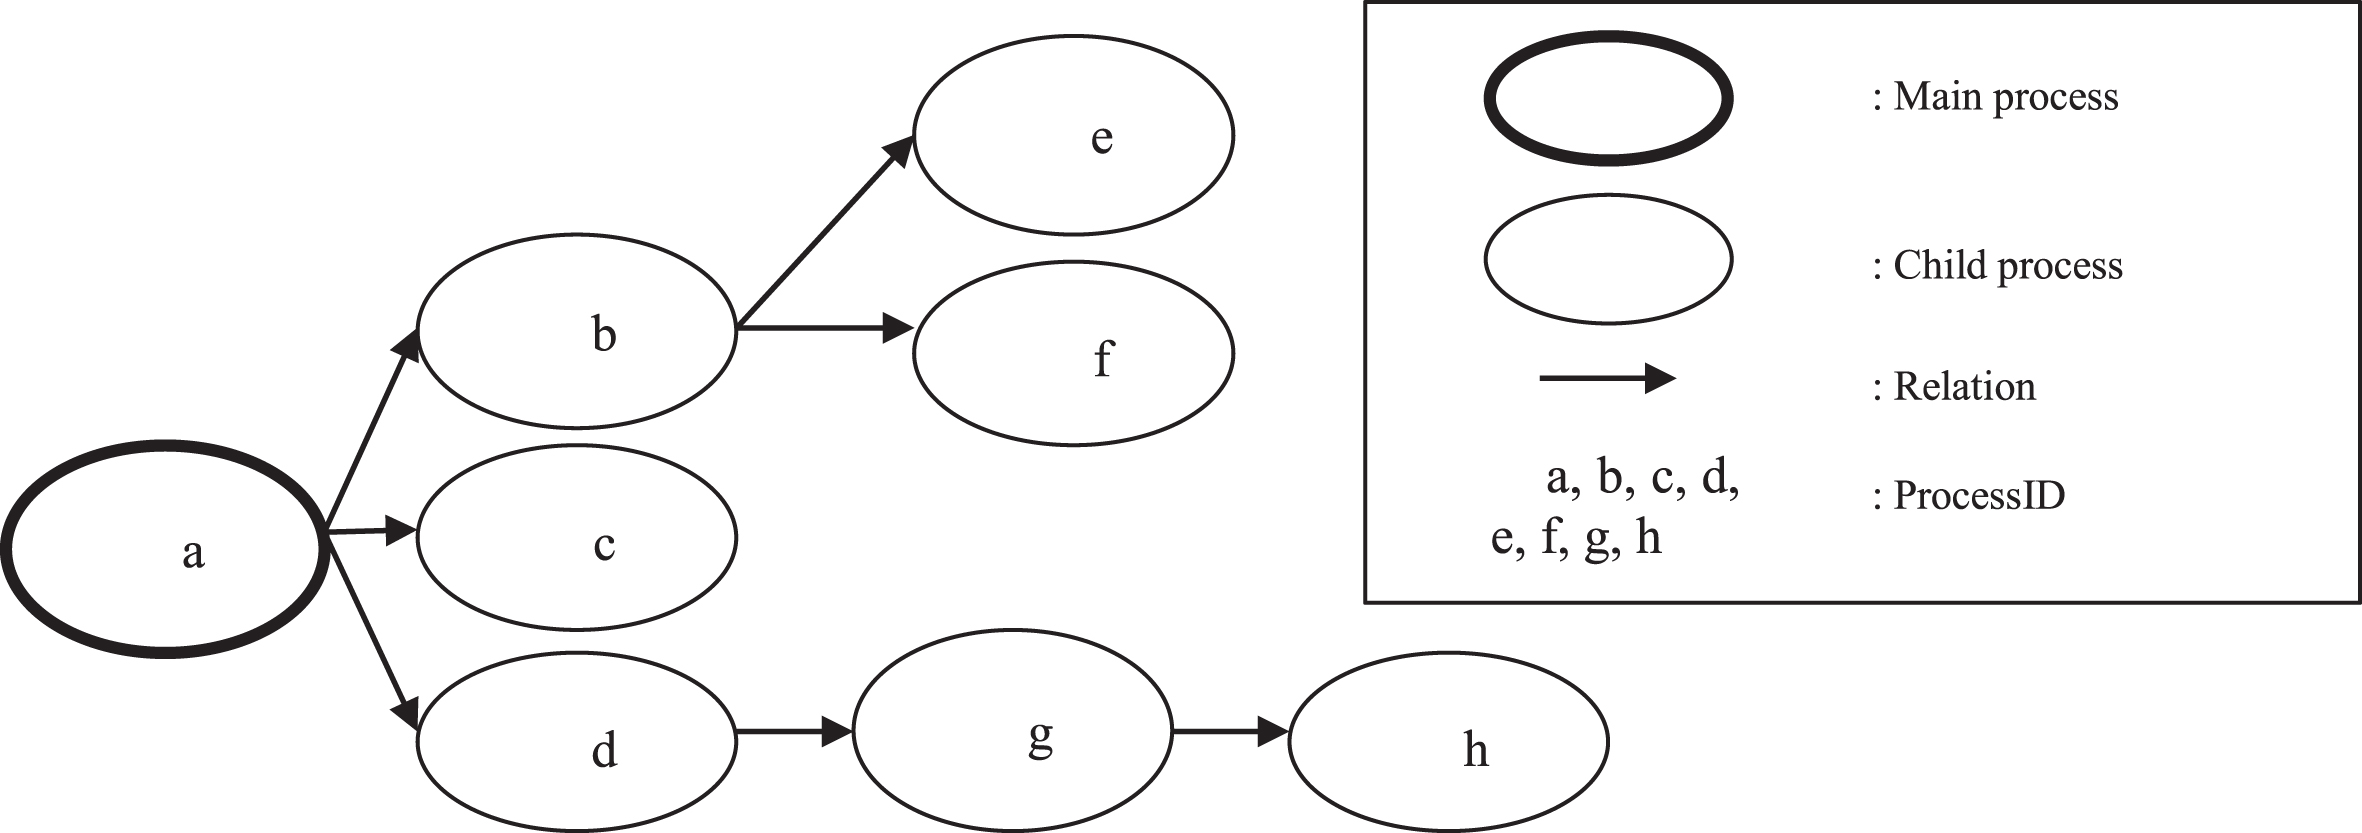
A process profile includes a list of processes. Information of each process is standardized by us according to the principles outlined in section 3.3.1. Characteristics of processes are: these processes are collected in chronological order and related to other processes; a process can have one or more child processes. In this paper, to build process profiles representing relationships among processes, we propose to construct an oriented graph architecture. Accordingly, our proposed graph architecture has the following characteristics: each child process is a node; an edge represented via a parent process calling a child process. Thus, through this oriented graph architecture, describing malware behavior not only looks at each process individually but also is able to observe the correlation between processes from which hidden behaviors of malware can be clearly shown. Figure 2 below shows an example of a process profile architecture in tree form.
An example of a process profile architecture in tree form.
As illustrated in Fig. 2, each process is assigned an identification number code (ProcessID). We rely on it to determine the relationship between parent processes and newly created processes. Therefore, successfully connecting behaviors of each process give suspicious signs about the action of that malware.
Figure 3 below shows the architecture of the malware detection model based on the process profile analysis technique.
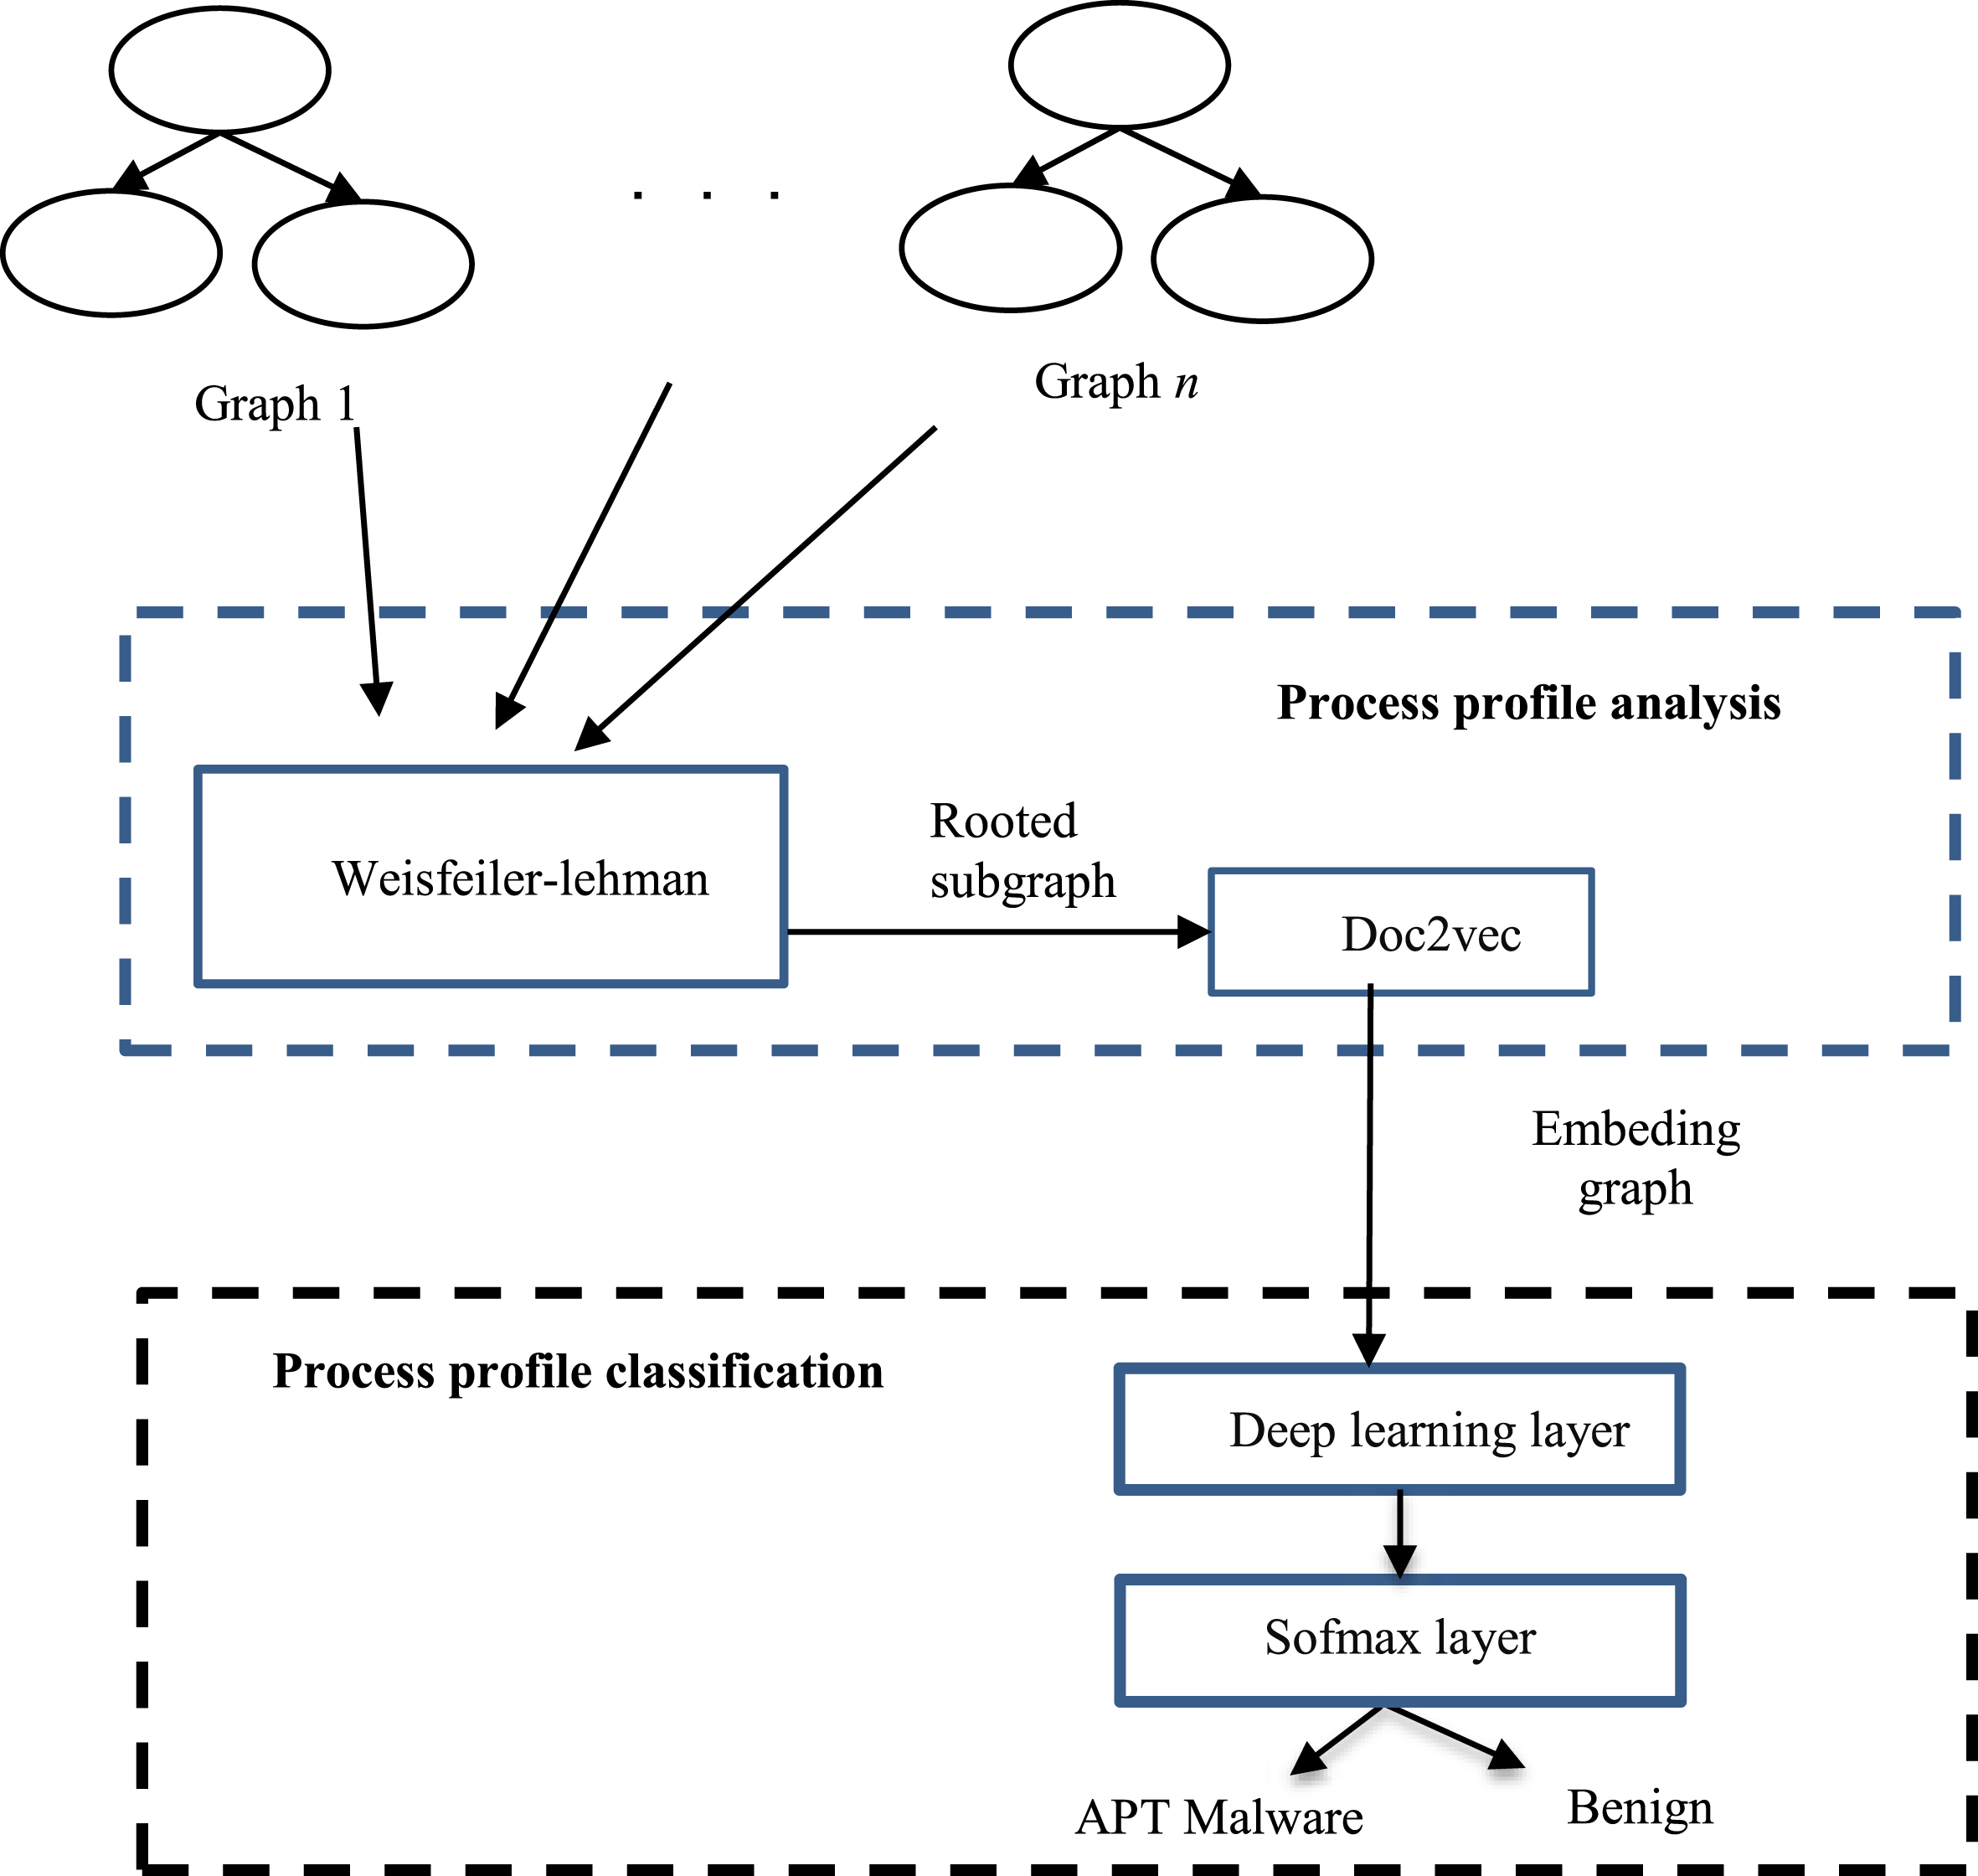
Model of analyzing and classifying the process profiles.
Figure 3 shows that the model of detecting the APT malware on the workstations based on the process profile analysis technique consists of 2 main components:
We noticed that the traditional approaches for representing data in graph form are not suitable for classification task [34]. Specifically, this method usually has two following problems: The dimension of the adjacent matrix depends on the number of nodes in the graph. Specifically, in real-time processing problems, the number of nodes can increase rapidly and very large. So it will consume memory and affect processing performance. The representation method using adjacent matrix and similar methods only describe the graph architecture, so it is difficult to describe the features of each node and the characteristics of each branch. This can lead to the loss of important information and significance of the graph.
To fix the above problems, in this paper we propose to use the Graph2Vec model to extract features of the process profile. Graph2Vec is the first neural embedding approach that learns representations of whole graphs and an unsupervised learning technique used to embed graph in vector form extended from doc2vec [21, 37]. Based on the idea of doc2vec, Graph2Vec will learn to represent the features of the graph by treating an entire graph as a text and rooted subgraphs as words that form the document. As with data in text form, words near each other will form a sentence containing context, rooted subgraphs represent graph branches representing the association between features at nodes. Figure 3 shows the process of applying the Graph2Vec model for analyzing process profile in our proposal as follows:
Where: i > 0 v is the node being considered li(v) is the subgraph label updated at loop i at node v li-1 (v) is the subgraph label updated at loop i-1 at node v N(v) is the set of nodes around node v relabel is the function that computes a new label for the subgraph In this paper, the relabel function uses the MD5 [31] algorithm in order to ensure subgraphs that have different architecture and contain different nodes will be labeled differently. Thus, at the last loop, each subgraph is represented by only a unique hash string. From a graph consisting of many subgraphs, we have processed it into a set of hash strings similar to a word.
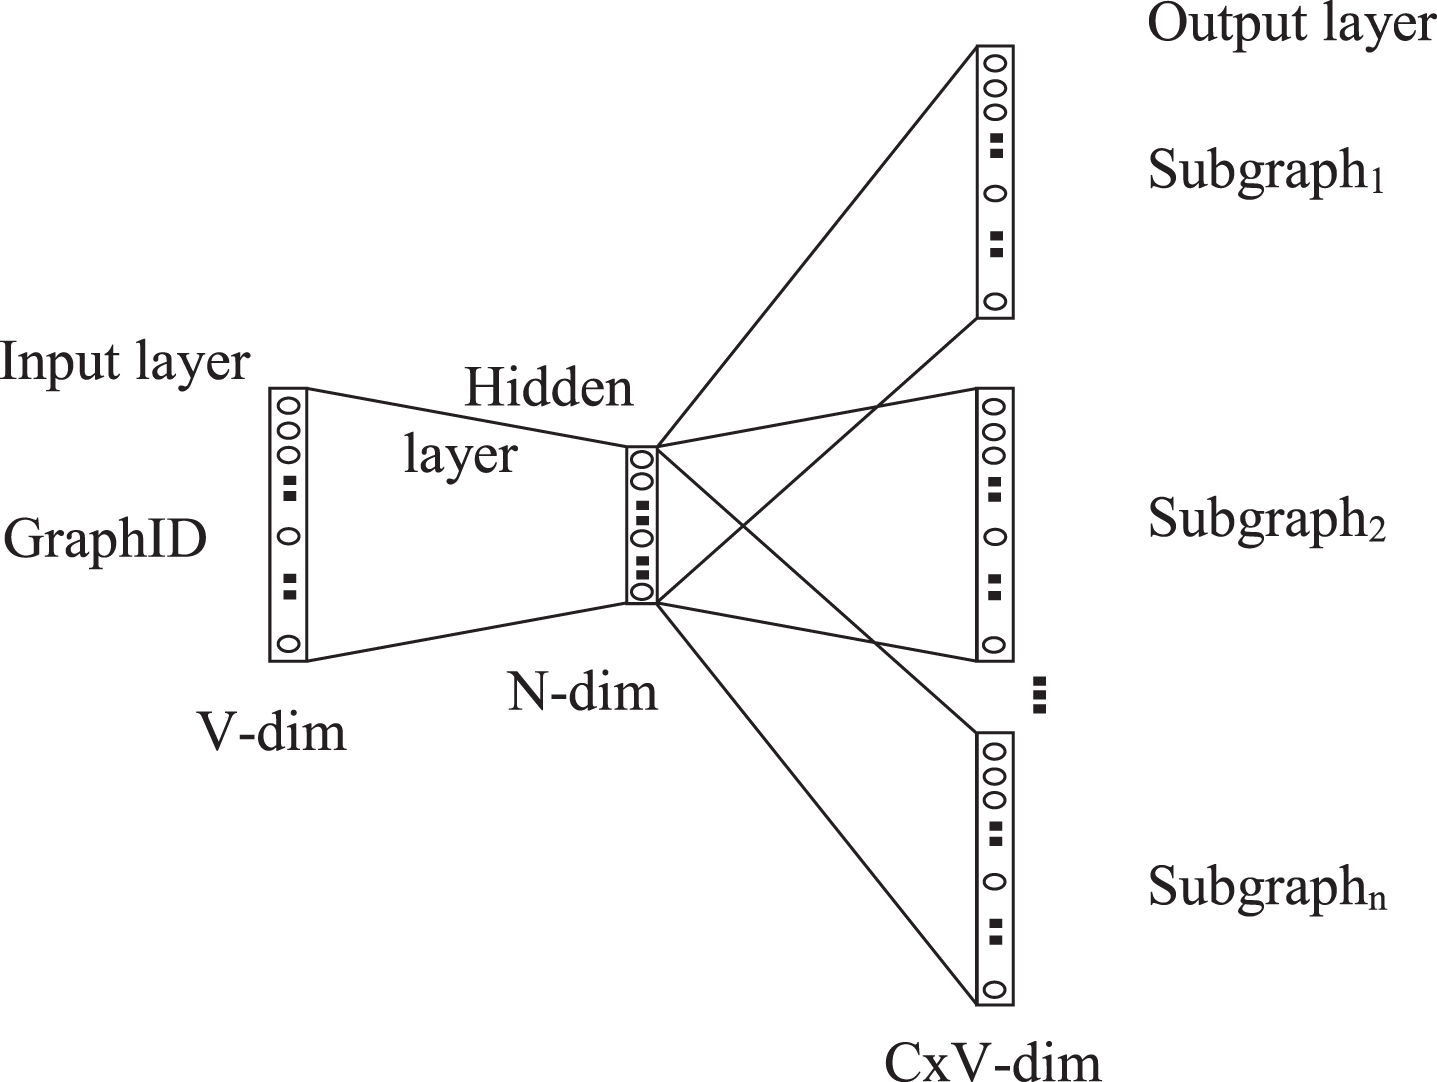
The skip-gram training model.
From Fig. 4, it can be seen that the skip-gram model consists of three main components: input layer, hidden layer, output layer. The input layer is a one-hot vector GraphID. The dimensions of the hidden layer are the dimensions of the embedding vector space. The output layer consists of a set of one-hot vectors of rooted subgraphs. The model will learn how to predict rooted subgraphs in vocab from GraphID. During the training process, instead of getting output with the size as vocabulary, the list of rooted subgraphs was sampled by using the Negative Sampling technique to reduce computational complexity at the output layer. Thus, it can be seen that output of Graph2Vec is an N-dimensional embedding vector space in which each graph is represented by a vector in space. Graphs with the same architecture and the same rooted subgraphs are closer together, meaning that the cosine similarity between them is closer to 1 [40]. Cosine similarity is defined by formula (2):
Where: A = (A1, A2, ... .A
n
) and B = (B1, B2, ... B
n
) are two vectors in embedding space. n is the dimension of space. In this paper, we conduct experiments on 3 graph embedding spaces with dimensions of 64, 128, and 256 respectively.
To classify the vectors representing the features of the graphs extracted in section 3.3.1, we propose to use two deep learning algorithms: LSTM and BiLSTM.
The research [41] introduced LSTM with its ability to self-memorize information for long periods of time. This is shown in the structure of the gates in each memory cell. A memory cell consists of 3 main components: input gate, forget gate, output gate. The first step, ‘forget gate’ determines what information needs to be removed from the cell state. Next, the ‘input gate’ decides what information to update into the cell state. Finally, the ‘output gate’ performs calculating desired outputs. During this process, the cell state is transmitted constantly and updated when passing through all the links. Figure 5 describes the architecture of a basic memory cell in the LSTM network in detail.
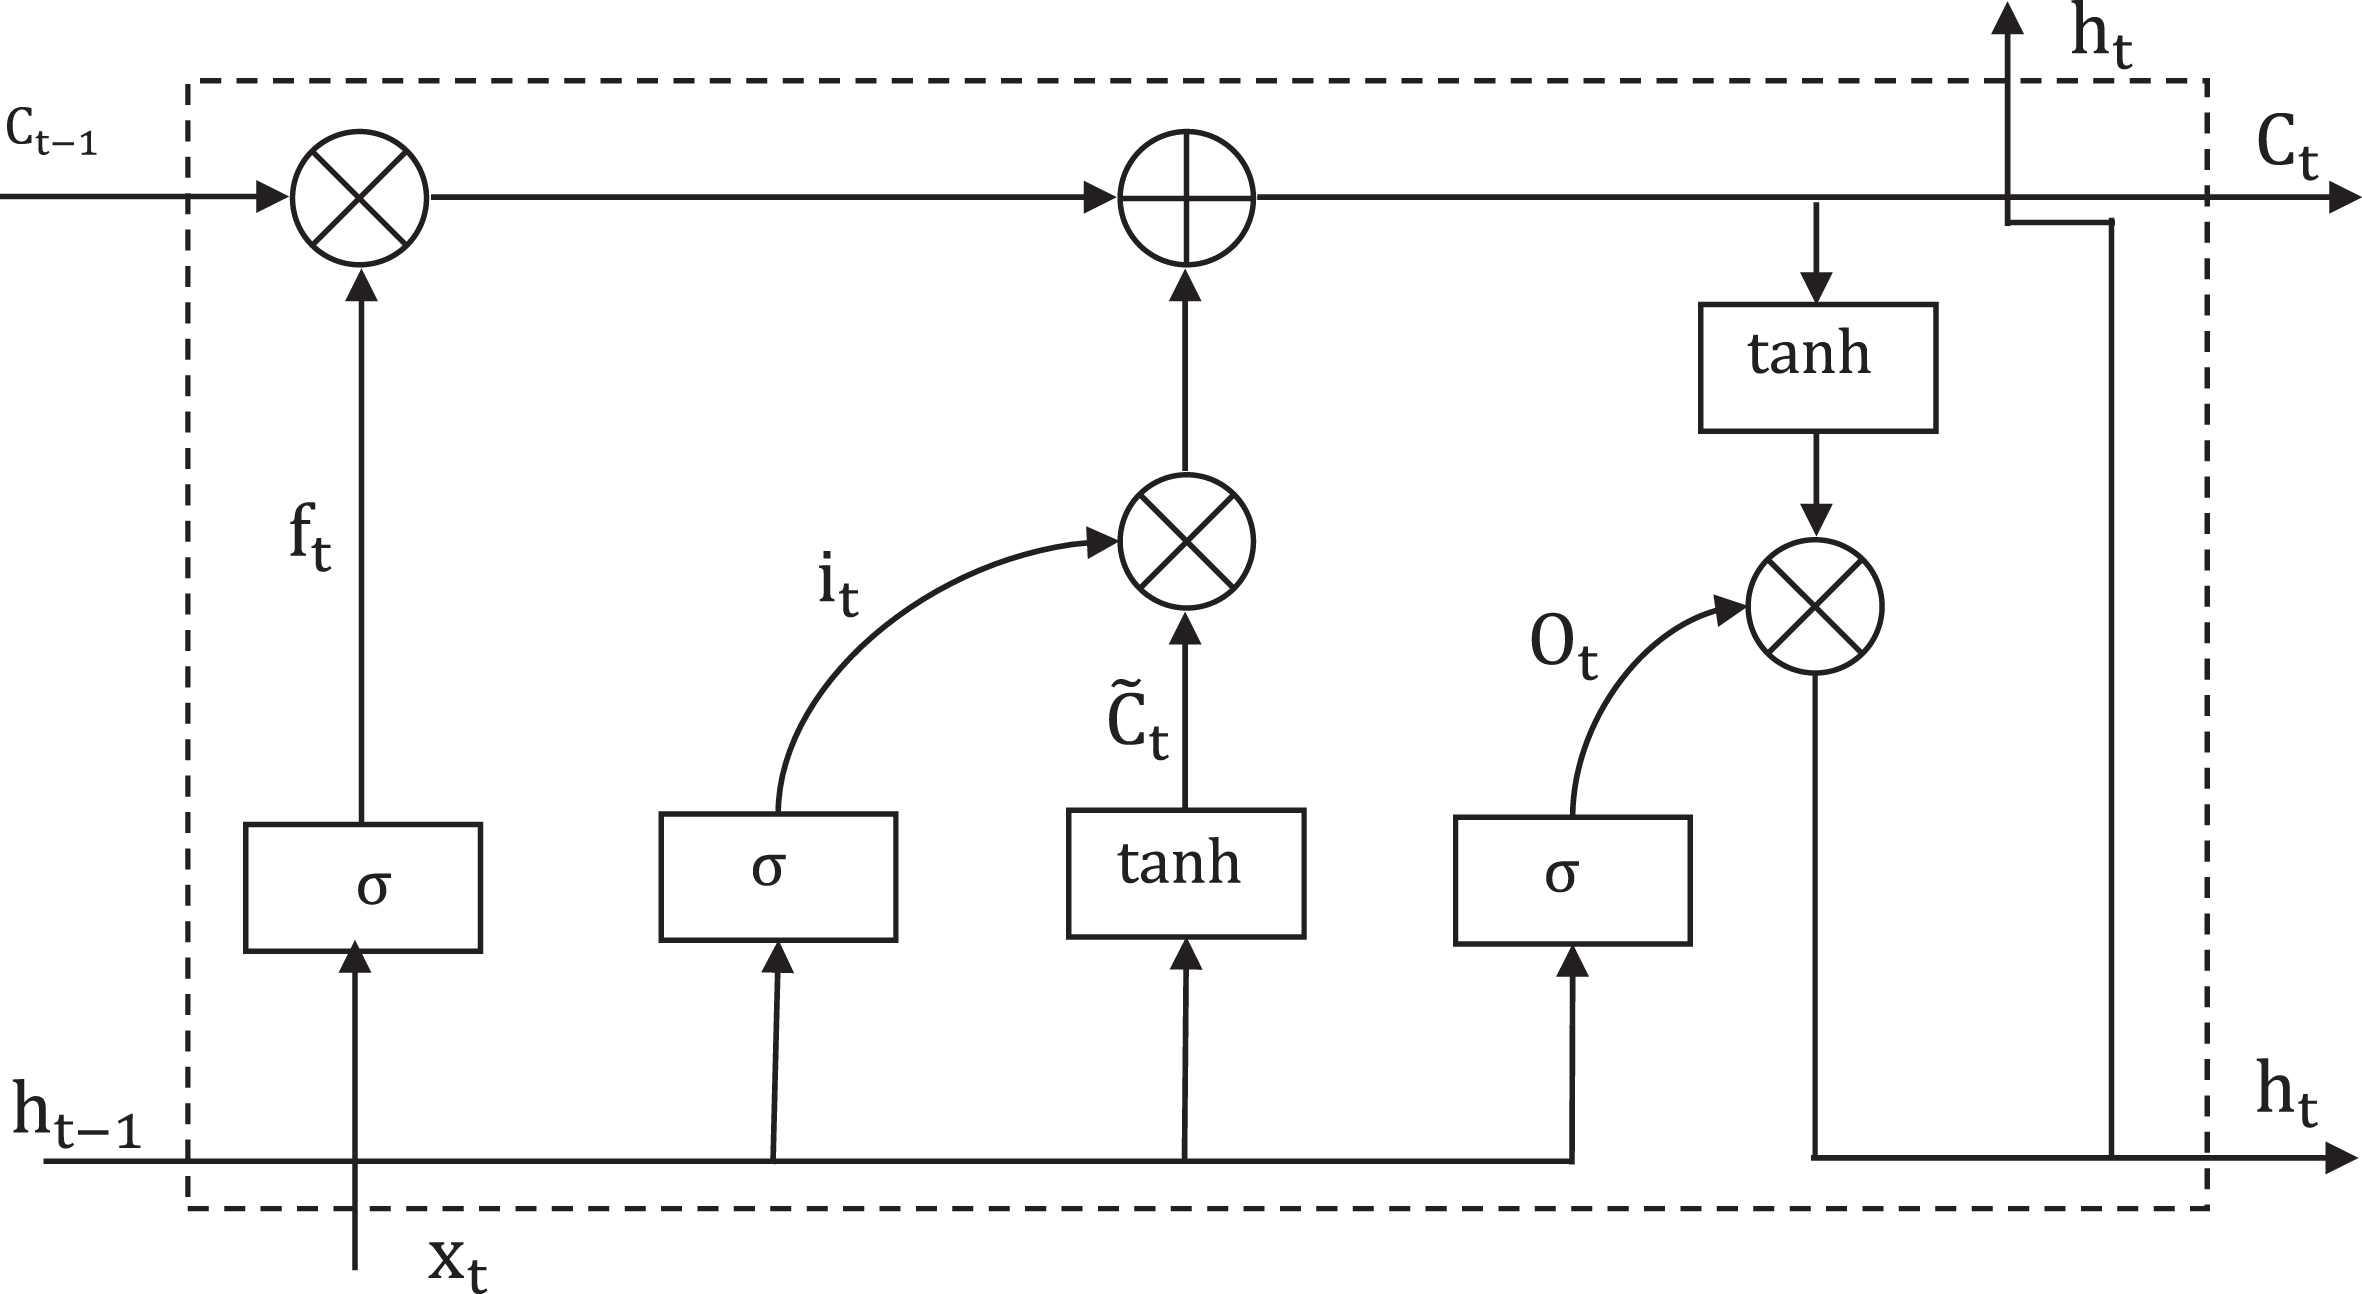
Structure model of a cell of LSTM.
At each moment t, we have a hidden state h t and a cell state C t with the basic math formulas shown below:
Input gate is defined by formula (3) as follows:
Forget gate has a general formula (4):
The general formula for the output gate is:
The new memory cell to decide what information should be written:
Then hidden state h
t
and a cell state C
t
are updated as follows:
To classify the vectors representing the features of the graphs extracted in section 3.3.1, we propose to use two deep learning algorithms: LSTM and BiLSTM.
Where: w is the weight matrix of each gate, b is the bias vector of each gate, * is the element-wise product operator.
Although the LSTM network has overcome some shortcomings in the information remembering ability of traditional regression neural networks RNN, it still has some limitations: it’s only able to memorize and learn one dimension. This makes the LSTM network can lose important information in some cases. To fix this issue, the study [42] proposed using the BiLSTM deep learning network. According to this study, the BiLSTM model has two components: forward LSTM and backward LSTM. This allows the model not only to inherit the ability to remember for a long time of the LSTM but also has the ability to remember information in two dimensions. The two layers of LSTM create two corresponding hidden states which are h
f
i
from forward LSTM and h
b
i
from backward LSTM. In particular, h
f
i
integrates the previous information and h
b
i
integrates the back information. Determine the final state h
i
by combining two states with the formula [9) below.
Where: h
i
is the hidden state in state i (contains information from both two directions) || is the join operation
Figure 6 below shows the architecture of the BiLSTM network consisting of two components: forward LSTM and backward LSTM.
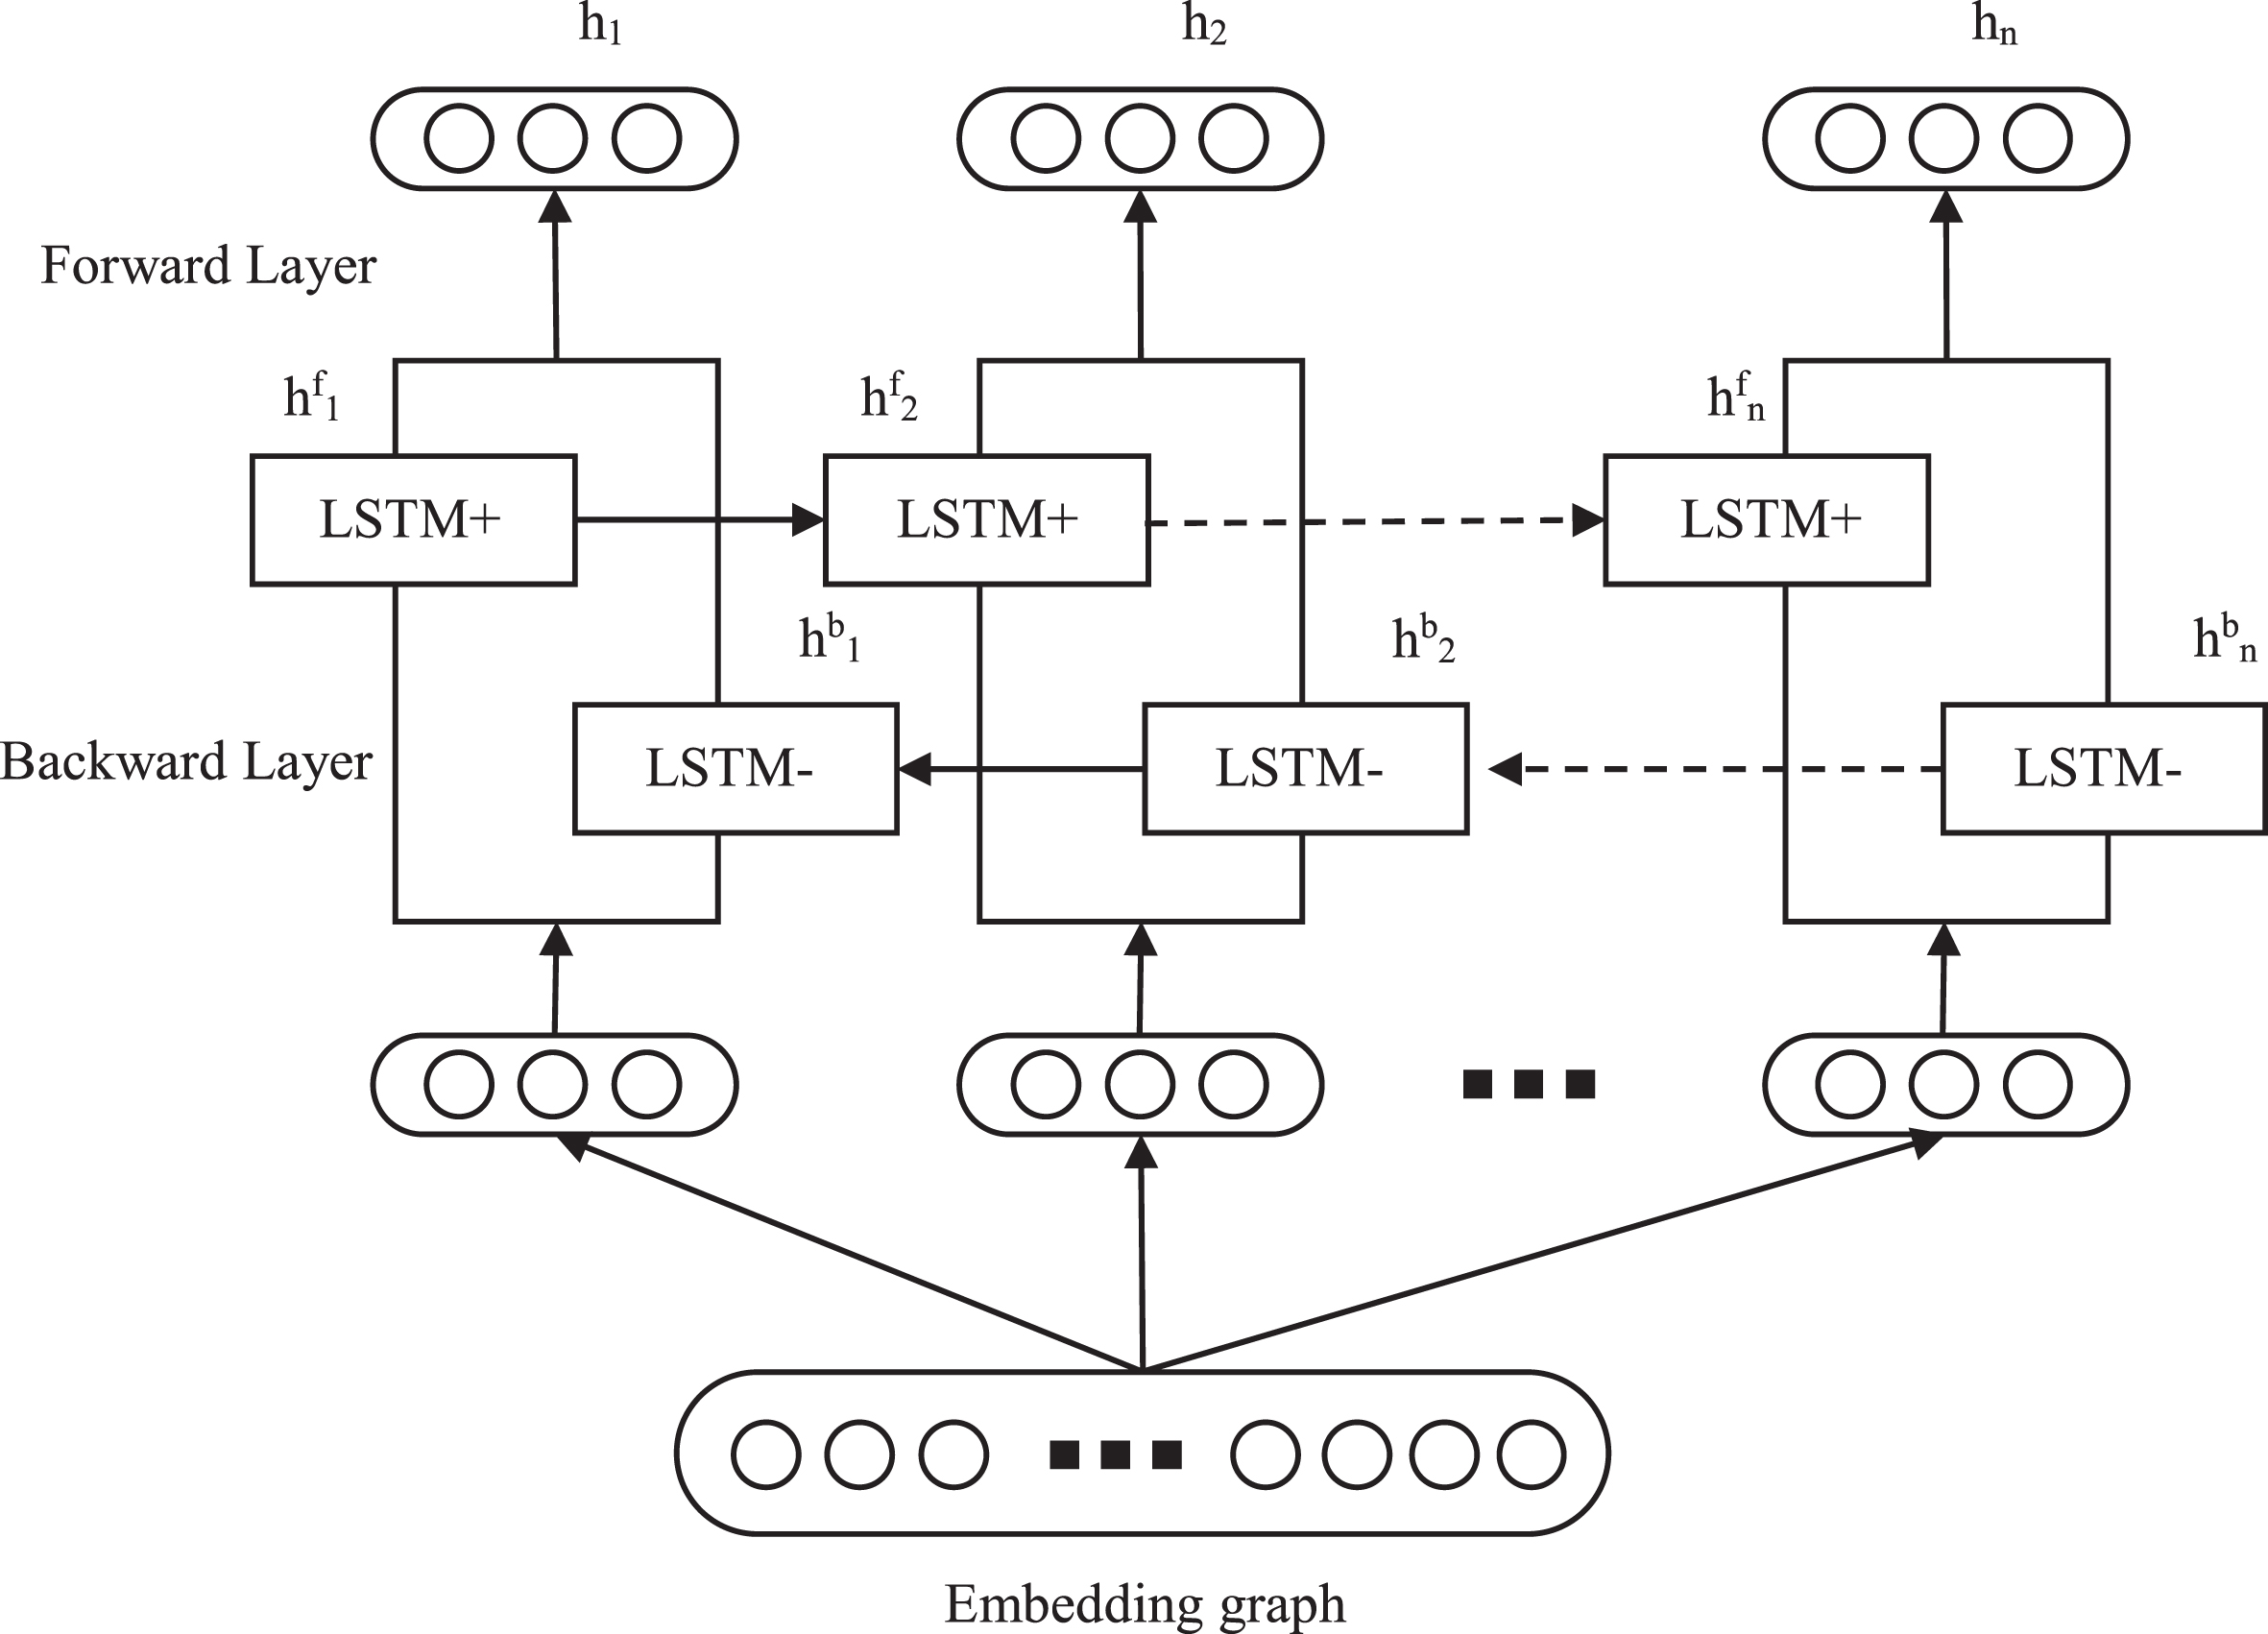
The model that describes two LSTM components in BiLSTM.
From the architecture of the BiLSTM network shown in Fig. 6 rit is clear that this model has the ability to learn one more dimension of information. This will greatly improve the remembering ability in the training process rthereby increasing the efficiency of the classification process.
With the approach of using the BiLSTM network to detect APT attack malware rwe expect this BiLSTM network could remember the location of malware groups in the embedding space in order to improve the ability to classify APT malware and benign files.
Experimental dataset
The APT malware data
In this paper rin order to build a dataset about the APT malware rwe collect malware samples from the following sources: APT attack malware that was collected and reported by reputable organizations from APT attack campaigns [43] includes several types such as Andromeda, Colbalt, Cridex, Dridex, Emotet, Gh0stRAT, NjRAT, Lokibot, Agentesla, etc. APT attack malware that was collected and monitored from organizations in the Ministry of Information and Communication of Vietnam includes Vietnam Cyberspace Security Technology [44]; Viettel Cyberspace Center [45]; CyRadar Information Security Institute [46]; National Cyber Security Center in Vietname Authority of Information Security [47].
Table 2 below lists the number and components of some types of APT malware in detail.
Statistics for the number of APT malware samples
Statistics for the number of APT malware samples
For normal data, we use data from source [43]. Table 3 lists the number and components of collected benign files in detail.
Statistics for components and the number of benign files
Statistics for components and the number of benign files
With the experimental dataset consisting of 358,075 records listed in Tables 2 3, we divide the dataset into different components and then experiment and evaluate the accuracy of the proposed models based on these experimental datasets. Our experimental scenario is as follows: As regards the dataset: The entire process of dividing experimental datasets for scenarios will be selected randomly in which 80% of the dataset are used for training, the remaining 20% are used for testing. Besides, to clearly see the effectiveness of process profile analysis, we test the collected dataset with the number of dimensions of embedding space (feature) as 64, 128, and 256 respectively. As regards the classification algorithm: In this paper, to see the effectiveness of the proposed method, we will experiment and evaluate some machine learning and deep learning algorithms proposed by some other studies. During the experiment, we will conduct to refine the parameters to suit the models that the previous studies have used. Besides, in order to calculate the probability of falling into the normal or malware classes after the data was analyzed through some deep learning layers, we use the Softmax Regression function. The Softmax function formula was defined in the study [48].
The above two evaluation methods are performed in parallel and integrated into the following experimental scenarios:
•Scenario 1: To compare the method proposed in the paper with some other approaches. For this scenario, we will conduct some comparison and evaluation approaches as follows: Replace LSTM and BiLSTM models with some other classification algorithms such as RF, Multilayer Perceptron (MLP), CNN 1D. Thus, we will evaluate the following models for this scenario: Graph2Vec-RF; Graph2Vec –MLP, Graph2Vec-CNN 1D. The reason for using RF, MLP, CNN 1D is that these are the best classification algorithms up till now. Replace the Graph2Vec model with another embedding model called Sequence. For this scenario, the attribute extraction will be performed using the Sequence model and the APT malware detection will use the LSTM and BiLSTM models. Thus, in this scenario, we will experiment with the Sequence-LSTM model proposed in [49] and the Sequence-BiLSTM. We experiment with the G2V-CNN model proposed in the study [50] to compare with other approaches
•Scenario 2: Compare and evaluate experimental results of LSTM and BiLSTM models in our proposal.
Installation requirements and Classification Measures
Installation requirements
Software requirements: Python version 3.6, Tensorflow 2.0, Ubuntu 18.04, gensim 3.6.0.
Hardware requirements: RAM 13GB; Intel(R) Xeon(R) CPU @ 2.20GH; GPU Tesla T4.
Classification Measures
The following measures are used in this paper to evaluate the accuracy of models:
In which: TP - True positive: The number of malicious samples classified correctly. FN - False negative: The number of malicious samples classified as normal. TN - True negative: The number of normal samples classified correctly. FP - False positive: The number of normal samples classified as malicious.
Experimental results of scenario 1
We will experiment with 3 different algorithms and models for this task, including RF, MLP, and CNN 1D. Tables 4, 6 below show experimental results of RF algorithms and MLP, 1D CNN models.
Experimental results using Random Forest algorithm
Experimental results using Random Forest algorithm
Experimental results using MLP algorithm
Experimental results using CNN 1D model
Table 4 lists the experimental results of detecting APT malware using the RF algorithm with the different number of trees. From Table 4, it can be seen the accuracy of the APT malware detection process is different when changing the number of features in the dataset. However, we found that with the number of trees of 100, all three datasets including 64, 128, and 256 features gave the best results on all measures. Despite this, looking at the training and testing time, it is clear that this measure increases when the number of decision trees and the number of features in the dataset increases. In particular, the training time of the model with these 3 datasets of 64, 128, and 256 features were 35.8s, 49.86s, 74.78s respectively. Besides, the testing time of the model with these 3 datasets were 0.16s, 0.19s, 0.27s respectively. We noticed that although the training and testing time increases rapidly when the number of trees and features increases, the accuracy of the classification process does not change much. This shows that with the experimental dataset in the paper, the classification abilities of the RF algorithm are relatively good and stable even when the number of features changes. Tables 5 below show experimental results of MLP model.
The experimental results in Table 5 show the effectiveness of different MLP models when changing the parameters in the Graph2Vec model as well as the number of layers in the MLP. Especially, this model gives the best results at 2 MLP layers and 64 features of Graph2Vec. In contrast to the RF algorithm, the result shows that when the number of decision trees and features of the dataset increases, the efficiency increases.
Comparing the experimental results in Table 4 and Table 5, we can see the superior efficiency of the MLP model compared to the RF algorithm. Specifically, at Accuracy measurement, the MLP model achieved 98.07% higher than the RF algorithm 0.49%. Similarly, MLP model is higher than RF by 1.07%, 0.2% for Precision and Recall measures, respectively. In terms of training and testing time, the MLP model is much higher than the RF algorithm. This makes perfect sense because the architecture of the MLP model is more complex than that of the RF algorithm.
Table 6 shows the results of detecting APT malware using the 1D CNN model. We found that these results are relatively high both in terms of classification and detection. Specifically, the overall accuracy of the classification results ranges from 98.08% to 98.34%, while the correct APT malware classification rate ranges from 93.21% to 95.48% and the correct normal file classification rate ranges from 94.47% to 98.74%. Besides, the training and detection time is generally higher than that of using MLP and RF.
In Fig. 7, we present the results of the confusion matrix of the MLP and RF models with the parameter giving the highest recall result.
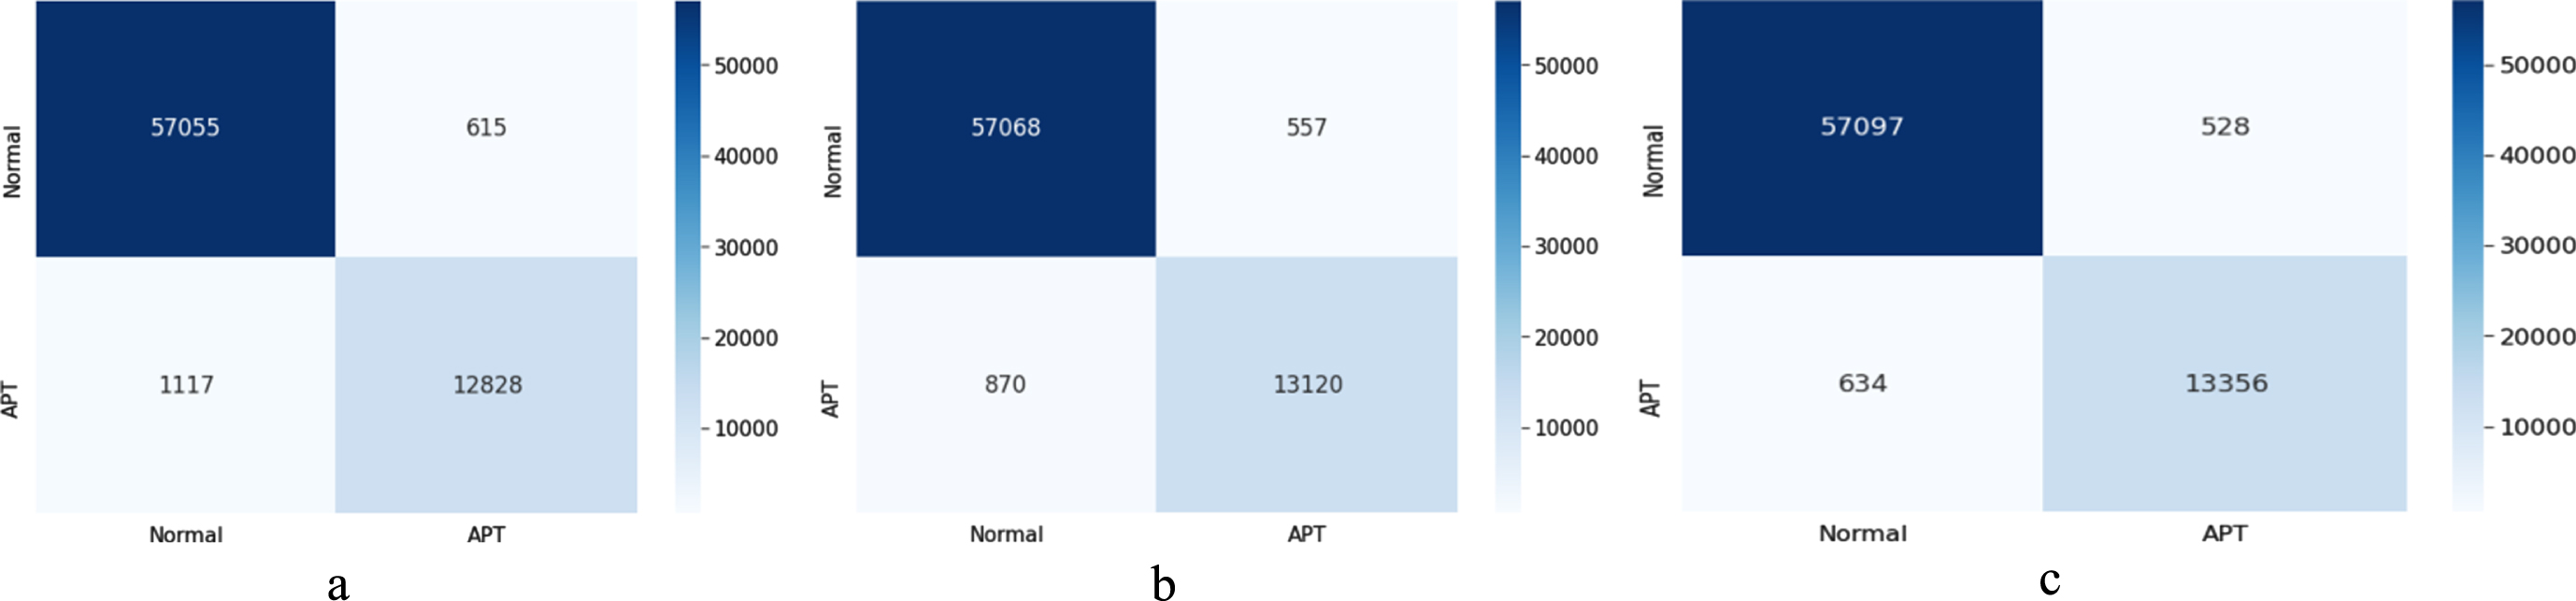
Confusion matrix result of RF, MLP, CNN 1D algorithms. in which: (a) shows result of the RF algorithm (b) shows result of the MLP algorithm; (c) shows result of the CNN1D algorithm.
From Fig. 7, it can be seen that the MLP model only incorrectly detected 870 files (reducing 247 files of false alert) compared to 1117 files of the RF algorithm. Similarly, in benign file detection, the MLP model only falsely alerted 557 files (reducing 58 files) compared to 615 files of the RF algorithm. This result shows that the MLP model is more effective than the RF algorithm in both APT malware detection and benign file detection. However, the MLP model is not as efficient as the CNN1D model. Specifically, with the CNN1D model, this model only incorrectly detected 528 benign files and 634 APT malware. This result is better than the RF algorithm and MLP
Tables 7, 8 below show APT malware detection results using Sequence-LSTM [49] and Sequence-BiLSTM models.
Experimental results using using Sequence-LSTM model [49]
Experimental results using Sequence- BiLSTM model
Specifically, Table 7 shows the experimental results of the Sequence-LSTM model studied and proposed in [49]. The experimental results in Table 7 show that the Sequence-LSTM model gives different classification results when changing the parameters of both the Sequence and LSTM models. However, this change is very slow even though the number of layers in the LSTM and the number of features of the Sequence increase rapidly. Tracking this change, we found that the best results of the Sequence-LSTM model achieved with Accuracy, Precision, Recall, and F1-Score measures were: 96.93%, 94.57%, 89.57%, and 91.94%, respectively. At the same time, most of the measures achieve the highest level when the parameters of the models are complex and multi-layered. Based on the experimental results in Table 7, this model is not really effective for both benign file classification and APT malware.
Table 8 shows the results of the Sequence-BiLSTM model. Based on the experimental results in Table 8, it can be seen that this model gives the best classification results on all measures in the model with parameters [256 Sequence- 2 BiLSTM] with values Accuracy, Precision, Recall, and F1-Score are 96.91%, 94.75%, 89.18%, and 91.8%, respectively. Comparing the results of Table 7 and Table 8, it can be seen that these two models work relatively similarly and the results do not show a large difference and the Sequence-LSTM model is more efficient. The cause of this problem is that, in the Sequence-LSTM model using more LSTM layers, it is possible to synthesize and extract more important information from which to help the classification process be accurate.
Figure 8 shows the results of the confusion matrix of the sequence-LSTM and sequence-BiLSTM models.
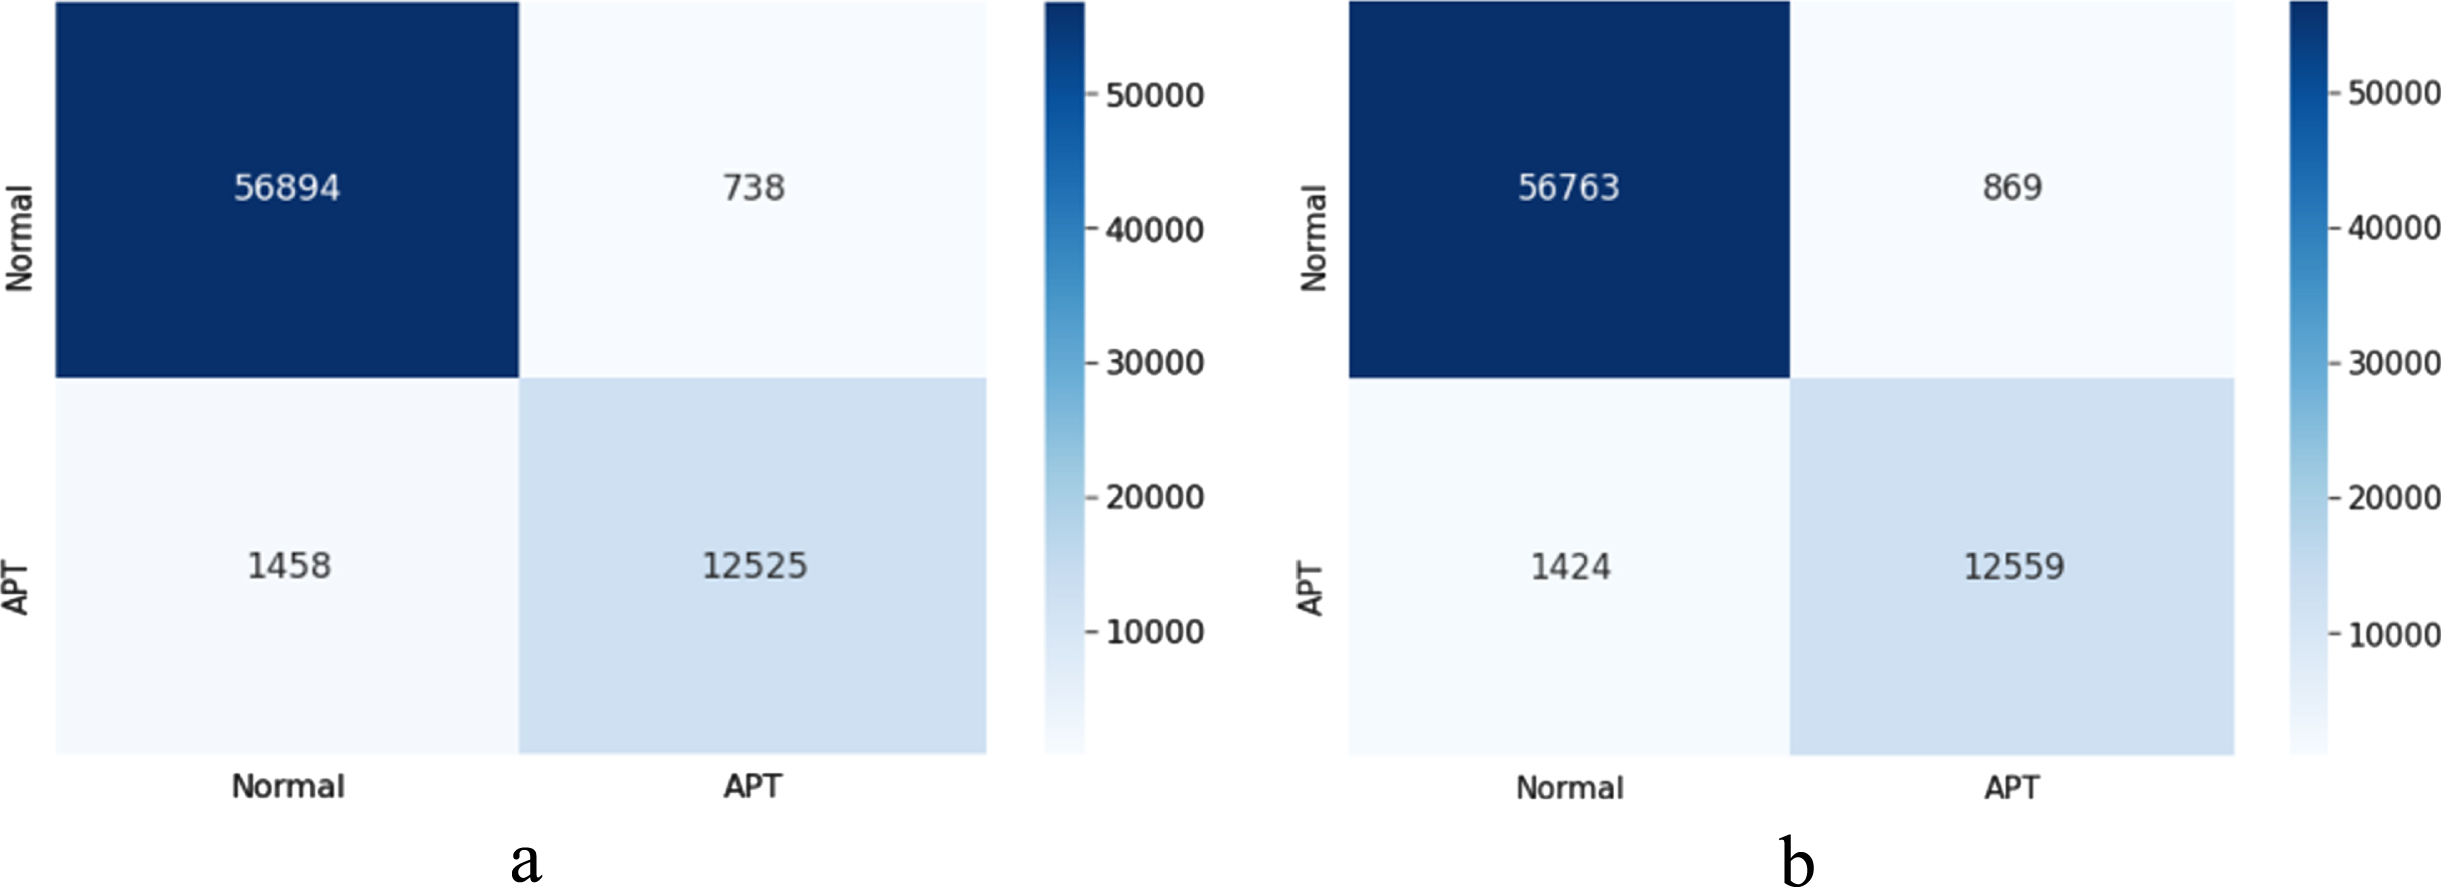
Confusion matrix result Sequence-LSTM và Sequence-BiLSTM models. in which: (a) shows result of the Sequence-LSTM model (b) shows result of the Sequence-BiLSTM mode.
From the results in Fig. 8, it can be seen that the sequence-LSTM model is more effective than the sequence-BiLSTM model in the task of accurately detecting benign files, but it is less effective with the problem of correctly classifying APT malware.
In this scenario, we will conduct experiments to evaluate the approach of using Graph2Vec in combination with CNN2D model proposed in the study (see Table 9).
Experimental results using CNN 2D model [50]
From the experimental results presented in Tables 9, it can be easily seen that: the more complex the model structure, the higher the number of filters and layers is, the worse experimental results of the model are. However, if we increase the number of features, the learning ability of the model is improved and the model gives more accurate test results. Specifically, with the detection model using 64 features, the CNN algorithm with the [2D 128–256] model gave the best classification result for APT malware and normal files that were 94.37% and 95.61%. respectively. With the dataset consisting of 128 features, the accuracy of the malware classification process was 94.92% (increases by 0.55% compared to the result of the 64-feature dataset) and the normal file classification result was 96.5% (increases by 0.93% compared to the result of the 64-feature dataset). Similarly, when using the CNN model with 256 features, the accuracy of classifying normal file and APT malware is also higher than the model using 64 features 1.1% and 0.9%, respectively. This result shows that when increasing the number of features, the accuracy of the APT malware detection process increases faster than the normal file classification process. The cause of this problem is that the APT malware dataset used in this paper is not big enough leading to CNN not being able to fully utilize its abilities, so when increasing the number of features, the classification ability in the embedding space of the algorithm is better, leading to better classification results.
Figure 9 shows confusion matrix result of Graph2Vec-CNN2D model [50].

Confusion matrix result of Graph-CNN2D model.
From the results in Fig. 9, it can be seen that this model incorrectly detected 711 out of 13,990 APT files. At the same time, it also falsely alarm 538 benign files out of a total of 57625 files.
Tables 10, 11 show the experimental results with LSTM and BiLSTM models proposed in this paper.
Experimental results using using LSTM algorithm
Experimental results using using LSTM algorithm
Experimental results using BiLSTM algorithm
With the results reported in Table 10, it can be seen that the training and classifying ability of the model is hardly changed when we change parameters such as the number of features, units, and layers. As regards the model with 64 features, the best classification results for APT malware and normal files were 95.05% và 95.11%. respectively. Similarly, when using the 256-feature dataset, the classification result for APT malware increased by 0.69% compared to the the result of model using the 64-feature dataset. And the algorithm gave the best results which were 96.46% (increases by 1.41% compared to the result of 64 features dataset) when using the 128-feature dataset. Comparing the experimental results on Tables 4, 10 on the measures of classification process for malware and clean files, the LSTM algorithm gives better results than the other methods with the recall of 96.46%. Specifically, based on Tables 10 and 6, 9, the LSTM model with the ability to remember information gave better results than the CNN model: the malware classification results increased by 0.99%. Likewise, when comparing experimental results in Tables 10 6, it is clear that the LSTM model gives better results than CNN 1D in APT malware classification. However, the training and detection time is not as good as CNN 1D. In addition, another aspect of the LSTM model demonstrated through the experimental results is that when increasing the number of features and the number of layers, the training time as well as detection time increase rapidly (training time increases by 2 to 2.5 times and detection time increases from 1.2 to 1.5 times), but measures such as accuracy, precision and recall do not change much. Therefore, it can be concluded that the LSTM model demonstrates its stability and effective classification for detecting both malware when parameters are changed.
Similarly, the experimental results in Table 11 show that the BiLSTM model gave the best classification results for APT malware at the 128-features model with 2 layers with a parameter [256-256]. On the other hand, the measures change irregularly, when changing the parameters such as the number of features and the number of units. Specifically, at the 64-features model, the highest Accuracy was 98.11% at 2 parameter layers [128-128], while at the 128 features model it is 98.38% at 1 layer [128], at the 256-features model, it is 98.44% at 1 layer [128]. As regards the accuracy of APT malware classification, results of the BiLSTM model ranged from 94.84% to 96.24% (up 0.77% compared to the result of CNN model).
Comparing the results in Table 10 and Table 11, we found the following: regarding Accuracy, the BiLSTM model gave better results with the highest rate of 98.44% (increases by 0.08% compared to the result of LSTM model); regarding the classification of malware LSTM model gave better results than BiLSTM model of 0.22% respectively; regarding the training and testing time, the BiLSTM model consumed approximately 2 times higher than LSTM. The cause of this problem is that the BiLSTM model has a structure consisting of two LSTM layers that operate in two opposite directions: one operates in the forward direction, the other operates in the backward direction. This leads to the calculation and processing process is slower. From the experimental results using LSTM and BiLSTM models, we noticed that the LSTM model give the best effect with the dataset that we use in this paper.
Figure 10 shows the confusion matrix results of the Graph2Vec-LSTM and Graph2Vec-BiLSTM models.
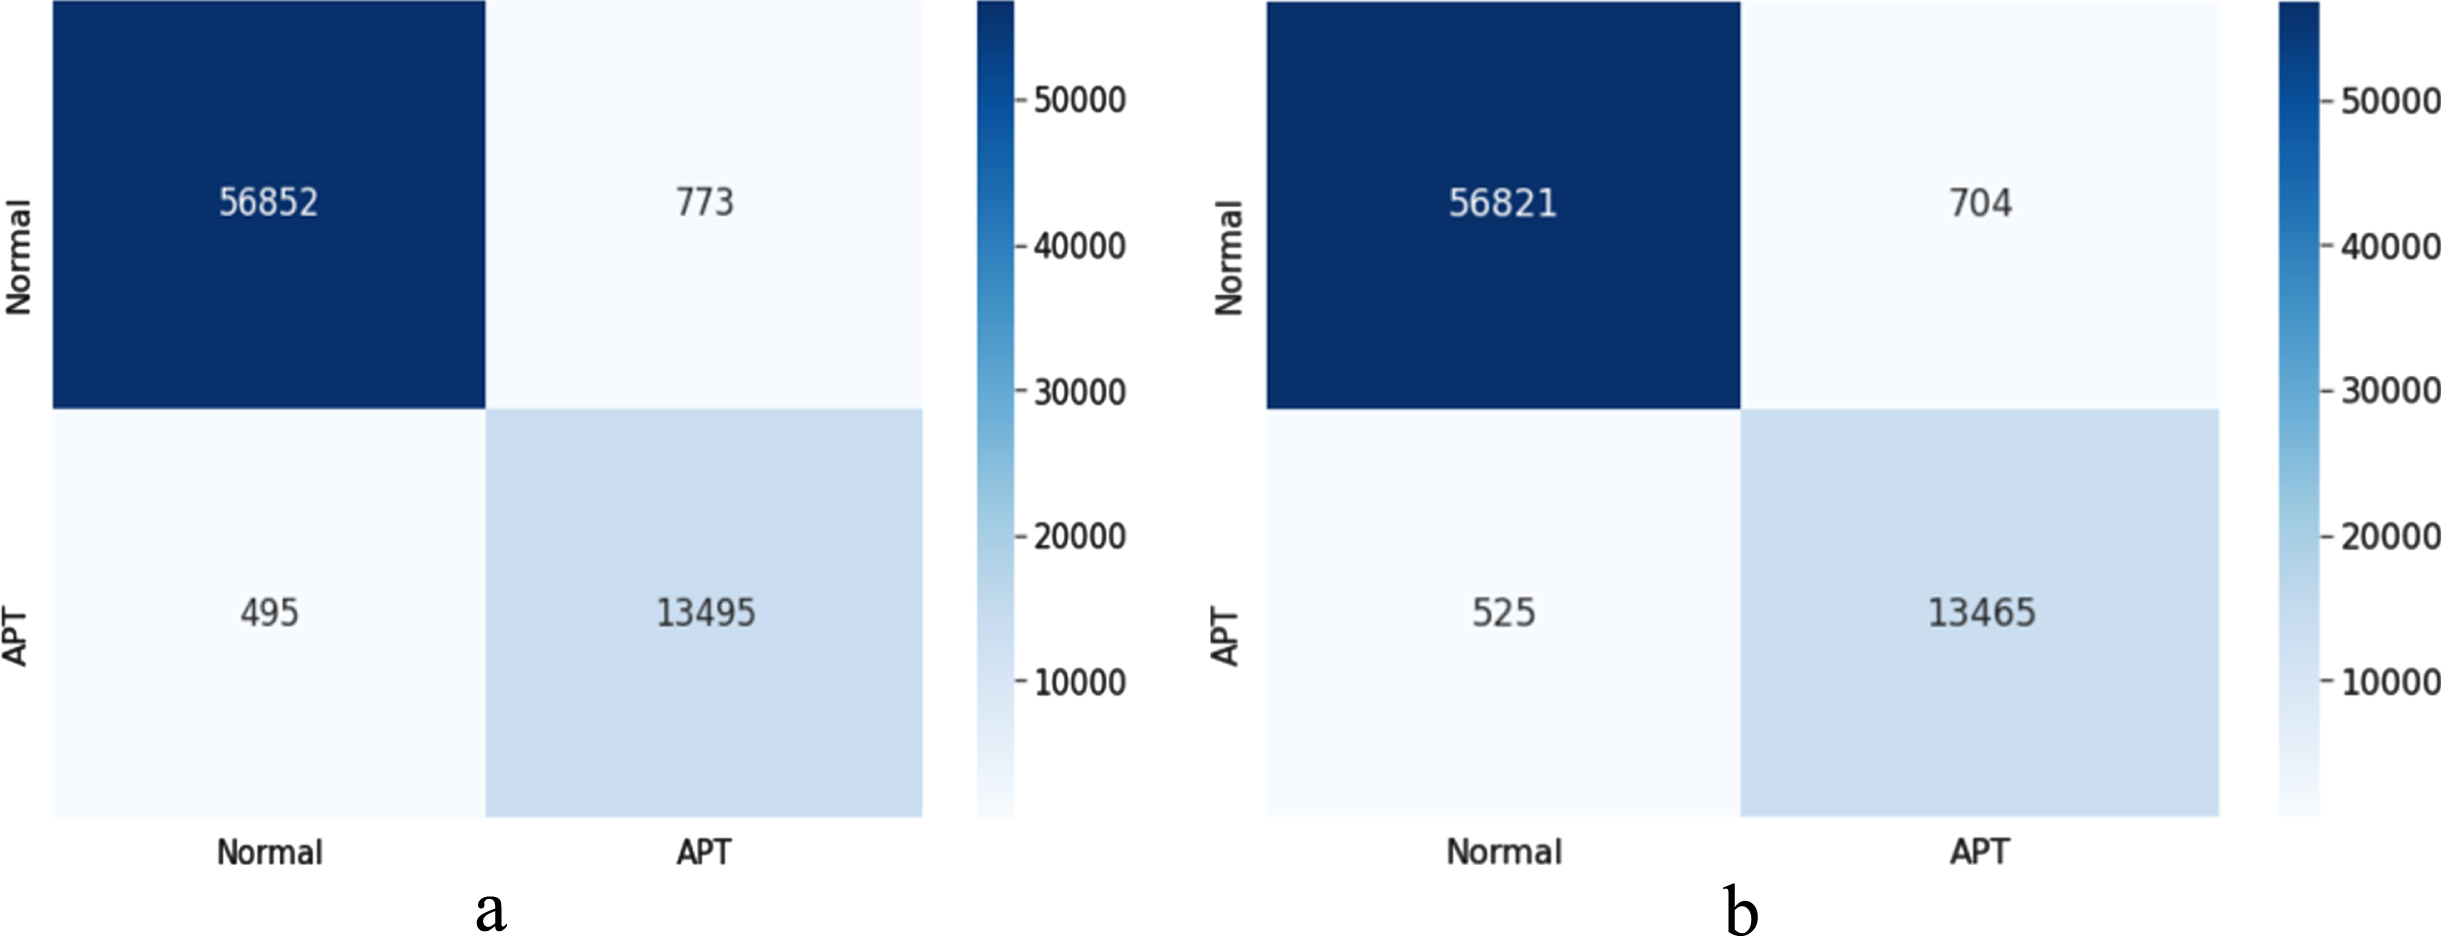
Confusion matrix result Sequence-LSTM và Sequence-BiLSTM models. in which: (a) shows result of the LSTM model; (b) shows result of the BiLSTM model.
Detailed analysis of Fig. 10 shows that the Graph2Vec-LSTM model (wrongly detecting 495 files) is more effective than the Graph2Vec-BiLSTM (wrongly detecting 525 files) model in the task of accurately detecting APT malware of Graph2Vec-BiLSTM. However, in contrast, the Graph2Vec-BiLSTM model only wrongly detected 704 benign files, reducing 71 files compared to the result of Graph2Vec-LSTM model. These results once again confirm the correctness and reasonableness of our proposals in this study when using the combination of Graph2Vec model with LSTM and BiLSTM models.
The experimental results presented in section 4.4 shows that our proposed method is more effective than other approaches in the APT attack detection problem.
First, in the scenario of comparing LSTM and BiLSTM models with other algorithms and classification models: Obviously, although many studies and proposals proved that the RF algorithm is superior in the classification task compared to other supervised machine learning algorithms, in the problem of detecting APT malware based on process profile analysis technique, it does not work well. Similarly, although the CNN1D and MLP deep learning models have complex architecture and calculation, it does not bring the desired effect. As regards the CNN 1D model, we find that there is a superiority over the RF algorithm and the MLP network. However, the dataset has a large difference between the number of normal data and the APT data (the number of clean data is 4 times malware one), so the model still has some false classification. Comparing tables 4, 6 with Tables 10 11 shows that LSTM and BiLSTM models have better performance than other classification algorithms on all measures.
Second, in the scenario of replacing the Graph2Vec model with the Sequence model, comparing the results between Tables 7 8 with Tables 10 11, it is clear that the proposal to use the Graph2Vec model for the attribute extraction task has completely better results than when using the Sequence model. This efficiency is reflected in both the accurate detection of APT malware and normal files. Specifically, when the Graph2Vec-LSTM model brought higher efficiency than the Sequence-LSTM model on Accuracy, Precision, and Recall measures of 2.36%, 4.54%, and 6.89%, respectively. Similarly, the Graph2Vec-BiLSTM model also outperforms the Sequence-BiLSTM model from 2 to 7% on all measures.
Third, in the scenario of comparing the proposed method in the paper with other approaches, in this paper, we compared our study with two other approaches including Sequence-LSTM [49] and Graph2Vec-CNN 2D [50]. Comparing the results on Tables 10 11 with Tables 7 9, we see the superiority of our proposed model with these other proposals. In addition, the results shown in the confusion matrix in Figs. 7, 10 once again confirm the optimization of the proposed model in the study with other studies in the same approach.
Finally, the two proposals in this study performed in their functions and tasks well because the results are better than other techniques and methods. This demonstrates that the deep learning models with the ability to fully remember can be adaptable to classification tasks with imbalanced datasets. In addition, based on the changing parameters in the LSTM and BiLSTM models, the paper provides options for the APT malware detection model on workstations when needing a trade-off between computation time and effective detection. Obviously, with the use of more complex network layers and architectures, higher results can be obtained, but higher system and time costs will be required.
Conclusions
In The trend of APT attacks by spreading malware through end-users is causing many difficulties and challenges for information security monitoring systems. In this paper, with the goal of early detection and warning of APT malware on workstations, our proposal has succeeded in building an APT malware detection model based on profile analysis technique using Grap2vec algorithm and deep learning models. Through the research results in this paper, this paper solved 3 issues: i) regarding the process of building process behavior profiles: with a flexible combination of process labeling via Mitre attack and several other behavior features, we have successfully built the process profile in graph form that fully shows the behavior of APT malware. This not only shows the correlation between processes to improve the efficiency of the process of monitoring and detecting APT malware on workstations but also reduces cost for storage devices of the system; ii) regarding process profile analysis: the proposal to use the Graph2Vec model has brought remarkable efficiency. We successfully standardized the process profile in graph form into an embedding graph showing full features of the graph to help the process of detecting APT malware more efficiently; iii) regarding APT malware detection process: some of the proposed deep learning models including LSTM and BiLSTM are highly effective: the experimental results are much more effective than other studies and proposals in the same approach. With the research results presented in this paper, our research has not only contributed to solving some difficulties in the APT malware detection task but also opened up new research and approach directions for tasks of detecting other anomalies on the workstations such as malware, intrusion behavior, insider, etc. In the future, in order to improve APT malware detection on workstations, based on research results in this paper, 2 main issues can be considered to improve including i) method of building and synthesizing process profiles; ii) method of analyzing process profiles.
Footnotes
Acknowledgments
This work has been sponsored by the Posts and Telecommunications Institute of Technology, Viet Nam