
Abstract
Wireless Capsule Endoscopy (WCE) allows direct visual inspecting of the full digestive system of the patient without invasion and pain, at the price of a long examination by physicians of a large number of photographs. This research presents a new approach to color extraction to differentiate bleeding frames from normal ones and locate more bleeding areas. We have a dual-system suggestion. We use entire color information on the WCE pictures and the pixel-represented clustering approach to get the clustered centers that characterize WCE pictures as words. Then we evaluate the status of a WCE framework using the nearby SVM and K methods (KNN). The classification performance is 95.75% accurate for the AUC 0.9771% and validates the exciting performance for bleeding classification provided by the suggested approach. Second, we present a two-step approach for extracting saliency maps to emphasize bleeding locations with a distinct color channel mixer to build a first-stage salience map. The second stage salience map was taken with optical contrast.We locate bleeding spots following a suitable fusion approach and threshold. Quantitative and qualitative studies demonstrate that our approaches can correctly distinguish bleeding sites from neighborhoods.
Keywords
Introduction
The invention of fiber-optic endoscopy allowed for the external visualization of the gastrointestinal tract (GI) but was linked with pain and patient distress. The wireless endoscopy of capsules improves greatly in diagnostic endoscopy, without pain, anesthetic, or air-breathing, when testing the human GI tract. Especially when the source of obscure gastrointestinal bleeding (OGB) is identified, a source not detected by standard endoscopy as permanent bleeding. At an estimated 35,000 per patient, the health budget has a significant economic impact, accounting for around 5 percent of all GI hemorrhages [1, 2]. The ability to picture the whole small bowel directly is an advance in diagnosing OGB.
The time taken by image screening requires clinicians to look at 14,400–72,000 collected frames, only 1% of which may have clinical interest, which is a major drawback to the CE technique, which influences a right diagnosed approach [3]. The reporting time is 45 min to two hours for the comprehensive evaluation of a single VCE case [4]. Manufacturers have employed some image processing techniques to speed up this procedure. This includes a software program called the Suspected Bleeding Indicator Given Imaging’s Rapid Reader (SBI). Studies showed that the SBI accuracy profile for different instances is inadequate and very varied. This algorithm’s motivation comes from a performance metric, which is often assessed using a held-out validation set or by cross-validating the training dataset.
This has led to much research into computer-aided diagnostic methods to detect blood spots automatically in endoscopic capsule images. These investigations cut down reading times and enhance diagnostics, showing that many thousands of typical photographs would otherwise miss clinical images. Several supervised and unattended learning methods for bleeding detection have been used in the current literature. The unattended approaches rely mostly on important characteristics that characterize their specific abnormalities. These methods are not tested on huge datasets, though. The literature usually finds supervised blood detecting technologies. The pixels [5] are a regularly employed solution suitable for delineating pixel-perfect bleeding zone. This approach is not suited for processing many video images because of its high computing complexity, particularly when it comes to high-definition photos. The limits inspired extraction from picture patches or complete images [6]. These methods will probably diminish sensitivity to the detection of minor bleeding patches.
Arbitrary areas for the exact production of characteristics that characterize bleeding or no bleeding regions are considered in recent papers. These areas have been produced by picture segmentation, e.g., the region grows, superpixels [7, 8] algorithms for growth cut or average citification. This work proposes the selection of regions of arbitrary form needing less human interaction using a better region growth algorithm. Studies suggest that color characteristics detect bleeding more discriminatory than texture characteristics. This research has advanced our understanding of texture- and color-dependent characteristics. Most methods use WCE frames to extract colour and texture information. However, blocks of pixels have the potential to detect bleeding frames with high-performance metrics like sensitivity, specificity, and accuracy. Various techniques [20] focus on the individual pixel value. The search space is therefore limited to first-order histogram moments of the color channels selected. For functionality extraction, the color space of the RGB and HSV is selected according to (1) blurring displayed as special shades of red and (2) the space of the color of the HSV is less susceptible to light change [9].
The remaining paper is organized as follows. Related works are discussed in section II. The methodology of the work is described in section III. Results are discussed in section IV. The article is concluded in section V.
Literature survey
The first WCE video analysis research articles came soon after clinical practice was initiated in WCE. The larger set of articles has addressed this difficulty, as recognition of bleeding is very often necessary and seems easily achieved. The biggest problem is that blood spots and traces have no typical texture and form. This makes it difficult for other elements to distinguish between the intestinal walls, and blood color differs from red, dark, and brown. While resilient and requiring less processing effort, spectral texture features lack semantic value and require large enough square frame regions for extraction. Color changes depending on the disease, bleeding time, capsule position and environment [10].
If parameters for a given data collection have been trained, the color approaches in this set function well. Still, their generalization is doubtful for other patients or capsule manufacturers. However, the major factors for classification remain the color-based characteristics. Various authors adopt distinct techniques only in the color space in which they work. Colored spaces like RGB and HSV have been used frequently; however certain writers suggested that unusual colors were available. Most approaches extract pixel-level functions, Three-five others use image blocks, and one way or another, uses the whole image [11].
Pixels work without a local context and process each pixel separately. Their major advantages are speed and ease. Some work with spectral changes in the RGB color area or utilize a basic threshold with a vector machine threshold [19] to be supported. But RGB space is not discriminatory in additional patient testing, as shown below in Sec. 3.1. [12], which employed the Hue element just of hues. This method has been adopted by saturation, intensity (HSI) and other authors. The cooccurrence matrix of grey is used by Mohan Priya and Sangeetha [13] to classify the pixels in neuronal networks using the Mumford–Sha function. In [14], the color characteristics are retrieved using K-means.
Block-oriented techniques divide each framework [15] into n/n pixel parts and determine their color properties. For each block, additional criteria for nearby blocks might be introduced at first. 1 Block size n controls the performance of the block sizes techniques. N, getting closer and stronger but losing sensitivity towards small blood spots converges to photography. When n approaches the pixel approach, the algorithms come together—they become less stable but sensitive. As a compromise, we recommend choosing n 1/4 5.
Methods that describe the whole frame provide global image characteristics. This method, however, cannot detect small pockets of bleeding [16]. The capsule uses wireless communication to transmit the photographs it has taken to the data recorder. After then, the outputs will be examined to identify any flaws [18]. The whole steps of a WCE system’s operation are shown in the figure below. However, some writers have such a classification of frames, for example, Lv et al. [17] have been using a color invariant histogram spatial pyramid. Flying Xia analyses [29] the notion of web interface color design with image processing at its core. It provides theoretical guidance for web interface designers and related parties in implementing color design and provides content for further studying web interface color design in image processing. For end-to-end lesion segmentation of endoscopic images in the GI Tract, Shuai Wang et al. [30] presented a multi-scale context-guided deep network (MCNet), in which both global and local contexts are collected as guidance for model training. The privacy of the patient is also studied in a few papers [21–23]. These techniques are particularly ideal for improved data comprehension and are simple to use and comprehend. By contrasting each feature with the desired outcome, statistical methods [24–27] can be utilised to determine the input function’s most crucial qualities..Zonda Wu [31] outlined an implementation algorithm that complies with the location privacy concept. Zongda Wu [32] presented a dummy-based technique for text retrieval privacy protection. To describe the criteria that ideal fake inquiries should satisfy, Zongda Wu [33] created a privacy protection model for book search. Sarker IH, Hoque MM, MdK Uddin, Tawfeeq A [35], and others can leverage the relevant mobile data to develop customised context-aware smart mobile applications. Thus, the need for data management tools and processes that can quickly and intelligently extract insights [37] or usable knowledge from the data, on which the foundation of real-world applications is based, is urgent.
Bleeding detection methodology
Bleeding detection technique architecture is shown in Fig. 1. The first phase of the classification process for bleeding and not bleeding frames was carried out just with color characteristics, and the second phase with the use of color and texture characteristics is classified with bleeding and nonbleeding pixels.

The processing of the frame of the blood proposed.
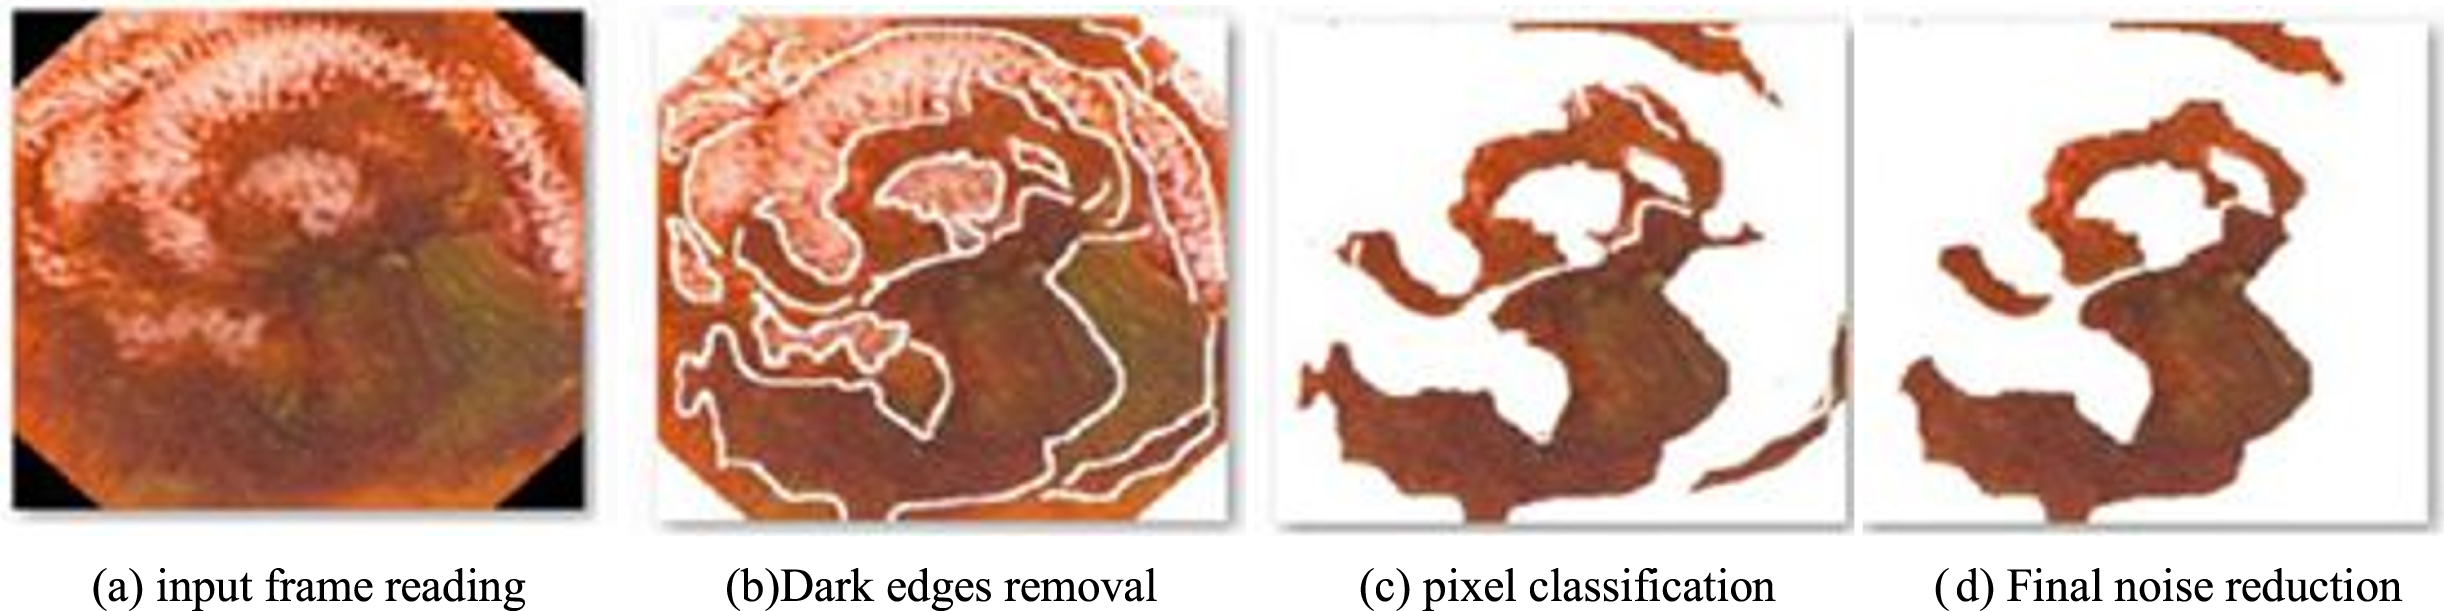
The example of the output of the framework processing steps for the framework level bleeding process.
We first load a data-proof input framework, Color RGB format conversion. Frame borders are removed then, and pixel blocks that are overexposed and under-exposed lower the number of defect detections. The next stage is to improve the frame by utilizing the masking of edges and the elimination of noise. Subsequently, color and texture traits are used to remove and detect bleeding. Machine learning (ML), a subset of artificial intelligence (AI), has evolved significantly in recent years in the context of data analysis and computing, which often enables the applications to perform intelligently. IH Sarker [36]. Finally, a grading step for detecting bleeding in a frame and a pixel with a suitable classification is taken.
In the GI tract, under- and over-illuminated regions can be found that cannot, therefore, be processed. For instance, this class can be classified into a huge air bubble packet23. The square root of a sum of individual RGB quadratic squares is the brightness of the There is a 32x32 pixel block for we calculated this:
I and j are the horizontal and vertical markers, respectively.
We have numerous inaccurate findings because of the inclusion of border information in frames, which may contribute to misdetection. The edges are essentially intestinal folds; a random vector on the camera view direction is responsible for the ambiguous edge. We use a canny operator to remove this information. 24 The canny algorithm settings allow the distinctiveness of the edge depending on the requirements to be determined. As a result of noise reduction and robust pixel recognition at the edges, we opted to use a standard deviation of 0.35% and 35% for this experimental set-up. Therefore, the upper and lower thresholds of Ţ1 = 0.3, and Ţ2 = 0.7, respectively, were used. The detected information is then diluted using morphological dilatation. If A is a frame, B is the structural element after masking operation, the dilatation of A to B is defined as follows:
It is based on the source of reflection B in the equation above, which is shifted by z. In this examination, we chose the structural element of dilation B as a three-point-wide square. Next, the bleeding pixels that were detected incorrectly are removed by morphological erosion.
Color is one of the most commonly utilized picture attributes, and there is a variety of color. When the color space is defined, the colour characteristic is taken out of the framework or a given region. The range of optical frequencies for red (R), green (G), and blue (B) are 630–780 nm, 490–560 nm, and 450–490 nm, respectively (B). Compared to the red channel, the green and blue channels have a much lower reflection and specific values than the Through the determination of the high red regions and the red ratio of the individual three component pixels, the characters C1, C2, and C3 can detect a bleeding region.
Equations (3) and (4) illustrate this (5). Coloricity, and chromaticity, is the R canal fraction (C3) in all three basic colors. (C4) The amplitude ratio of the red to green and blue chains (6). The value of chroma is significantly higher than normal mucosa, indicating another characteristic (C5), as shown in the equation. In this case, it’s the chro (7).
For the SVM-controlled learning model, the color characteristics are then used. The SVMs are exact as they include adequate kernels (implicit input mappers in high dimensional spaces) that function well even if the data in the future base space is not linearly separable. By leveraging the core functions of SVMs24, you can more precisely map your input to high-dimensional feature spaces to accomplish a nonlinear classification. 25 Different hyperflatrate instances divide the input from each of the classes defined (two in our case). However, the best one with the widest distance to the closest dataset of the two categories must be selected. Certain performance measures should direct this algorithm, generally measured by evaluating a validation system or cross-validating a training dataset. In this article, we use a radial-base function (RBF) SVM classification with at least two parameters (consistent regularisation C and μmhyperparameters) which must be tweaked to achieve good testing data performance. In this case, a binary classification issue shows a mathematical descriptor: {(x1, y1) , (x2, y2) , . . . , (xk, yk)} where xi μn represents the characteristics of n-dimensional vectors, and yi {1 –1} is the class label for that. The SVM must address the next optimization issue:
subjectto y i (ω⊤φ(x i ) + b) ≥ 1 - ɛ i , ɛ i ≥ 0, i = 1, …, k
Subject to here, βi is the variable with the slack sample, and C is the parameter for the error term penalty. In addition, K (xi, xj) =φ(xi)T φ(Xj) μ is functional to a kernel (xj). It comprises four kernels: a linear kernel, polynomial, sigmoid and an RBF. This function is based on four kernels. We adopted the RBF24 kernel in this paper:
Here, γ In the experiment, selecting the parameter properly is important. We chose the optimal values in the parameter C and D rangesLog2 γ: –8, 7, 6,..., 6, 7, 8. The search technique for the grid method25 was taken (a 0.8 step was used). In tenfold cross-validation, each α and C value pair was used for assessing model performance in training data. Once the optimal values of γ and C have been identified, a new SVM model has been adopted.
The texture is a very helpful property in the processing and classifying images for a wide range of applications. The human visual system is usually thought to use textures to recognize and interpret visual data. However, texture can only be evaluated with the help of groups of pixels, while color is usually a feature of pixels. 26 For the extraction of textural features, several techniques have been proposed27. Spatial texture extraction and spectral texture extraction methods are the two most common types of texture extraction methods. The texture characteristics of the former approach are retrieved from the calculation of pixel statistics or the identification of local pixel structure within the original domain of a frame. In contrast, a frame is converted into a frequency domain to compute the characteristics of an original frame. Sensitive to noise and distortion, spatial texturization features can extract data without data loss from any form. Specific texture properties are strong and utilize less computational resources but they are not sem
If p(i, j) is the I j)-th entry for the px(i) normalized gray-toned spatial–dependence matrix, the marginal probability pattern px(i) (i, j), The numbers of the greys and px and py entropies are HX and HY in the quantized framework. Each texture feature is derived from gray-tone spatial dependency matrices. The equations in Table 1 define 22 textural features. This is a list of Haralick’s 27 features, including the following characteristics: T1, T2, T5, T3 and T8T11 of 28 and T5, T21, and T22 of 2,29 are also characteristic.
Effect variation of histogram bin numbers on classification performance of the proposed method
Also included in T1 is energy or evenness, which measures the homogeneity of the structure. On the other hand, in a similar image, there are only a few grey levels, which means there are only a few but reasonably high (i, j). There is a lot of space between the square Entropy function T2 is used to measure the degree of unpredictability or disruption in the frame. The entropy value is significant if all items in the matrix are identical and small when the elements are uniform. Inhomogeneity scenes are low in the first line of entropy, while similar scenes are extremely enteric. There are different weights (T3), except diagonal which compounds the GLCM chances (along which neighboring values are equal). Diagonal smoothness statistical characteristics T3-06, T18 & T19 have the weighted distances from GLCM (i.e., location.). Also called homogeneity is the opposing moment of difference (IDM) (T6) and evaluates local frame homogeneity. IDM evaluates the proximity to the GLCM diagonal of the GLCM element distribution. A variety of parameters are given to IDM to decide whether or not the frame is textured. Homogeneity gauges the distribution of elements close to the GLCM diagonal. Increasing homogeneity frequently lessens the contrast.
For first-order standard deviation, variance (T12) has a good relationship with statistical variables. The difference grows when the gray level differs from the average. Additional information on the average estimated for the adjacent pixels (T13), on the sum variances for the adjacent pixels (T14, on the difference in the adjacent pixel) or the entropy for the sum for the adjacent pixels (T15) (T17). The information correlation coefficient (T18 and T19) is based on two x and y variables p(x, y). The parameter x’=f(x) is invariant and reduces it to a standard correlation coefficient where the p(x,y) is normal. This parameter is not the same.
The maximum correlation code (T20) defines the second biggest authenticity of matrix Q as its square root. The characterization of the unique values for the finite random variables is expressed.
These color and texture characteristics are intended at a pixel level to extract various local characteristics. In this study, two methodologies in classification are used to discriminate between two pixels based on machine learning. The first group comprises all pixels, such as fresh and old, open wounds. Blood-related findings. These discoveries are usually red: youthful blood scarlet, elderly blood scarlet dark brown. At first look, 30 color features seem the best way to detect blood spots, but due to the second group of pixels, the GI tract. Frames are rarely dominated by pixels.
These pixels are linked to non-security outcomes such as normal GI tissue, stool masses and food residues. They are also linked to non-security findings such as tools. Every “regular” result can be colored in random colors, but it also has color in red shades such as food leftovers, certain forms of feces, some kinds of normal tissue of the gastrointestinal system, etc. Unlike in the initial pixel group, a textural feature for this set of pixels is a key input in pixel-level classification processes, allowing the system to distinguish between different types and local texture features with information about colors.
Detailed categorization of pixels is necessary because both bleeding zones could be huge and extremely low, with a space resolution somewhat inadequate for state-of-the-art WCE.There are several options for high-performance bleeding. A test of all pixels is therefore necessary. Random Tree (RT), 30 Random Forest (RF), 30 and Logistic Model Tree (LMT)30 are used in the suggested pixel grading technique.
Result and discussion
The test results from the suggested approach are shown in this section to demonstrate and compare efficiency with 2300 WCE images in the proposed process. These photographs of WCE are chosen from 30 WCE videos, which are extensively utilized and are publicly available. Among the 2300 photos of the WCE, there are 450 signals of bleeding, the others showing signs of nonbleeding.
Statistical Analysis
A total of 65 bloating photos are utilized to determine the proper m and n values for the linked ground-truth photos. Initially, all 65 photographs are used to verify step 1 pixel accuracy. This pixel level’s precision can be defined.
The actual numbers of pixels, true unblasted numbers and total pixels in the WCE image are Ntbp, Ntnbp and Nt correspondingly. The pixel level accuracy of step 1 threshold 4 frames for various m ranges is illustrated in 3 for demonstration purposes (a). For most photos, m = 2.8 shows the maximum pixel precision percentage. Figure 4(a) shows the mean and standard deviation from the precision of step 1 pixels using m values for 65 bleeding pictures. The most precise mean (70.71 percent) and lowest standard difference are found by m = 2,8 (7.63 percent) statistic measures. The reason m = 2.8 represents times thrice are higher (max) pixel of Precision percentage indicates that is the peak level. And n = 2 indicates that decrease (minimize) of pixel level or precision percentage from the peak.

Effect of m and n for the pixel accuracy of 65 frameworks; (a) mean and standard deviation of step-1 threshold accuracy using different m; (b) mean and default ROI generated with various n value deviations.
Next, to identify the right value, n values in the 65 bleeding pictures are examined to check the ROI accuracy by maintaining m fixed to 2.8. Figure 3 illustrates the ROI-section pixel-level accuracy of 4 pictures on different n values in m-2.8 (b). The figure shows that for both n = 1 8 and 2.0, the percentage is roughly identical to the highest form = 2 8. The mean pixel-level accuracy of the ROI detection with varied values of n with m = 2 8 is shown in Fig. 4(b) for 65 bleeding images. With m = 2 8 and n = 2 0, segmentation of the ROI achieves the highest pixel mean accuracy (88,54%) and the lowest standard deviation (3.64 percent). However, the proper m and n values can be found simultaneously. However, if the relevant m and n values are progressively searched, the search area for the appropriate m and n values will certainly decrease.

Impact of m and n on pixel level accuracy in the light of 4 images; (a) precise step 1 thresholding with different m; (b) accurate ROI removal with different n.
Photos of the original size are 576 out of 576 pixels. After removal of the outer dark zone, the photographs are 512/512 pixels. The dark pixels of the corner is then removed to notify the region. The appropriate associations in (1), (2) and (3) are utilized to translate every image in the RGB color space into a RGB color. The ROI is then retrieved using the relationships (4) from each bleeding and nonbleeding picture and (5). The histogram for each image at the appropriate ROI is independently obtained by g and b planes, which keep the number of bins for each image constant. To compute the bin centers, divide g and b by the number of containers. Then the recommended The frequency will deliver vector features of the histogram on each bin. For classification, a KNN classifier is utilized. To test the classification performance, a tenfold cross-validation scheme is performed.
When photos of the bleeding are identified, four distinct examples of Images of WCE blood, namely false bleeding (Fb), counteractive nonbleeding detection (Fnb) and true bleeding (Tb) (Tnb). The results of the bleeding detection process, which may be computed as follows, depending on its sensitivity, specificity and precision:
In the suggested method, several containers are employed to remove features from histograms. Table 1 shows the results. These characteristics are
Used to evaluate the efficacy of the proposed blood detecting technology. Taking into account the size of the feature vehicle, the g plane 64 bin histogram for selected ROI shows the best result of 97.86 Percent, 95.20 percent and 98.32 percent specificity. In the KNN classifier, the performance of the suggested technique is similarly measured by different values of K. K = 5 reveals among them the best outcome. Figure 5 shows the results.

Comparison of normal and segmented performances.
In these circumstances, global calculations are made of the appropriate number of bins and K value. However, instead of histogram bin frequencies, one may explore choosing histogram statistics as features. The features of histogram statistics, such as average, variance, bias, courtesy and energy, are regarded as distinct statistical measures in the cascades. KNN K = 5 evaluates the classification of histogram statistics. However, these features show a low precision of 86,79%, a sensitivity of 57,89% and 93,52%. A histogram classification statistic’s performance, thus, does not indicate good discrimination. It offers 64 chroma-level bin histograms such as r-g-b-color and H planes with the HSV color domain, Y and Q with the YIQ color domain, and the CIE planes L, A, and B, all with the same LAB color domain KNN with K = 5. Tab 2 shows the results. Similarly, the results achieved in the g-plane using ROI are compared with the full picture in Fig. 6. Figure 6 and Table 2 illustrate the best results for all three performance indicators for the g-plane histogram utilizing ROI. As the last step, a comparison is made between the method provided and the proposed uniform local binary pattern (LBP) feature, where color planes are used to extract LBP features from RGB images. In RGB-indexed images, the extraction feature requires binary image coding. A converted color plane Y. I/Q is presented, although harsh Q = 0 thresholds are used. KNN classifier with K (K = 5) is utilized in all four approaches for consistent comparison. Table 3 shows that the proposed technique works better than the other four alternatives in terms of all three performance indices. Sensitivity is the most important of these.
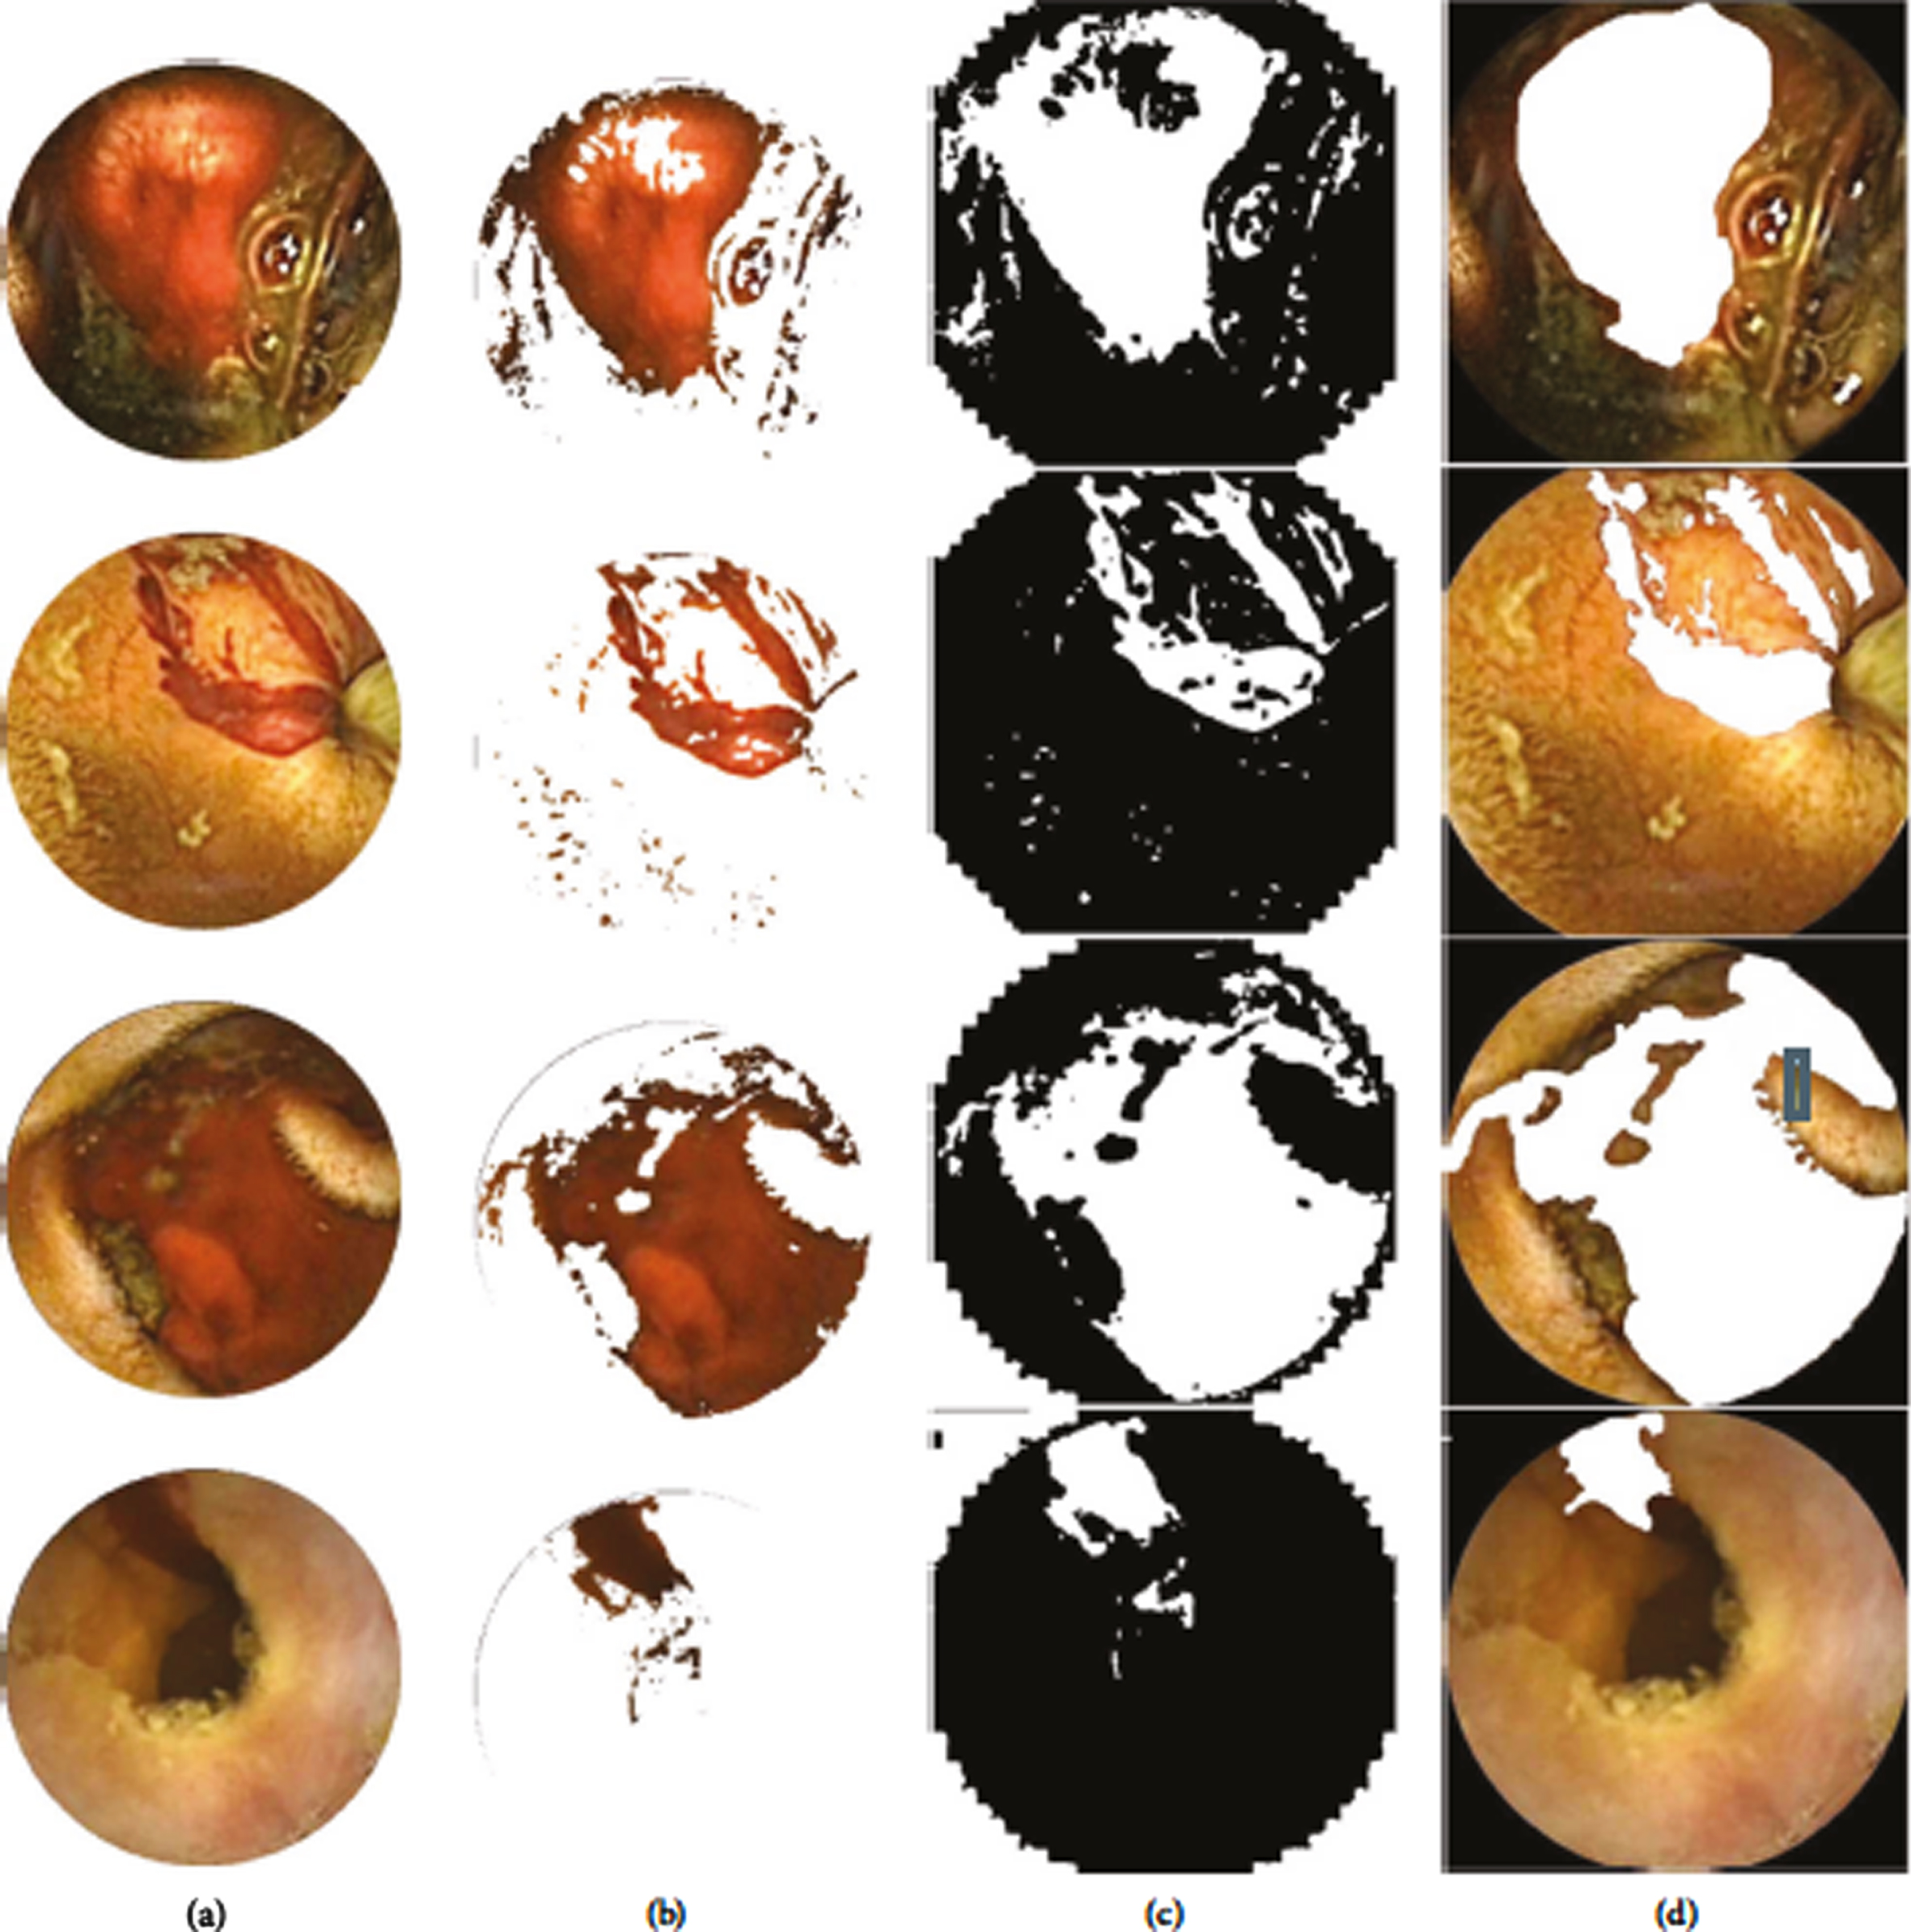
(a) images of preprocessed bleeding; (b) ROI removal; (c) area of bleeding output; (d) the realities of soil.
Performance variation of different color domains
Comparison of classification accuracy among different methods (%)
Here are the findings of the bleed zone detection after the brood frames. 65 WCE bleeding scenes show the efficacy of the bleeding region detection technique. In the relationships described in (1), (2) and (3), Pre-processed photos from RGB color space are converted to rgbcolour.
The ROI is then retrieved using the conditions in (4) from the bleeding pictures and (5). Following this, a bleeding image is performed in two-stage morphological operations. The initial job is to remove minor elements from a binary image and to integrate different aspects of morphologicaldilatation in the image. Specialists mark soil truth, and pixel-based comparisons between bleeding regions and soil truth are made to
Bleeding videos are a great way to demonstrate the efficacy of the proposed strategy; five continuous videos are used to illustrate the experimental data obtained from the proposed approach. It takes one minute to see each video, which comprises 100 screens. The suggested bleeding frame detection system categorizes each frame in those five videos. In the case of nonbleeding frames in the continuous video, the post-processing strategy is performed to eliminate discontinuity. Criteria for assessing performance aresensitivity, characteristics and accuracy. A cross-validation system for leaving one is used to assess the performance of the categorization. The findings are shown in Table 6. Note: all pictures are bleeding pictures at video number 5. The term specificity for this video is thus not defined. The good result of the table ensures good histogram functioning in segments. The comparison with the other recent methods is shown in Tables 4 and 5.
Comparison with the Recent methods
Detection of bleeding areas performance
Constant video performance
As a result of the research, an effective approach for removing ROIs has been developed based on the WCE image’s Using the ROI histogram, a WCE image can be used to distinguish between photographs of the standardizedavion, and those that show. It has been observed that RGB is far better than the typical RGB color space with a domain histogram. The difference in the number of pixels in the two scenarios (sanitary and non-sanitary) is highly apparent, especially with the bin frequencies in the RGB histogram within the ROI. Therefore, in the suggested feature vector, all bin frequencies are used. In addition, histogram utilization in g-planes has been observed to deliver higher performance over r or b-planes. The simplest KNN classifier is utilized for classification, making it easy to construct. It emerges that the strategy given is more efficient than the four methods tested in all three performance indices in terms of accuracy, specificity and sensitivity of the categorizing bleeding and non-bleeding photographs. From these bleeding photographs is calculated the bleeding region is based on the retrieved ROI. Area detection morphological surgeries help the bleeding zone to smooth. In the end, many continuous films are used for the proposed algorithm for bleeding detection. The performance of the approach in continuous movies guarantees good functionality. The proposed automatic picture recognition system for improved performance bleeding will consequently reduce the number of WCE images by clinicians.