
Abstract
In view of the shortcomings of the existing evaluation methods in fully considering the fuzziness and randomness of product design evaluation, a novel product design evaluation method based on FAHP and cloud model is proposed. First, a hierarchical structure model of product design evaluation is established. Second, fuzzy pairwise comparison of criteria is constructed through questionnaire survey, and the digital characteristics of weight cloud model are acquired by the proposed fuzzy weight model. Then, based on the factor scores, the digital characteristics of scoring cloud model are obtained by backward cloud. Finally, the digital characteristics of comprehensive evaluation cloud model are obtained by using the proposed improved fuzzy composite operator, and the forward cloud is used to get the cloud picture for evaluation. Taking reading lamp as an example, the feasibility and effectiveness of the proposed method are verified. The results show that compared with the other two methods, the Kendall rank correlation coefficients of entropy of the method are increased by 0.17 and 0.33, respectively, which proves that the method achieves more accurate evaluation result under the complex criteria, and provides a more effective tool for decision makers and designers to evaluate and optimize design schemes.
Introduction
With the continuous development of the economy, users have played more and more important role in the market, so it is particularly important to correctly grasp their demands [1—3]. User-centered design evaluation can check the satisfaction of user demands in the product design and development process [4]. Effective design evaluation methods can provide important insights for the evaluation and optimization of design schemes [1, 5].
In recent years, a wealth of research has been conducted on product design evaluation. Zuo et al. [3] proposed a subjective product evaluation system based on Kansei Engineering and analytic hierarchy process (AHP). G.Nilay YÜCENUR et al. [6] proposed a quality function deployment (QFD) method based on the fuzzy VIKOR to determine the design properties of small household appliances. Wu et al. [7] constructed an auto-weighting fuzzy- weighted-intersection fuzzy analytic hierarchy process (FAHP) approach, which was applied to compare six mobile power banks for a smart backpack design. Du et al. [8] introduced a personalized product service plan recommendation method adopting the trust degree and cloud model. Wu et al. [9] adopted a preference-based evaluation-fuzzy- quantification method to determine the priority of the development of attractive factors of an electric scooter. The reliability and effectiveness of the system were verified by a user questionnaire survey with chairs as experimental samples. Due to cognitive discrepancies, subjects have fuzziness and randomness in product design evaluation [10], it is better to use fuzzy methods. The above studies show the better applicability of fuzzy methods in product design evaluation, and the potential of FAHP and cloud model in solving fuzzy problems.
Evaluation method based on FAHP and cloud model
Evaluation method based on FAHP and cloud model
Both FAHP and cloud model are fuzzy methods that can quantify the subject evaluation. FAHP overcomes the disadvantages of unbalanced judgment scales and inability to adequately handle fuzzy pairwise comparisons compared to AHP [11]. As a transformation model between qualitative concepts and their quantitative representations, cloud model can reveal the intrinsic relationship between fuzziness and randomness [12]. Cloud model solves the cognitive differences of the subjects and reduces the information distortion to a great extent [10]. So, the two techniques show high applicability in product design evaluation.
To combine the advantages of FAHP and cloud model, some evaluation methods combining them have been proposed (Table 1). The relevant literature in Table 1 provides some theoretical and practical references for product design evaluation research. In these studies, exact value is generally used to represent the weight calculation results in the weight calculation link, which is the key link in the evaluation calculation process. However, exact value cannot completely retain the fuzzy and random information of the evaluation, which is easy to lead to the deviation of the final calculation results.
To solve this problem, a novel product design evaluation method is proposed based on the improvement of the combination technology of FAHP and cloud model. In the method, a fuzzy weight model combining FAHP and the backward cloud is used in the calculation of criteria weights. To fully consider fuzziness and randomness, an improved fuzzy composite operator is proposed for calculating the comprehensive evaluation cloud model. The research framework of the method is shown in Fig. 1.
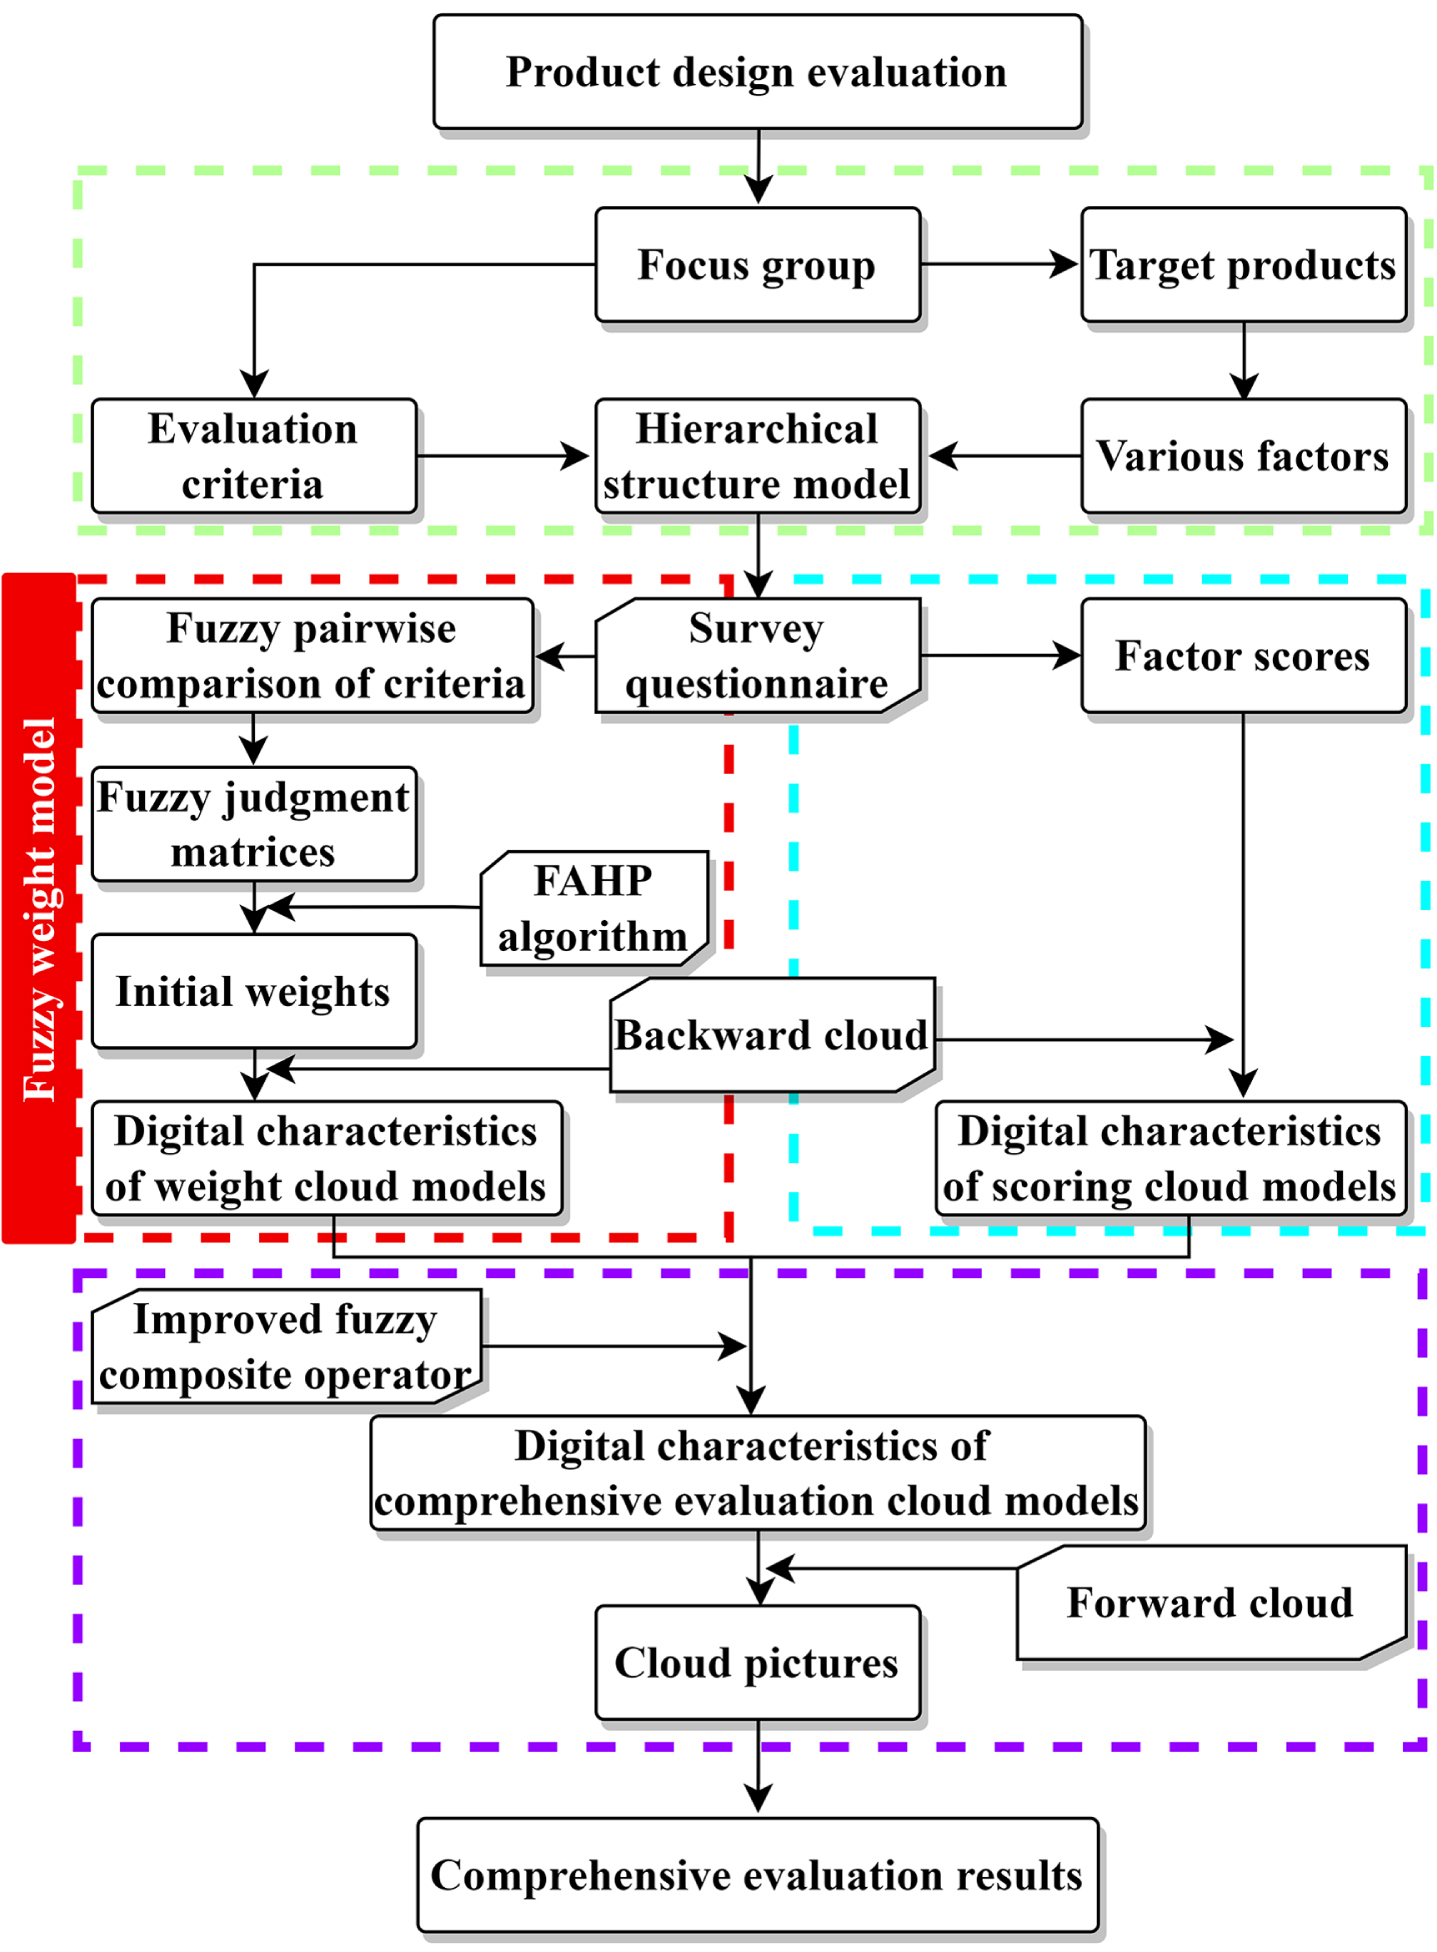
Research framework of product design evaluation method.
The method starts with product design evaluation and finally gets comprehensive evaluation results. It can be divided into four parts in turn. In the first part, a focus group is formed to identify the evaluation criteria and the target products from which various factors could be extracted. These factors play an important role in establishing the hierarchical model; the second part mainly involves the construction of the fuzzy weight model by using the techniques of survey questionnaire, FAHP algorithm and backward cloud. Its whole process can be divided into four steps: fuzzy pairwise comparison of criteria, construction of fuzzy judgment matrices, calculation of initial weights and digital characteristics acquisition of weight cloud models; the third part revolves around the construction of scoring cloud models by using the data of survey questionnaire and backward cloud, including the two steps of successively obtaining factor scores and getting digital characteristics of scoring cloud models; in the last part, digital characteristics of comprehensive evaluation cloud model and corresponding cloud pictures are obtained by using the improved fuzzy composite operator and the forward cloud.
This section reviews the basic definitions and notions of FAHP and cloud model, and introduces an improvement of the fuzzy composite operator.
FAHP
Laarhoven and Pedrycz [23] proposed FAHP, which introduced fuzzy logic into AHP to make up for the deficiency of AHP, so FAHP is also called fuzzy AHP. In the following studies, trapezoidal fuzzy number, triangular fuzzy number, extent analysis method and fuzzy consistency have been introduced into the method of FAHP one after another [11]. Although FAHP has been continuously improved, its steps for calculating criteria weights are relatively uniform, and its use can be divided into the following steps [24]:
(1) Establishment of hierarchical structure model
The hierarchical structure model can be divided into goal layer, criterion layer and factor layer. In product design evaluation, the goal level is the subjects’ evaluation for the product design, the criterion level is the criteria that affect the subjects’ evaluation, and the factor level is the specific schemes under each criterion. Among them, only criterion level can be multi-layered.
(2) Construction of fuzzy judgment matrix
In this study, triangular fuzzy numbers (TFNs) are used to process precise numbers to obtain quantitative results. The fuzzy number M on the domain of definition R is expressed as a TFN, and its calculation formula can be expressed as
Among them, l < m < u, the TFN can be represented by (l, m, u). If l = m = u, then M is not considered to be a fuzzy number.
The construction of the fuzzy judgment matrix uses the method of pairwise comparison in the FAHP proposed by Chang [25]. Suppose X = x1, x2, x3, …, x
n
is the object set and G = g1, g2, g3, …, g
m
is the target set. Select each object to compare and analyze with each target, and m values of comparative analysis of each object can be got, whose symbol is
In the process of constructing the fuzzy judgment matrix, it is necessary to process the exact number through the TFN, and then to obtain the quantitative results. In this study, a scale of 1-9 is used to indicate the degree of importance between the criteria (Table 2) [26].
Quantification and meaning of 1–9 scale definition
(3) Calculation of initial weight
For the fuzzy judgment matrix, the maximum eigenvalue and the corresponding eigenvector are solved. Then the eigenvector is normalized to obtain the initial weight vector of criterion. The steps are as follows [25, 27]:
Step 1: Define the fuzzy synthesized degree value of the i-th object as
Step 2: Assuming that S
i
is represented by (a, b, c), and its total integral value is expressed as
Where: α is the index of optimism.
then the weight vector is calculated as
Step 3: Through normalization, the initial weight vector is expressed as
Where: W is a non-fuzzy number.
(4) Consistency inspection
To ensure the effectiveness of the quantitative results, the final weight results need to be tested for rationality, that is, the consistency test of the fuzzy judgment matrix. According to the related research results, if the matrix P is consistent, then the fuzzy matrix
The consistency check coefficient is CR, and the calculation formula is as follows:
Where: RI is the consistency index, which can be obtained by looking up the index table. The calculation consistency criterion CI is defined as
Where: n is the order of the matrix; P
wi
is the i-th component of the vector P
w
; λ
max
represents the maximum eigenvalue, which can be calculated as
If CR < 0.1, the consistency test of the judgment matrix passes. Otherwise, the consistency test fails, and the questionnaire corresponding to the judgment matrix needs to be eliminated.
The cloud model proposed in 1995 can reflect the fuzzy randomness of human thinking and the uncertainty of things [30]. A large number of cloud drops in the cloud model can form a cloud picture. Each cloud drop is a point where the qualitative concept C is mapped to the domain space. The certainty degree of the cloud drop on the concept C is the membership degree [31]. The digital characteristics of the cloud model are reflected by three values of expected value Ex, entropy En and hyper-entropy He [32].
As shown in Fig. 2, Ex is the expectation of the spatial distribution of cloud drops in the domain space, which can best represent the qualitative concept of evaluation. En reflects the uncertainty of the qualitative concept. The larger the En is, the larger the cloud picture span is, and the stronger the fuzziness of the subjects’ evaluation becomes. The assessment of Ex by different subjects is generally within the range of [Ex - 3En, Ex + 3En] [30]. He is the uncertainty measure of En, that is, the entropy of entropy. The larger the He is, the larger the thickness of the cloud picture is, and the stronger the randomness of subjects’ evaluation becomes. According to the basic nature of the cloud model, the importance of Ex, En and En is decreasing accordingly. If we want to compare cloud models, the larger Ex is the better, while En and En are the opposite.
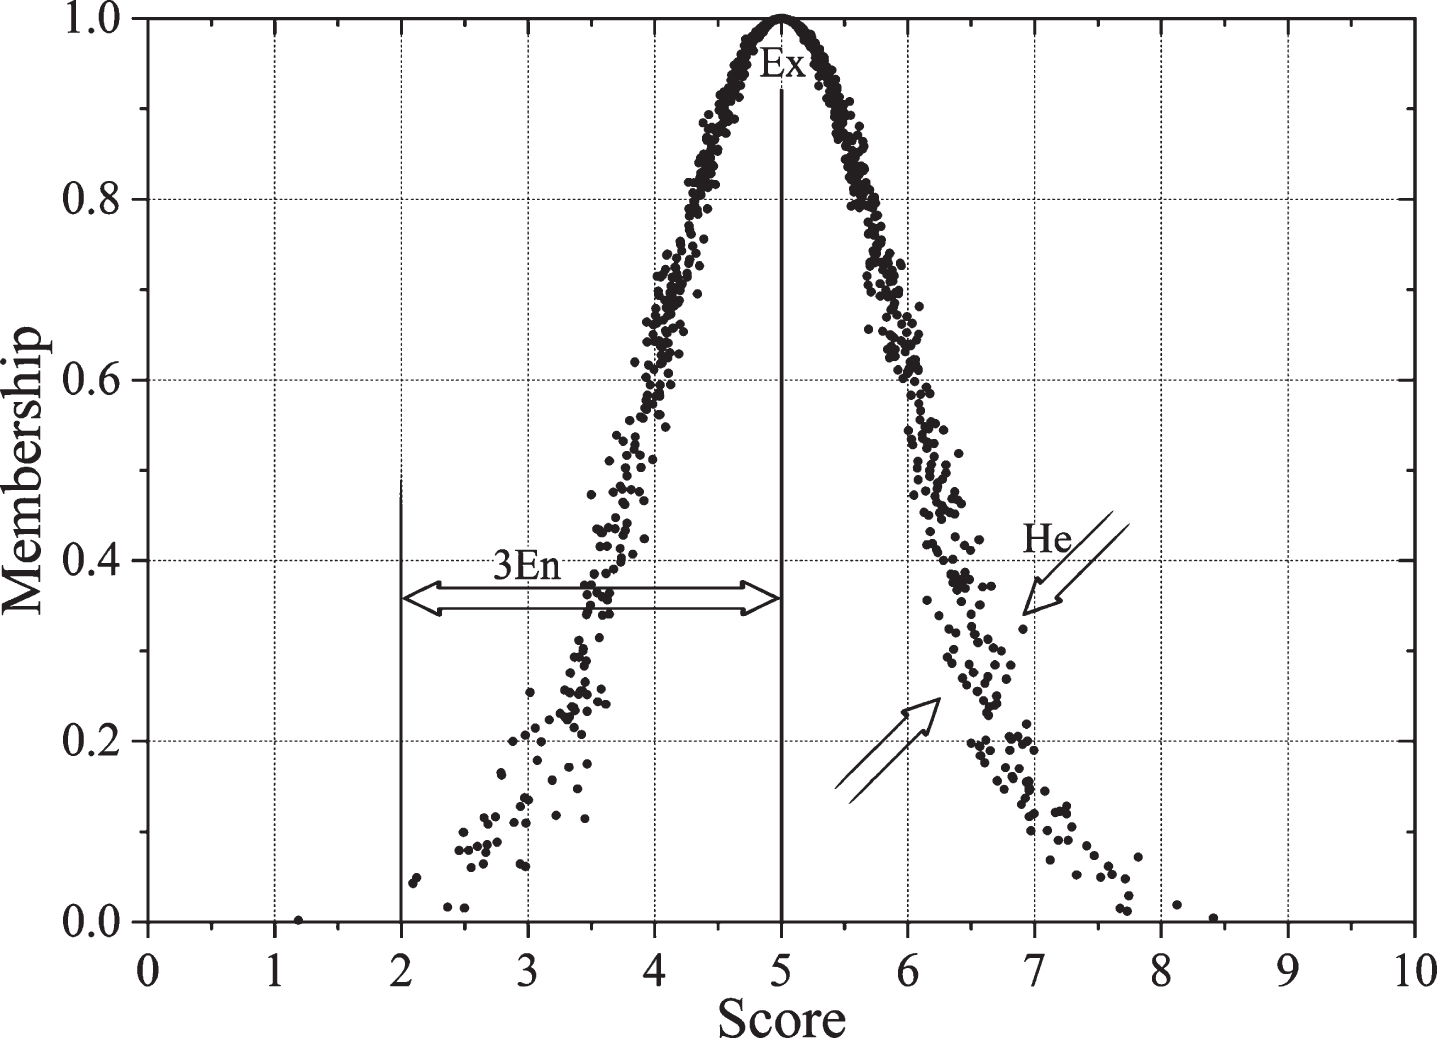
Digital characteristics of the cloud model.
There are two types of cloud generators, forward cloud generator and backward cloud generator [33], which are also called forward cloud and backward cloud. Forward cloud is the process of obtaining the scope and distribution of quantitative data from the qualitative information expressed by the concept according to the digital characteristics (Ex, En, He); while backward cloud is the process of converting a certain amount of accurate data, namely cloud drops, into a qualitative concept represented by digital characteristics [32]. There are many algorithms for the backward cloud. Because it is difficult for subjects to accurately express the membership degree of their scores in the questionnaire, backward cloud algorithms with a certainty degree are less practical [34]. In addition, the hyper-entropy may be an imaginary number during the calculation, which means that the calculation result is invalid. Therefore, the improved backward cloud algorithm without certainty degree used in this study is as follows [34]:
(1) Enter N values of a single factor to find the average value:
(5) If N > 100, remove the 1% value closest to Ex, otherwise remove the one value closest to Ex and go back to step (3);
(1) Fuzzy composite operator
Using fuzzy composite operator to calculate the weight cloud model A and the scoring cloud model B can get the comprehensive evaluation cloud model D [18, 35].
(2) Improved fuzzy composite operator
In the design evaluation, each digital characteristic of the weight cloud model and the scoring cloud model is positive numbers, so the calculation Equation (16) can be simplified to obtain the following formula:
Assume that there are two ways to evaluate product X (Table 3). Let Exy, 1-Exy, Exz and d - Ex z be the expected value of the cloud model, Eny and Enz are the entropy, Hey and Hez are the hyper-entropy, d is the upper limit of the scoring interval. It is easy to know by the definition that d, Exy, Eny, Hey, Exz, Enz and Hez are all positive numbers, and Ex y ⩽ 1, Ex z ⩽ d.
Comparison of two evaluation methods for product X
Let’s set Exz <
The reading lamp is a kind of light that provides the light required to complete the work, study and other reading tasks, which plays an important role in the lives of the general public. Design is an important aspect that determines the quality of reading lamps. However, its rich selection of design elements and flexible combinations make it difficult to design. Therefore, taking reading lamp as an example, a design evaluation is implemented to verify the feasibility and effectiveness of this study.
Get the initial weight of the criterion
Establish the hierarchical structure model of reading lamp design evaluation
Firstly, a focus group consisting of nine experts (four men and five women) with more than two years of design experience was set up to screen the target products and determine evaluation criteria. The experts come from the academic and industrial circles of industrial design, of which 7 are teachers of university industrial design majors, and 2 are full-time designers from design companies. They all have a wealth of practical experience in the field of product design, and have a keen insight into the similarities and differences of products, which can effectively improve the effectiveness and rationality of screening.
Then, 60 kinds of reading lamps on the market were collected via websites, product magazines and brochures. According to their design characteristics, the focus group put forward five criteria for the design evaluation of reading lamps, including form, color, functionality, material and finishing.
After that, based on the visual differences of the reading lamps, the focus group selected nine of them as target products, and then extracted the factors of target products under each criterion. Among the factors, material samples 1 and 2, 3 and 4, 5, 6, 7, 8 and 9 have the same materials respectively, finishing samples 3 and 4, 5, 8 and 9 have the same finishing respectively, except for these, other factors are different. Finally, a hierarchical structure model of reading lamp design evaluation can be established, as shown in Fig. 3.
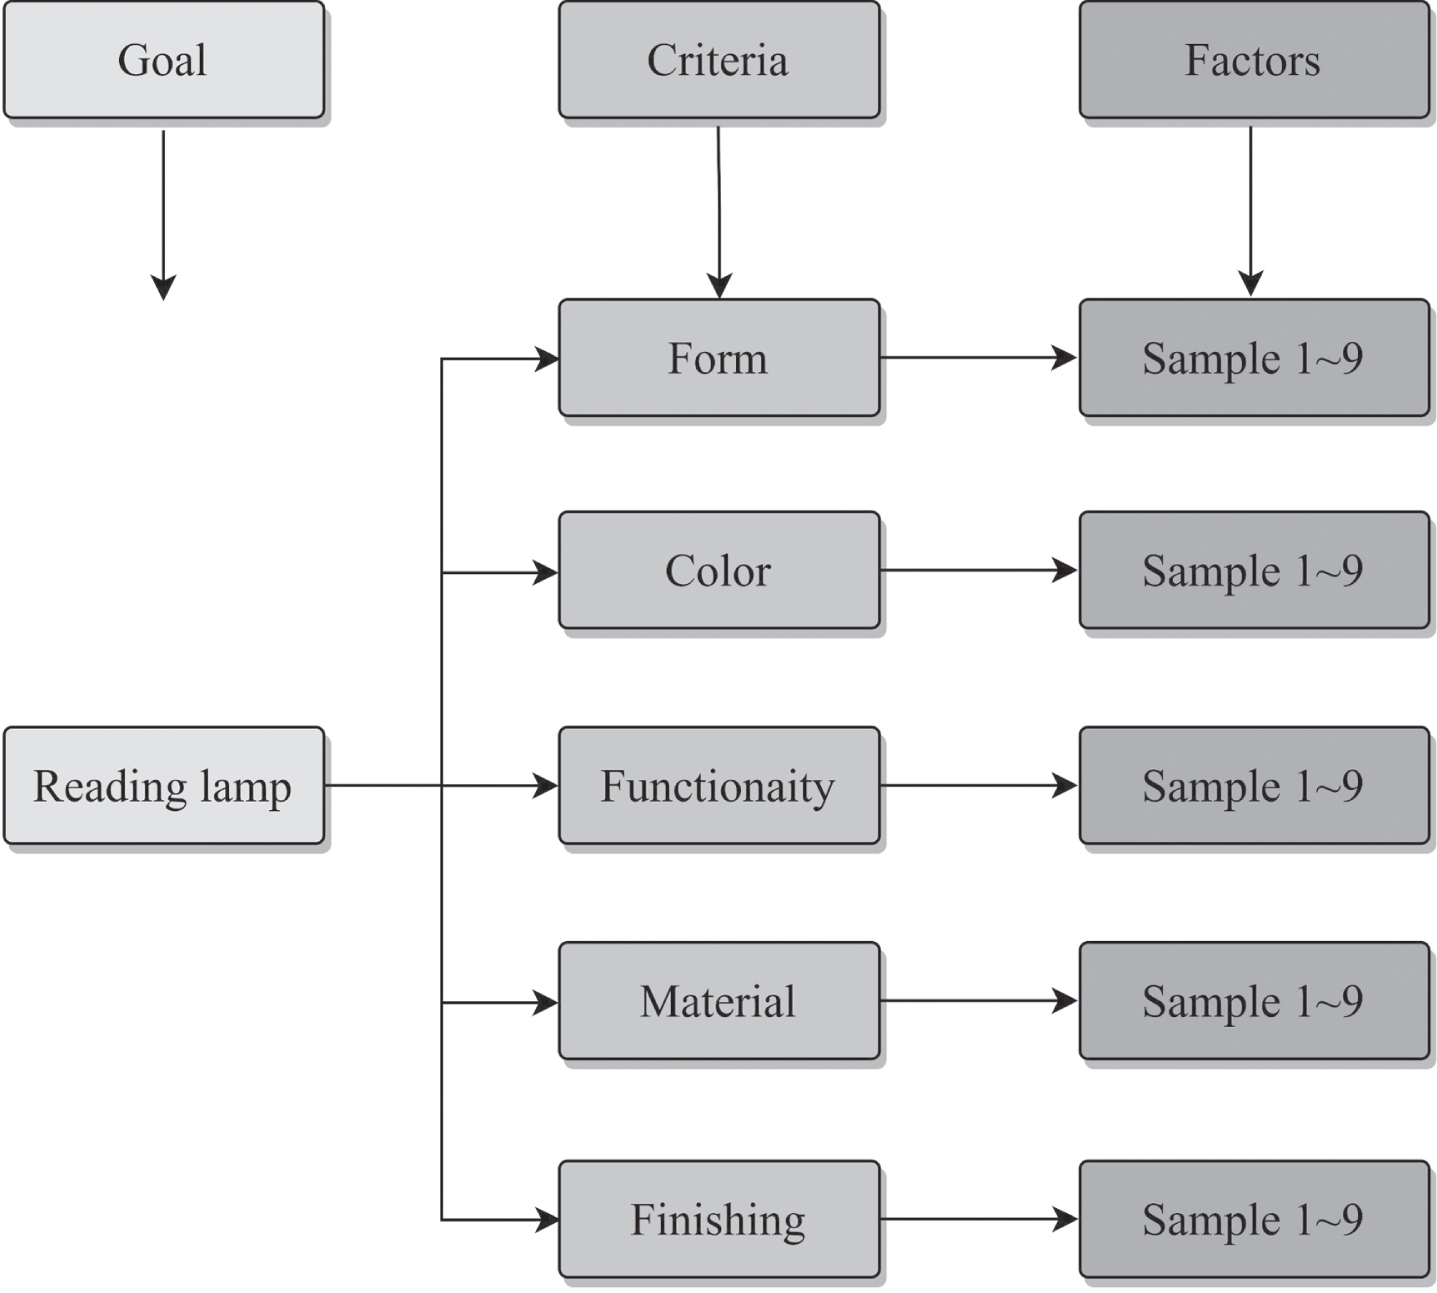
Hierarchical structure model of reading lamp design evaluation.
According to the established hierarchical structure model and target products, a survey questionnaire for design evaluation was made (as shown in Appendix 1). The questionnaire contains two parts: fuzzy pairwise comparison of criteria and scoring survey of various factors. Important information in the questionnaire was highlighted in yellow. The consistency of the first part determines the validity of the questionnaire. In the second part, form samples are shown in gray, and the color, material and finishing are determined based on the characteristics of the main part of the product. Colors are displayed through flat pictures, while the pictures of materials and finishing were all obtained by computer processing the sphere. Besides, functionality refers to additional functions other than lighting which is described uniformly through phrases.
As one of the main consumer groups of reading lamp, college students are suitable subjects for the questionnaire survey. In this study, 40 junior students majoring in industrial design were selected as the subjects to conduct questionnaire survey.
Forty subjects compared the criteria under the design evaluation of reading lamps pair by pair, and made judgments according to the selected corresponding scales. The comparing results were used to construct 40 fuzzy judgment matrices
Initial weight calculation and consistency inspection
The initial weights of the criteria for 40 questionnaires were calculated according to Eq. (1-8). In the calculation, α is taken as 0.5 [29]. Taking
After calculating the initial weights of the criteria, a total of 35 copies of questionnaires passed the test according to the consistency inspection results.
Digital characteristic acquisition of cloud model
After obtaining the initial weights of the criteria corresponding to each of the 35 subjects, the digital characteristics of the weight cloud model were calculated using the backward cloud to better maintain the fuzziness and randomness of the criteria weights (Table 4). To more intuitively reflect the difference between the criteria weights, the forward cloud was used based on MATLAB software to convert the qualitative parameters into quantitative graphical results, so the cloud pictures of weights that can be used for criteria weight ranking was obtained, as shown in Fig. 4.
Digital characteristics of the weight cloud model
Digital characteristics of the weight cloud model

Weight cloud pictures.
By observing the expectations of the spatial distribution of the criteria in Fig. 4. It can be found that functionality is the most important, followed by form. And color, material and finishing are less important. Further observe the span of cloud pictures, there is a trend that the larger the expectation is, the larger the span will be, that is, the stronger the fuzziness is. Finally, by observing the thickness of cloud pictures, we can find that the thickness corresponding to the finishing cloud picture is clearly the largest. This indicates that the finishing randomness is obviously the strongest, while the other cloud pictures show similar small randomness.
According to the 35 questionnaires data obtained, the scoring of each factor used the backward cloud to obtain digital characteristics of the scoring cloud models (Table 5).
Digital characteristics of the scoring cloud model
Based on the results of weight cloud models and scoring cloud models obtained by the above calculation, an improved fuzzy composite operator was used to calculate the digital characteristics of comprehensive evaluation cloud model (Table 6).
Digital characteristics of comprehensive evaluation cloud model
Digital characteristics of comprehensive evaluation cloud model
The forward cloud was adopted to obtain the cloud pictures that can intuitively reflect the design evaluation differences of the target products, as shown in Fig. 5. Comprehensive design evaluation was carried out by observing picture characteristics such as expectation, span and thickness corresponding to quantitative data such as expected value, entropy and hyper-entropy.
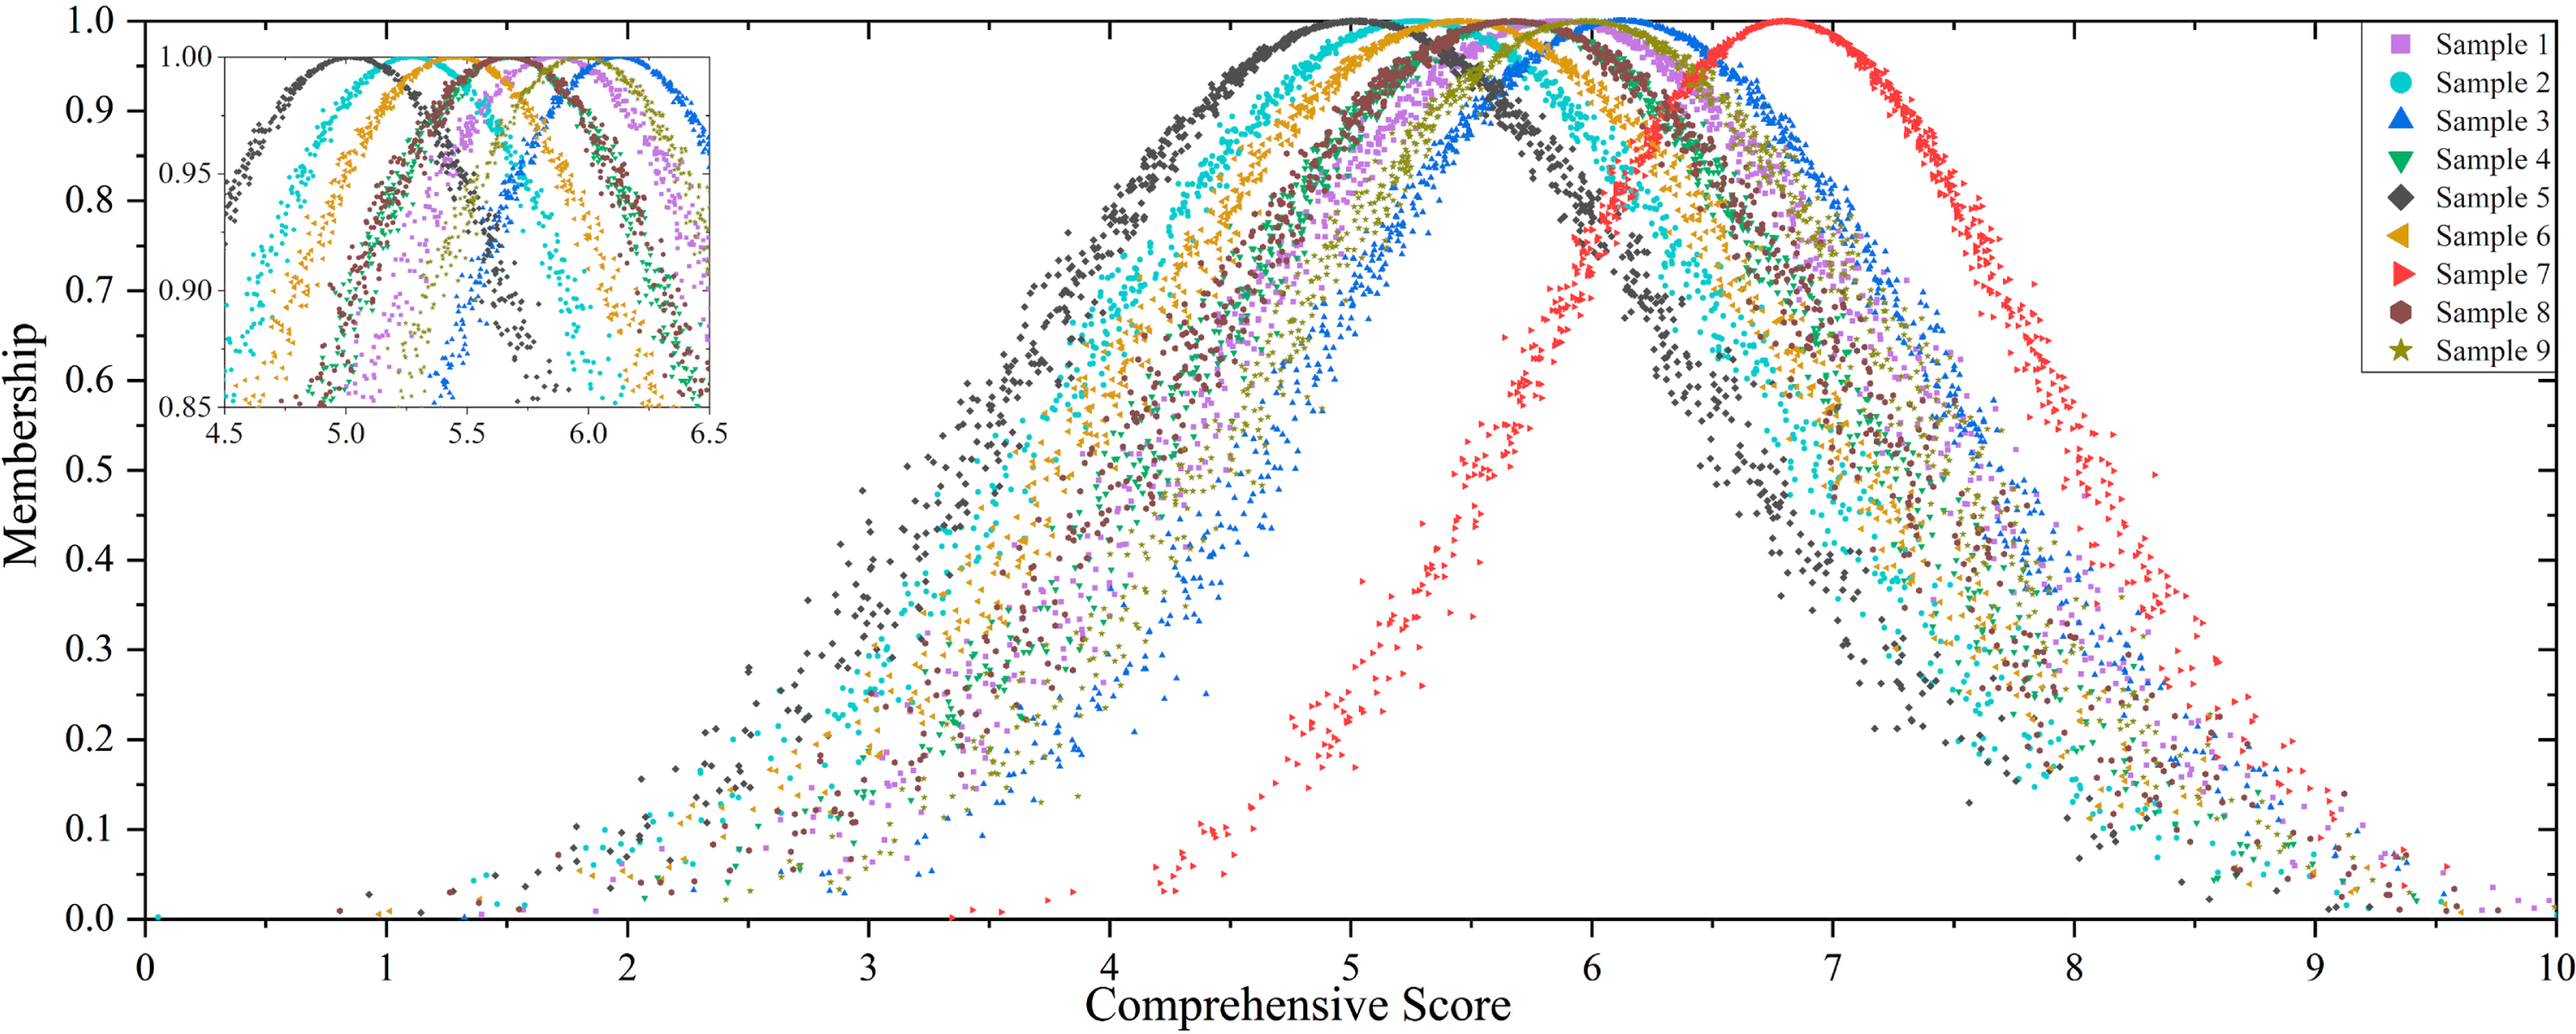
Comprehensive evaluation cloud pictures.
The expectation of sample 7 is obviously the largest, that is, the comprehensive design evaluation result is the best. The expectation of sample 5 is the smallest, so its result is the worst. The expectation differences of other samples are relatively small. According to the span and thickness of the cloud pictures, it can be concluded that the fuzziness and randomness of all samples in the design evaluation are similar. Among them, the span and thickness of sample 7 are both the smallest, indicating that the subjects’ evaluations were the most consistent. Therefore, sample 7 surpasses the other samples in all digital characteristics. It should also be noted that sample 1 has the strongest fuzziness and the second strongest randomness.
The same method as mentioned above was used to generate cloud pictures of factors under each criterion (Figs. 6–10). Further design evaluation is carried out from the perspective of form, color, functionality, material and finishing. The comparison and analysis of the specific differences on their cloud pictures can provide a theoretical basis for the evaluation and optimization of design schemes. The form is the second important criterion, through form cloud pictures (Fig. 6), some meaningful information can be reflected and observed. First, sample 7 (simple) is excellent, since its expectation is second only to sample 3 (harmonious), and its span is the smallest, so its fuzziness is the smallest, although its thickness is relatively large. Second, Fig. 6 shows the cloud pictures near the right are not much different in expectation, while on the left are bigger. In addition, it should be noted that the evaluation expectations of sample 1 (lightweight) and sample 6 (stable) are the same. Since the span of the cloud picture corresponding to sample 6 is smaller than that of sample 1, sample 6 is better. Finally, according to the thickness of the cloud picture, sample 8 (polygonal) has the strongest randomness, and sample 4 (classic) has the smallest randomness.
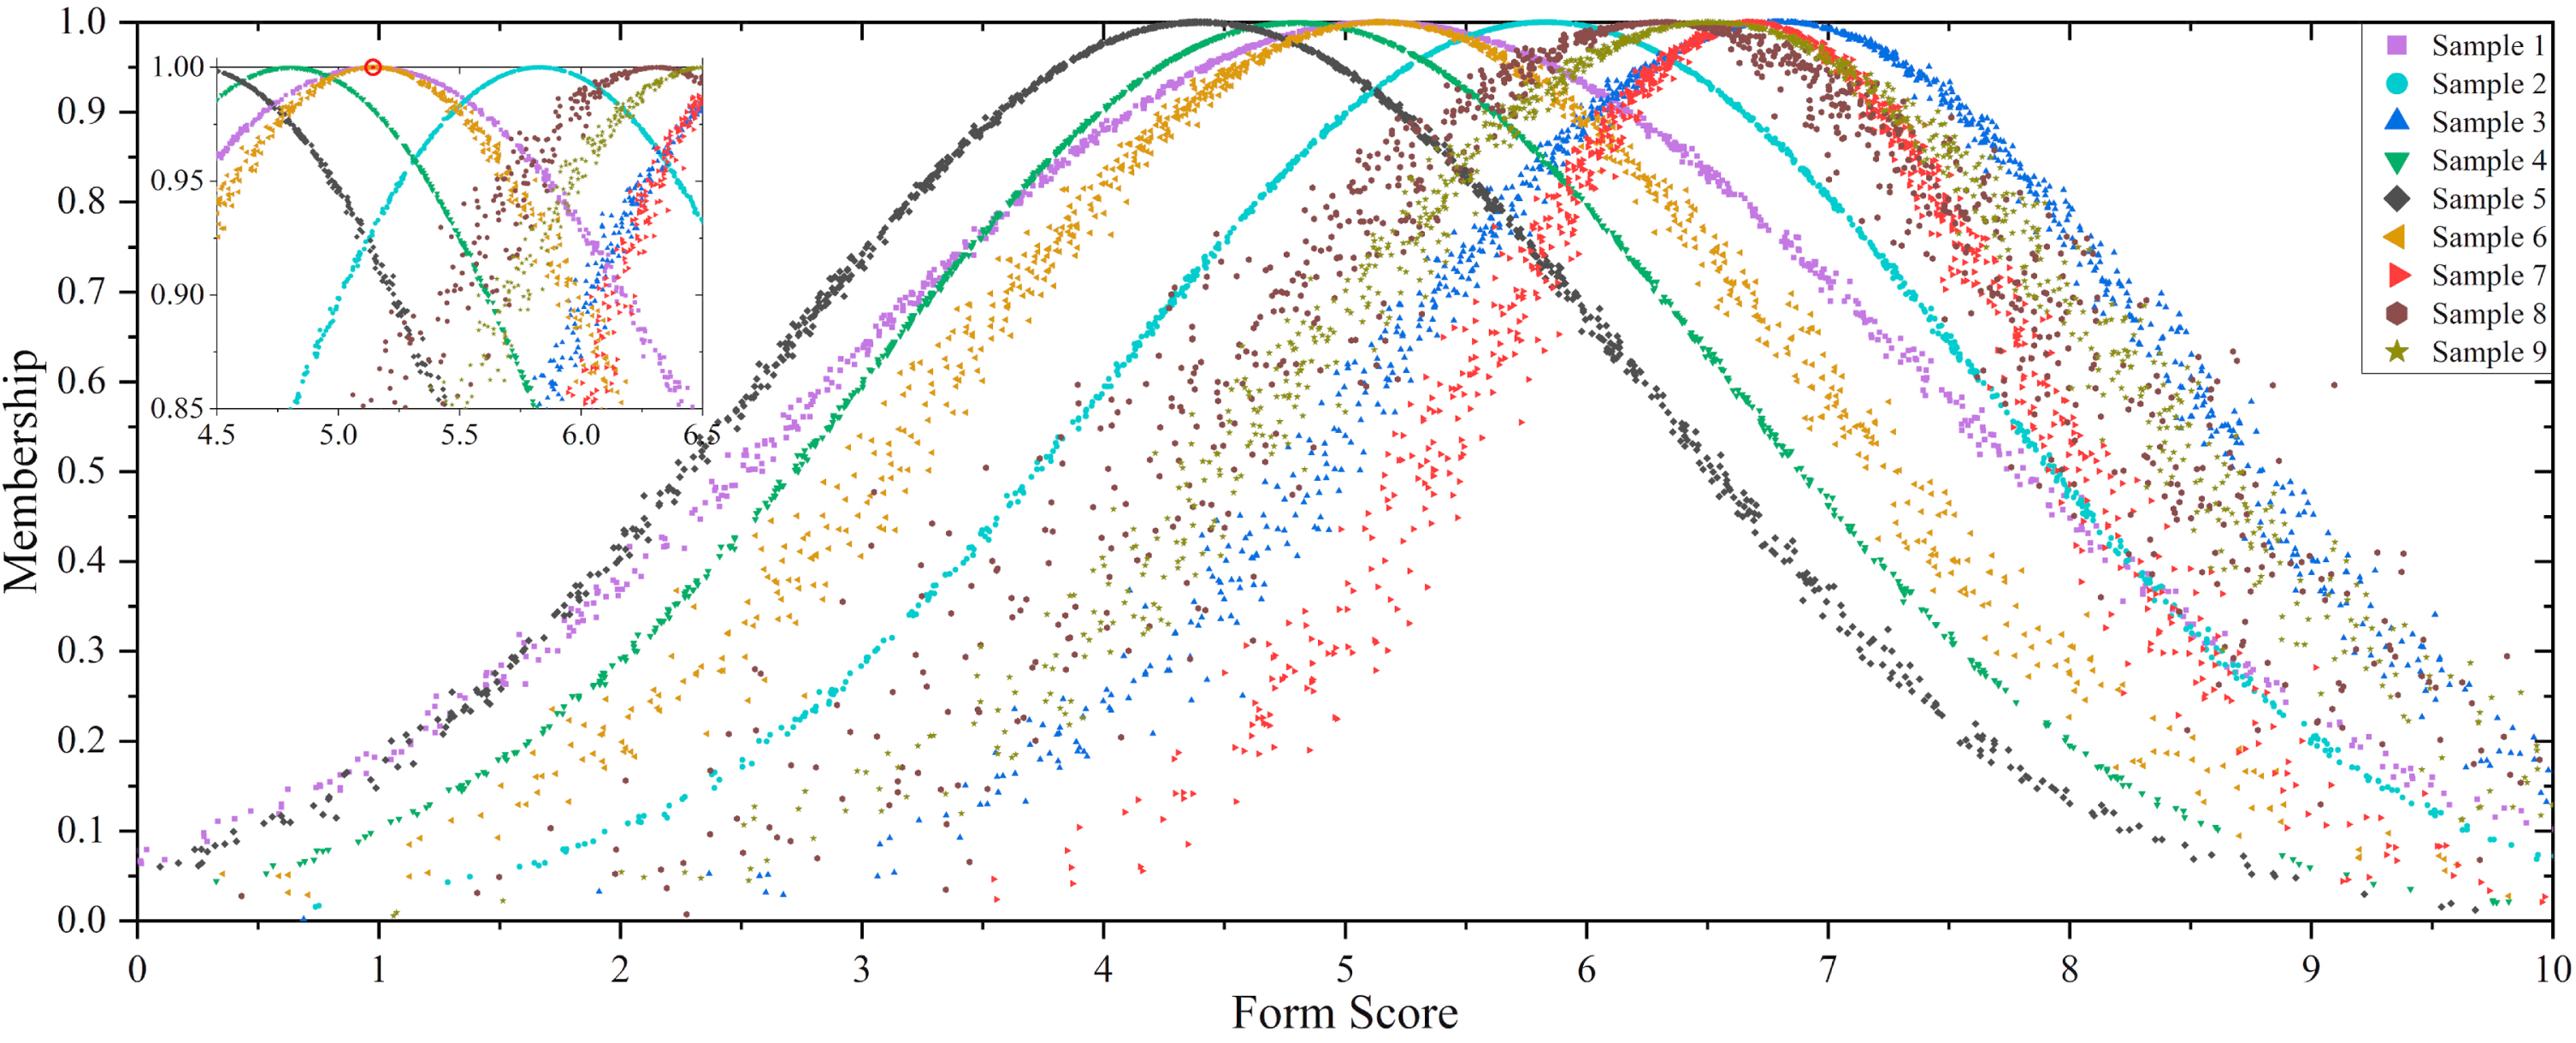
Form cloud pictures.

Color cloud pictures.
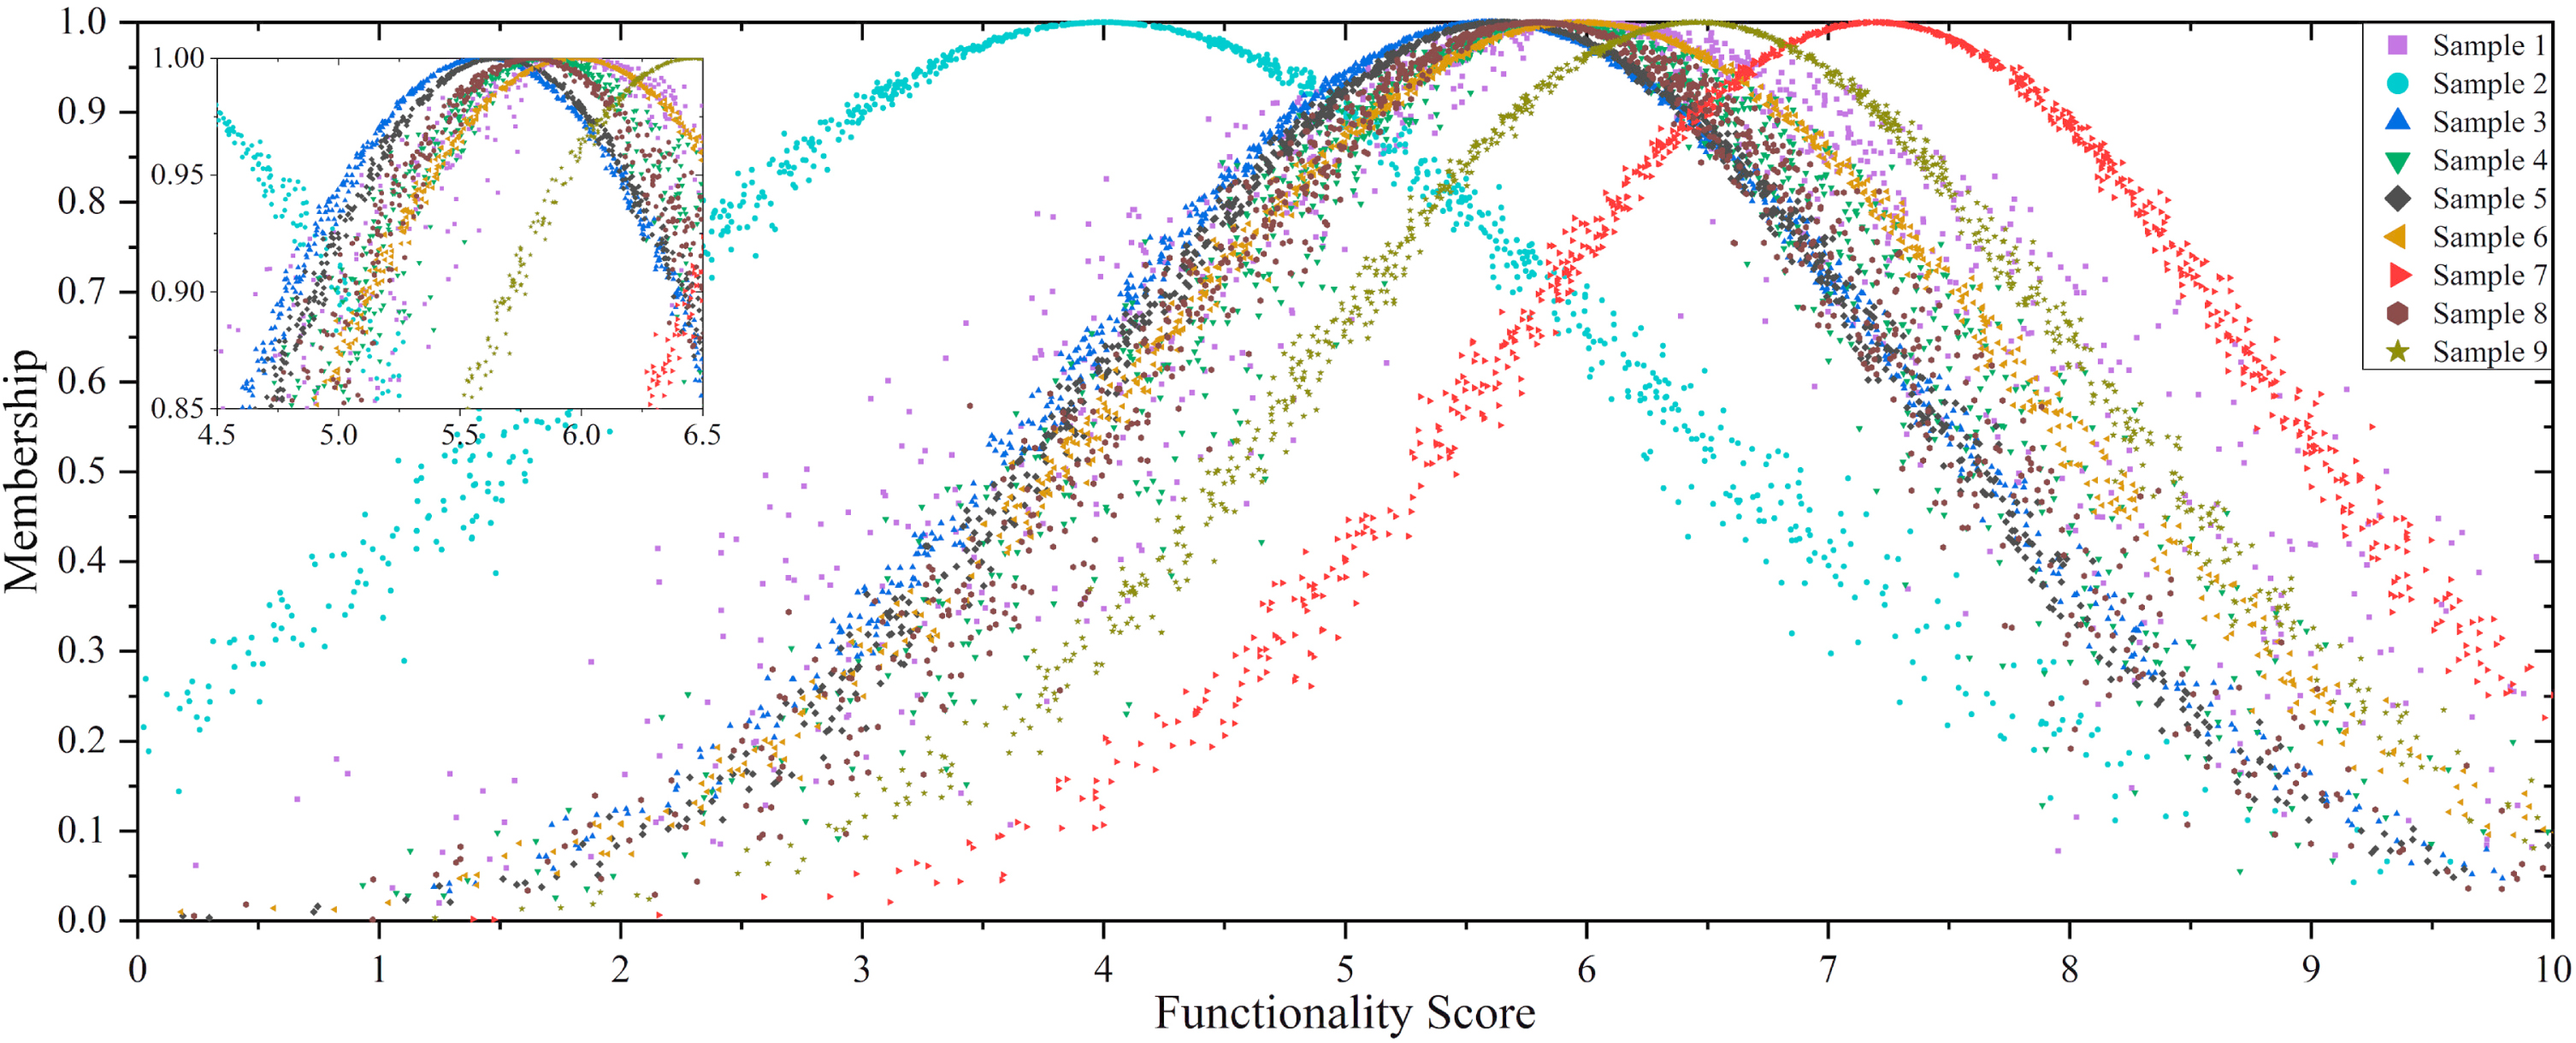
Functionality cloud pictures.

Material cloud pictures.
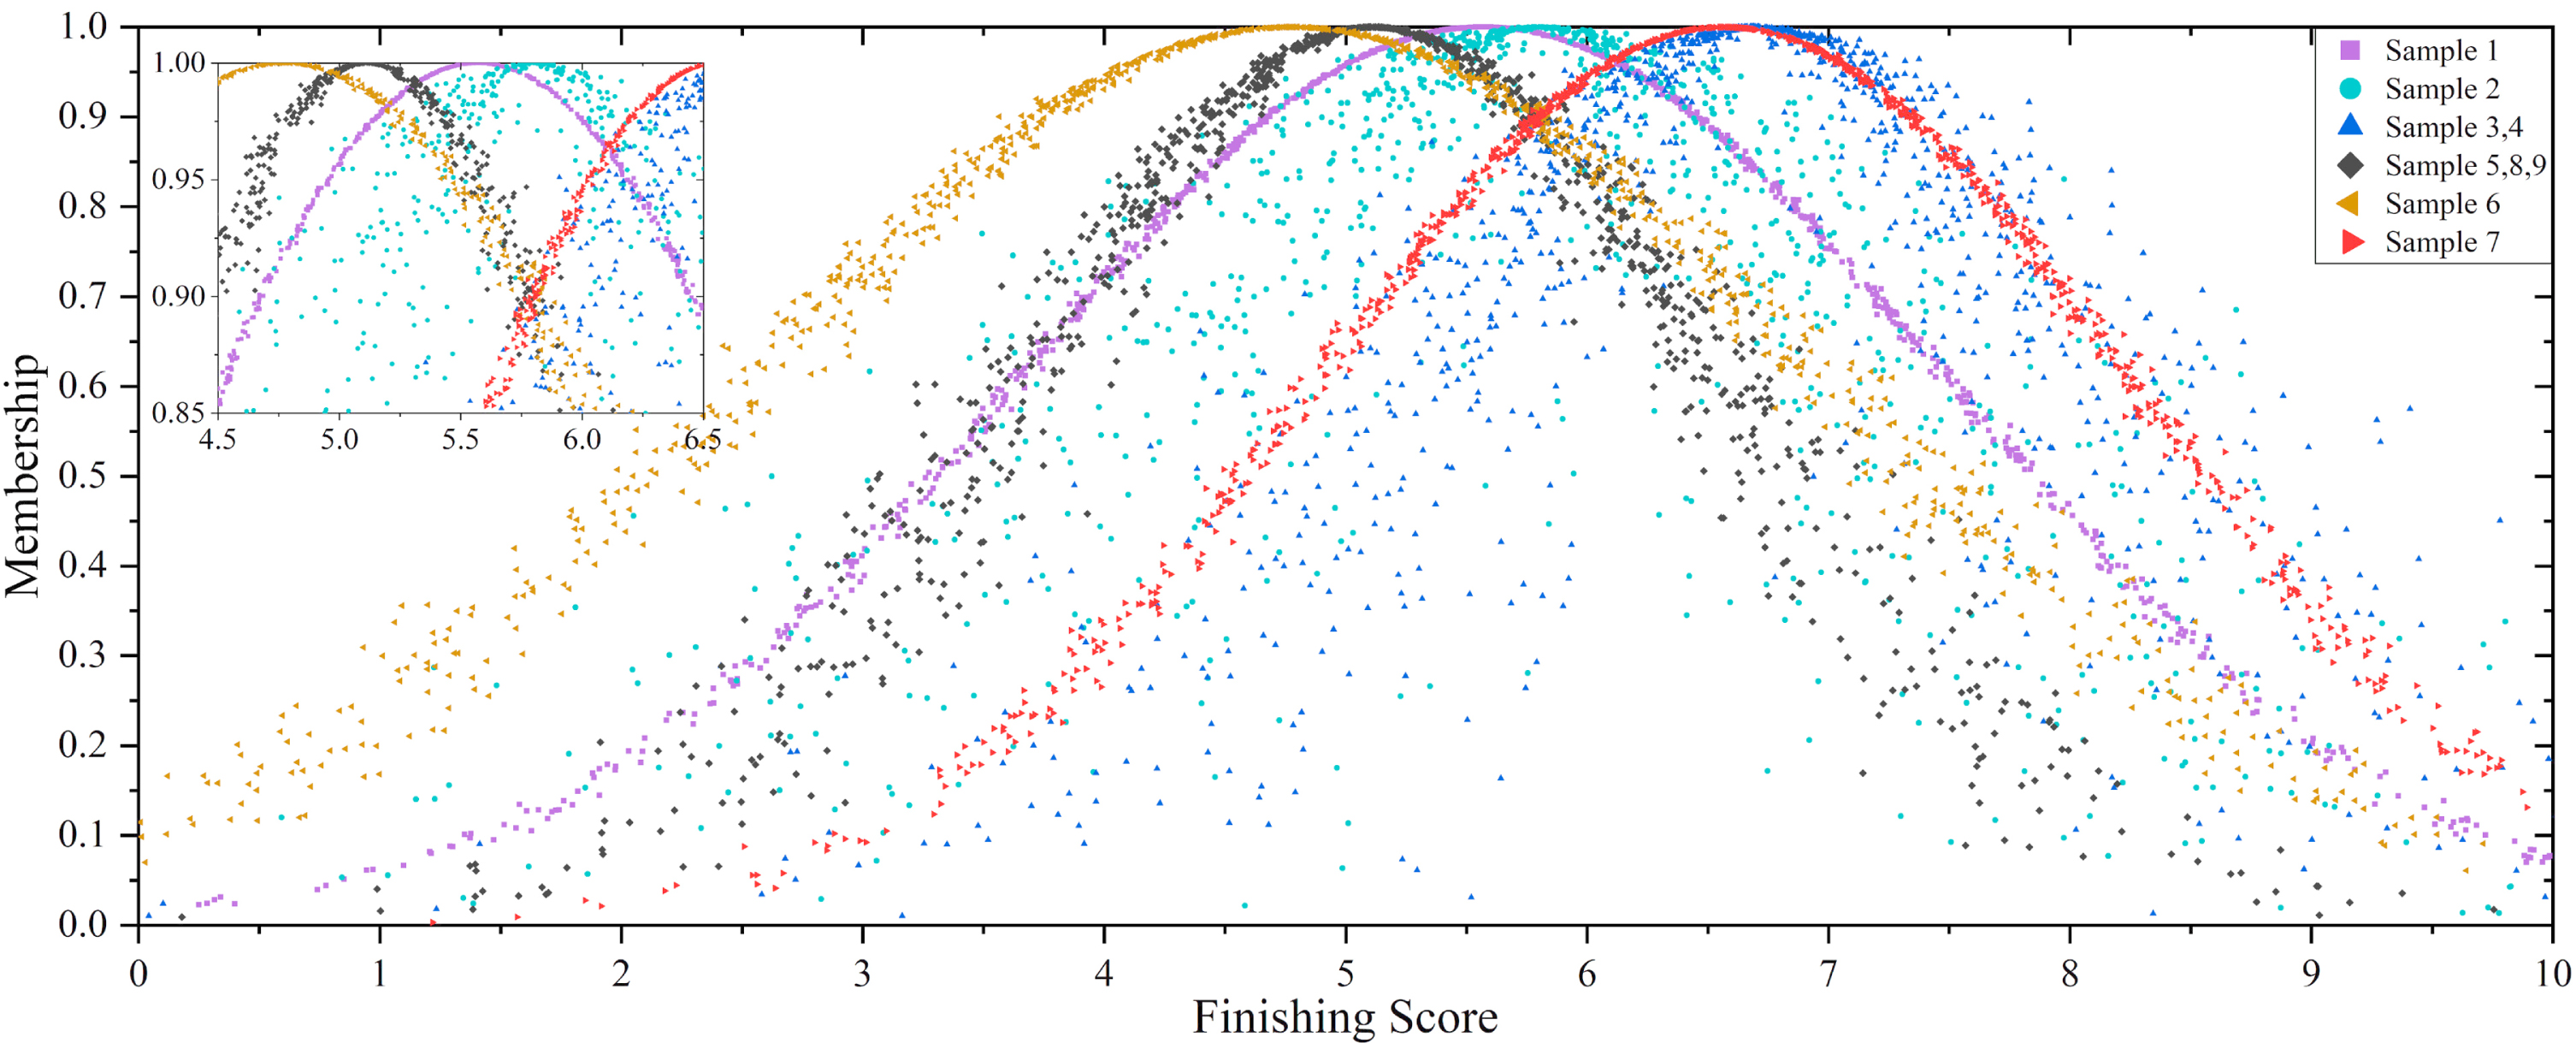
Finishing cloud pictures.
According to the color cloud pictures (Fig. 7), the expectation of sample 7 (white) is obviously larger than the others, so it is known that sample 7 is the most popular among subjects. The cloud picture of sample 7 has the smallest span and the second smallest thickness, so its fuzziness and randomness are very prominent. Except for sample 7, sample 1 (black) also has obvious advantages over other colors in expectation. Sample 5 (blue) has the lowest acceptance because its expectation is the smallest. In terms of cloud picture span and thickness, sample 8 (purple) has the strongest fuzziness, sample 2 (brass-colored) has the strongest randomness, and sample 9 (flesh-colored) has the smallest randomness.
Functionality is the most important criterion in the evaluation of the reading lamp, so the reference meaning from functionality cloud pictures (Fig. 8) is also the greatest. The expectation of sample 7 (foldable, USB interface, socket) is undoubtedly the largest, and the span and thickness of the cloud picture are small. The cloud picture expectation of sample 9 (adjustable lamp head, night light) is also large. Although sample 2 (only lighting) is significantly lower than the other samples, it has a large span in cloud picture, which means that the functionality of sample 2 may be favored by a small number of subjects. Moreover, in terms of expectations, the other samples are very similar. By observing the span and thickness, it is found that sample 2 has the strongest fuzziness, sample 1 (clamp, adjustable lamp pole) has the strongest randomness, and the others are similar.
As shown in material cloud pictures (Fig. 9), the subjects’ preference for samples 1 and 2 (metal) is greater than samples 5,6,7,8 and 9 (plastic) but less than samples 3 and 4 (wood) from the respective of cloud picture expectation. As the most popular material, samples 3 and 4 have the smallest fuzziness and the strongest randomness. Conversely, samples 1 and 2 have the strongest fuzziness and the smallest randomness.
The finishing, as the least important part of subjects’ evaluation, has relatively little reference value. It can be seen from finishing cloud pictures (Fig. 10) that the expectation of sample 7 (matte plastic) is second only to samples 3 and 4 (wood varnish), and their cloud picture spans are similar, while the cloud picture thickness of sample 7 is significantly larger. Sample 6 (water transfer printing) has the smallest expectation and the largest span, so its performance is obviously poor.
Combined with the above analysis, sample 7 is the reading lamp with the best comprehensive design evaluation result. It performs best in color and functionality, and also performs well in form and finishing, but needs to be improved in terms of material. Sample 3 should focus on improving its functionality and color; sample 9 should focus on improving color and material. For sample 1, while the form expectation is small, the fuzziness of form and finishing and the randomness of functionality are relatively strong, so these criteria all need to be improved.
For the decision maker, it is optimal to choose sample 7 for optimization to maximize the benefits. For industrial designers, to get the most optimized design results, design features of harmonious form, white, foldability, USB interface, socket, wood and varnish treatment should be considered to be integrated into the design of the reading lamp while design features of high-tech form, blue, only lighting, plastic and water transfer printing should be properly avoided.
Several representative methods from Table 1 were selected for comparison (Table 7). Two experiments were carried out to illustrate the effectiveness and feasibility of the improved fuzzy composite operator and overall method.
Various evaluation methods based on FAHP and cloud model
Various evaluation methods based on FAHP and cloud model
The first comparative experimental process is shown in Fig. 11. Suppose there is a product Q, for which the evaluation criteria are E and F. The digital characteristics of initial comprehensive evaluation cloud model are Ex Q , En Q and He Q ; the digital characteristics of initial weight cloud models are (Ex E , En E , He E ) and (1 - Ex E , En E , He E ), respectively. The number of cloud drops within a reasonable range obtained by forward cloud computing is N Q . The calculation process of the scoring generation algorithm is as follows. Firstly, a comprehensive scoring and criteria weights are the input data. Secondly, according to the calculation of the expected value in Equation (18), the range of values of the corresponding scores of E and F can be obtained by reverse calculation. Thirdly, within the range of values, a number is randomly chosen as the score of E or F, and the other score can be calculated. Finally repeat the above steps N Q times. The similarity between the obtained results and the initial comprehensive evaluation cloud model can be used to reflect the recovery accuracy of different algorithms.
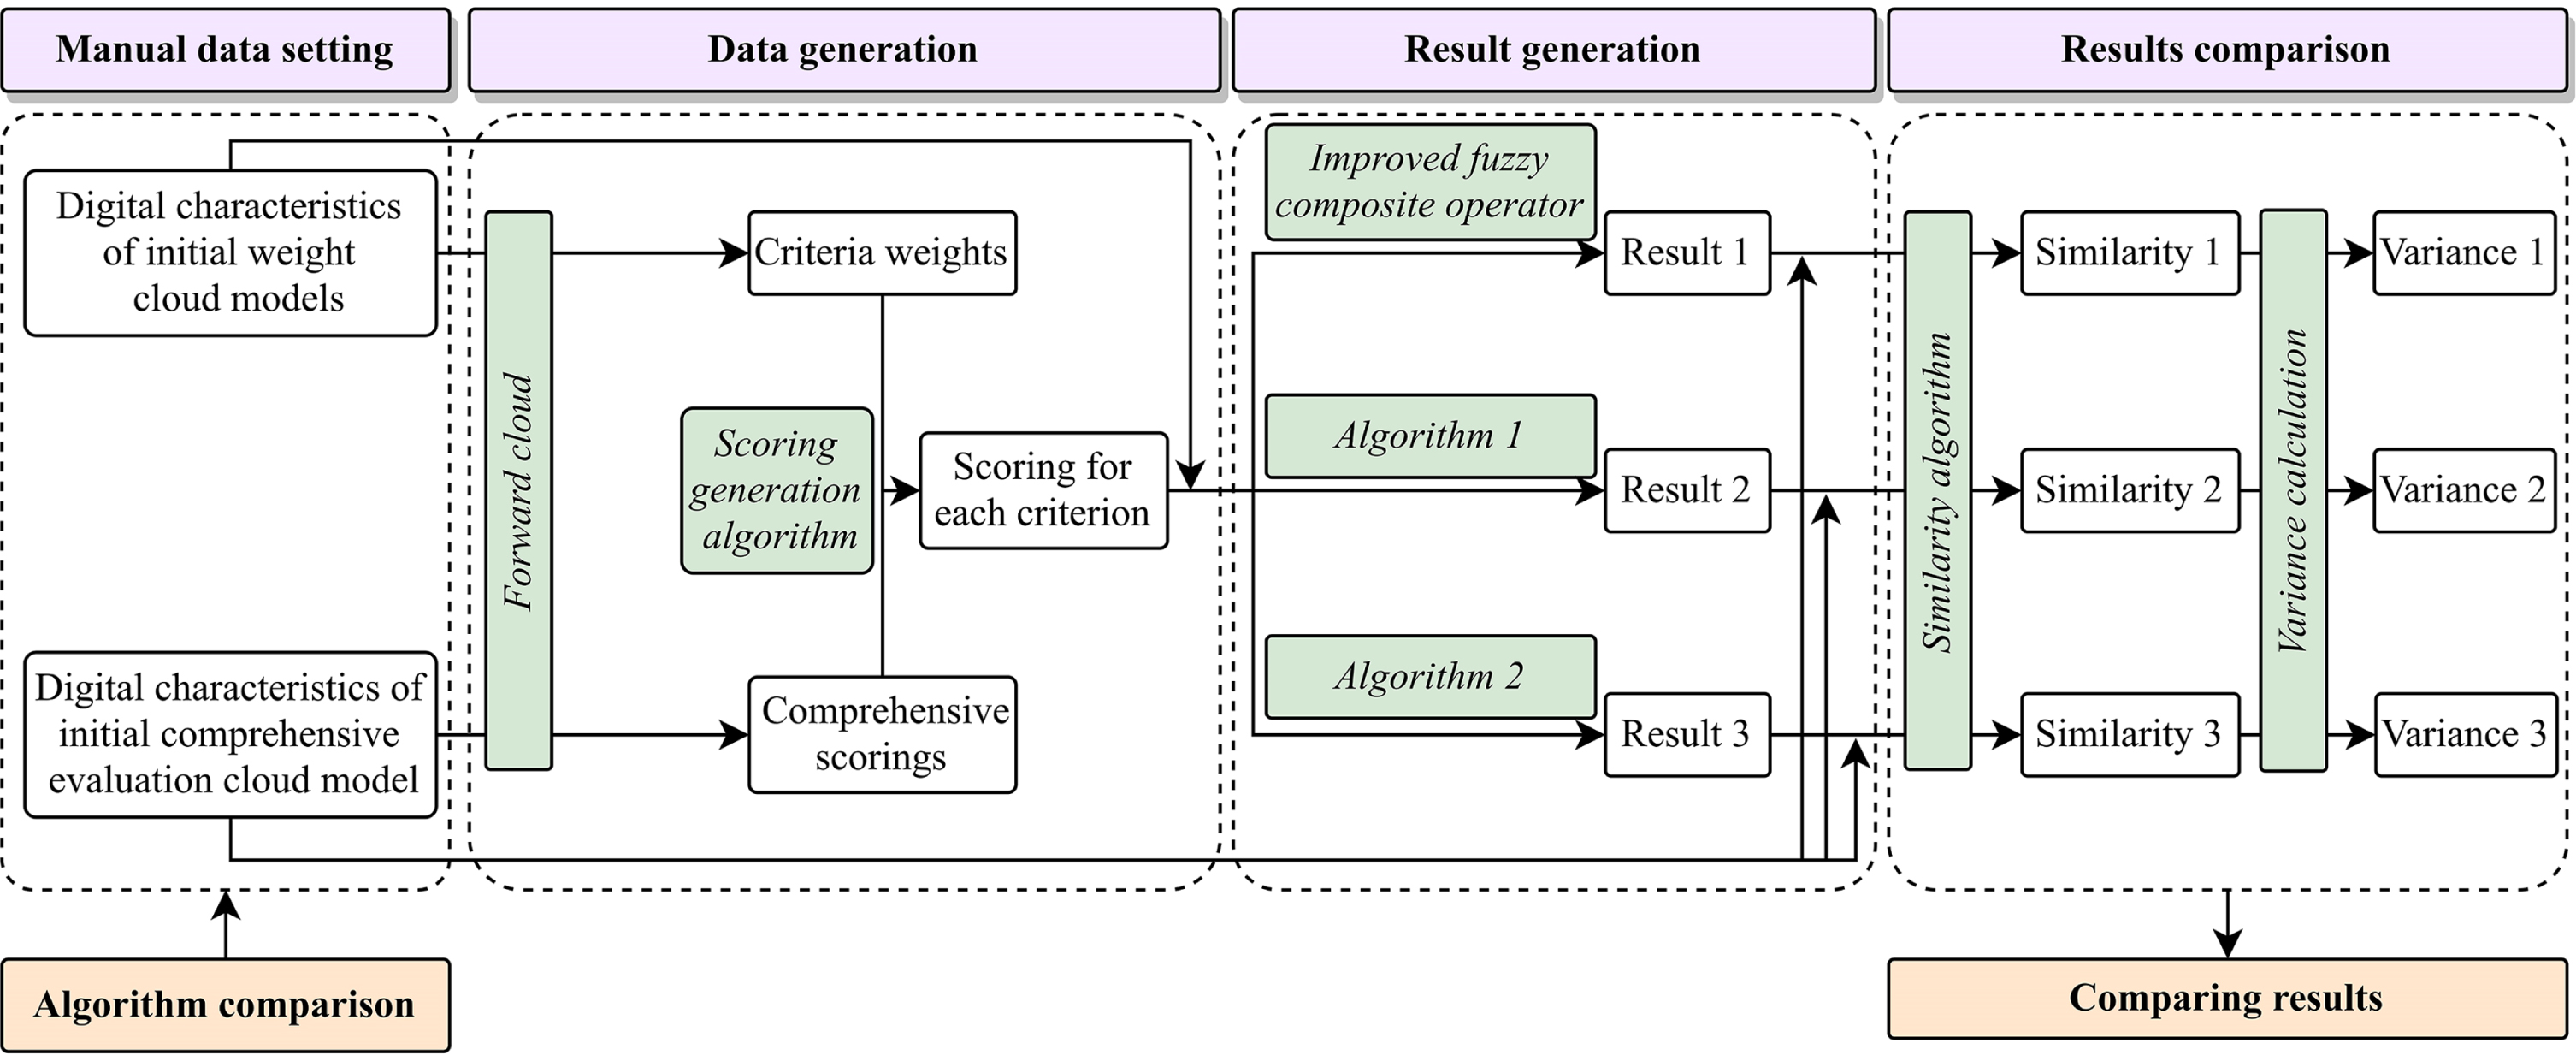
Experimental procedure for algorithm effectiveness comparison.
The input data needs to be set manually. In this study, the scoring range is [0, 10]. To simulate the situation of different scorings and weights, the Ex Q is 1, 3, 5, 7, 9 in order, and the Ex E is 0.1, 0.2, 0.3, 0.4, 0.5 in order. To highlight the effects of entropy and hyper-entropy, the En Q should be set to [Ex Q - 3En Q , Ex Q + 3En Q ] is the maximum in the scoring range, and entropy is all 1/30. Hyper-entropy is unified to one-third of entropy. The number of repeated calculations N Q is 3000. Similarity is calculated using the Expectation based Cloud Model (ECM) algorithm proposed by Li et al [36]. The experimental data is shown in the Table 8, and the similarity comparison of different methods is shown in the Fig. 12.
Evaluation results of different methods
Observing Table 8 and Fig. 12, it can be found that the improved fuzzy composite operator has a significant improvement in similarity compared with the other two algorithms, so it has a clear advantage in the recovery accuracy of the comprehensive evaluation cloud model. Table 8 shows that the improved fuzzy composite operator also has the best performance in terms of computational stability. In summary, the effectiveness and feasibility of the improved fuzzy composite operator has been proved.

Similarity between different methods and standard results.
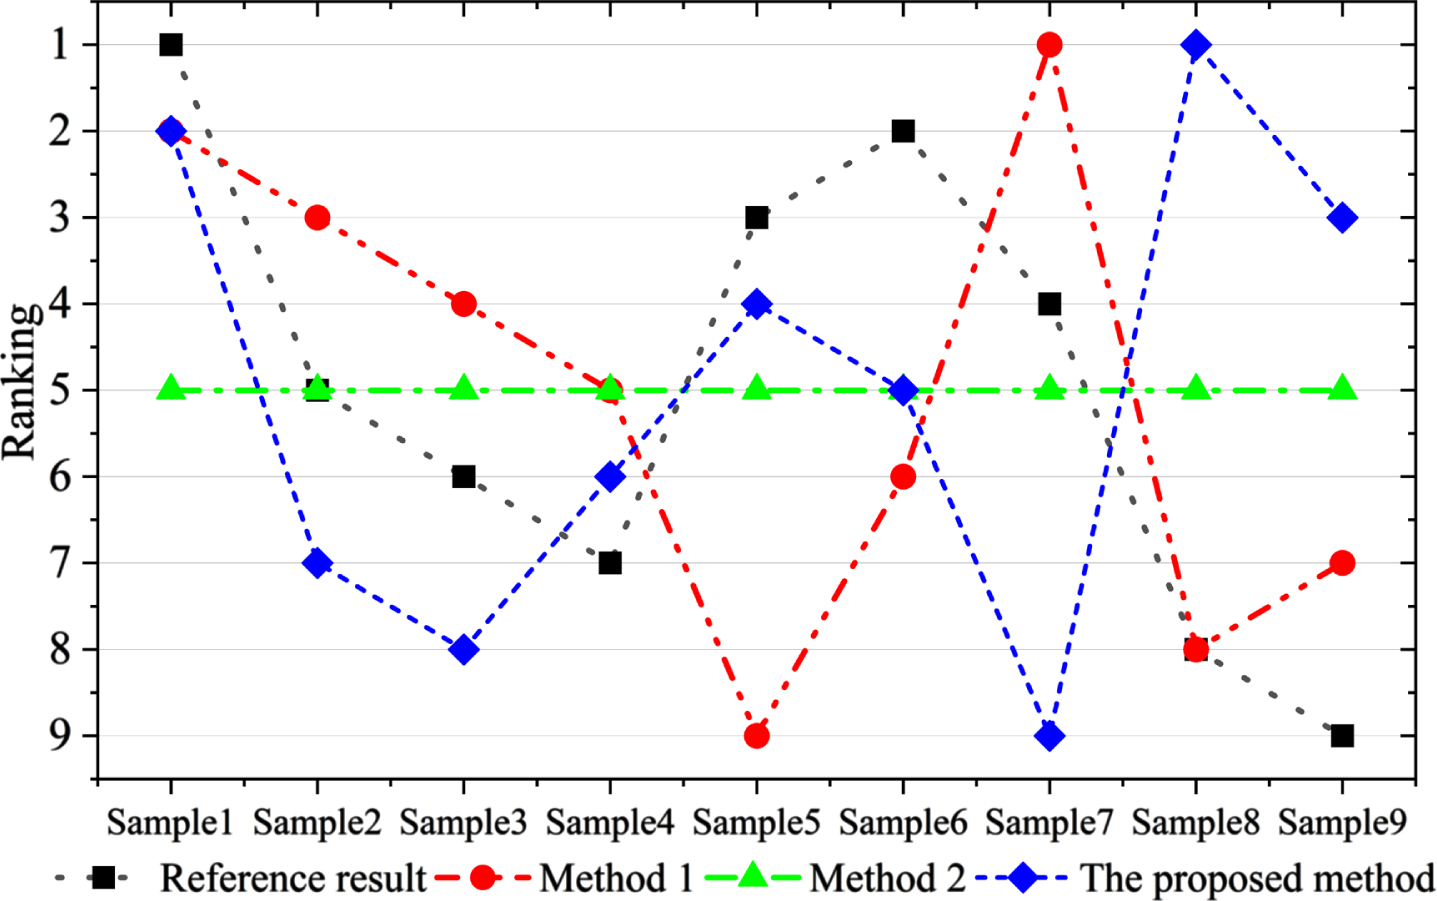
The second comparative experiment mainly compares the calculation results of the ranking accuracy of expected value, entropy and hyper-entropy. To ensure the comparison effect, each method uses the data in this study as input data for calculation. The actual evaluation values of subjects are calculated to get the ranking result, which is used as the reference result when comparing different methods. The digital characteristics are shown in Table 9, and the rankings of expected value, entropy and hyper-entropy are shown in Figs. 13–15. To more accurately reflect the performance of each method in the figure, Kendall rank correlation coefficient is introduced for calculation. The formula is as follows [37]:
Evaluation results of different methods
Where: d
Δ
(
The Kendall rank correlation coefficient of the digital characteristics between each method and the reference result was calculated using Equation (19) as shown in Table 10. The Kendall rank correlation coefficient of expected value calculated by each method is the same as 0.44, which is consistent with the situation in the Fig. 13. To judge the quality of each method, further comparison is needed. Table 9 illustrates that the Kendall rank correlation coefficient of entropy of the proposed method is 0.39, which is larger than the 0.22 and 0.06 of the other two method s, increasing by 0.17 and 0.33 respectively. Although the proposed method is worse than method 1 in terms of hyper-entropy. The priority of entropy is higher than hyper-entropy, so it can be judged that the results of the proposed method are better than other methods.
The Kendall rank correlation coefficient between each method and the reference result

Comparison of expected value rankings of different methods.

Comparison of entropy rankings of different methods.
Comparison of hyper-entropy rankings of different methods.
A novel product design evaluation method based on FAHP and cloud model is proposed, which can fully consider the fuzziness and randomness in subject evaluation.
There are two important contributions of this study. Firstly, a fuzzy weight model which can more fully preserve the fuzziness and randomness of the weight in the calculation is proposed. Secondly, an improved fuzzy composite operator is proposed to solve the problem caused by the large calculation results of entropy and hyper-entropy when the expected value is large, and its reliability has been proved by an experiment.
Taking design evaluation of reading lamps as an example, the cloud models of scorings, weights and comprehensive evaluation and their cloud pictures can be obtained. The results shows that sample 7 is the favorite product design of the subjects and the subjects have a clear preference for design features such as harmonious form, white color, foldability, USB interface, sockets, wood and varnish treatments. A comparative experiment was conducted, and the Kendall rank correlation coefficients of entropy for the proposed method increased by 0.17 and 0.33, respectively, compared to the other two methods. The results verify the feasibility and effectiveness of the proposed method, and provide a theoretical basis for evaluation and optimization by decision makers and industrial designers.
There are still some limitations in this study, which are reflected in the lack of analysis of the coupling relationship between different criteria in the weight calculation and the method of obtaining evaluation data is still limited to the questionnaire survey. Therefore, to obtain the evaluation results containing more comprehensive and accurate information, the weight calculation method that can mine the coupling relationship between different criteria and the design evaluation method that oriented to user online-review data will be considered in the follow-up research.
Footnotes
Appendix
#1. Questionnaire
Please compare the criteria in pairs, tick (✓) to get the value.
1, 3, 5, 7 and 9 respectively represent equal impportance, low dominance, high dominance, very high dominance and absolute dominance, the intermediate values are 2, 4, 6, and 8.
Tick it close to that side, it’s more important there.
Comparison of from color, functionality, material and finishing of reading lamp design.
The range is 0-10, 0 is very dissatisfied, and 10 is very like.
Acknowledgments
This work is supported by the first batch of new liberal arts research and Reform practice projects of the Ministry of Education of China (Grant NO. 2021160038) and 2020 College Students Innovation and Entrepreneurship Training Program of Nanchang University (Grant NO. 2020CX304, S202010403014). We thank the editors and anonymous reviewers for their valuable comments and suggestions. Furthermore, we thank all test subjects for their participation and assistance in the experimental study.