
Abstract
In the medical area, the detection of invasive ductal carcinoma is the most common sub-type of all breast cancers; about 80% of all breast cancers are invasive ductal carcinomas. Detection of this type of cancer shows a great challenge for specialist doctors since the digital images of the sample must be analyzed by sections because the spatial dimensions of this kind of image are above 50k × 50k pixels; doing this operation manually takes long time to determine if the patient suffers this type of cancer. Time is essential for the patient because this cancer can invade quickly other parts of the body. Its name reaffirms this characteristic, with the term "invasive" forming part of its name. With the purpose of solving this task, we propose an automatic methodology consisting in improving the performance of a convolutional neural network that classifies images containing invasive ductal carcinoma cells by highlighting cancer cells using several preprocessing methods such as histogram stretching and contrast enhancement. In this way, characteristics of the sub-images are extracted from the panoramic sample and it is possible to learn to classify them in a better way.
Keywords
Introduction
Invasive Ductal Carcinoma (IDC) is the most common sub-type of all breast cancers; about 80% of all breast cancers are invasive ductal carcinomas [1]; this cancer is the one that has claimed most lives around the world [2–5]. Invasive ductal carcinomas breast cancer detection is a common challenging task because pathologist inspects large benign region to finally define the IDC [6]. To assign a degree of aggressiveness to a complete montage sample, pathologists focus on the regions that contain the IDC. One of the common preprocessing steps for automatic aggressiveness classification is to delineate the exact regions of the IDC within a complete mounting sample. This work begins in the cells that line the milk duct in the breast. From this point on, cancer invades the duct wall, grows into nearby breast tissues, and can spread to metastasize to other parts of the body through the lymphatic system and the bloodstream. The term Carcinoma refers to any cancer that originates in the skin or in other tissues that line internal organs, such as breast tissue. Invasive means that cancer has “invade or spread” into the surrounding breast tissues. Ductal means that cancer started in the milk ducts, which are the “ pipes ” that carry milk from the milk-producing lobules to the nipple as shown in Fig. 1 (a). Collectively Invasive Ductal Carcinoma refers to cancer that has crossed the wall of the milk duct and has begun to invade the tissues of the breast. Figure 1 (b) shows a close-up of the cells found within the milk ducts. Over time, invasive ductal carcinoma can spread to the lymph nodes and possibly other areas of the body. To do so the oncologist obtains digital images from cell samples obtained through a biopsy, of patients diagnosed with cancer or patients waiting for a previous diagnostic. Normally, these digital images are of high spatial resolution due to the acquisition methods, with sizes in the order of 50,000 × 50,000 pixels.

Normal breast with invasive ductal carcinoma, a) Breast profile, b) Enlargement of the milk duct. Image taken from breastcancer.org1.
These images need to be analyzed in small parts to find which cells containing cancer; the common process consists of manually divide the whole sample into small images and explore them. In this work, we propose an automatic methodology consisting of applying preprocessing methods in these small sections by using histogram stretching and contrast enhancement; the purpose is to facilitate the requirements of a classifier by highlighting the cells contained in the images; in this case, the classifier is a Convolutional Neural Network (CNN).
The content of this work is divided as follows: Section 2 the related works are shown, Section 3 describes the methodology employed in this work, Section 4 shows the results obtained, and finally, Section 5 presents the conclusions of the paper.
The classification of histopathological samples as digital images using CNNs has been worked in recent years, but previous works have shown that these samples need to be preprocessed due to their deficient quality. One of the first works that solved this task was developed by Cires et al. [7], who used a CNN to classify mitosis; they observed that in some cases the nucleus of the cell is separated into two parts, one blue and one dark, both of them counting as single mitosis. They used a simple preprocessing method, which means that the training images were used as they are in RGB format. Spanhol et al. [8] used a support vector machine with its dataset, to classify these images. The samples were with different magnifications of the original sample; their dataset [9] contained 2,480 benign samples and 5,429 malignant carcinoma samples. Araujo et al. [10] classify the biopsies obtained from the breast into four classes, namely, normal tissue, benign lesion, carcinoma in situ, and invasive carcinoma, and later they were finally classified again into 2 classes: carcinoma and non-carcinoma (malignant and benign). They used their dataset and histogram stretching as preprocessing methods; also they proposed their own CNN model. Cruz-Roa et al. [11] proposed a change in color space from RGB to YUV; additionally, they proposed a three-layer CNN architecture to classify those images in YUV color space.
These works have shown good results in this task, but the main problem with them is that they focus on the preprocessing of the image instead of focusing on the classification of their images. For that reason, we propose the use of a state-of-the-art CNN that has shown its classification capabilities [12–14].
Proposed methodology
In this section we describe the methodology that solves the proposed task. First we focus on the preprocessing methods used to enhance the digital images of the histopathological samples and highlight the cells that will be analyzed by our classifier; then, we describe the proposed CNN that will be trained with the different images obtained from these preprocessing methods.
Dataset
We use in this work the Breast-Histopathology-Images database 2 . It consists of 162 images from patient cells or tissues obtained from a tumor. The images in the dataset are 73,091 × 62,821 pixels in size. The complete sample does not give us an exact classification of cancer or no cancer; the use of images with such size would make it extremely difficult to train a CNN due to the excessive time and memory requirements. Therefore, we estimate that learning would not be as accurate and efficient. For this reason, the author of the dataset decided to divide the full image into sub-images; these sub-images show a section of the full sample in which they can detect cells with cancer. This provides advantages in training time, additionally allowing us also to have a greater number of training and test images. The selected size of the sub-images is 50 x 50, thus, approximately 1,400 subimages belong to the same full image; these images are divided into two classes: 0 representing no cancer and 1 represents cancer. Most of the time the obtained sub-image sample loses quality when performing this operation 3 . Examples of a sectioned sample are shown in Fig. 2. This means that subimages must be preprocessed before using as valid data for our purposes.
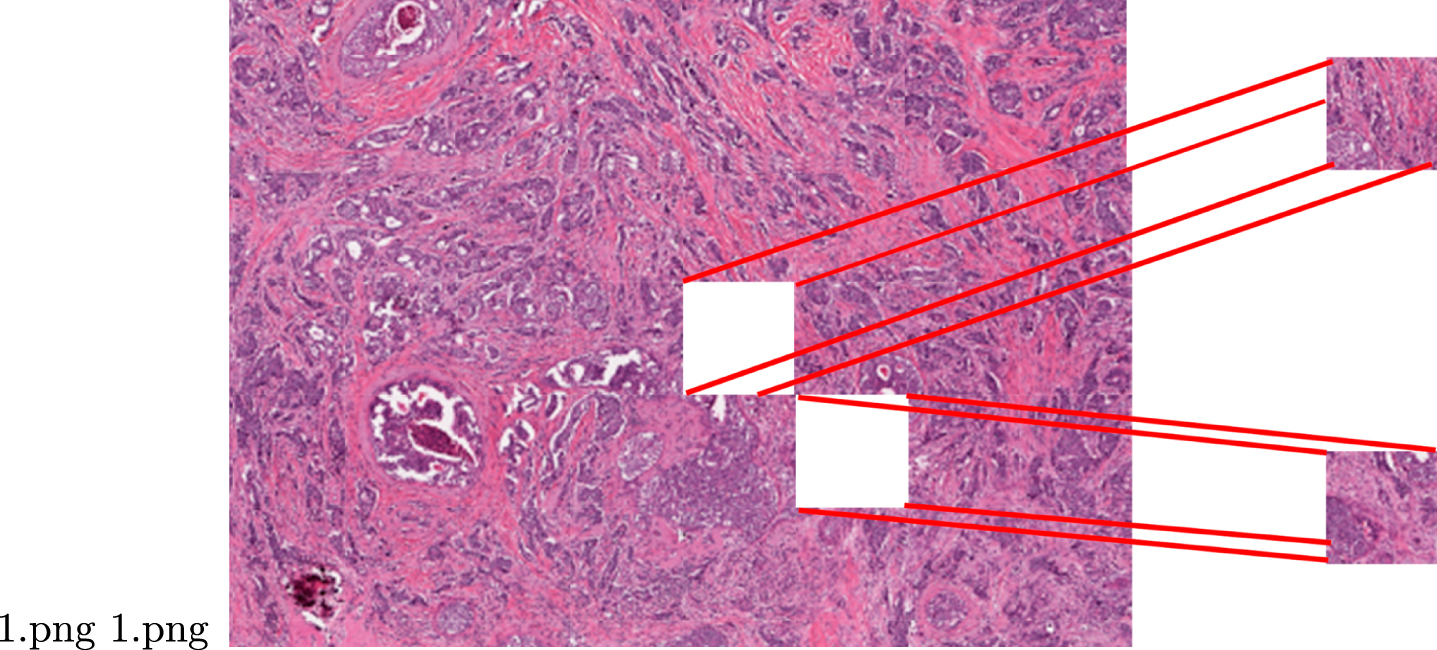
Subimages obtained by sectioning the sample.
To obtain the advance of IDC in a full sample, first, we must classify all the subimages and obtain a percentage of advance in the sample.
The main objective of this work consists of classifying Ductal Carcinoma from histopathological samples. Since the images could lose contrast quality in the process of digitization, we aimed to highlight cancer cells through the use of some preprocessing techniques. To improve the quality of the subimages and obtain a greater quantity of these required by the application, we will use two ways of enhancement and a "natural" way of doubling the number of subimages.
Sharpness enhancement
Sharpness enhancement is a digital image processing technique used to highlight or emphasize texture or small details contained in images. This process is carried out by the well-known Unsharp Masking operation detailed mathematically in Eq. 1.
where I o (x, y) and I p (x, y) are the values of picture elements (x, y) in the original and processed images, respectively, I m is the blurred (masked) version of the original image, while A is a weighting factor greater than 1 [15].
Histogram stretching is a simple contrast enhancement technique for an image that “stretches” the range of intensity values it contains, until it occupies the full dynamic range (between 0 and 255); it is calculated by Equation 2.
where f (x, y) denotes the value of each pixel luminance in the original image and g (x, y) are the new pixel values in the enhanced image [16]; fmax and fmin denotes the original maximum and minimum intensity values on the image.
Many of the obtained subimages, due to problems that occurred during their capture or product of the edges of the organs from which they were taken, there may not be analyzable tissue. These images should be discarded to increase the efficiency and quality of the results. To eliminate these useless images that do not add anything to the quality of the classification, we excluded these images automatically. This was achieved by considering those images that had a weighted average of their pixel levels above a value that we determined empirically. This way we guarantee that we would use only useful subimages in both the training and test stages.
As we are using a supervised algorithm, it is needed a high number of examples for training and we are eliminating useless images we need to use data augmentation to increase the amount of data by adding slightly modified copies of already existing subimages or newly created synthetic ones from existing data; in this case, we used the mirror operation: it is done by reversing the row pixels horizontally. For instance, for a horizontal mirror, the pixel positions located at coordinates (x, y) will be situated at coordinate (- x - 1, y) in the new sub-image. In this work, we used the previous preprocessing techniques to enhance or obtain better images to be fed in the selected CNN model. Figure 3 shows graphically, the effects of the preprocessing enhancing algorithms in five different subimages arbitrarily selected.
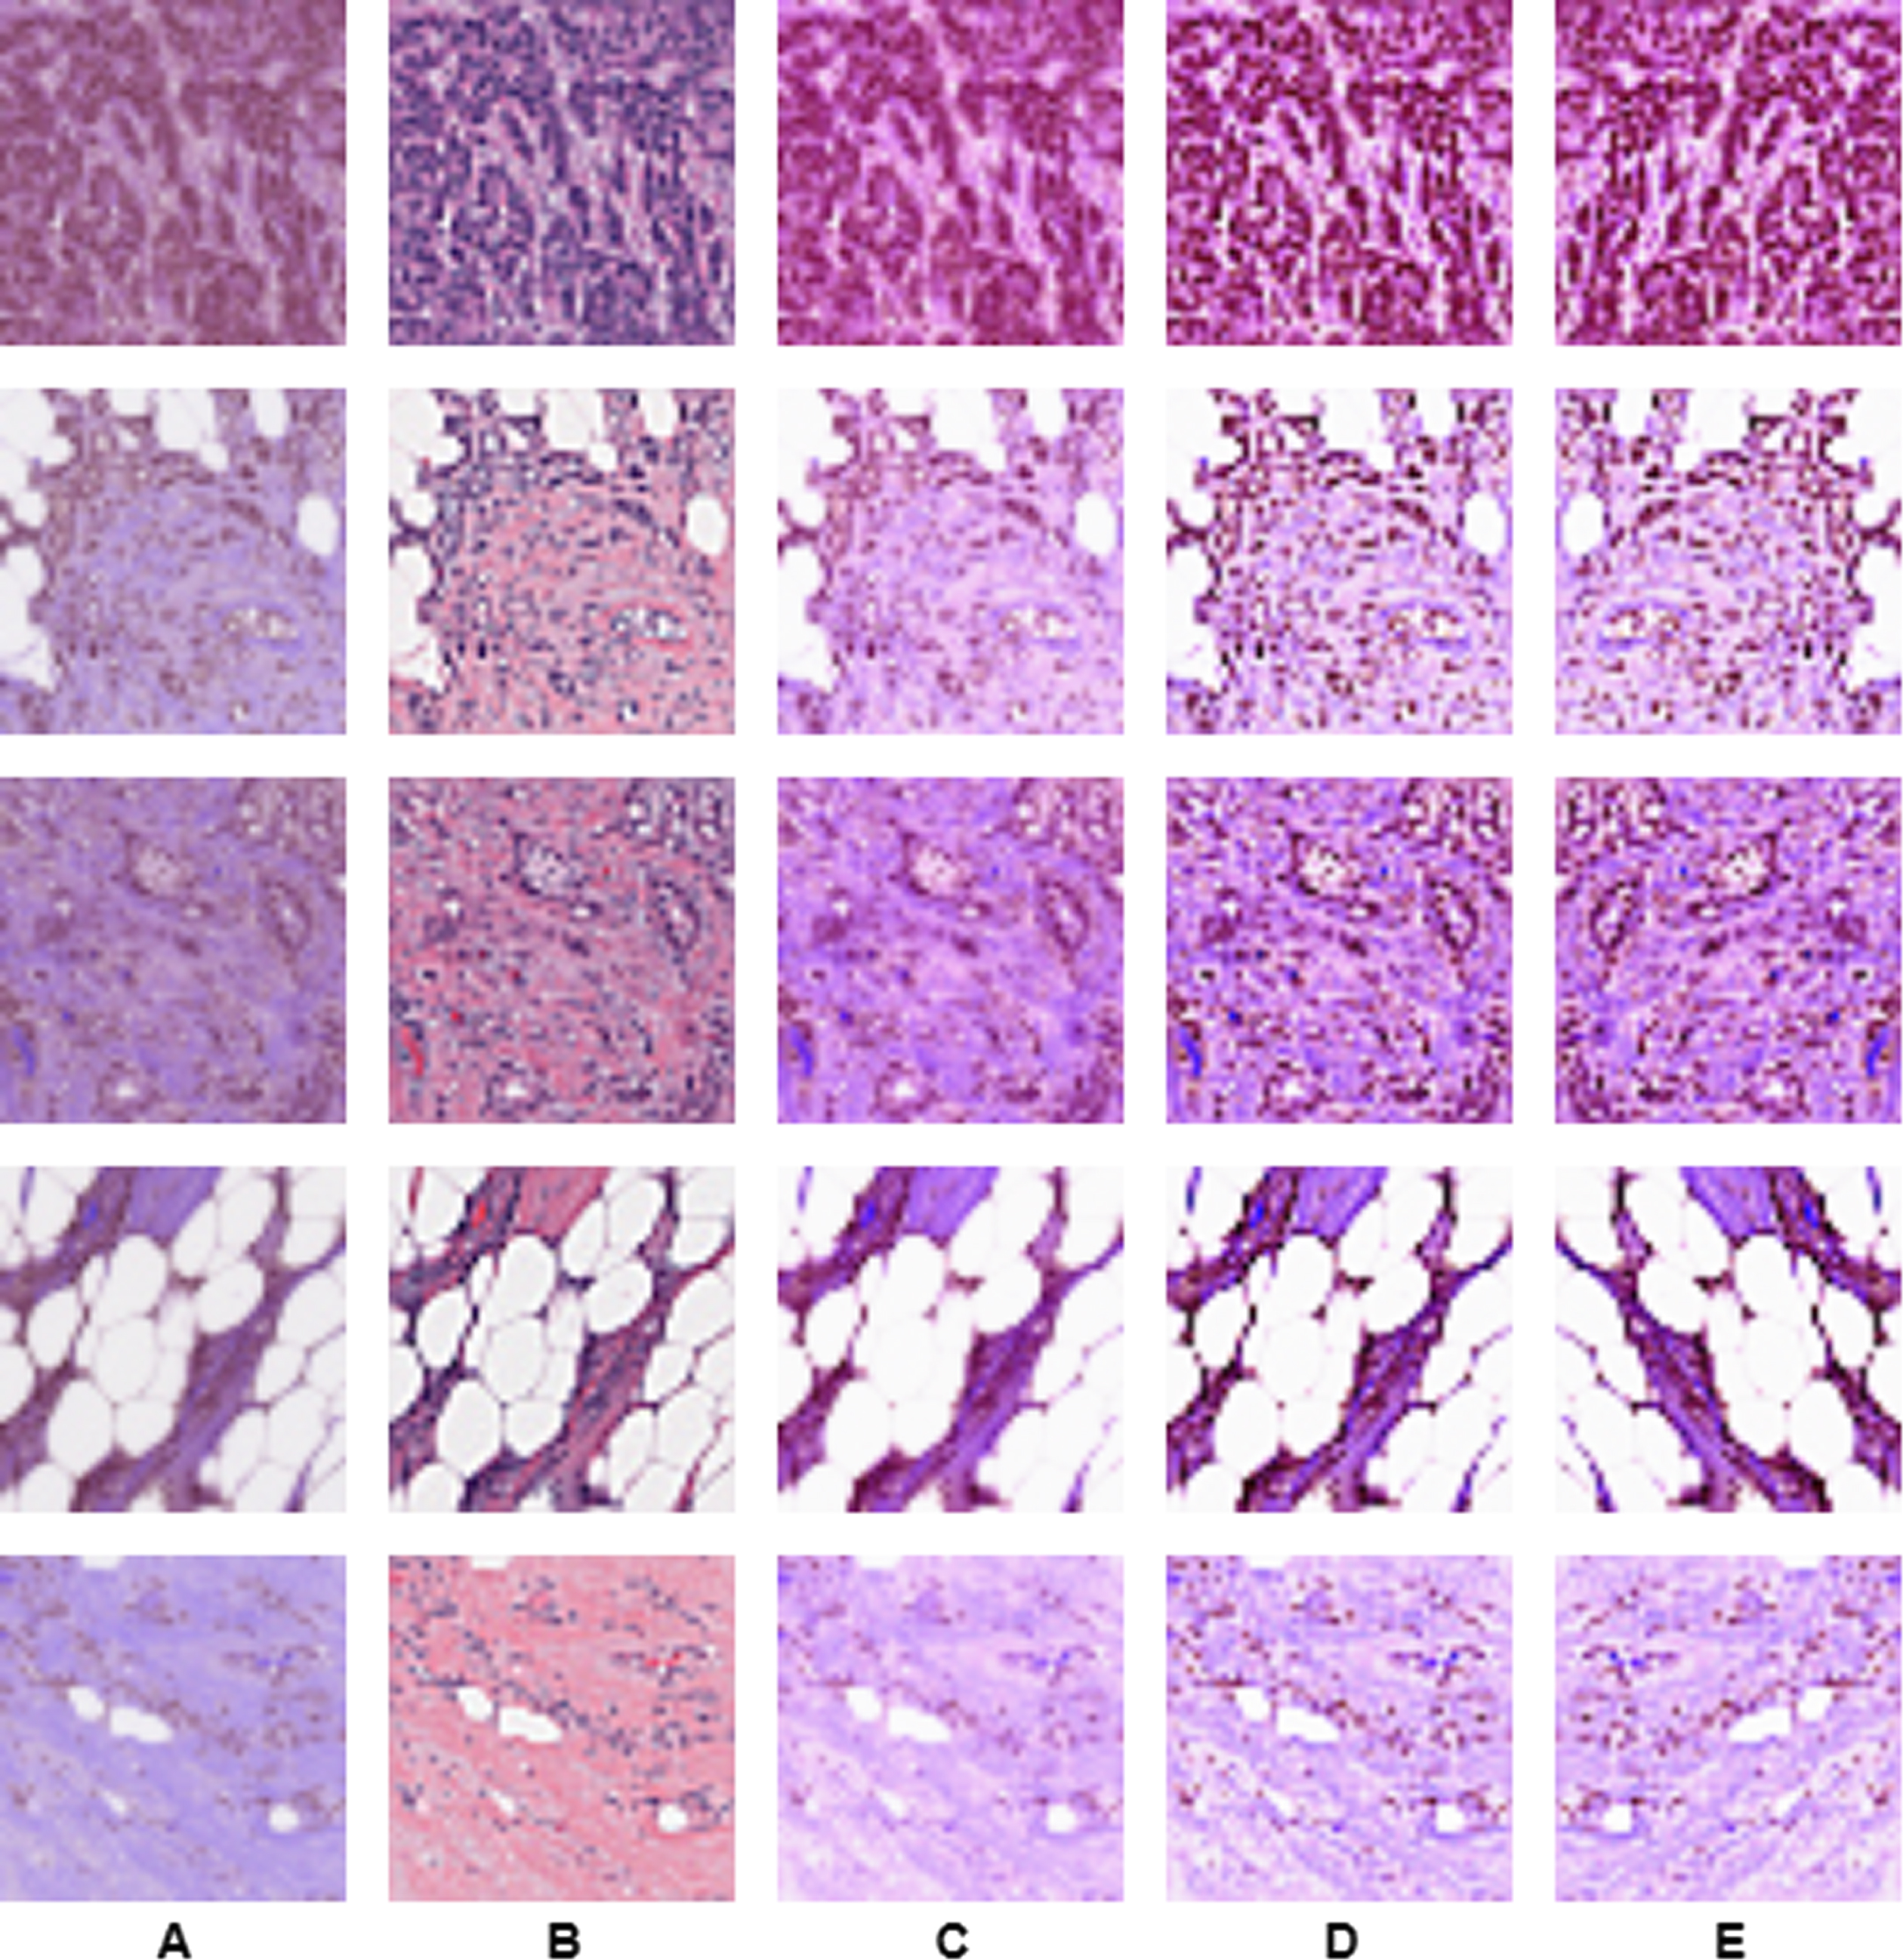
Preprocessing. A. Original RGB image. B. Contrast enhancement of A. C. Histogram stretching of A. D. Contrast enhancement and histogram stretching of A. E. Mirror image of D.
The CNN model used in this work is based on the original AlexNet [17], as this model has shown good results in many classification tasks. This CNN model consists of two stages, the first one is the feature extraction stage consisting of convolutional layers with Rectified Linear Unit (ReLU) [18] as activation function combined with Max-pooling layers. The second stage is the classification stage, composed of two fully connected layers with 1024 neurons each one with ReLU as an activation function. The output of the model is made of two neurons that classify the input subimage as cancer-free or cancerous one. The implementation of this model is shown in Fig. 4. This model consists of Convolutional layers [19], Max-pooling layers [20] and fully connected layers [19].
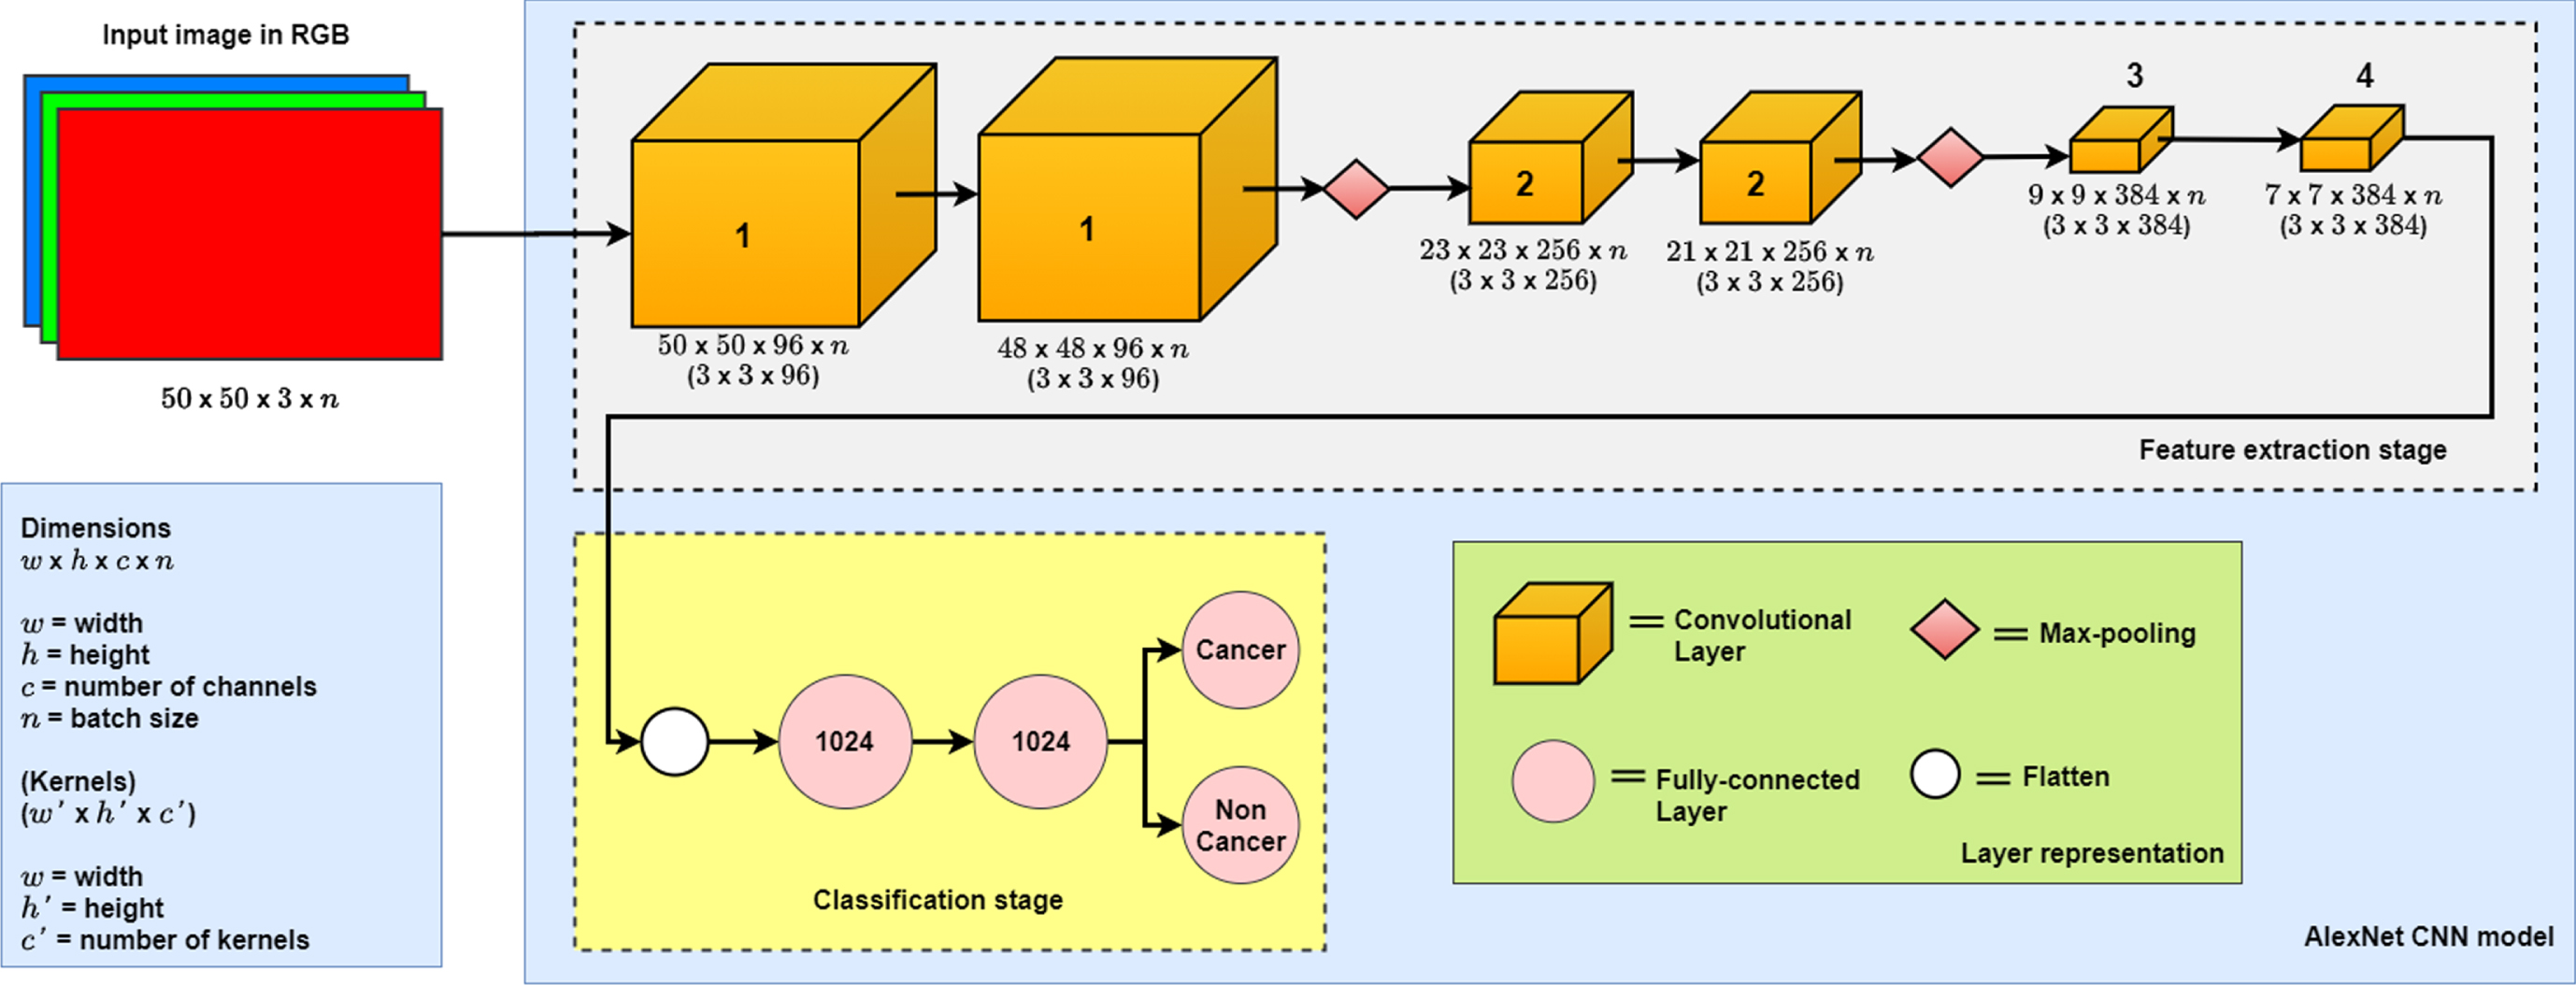
AlexNet CNN model.
To evaluate and compare this work with the state of the art, we will use metrics obtained from the confusion matrix of the results [21], represented by equations from (3) to (6):
Accuracy:
Precision:
Recall:
Value F1:
TP = True Positive (Higher is better)
TN = True Negative (Higher is better)
FP = False Positive (Lower is better)
FP = False Negative (Lower is better)
Additionally we used the Area Under the ROC Curve (AUC) metric [22], to compare with the state of the art.
For this work, we proposed 5 experiments: the first experiment named (RGB) consists of the use of the RGB channels as they are, without preprocessing. The second experiment (RGB-H) consists in perform histogram stretching to the RGB channels. The third experiment (RGB-CE) consists in applying contrast enhancement to the RGB image. The fourth experiment (RGB-HC) consists of applying contrast enhancement and histogram stretching to the RGB channels. The fifth experiment (RGB-DA) consists of using the augmented database as described in Section 3.2.3. It is important to mention now that we are not obtaining the classification of the full image but the classification of the subimages. This means that is needed to reconstruct the images from the subimages, automatically as the author of the dataset only provides the subimages.
CNN training
The CNN was trained with categorical cross-entropy as a loss function. Stochastic Gradient Descent (SGD) [23] was used as an optimizer in the training process; from the first up to the fourth experiment, 217,778 images were used, 62,782 images were labeled as cancerous and 154,996 were labeled as non-cancerous. For the fifth experiment data augmentation was applied; from the total of 435,556 images obtained 125,564 were labeled as cancerous and 309,992 were labeled as non-cancerous. In all the experiments, from the test dataset containing 15,695 images diagnosed as cancerous and 38,749 as non-cancerous.
The CNN training was carried out in Google Colaboratory [24], using Tensorflow [25] and Keras 4 as Python frameworks, to implement the CNN model with GPU environment for swift performance.
Results
In this section we present the quantitative results obtained after applying randomly the subimages from the test dataset to the previous trained CNN. In Table 1 shows the values of the confusion matrix, with the best results in boldface. Table 2 shows the global performance with the results obtained from the metrics showed in Section 3.4.
Confusion matrices from the experiments
Confusion matrices from the experiments
Results obtained from the test dataset
The best results were obtained with the Histogram stretching experiment and using both preprocessing methods and data augmentation.
This section presents the results obtained in comparison with some papers of the state of the art. The best results, shown in boldface, were obtained using both preprocessing methods. Comparing our work with some of the state of the art we obtain better results than them, although those of Cruz-Roa et al. [11] obtain a better performance on the AUC metric; they don’t evaluate their work using the other metrics.
Comparison between our results and those of the state of the art
Comparison between our results and those of the state of the art
To determine if the complete sample of the patient is classified as cancerous, we must first classify all the subimages of a given sample and obtain the percentage of images classified as carcinogenic and non-carcinogenic. In Table 4 we show results with the percentages of 24 patients taken randomly from the test set. We chose the percentage instead of the number of images, because the number of images per patient may vary. This percentage was calculated empirically by using the target labels of the patient samples as a reference then we compare it with the classification obtained with each experiment.
Comparison amongst the percentages obtained relative to complete samples (best results are highlighted)
Comparison amongst the percentages obtained relative to complete samples (best results are highlighted)
In this table, we can observe that the best results were obtained using also both preprocessing methods and data augmentation. Because patient samples generally consist of a different uncontrolled number of subimages, this result should be considered more of a qualitative rather than a quantitative result, but it certainly supports the results detailed above.
According to the results shown in the previous tables, we can say that all our results have made a favorable classification since all of them are very close and obtain similar results. The RGB-DA experiment is the one with the best results. We believe that these results were obtained because we put together the data from all the previous experiments, and the CNN was able to extract all the features that we were able to highlight through the preprocessing methods.
Conclusions and future work
In this work, we presented a methodology in which we classify breast cancer through subimages taken from a high-resolution histopathological sample. We showed that histogram stretching and sharpness enhancement can highlight details in the subsamples that are useful to CNN. Data augmentation also leads to better performance as we increment variations of the original dataset. On the other hand, we also obtained what percentage of the complete sample is contaminated with cancer, using the classification results. As future work, we proposed to modify the hyperparameters of the CNN model to improve the classification and perform an analysis of which of the subimages will be useful to perform the classification.