



Abstract
A current challenge for autonomous vehicles is the detection of irregularities on road surfaces in order to prevent accidents; in particular, speed bump detection is an important task for safe and comfortable autonomous navigation. There are some techniques that have achieved acceptable speed bump detection under optimal road surface conditions, especially when signs are well-marked. However, in developing countries it is very common to find unmarked speed bumps and existing techniques fail. In this paper a methodology to detect both marked and unmarked speed bumps is proposed, for clearly painted speed bumps we apply local binary patterns technique to extract features from an image dataset. For unmarked speed bump detection, we apply stereo vision where point clouds obtained by the 3D reconstruction are converted to triangular meshes by applying Delaunay triangulation. A selection and extraction of the most relevant features is made to speed bump elevation on surfaces meshes. Results obtained have an important contribution and improve some of the existing techniques since the reconstruction of three-dimensional meshes provides relevant information for the detection of speed bumps by elevations on surfaces even though they are not marked.
Introduction
Autonomous vehicles have been able to circulate in countries with optimal road infrastructure conditions, such as smart city roads. Some algorithms have been developed for these vehicles to perform perception, control and decision-making tasks to move from an origin to a destination safely, avoiding different obstacles on roads [8]. Autonomous cars are equipped with some sensors such as: video cameras, stereo cameras, LIDAR (LIght Detection And Ranging) devices, ultrasonic sensors, among others, to perceive different elements surrounding the road traffic [6].
One of the great challenges for safe and comfortable autonomous navigation is the detection of irregularities by monitoring road surface conditions [2, 31]. Irregularities that have been frequently studied (because they affect the stability in vehicle navigation) are speed bumps (SB) and potholes. In developing countries, it is very common to find road irregularities with inadequate traffic signs that make detection difficult which could cause vehicle damages.
Speed bump detection is used in some of self-driving car applications, some of them are the speed reduction when detecting SB and the steering angle prediction to avoid accidents or damages that affect the safety of the passengers, in addition, it can provide an adequate performance in the vehicle in scenarios with high uncertainty [7, 29].
In this work, results for marked speed bump detection are presented and some experimental results about the pre-processing phase for the detection of unmarked speed bump are presented. Therefore, a novel methodology for both marked and unmarked speed bump detection is presented to help analyze irregularities on road surfaces of developing countries. Our proposal is based on image processing, stereo vision and supervised learning.
Related work
Speed bump detection on roads has been a topic of interest for several years and recently a review of the most relevant techniques is reported in [28]. These techniques try to improve the precision in the SB detection under different conditions such as unmarked signs, poor visibility and weather adversities. Approaches that have been used in recent years for the detection of speed bumps are: image-based techniques, stereo vision, LIDAR sensors, smartphone sensors, and hybrid techniques that combine more than one approach.
Some works have applied image processing techniques and machine learning to detect speed bumps [16]. Basic image processing techniques, such as the Otsu thresholding method and morphological operators, have been useful to analyze SB signaling patterns when they are clearly painted and even when the pattern is noisy [5]. In addition, techniques such as texture and color analysis, contour extraction and segmentation of areas of interest to a set of images have been used, where the segmented region is compared with patterns of SB formed by diagonal lines [10, 13].
Likewise, features have been extracted via Local Binary Patterns and a classification model has been trained with Support Vector Machines (SVM) for SB detection [22]. Advanced techniques using deep learning, in particular, a deep convolutional neural network architecture for semantic pixel-wise segmentation has been applied to segment SB into image datasets [4].
The main advantage of segmentation algorithms is that they use inexpensive cameras for image acquisition. However, the precision of speed bump detection is low due to the fact that it is restricted to the visualization of the road marking, otherwise it is hard to detect speed bumps with these techniques. In addition, when signs of SB are very diverse it is difficult to apply the same vision technique to all types of patterns.
Despite the fact that these works presents results with high precision, they occurs when there is a good illumination in the environment, thus these techniques require optimal weather conditions, and mainly they work adequately for the detection of clearly painted SB but for unmarked speed bumps this technique fails.
Another approach for speed bump detection is stereo vision that is combined with deep learning, where three-dimensional scene reconstruction has been done from the estimation of stereo images obtained by a ZED camera [32]. Despite the fact that results of this work reveal an approximate precision of 93.88%, ZED camera does not work properly outdoors. The main advantage of these algorithms is that they use low-cost sensors, however, their great disadvantage is that the range is too short because the separation between the camera lenses is very small, so they do not work in real scale environments.
The use of LIDAR sensors has been very popular in autonomous car navigation. Through these sensors it is possible to obtain data of scenes by generating point clouds. A method that detects bumps according to appropriate threshold values to distinguish between a speed bump and other objects has been developed [25]. Despite the high precision of these sensors, they have some limitations: their cost is very high, they do not follow internationally compatible standards, they require high computing power to process large amounts of data, in addition, the signals from several sensors can overlap and generate errors [20, 26].
Another approach for speed bump detection is the use of smartphone sensors for capturing vibrations on road surfaces by analyzing acceleration signals [24]. Accelerometer and gyroscope sensors have been used to gather vibration data when vehicles pass through some SB and a GPS receiver to capture the geographical location coordinates [1, 3].
Mobile applications have been developed to send timely alerts to passengers by detecting SB in real time through the use of smartphone sensors and crowdsourcing where users share and get data [34]. Signal processing techniques and more advanced techniques such as genetic algorithms have been applied to detect SB from the collected data [9, 14]. The advantage of these applications is that their design is simple, inexpensive and within the reach of any user. Smartphone sensors have high precision errors, long delays when used in real time, are sensitive to environmental conditions and overload the network to which they are connected. Alert applications are useful when SB have a fixed location, however, for unplanned events, when new SB are placed without updating their location, they cannot be detected. Despite the various disadvantages, these technologies could be complemented with other techniques to improve SB detection accuracy.
There are works that combine some mentioned techniques to detect speed bumps in order to improve the individual performance of each one. The use of a LIDAR sensor has been combined with a camera to find speed bump through image pattern recognition with zebra crossing [37]. The LIDAR sensor has been used to estimate the distance to the SB. This method is restricted to the detection of clearly marked SB, otherwise it fails. A real-time system has been built which combines LIDAR sensors and digital image processing to detect SB with zebra cross patterns [18]. Results reveal that when the car travels at a standard speed, the detection of SB is performed with a 94% accuracy. However, when there are many vehicles with LIDAR sensors, their signals could overlap and generate errors.
Table 1 shows a summary of some works related to speed bump detection, results with high accuracy have been reported in the literature, but some limitations are observed. Techniques based on image processing are focused on signaling pattern recognition and they fail when the SB is not marked. The current results using stereo vision are good but some systems such as ZED cameras not work for outdoors conditions or real scales environments due to their short range optic. The use of smartphone provides acceptable results, and these sensors are widely used for the detection of SB as irregularities on the surfaces, but network overload, high delays and false alarms can occur caused by the error of these sensors.
Summary of some related works to speed bump detection
Summary of some related works to speed bump detection
In this work is presented a novel approach based on the calculus of a 3D surface mesh, which is obtained from a full-scale stereo camera system. With this approach is possible to detect SB including scenarios when they are not well-marked. Section 3 shows the methodology proposed for speed bump detection.
In this section, a novel methodology for detecting both painted and unpainted speed bumps on road surfaces are presented. Fig. 1 shows the proposed methodology and each stage is described below.
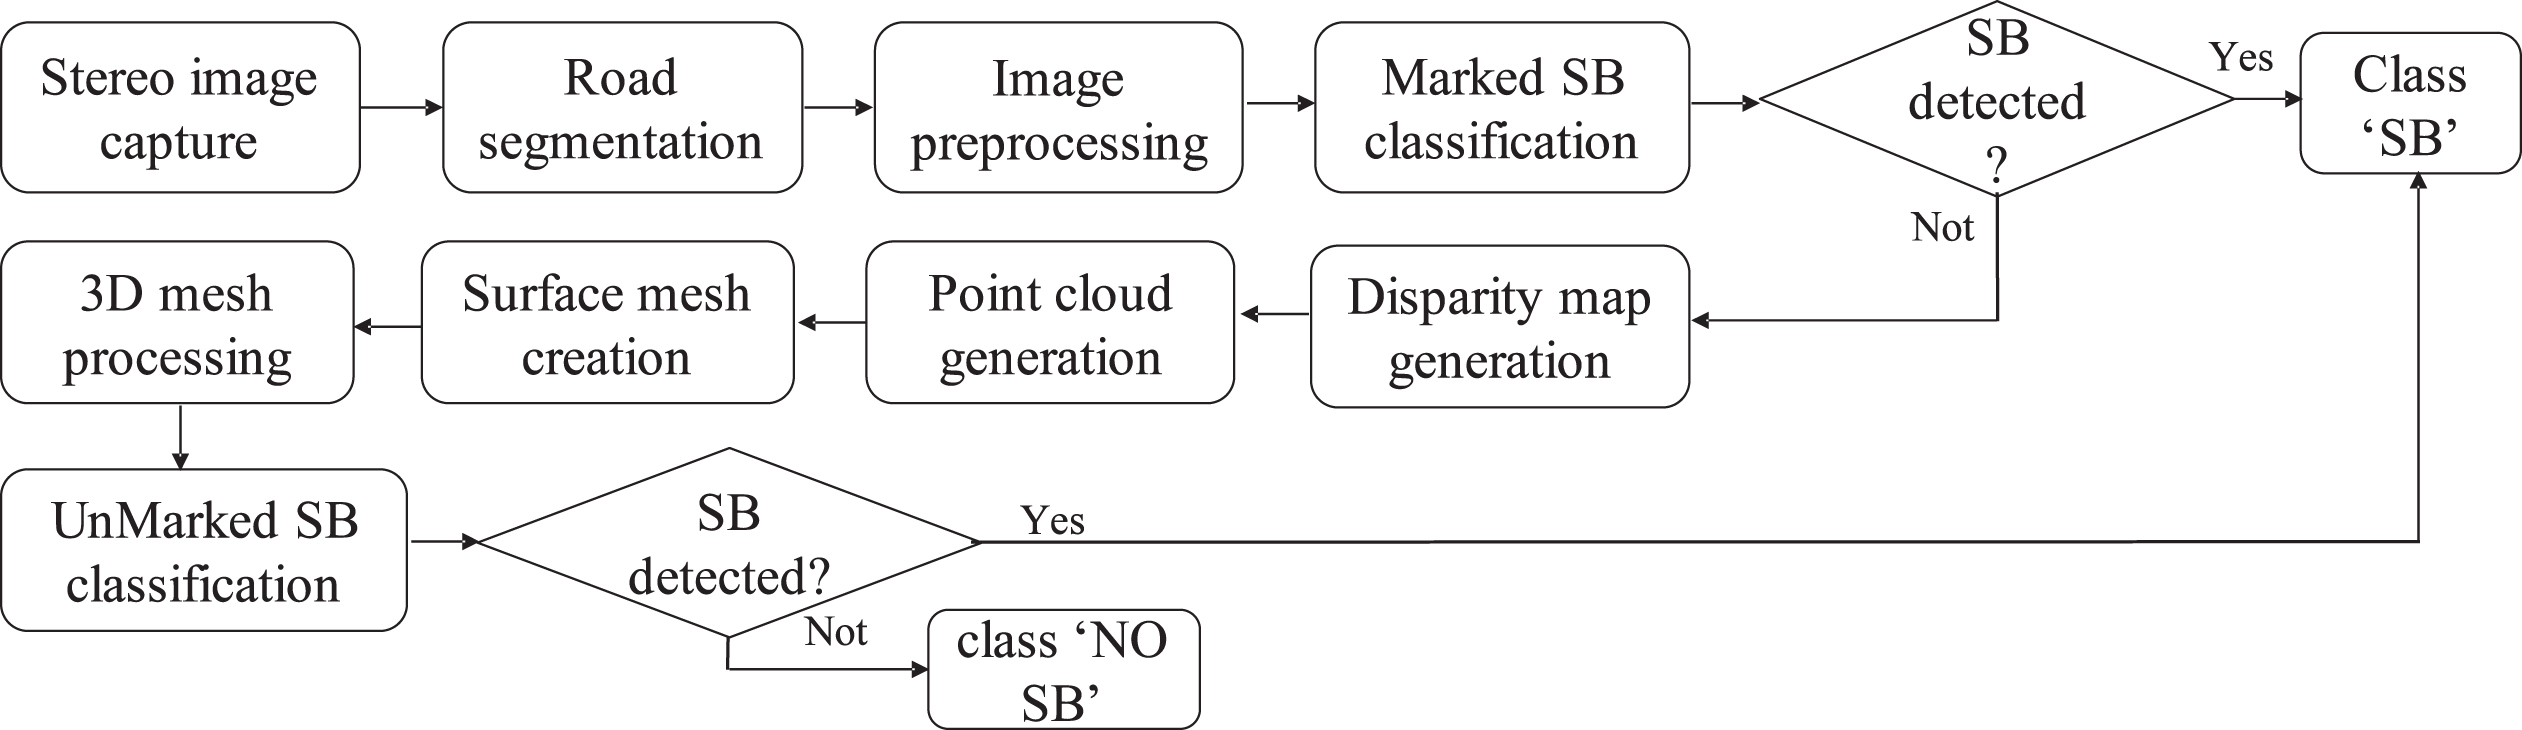
Proposed methodology for marked and unmarked speed bump detection.
Using stereo vision, three-dimensional environments can be reconstructed from pairs of two dimensional images [21]. Therefore, a stereo vision system is employed which includes two cameras with the same characteristics. Simultaneous images are captured and processed to recover depth information from scenes. In this way, a dataset of road stereo images with and without speed bumps is built.
Road segmentation
Semantic segmentation is a deep learning approach that assigns a color to each pixel in an image according to the category to which it belongs. Deep learning is one of the most accurate in classifying images, which uses an amount of hidden layers in a neural network. In this stage, a pre-trained model is employed, applying the Fully Convolutional Network (FCN) architecture of the Fig. 2, for road semantic segmentation. The FCN is a particular case of a CNN (Convolutional Neural Network) where the input is each image and the output is the class (road or non-road) it belongs.

Network architecture for road segmentation applying a FCN model [27].
Fig. 3 shows the result of the road semantic segmentation where the predicted region is colored. Applying a mask over the original image removes the area of no interest and the region of interest (ROI) is cropped.
From segmented road images, for marked speed bump detection, the following operations are applied as pre-processing:
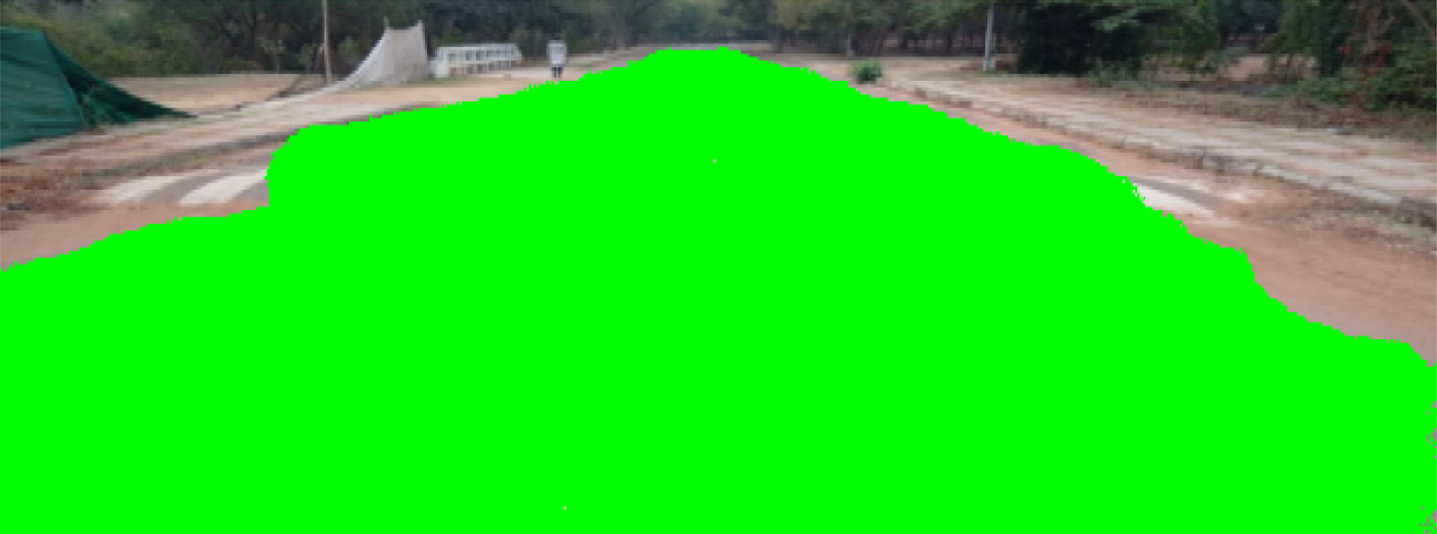
Road semantic segmentation using a pre-trained FCN model. Dataset obtained from [33].
After the images have been pre-processed and segmented in the previous stages, a supervised binary classification model is trained to predict images with or without speed bump by following these steps:
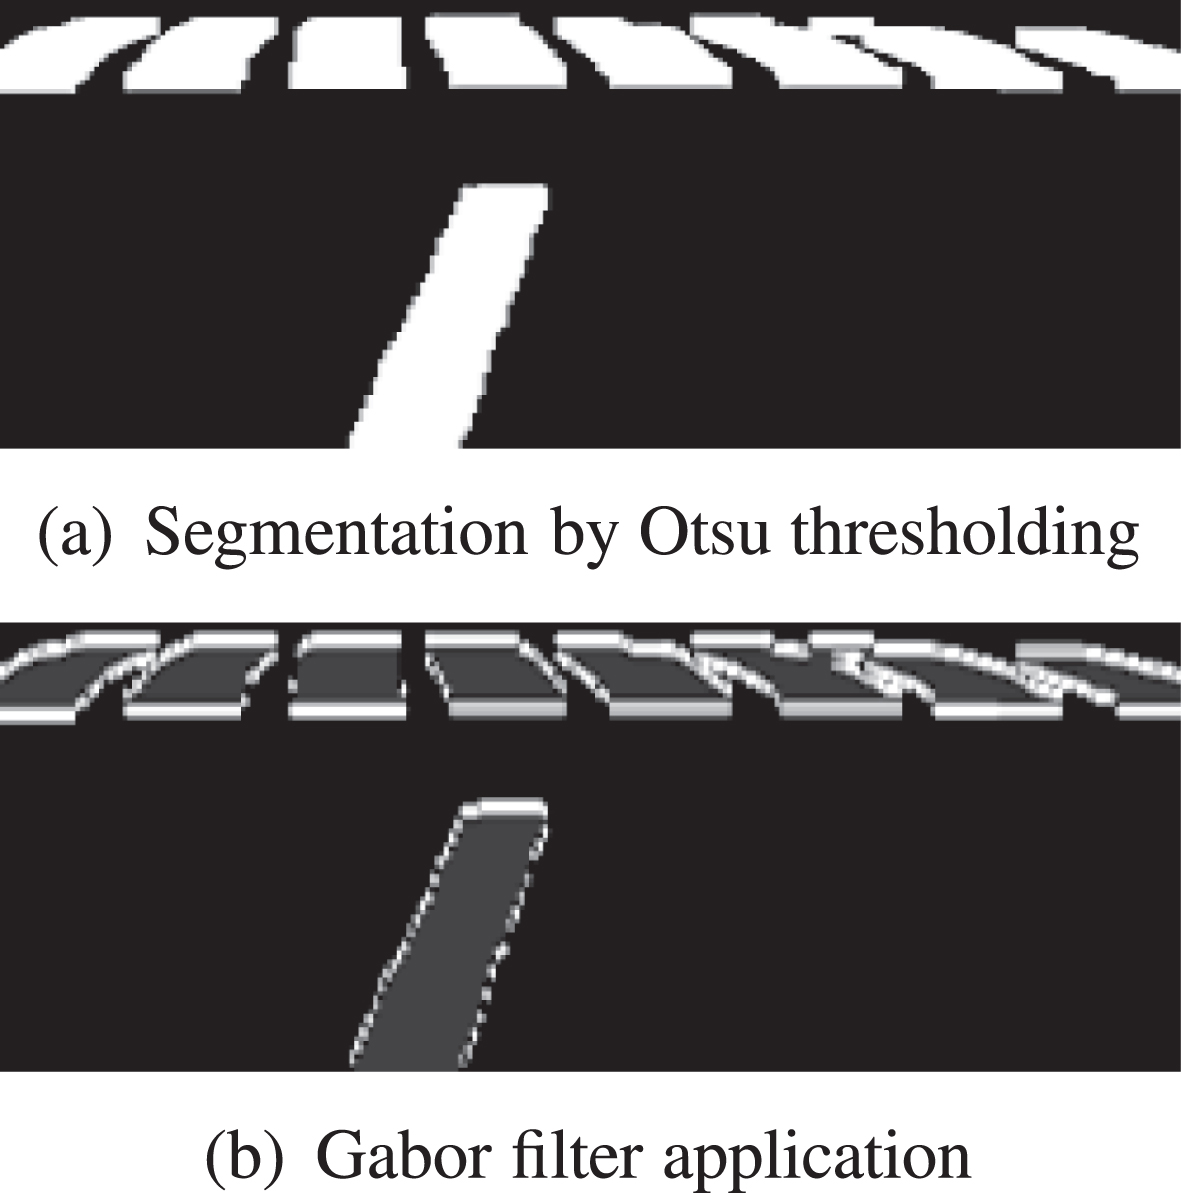
Application of image pre-processing techniques.

Classification results obtained from the predictive model.
The following phases of stereo vision are applied to reconstruct the three-dimensional scenes: camera calibration, image rectification and generation of disparity maps [13]. A disparity map estimates the depth of objects from a stereo image pair. Differences between the pixels of each stereo pair are calculated on the segmented road images. The pairs of corresponding points that are projections of the same point in space are found. Fig. 6 shows the disparity maps obtained for a road with and without SB.
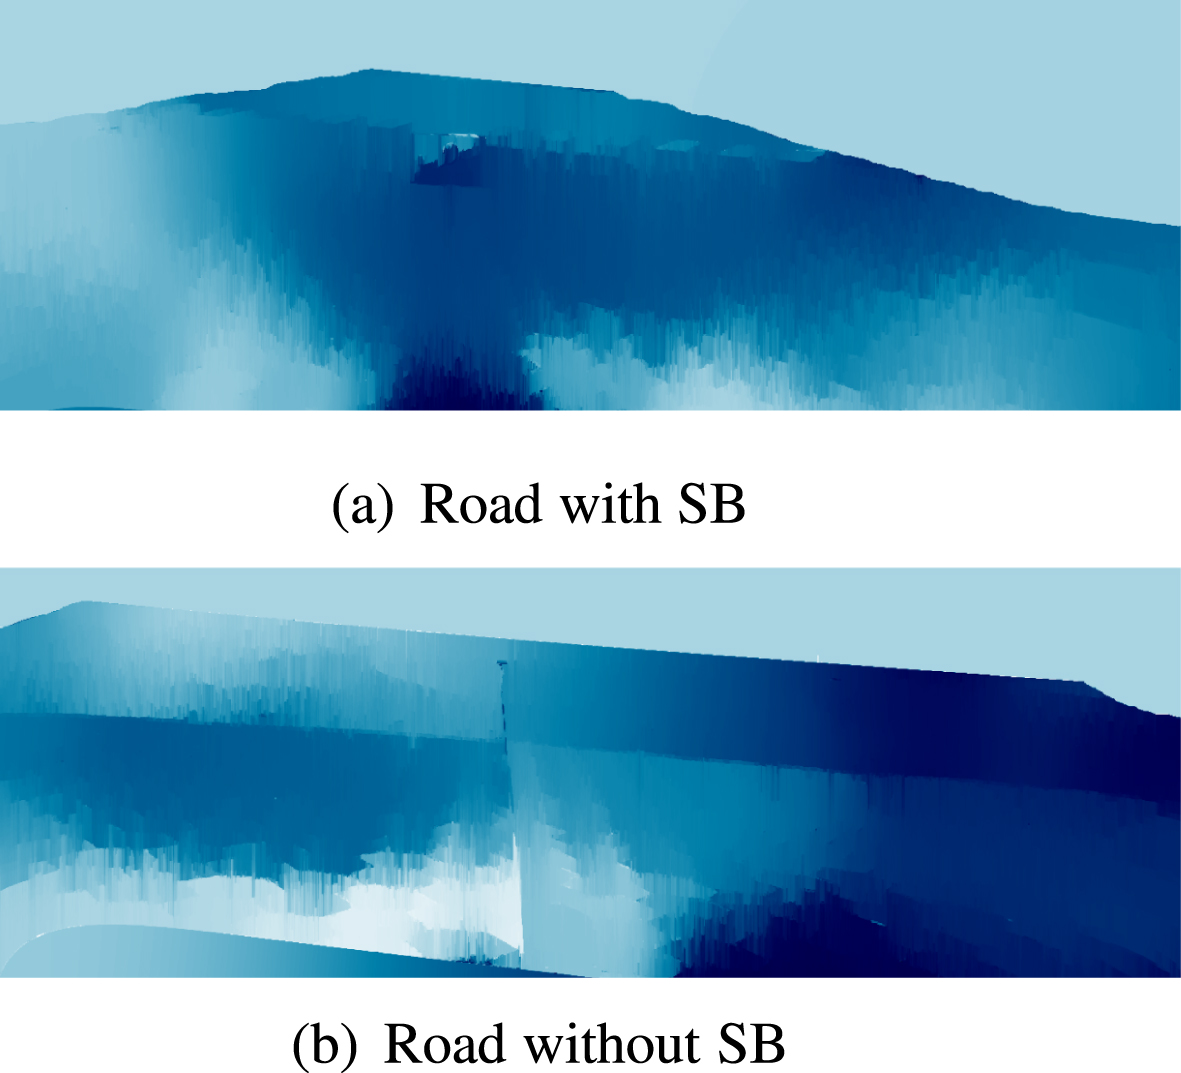
Generated disparity maps.
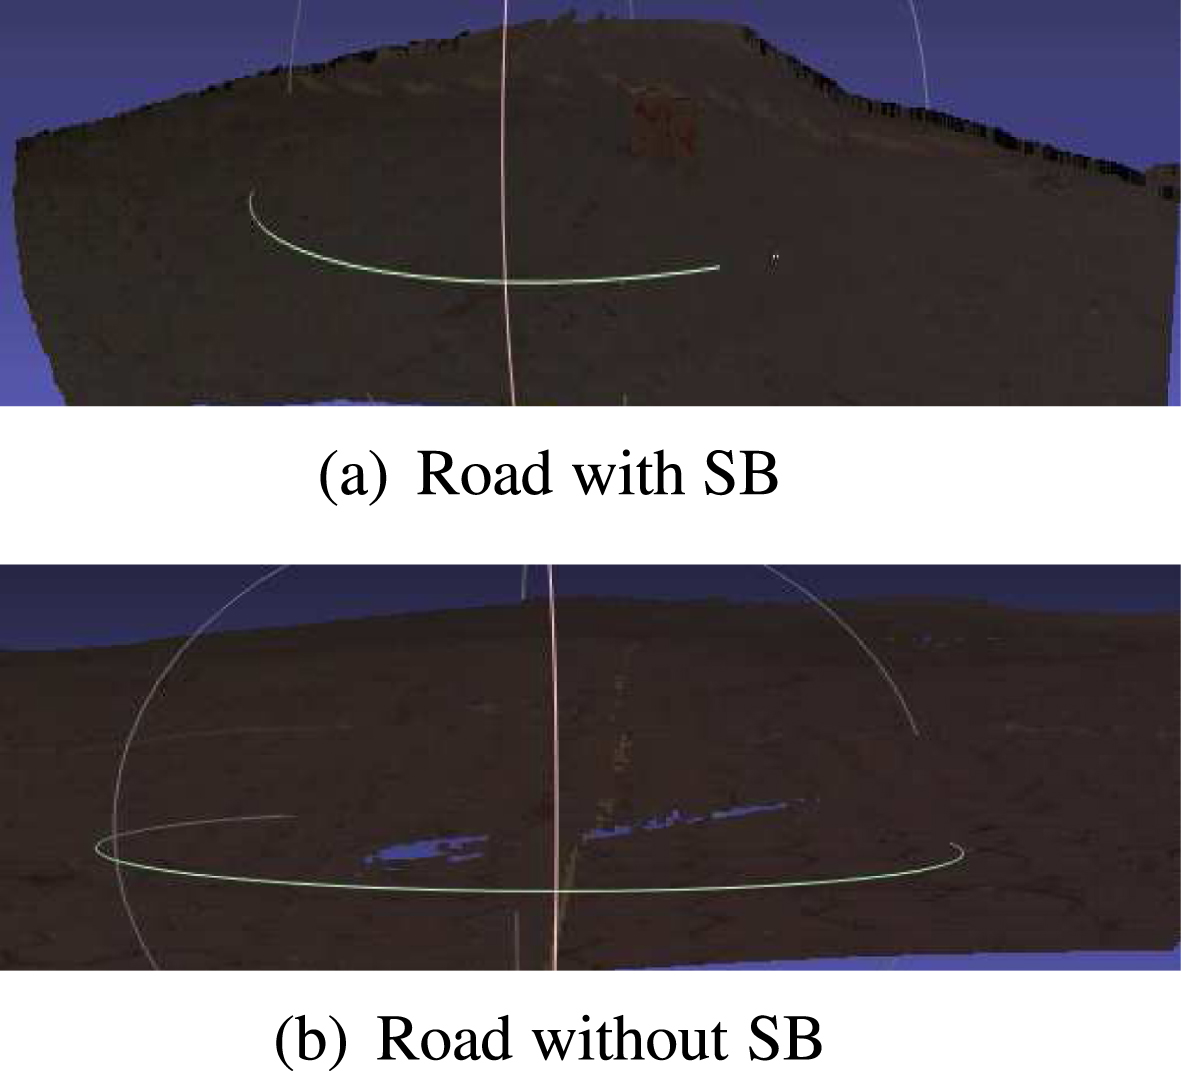
3D reconstruction of the segmented road is generated using a disparity map and applying a triangulation process of stereo vision to estimate the different points (x, y, z) of the scene [12]. Fig. 7 shows the 3D road reconstruction with and without SB using point clouds.
3D reconstruction using point clouds.
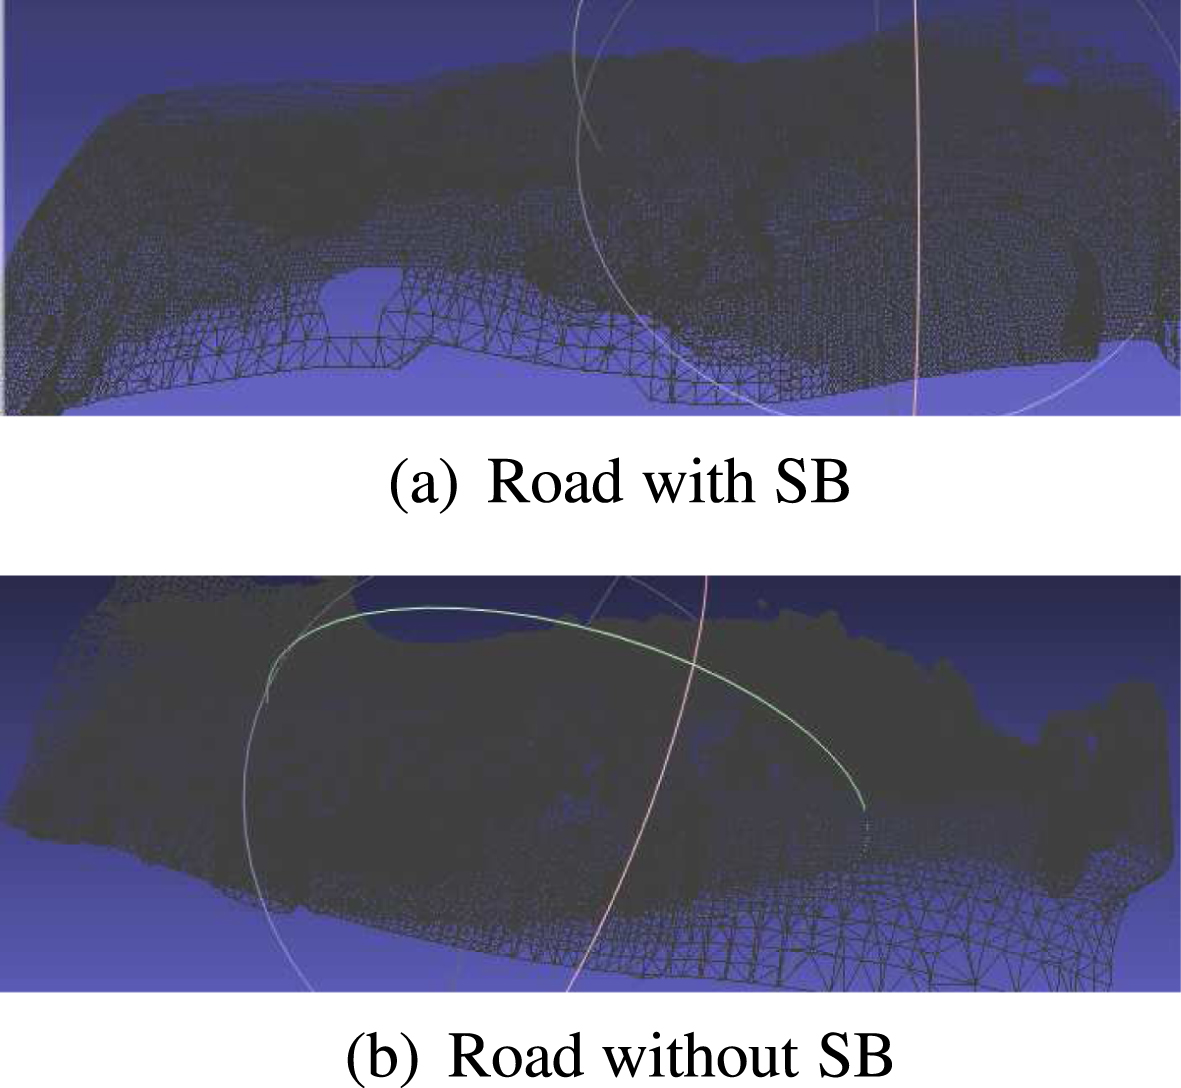
Unstructured point clouds are used to generate three-dimensional surface meshes applying the Delaunay triangulation method [36]. The Delaunay condition of a triangle indicates that the circumscribed circle must not contain any other vertex of the triangulation in its interior. Due to the difficult handling and high computational cost to process the number of mesh vertices, a simplification of the 3D mesh triangles is performed. The objective is to reduce the size of the meshes while preserving their shape and topology and two methods are applied: decimate and pro-decimate.
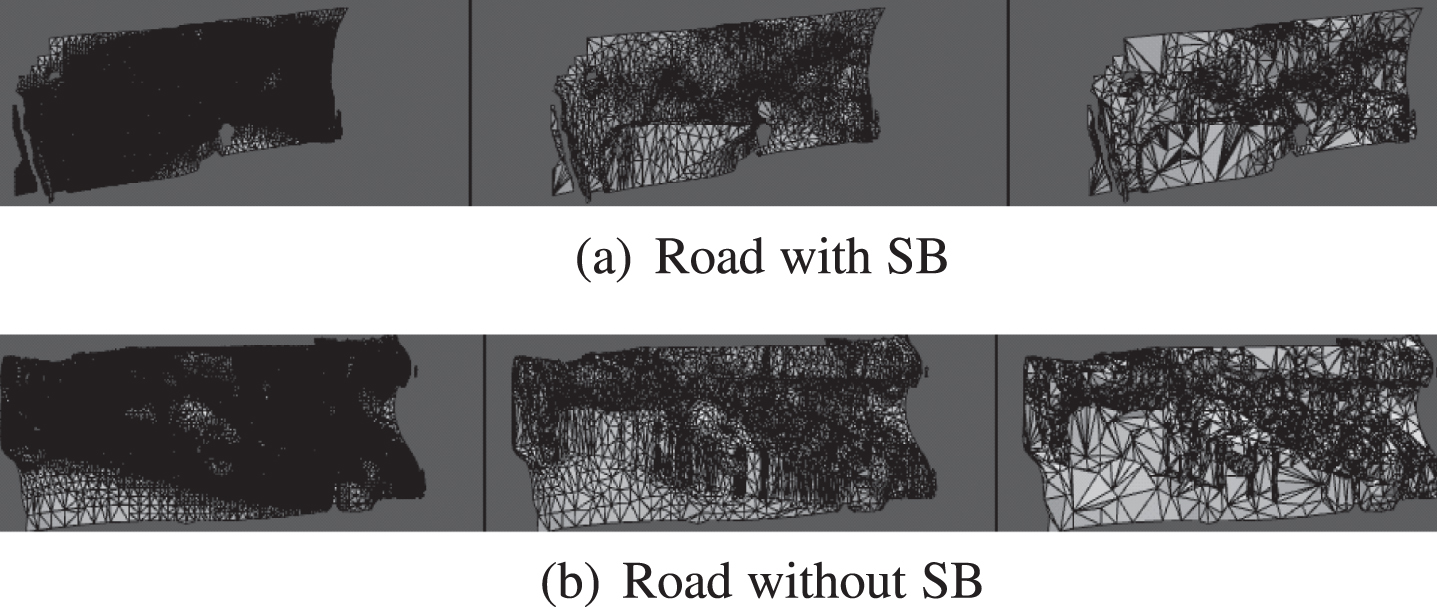
The mesh decimation algorithm classifies each vertex using a distance measure between points; if a certain decimation achieve the vertex is removed and the resulting hole is triangulated. The pro-decimation algorithm generates progressive meshes to improve the basic decimation algorithm where a priority queue is used to place the ranked vertices. Furthermore, the mesh is divided into submeshes and each one is processed recursively. In Fig. 8 results of reducing the triangular meshes are displayed using the two mentioned methods, both with a reduction percentage of 80%; notice that, although the size of the meshes is reduced, the original shape of the road surface is preserved.
Triangle mesh for 3D road surfaces.
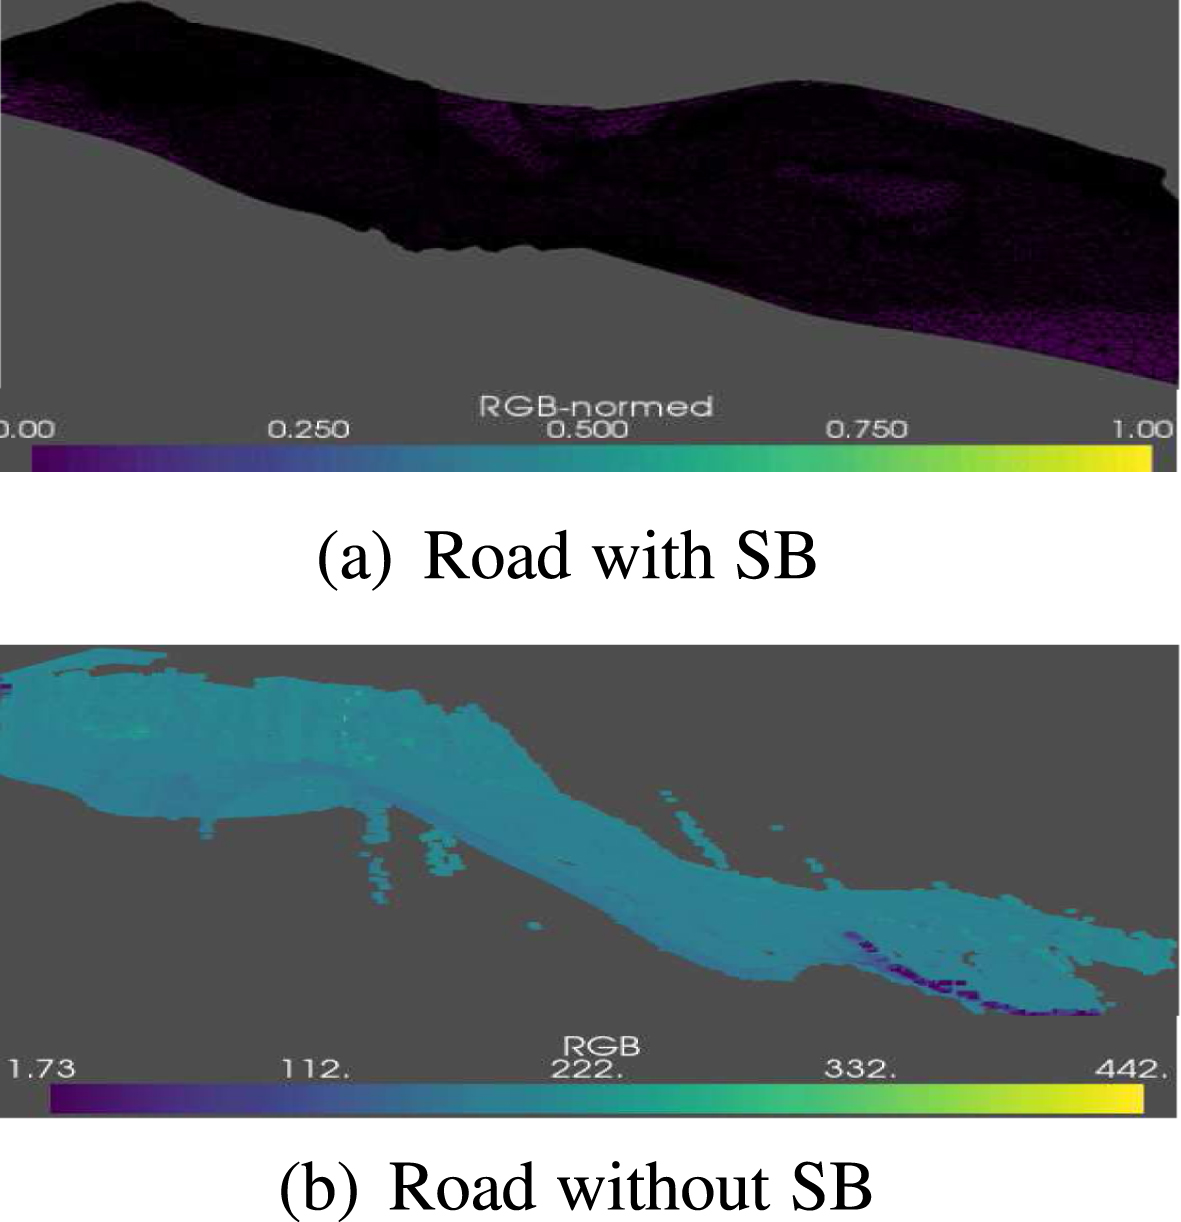
The three-dimensional meshes are processed in order to make them more uniform and to remove outliers. The first mesh processing technique applied to generated surfaces is Laplacian smoothing. This algorithm is used to smooth polygonal meshes where a new position is chosen for each vertex according to the local information of its neighbors. Eq. 2 calculates the Laplacian to smooth a 3D mesh.
Decimate triangle meshes preserving their topology.
Laplacian smoothing of triangle meshes.
From processed road surface meshes, a predictive model to detect unmarked speed bumps due to elevations on surfaces is generated according to the following steps:
MUSBD Algorithm
The general pseudocode of the MUSBD (Marked and Unmarked Speed Bump Detection) algorithm, proposed in this work is depicted in Algorithm 1 and it is summarized below.
The input to the algorithm is a stereo image sequence <I1, . . . , I n >, where the i - th image is represented as I i = (L i , R i ) and the output returns a class C where each class indicates whether or not SB is detected. The first task is the camera calibration in order to obtain intrinsic and extrinsic parameters; the algorithm loops through each stereo pair (L i , R i ) performing the following functions:
1:
2: S p ← stereoCalibration ()
3:
4:
5:
6:
7:
8:
9: C ← " SB "
10:
11:
12: d i ← UNMARK _ SB _ DET (m i )
13:
14: C ← " SB "
15:
16: C ← " NO _ SB "
17:
18:
19:
20:
21:
22:
23: P i ← bilateralFilter (I i )
24: S i ← segmentationFCN (P i )
25: ROI i ← cropROI (S i )
26:
27:
28:
29: FV i ← extractFeatures (L i )
30: d i ← testTrainedModel (FV i )
31:
32:
33:
34:
35:
36:
37:
38: mesh i ← convertPCtoMesh (PC i )
39:
40:
41:
42:
43:
44: FV i ← extractFeatures (mesh i )
45: d i ← testTrainedModel (FV i )
46:
47:
A weighted least squares (WLS) filter is applied to smooth and make the disparity map more uniform (WLSFilter (DM
i
)). 3D point clouds are generated from the processed disparity map (
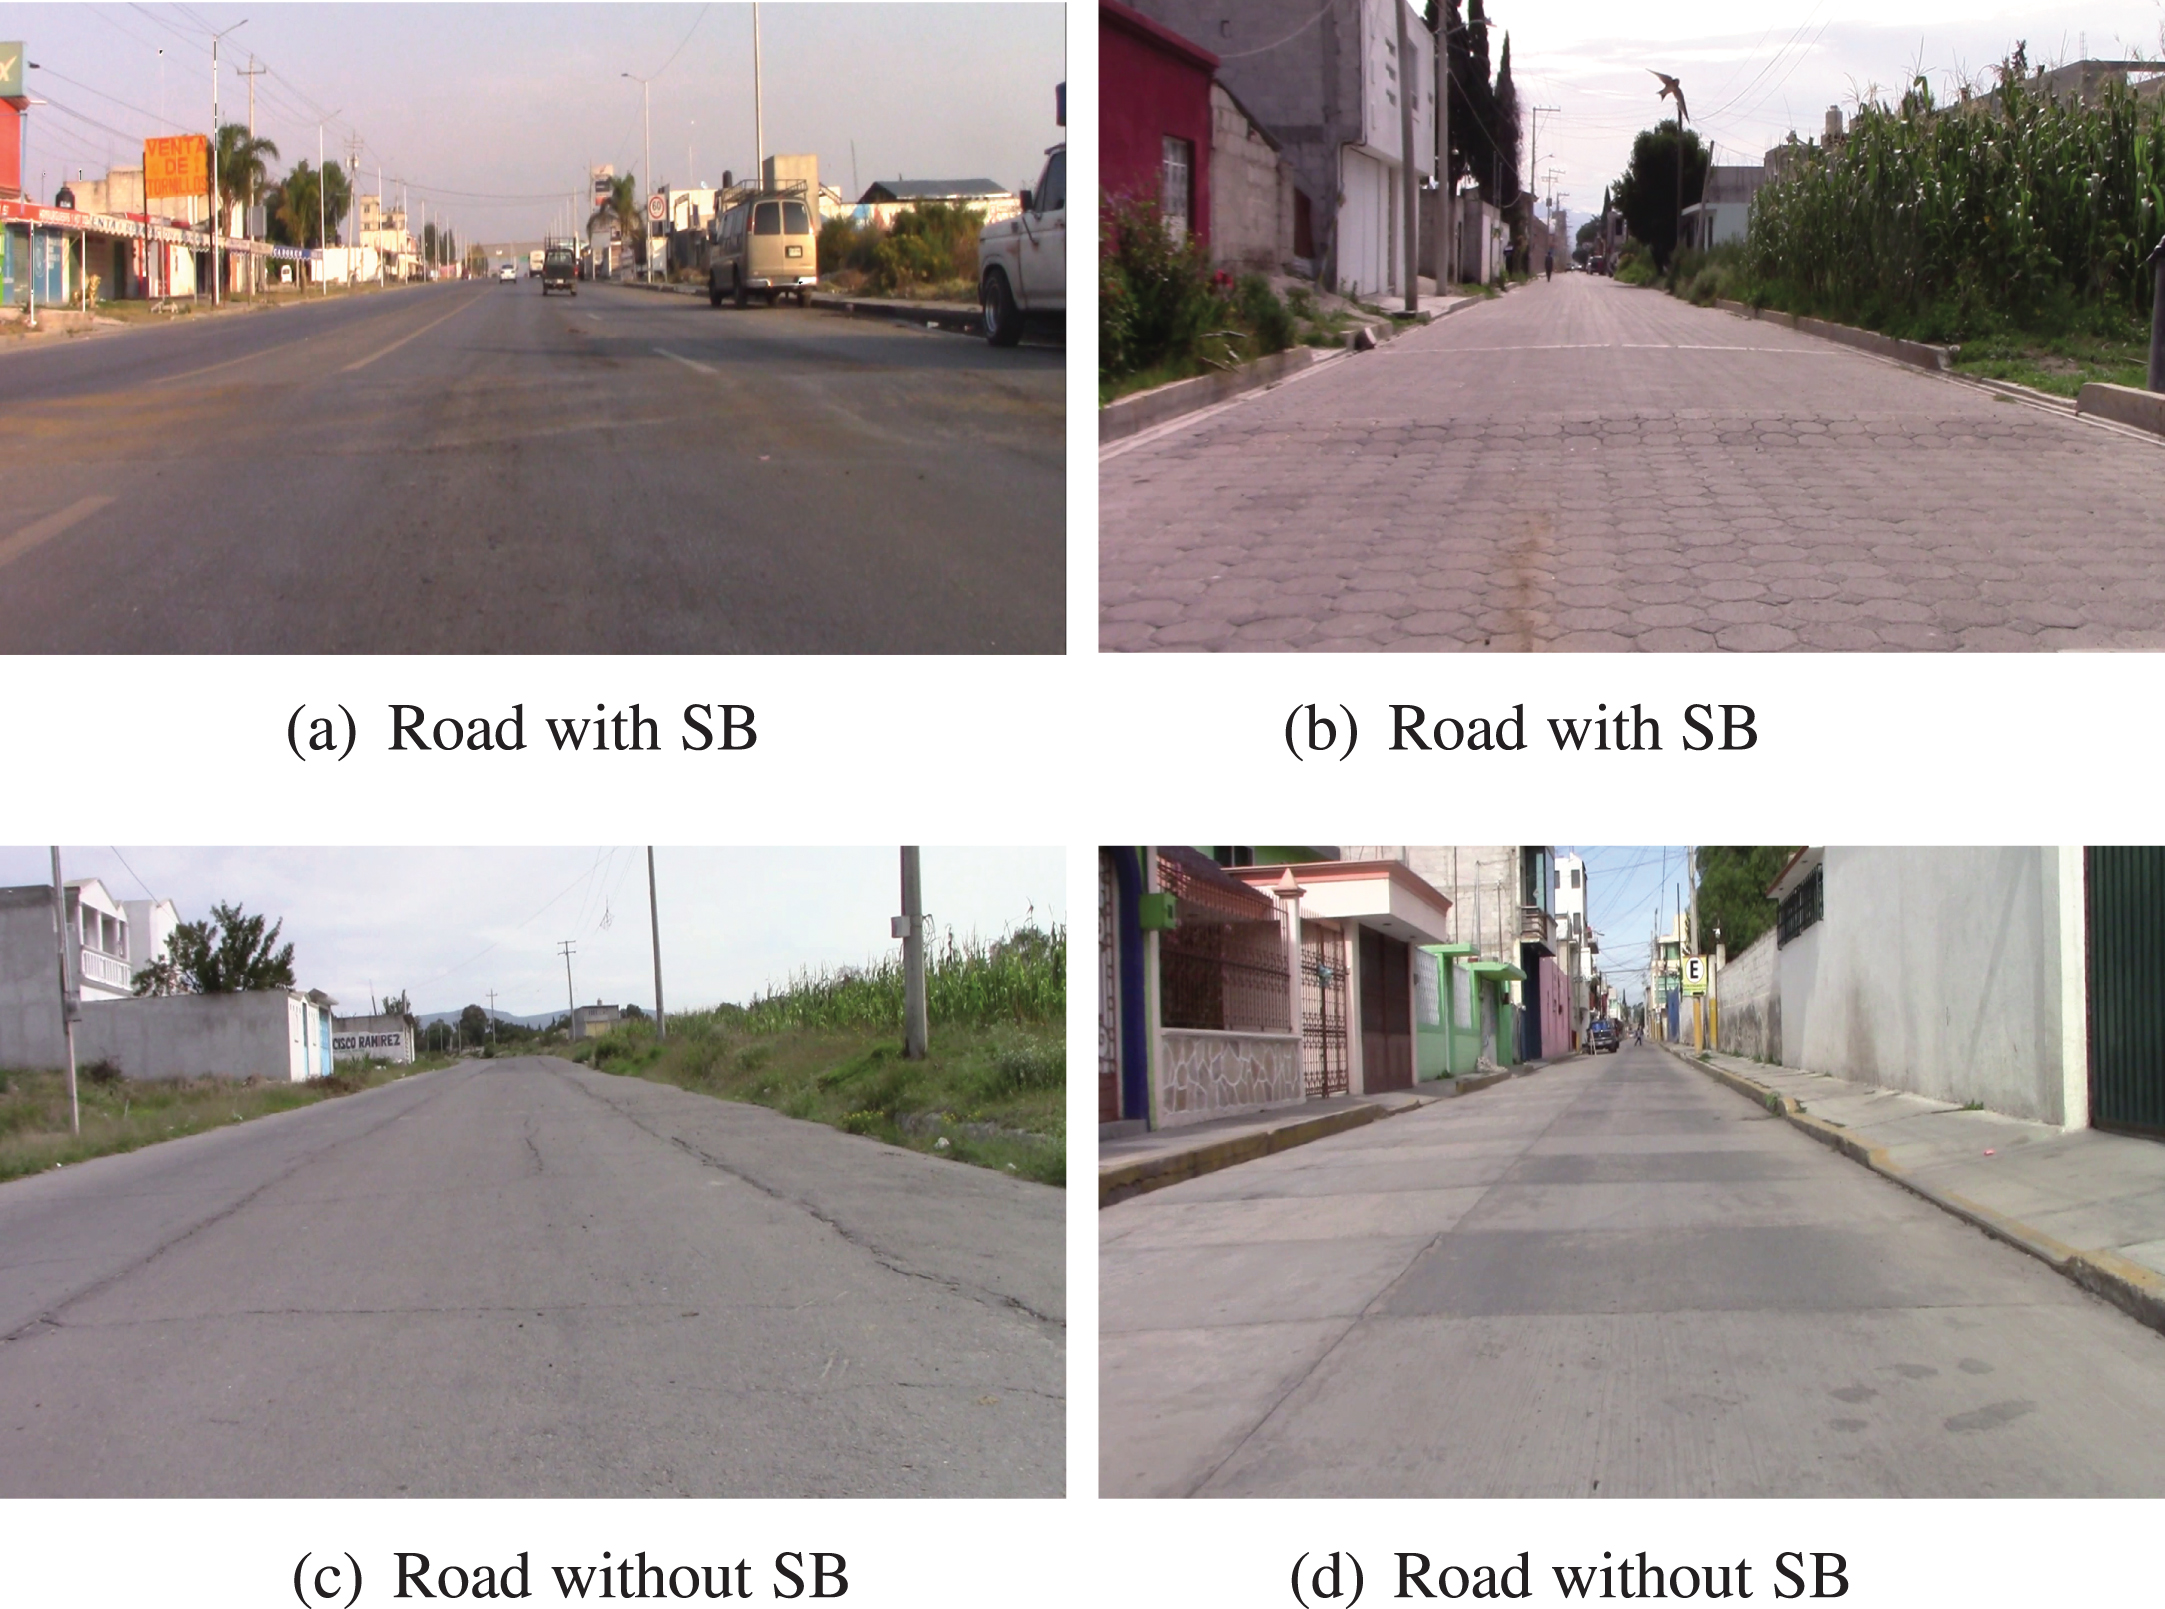
Road images captured with the stereo vision system.
In this section, some results obtained are shown considering a set of stereo images captured under environment conditions specified previously. For the capture, a stereo vision system of two Cannon Vixia HR R72 camcorders separated by a distance of 20cm were used. A set of 500 stereo road images with and without speed bumps has been captured, where experiments have been made under real conditions based on an illumination between 32,000 lux and 100,000 lux (see some examples in Fig 11). Algorithm 1 is implemented in the Python language and is applied to the set of stereo images.
Road segmentation
Fig. 12 presents a comparison between true and predicted semantic segmentation from two road images. To evaluate the performance of the model, two metrics are applied to a set of images of each stereo pair. A successful prediction is one where the overlap between estimated and true classes is maximized. Two widely used metrics for their high efficiency are the Jaccard index and the Dice coefficient. The Jaccard index, also known as IoU or intersection on union, is the area of overlap between the predicted segmentation and the ground truth or true divided by the area of the union, the predicted segmentation and the ground truth (see Equation 3). On the other hand, the Dice coefficient is twice the overlap divided by the total number of pixels in both images (see Equation 4). Both metrics vary between 0 and 1 where 0 indicates that there is no overlap and 1 corresponds to a perfectly overlapped segmentation.
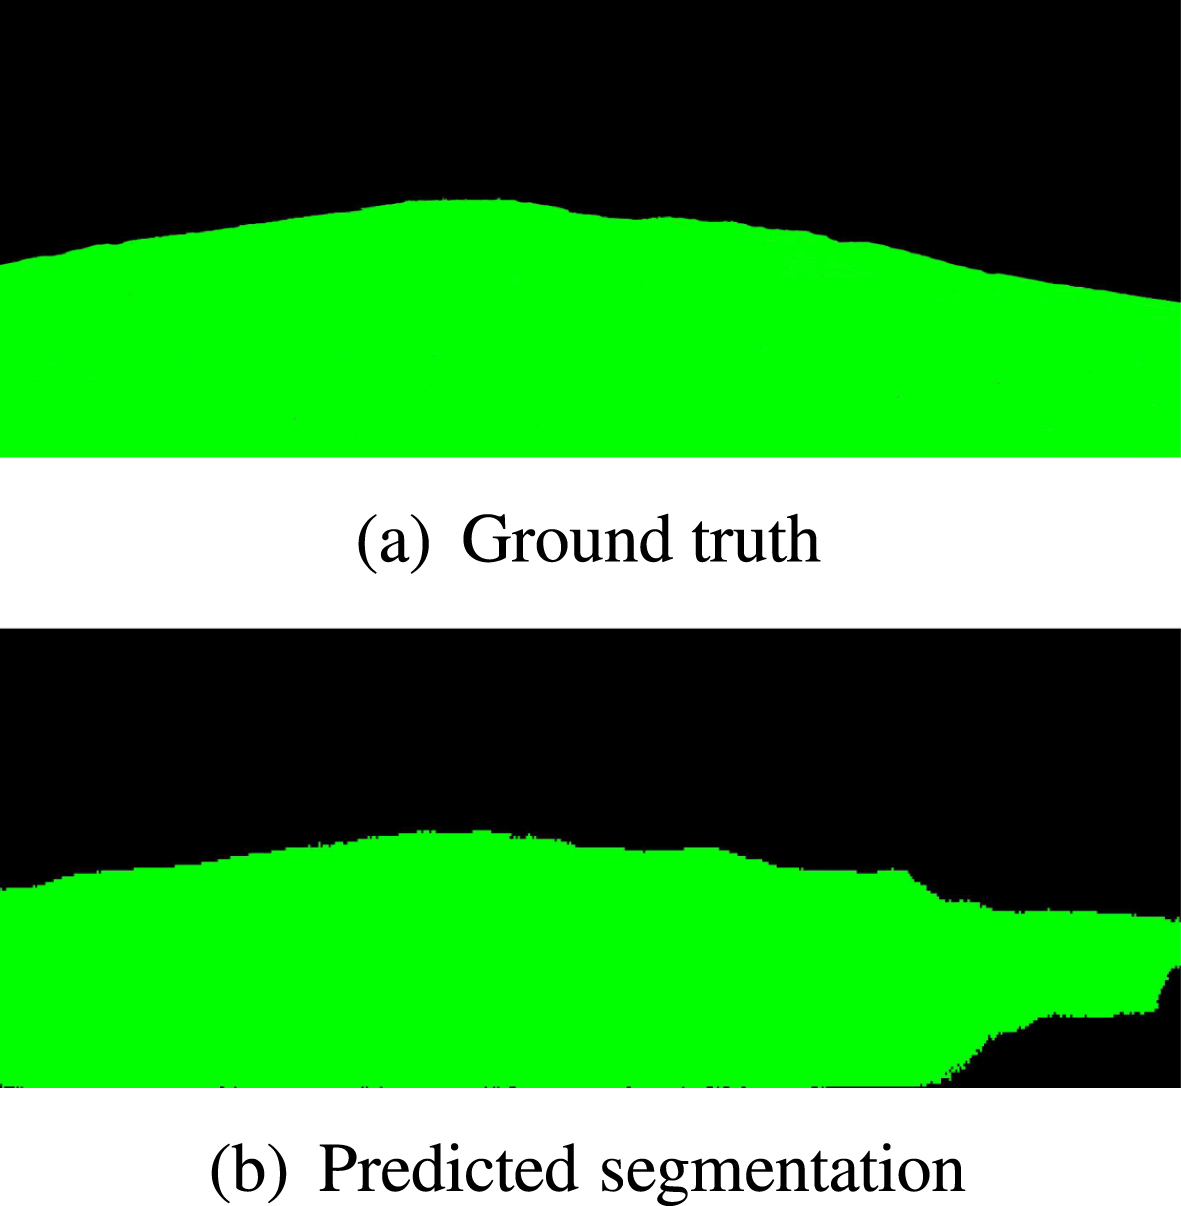
Comparison between ground truth and predicted road segmentation.
In Equation 3 and 4 TP are the true positives cases, FP the false positives and FN the false negatives. From a set of 500 stereo images, both evaluation metrics are calculated and averaged to obtain the final results. The IoU mean obtained is 91.6% while the Dice mean obtained is 93.8%. This shows that results obtained with the FCN model of semantic road segmentation shows high reliability.
The marked speed bump detection model is tested and evaluated to measure its performance by calculating the confusion matrices and evaluation metrics (precision, recall, and accuracy). Table 2 shows the numerical results obtained by the model, where the precision obtained is 84%, the recall value is 98% and the accuracy obtained is 89%. The ROC curve associated with the predictive model calculates the proportion of true positives versus the ratio of false positives, the area under the curve (AUC) is 91% (see Fig. 13). Therefore, it is shown that the model has acceptable results in the detection of speed bumps when the signs are well-marked.
Metrics to evaluate the model performance
Metrics to evaluate the model performance
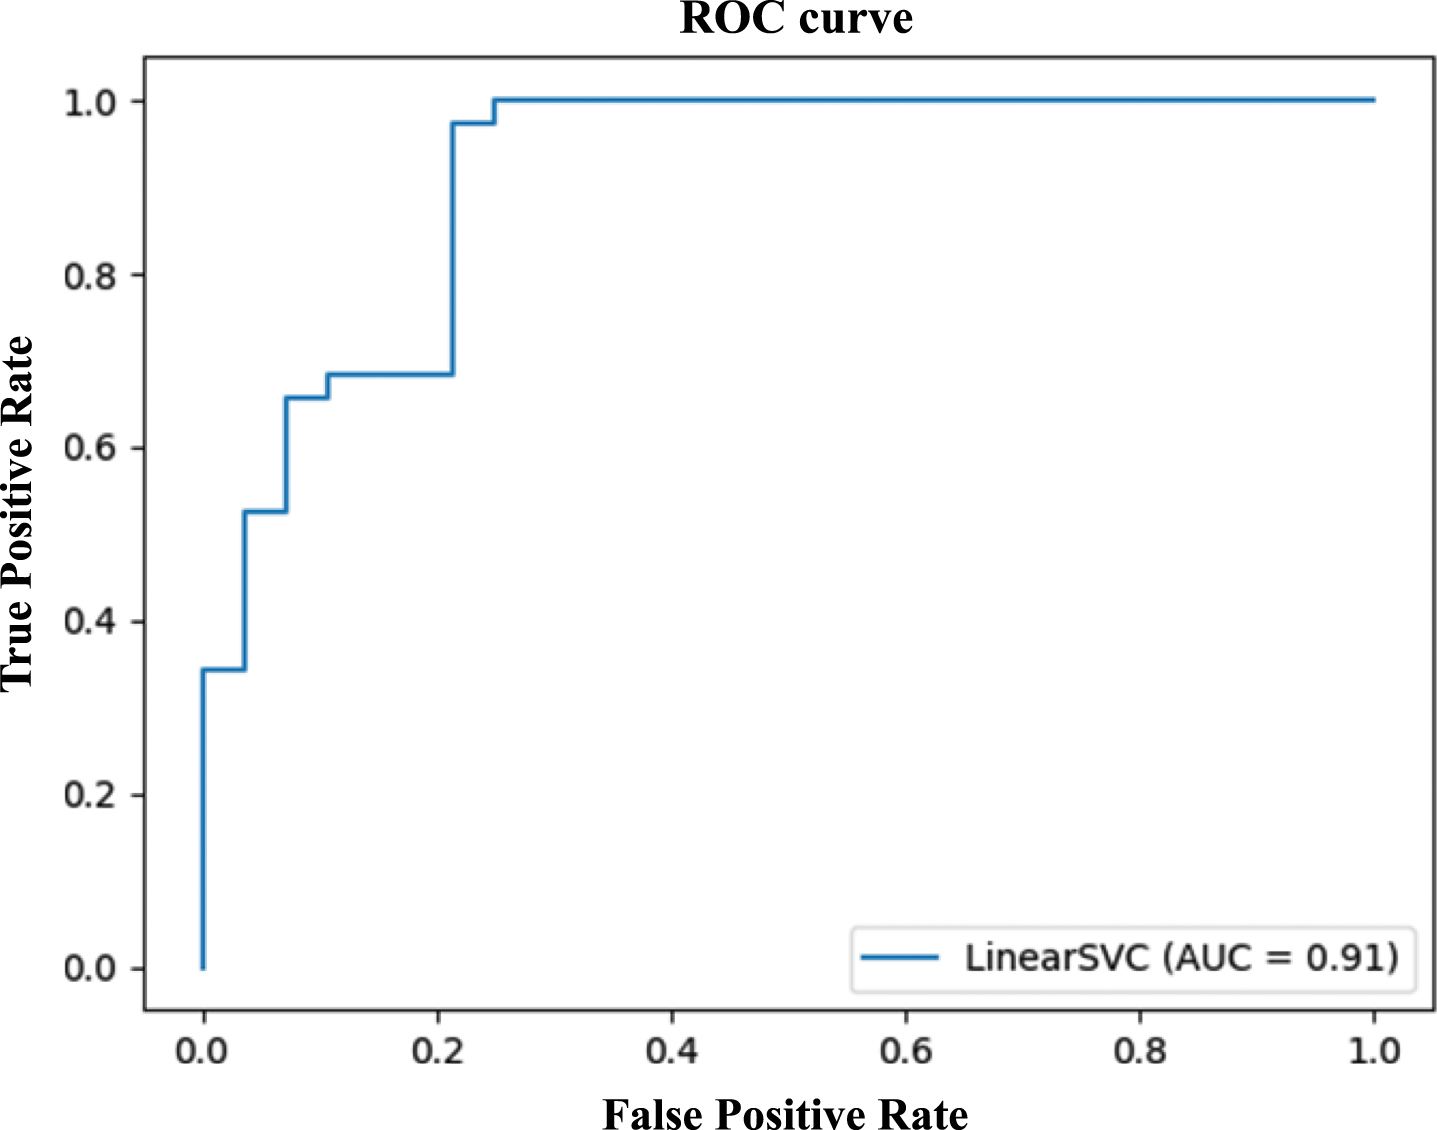
ROC curves for marked speed bump classification.
Applying camera calibration and stereo rectification generates disparity maps where color intensities indicate the depth of objects in the scene. Fig. 6 a) and b) shows two examples of the disparity map generation of roads with and without speed bumps respectively.
Fig. 7 shows results of the 3D road reconstruction through point clouds applying the stereo vision process. Point clouds are converted to triangular meshes representing road surfaces (Fig. 8). A simplification has been made to surface meshes for reduce their size while preserving their shape (see Fig. 9). The obtained meshes have been smoothed to eliminate outliers generated erroneously by the 3D reconstruction (Fig. 10).
The selected local 3D shape features based on eigenvalues are listed in Table 3 which is the feature vector. Fig. 14 shows the extracted histograms of selected features where a significant difference can be observed between the values of each mesh feature with and without speed bump.
Feature selection based on eigenvalues for 3D meshes
Feature selection based on eigenvalues for 3D meshes

3D mesh feature extraction.
According to the obtained results, the proposed methodology is able to detect speed bumps by recognition of well-marked signs and also by shape analysis of road surfaces when the signs is not marked using road image datasets of developing countries. To reduce the computational cost, a road segmentation corresponding to the ROI is applied.
It has been shown that the road semantic segmentation, using a pre-trained model of an FCN, presents results with high precision, with a mean IoU of 91.6% and a mean Dice of 93.8%, under controlled environmental conditions. It should be noted that the model has been tested with images without the restriction that the road limits are clearly marked.
There are some works that have addressed the detection of marked speed bumps with characteristics and conditions similar to those considered in this work, where approaches based on image processing (IBP), machine learning (ML) and stereo vision (SV) are applied. The work by Irhebhude et al. [22] combines the IBP and ML approaches and despite obtaining an accuracy of 100% they only consider asphalt roads; Babu et al. [5] and Devapriya et al. [16] apply an IBP approach with an accuracy of 90% and 85% respectively, however, since no machine learning algorithms are applied, the detection becomes inaccurate due to color variations on roads and lighting; Varma et al. [32] combines a stereo vision approach with deep learning where an accuracy of 97.44% is obtained. In the present work, the IBP and ML approaches are combined, obtaining an accuracy for marked SB of 89%, which is acceptable with respect to related work; unlike the related approaches, in this work various colors and road material types are considered such as: asphalt, pavement and cobblestone. Moreover, in the work of Varma et al. [32] the detection of unmarked SB is addressed where an accuracy of 93.88% SB is obtained, however, a ZED stereo camera is used which is short range and has high error outdoors. In contrast to this approach, our work uses long-range video cameras that work well in real-scale scenarios; elevation detection on surfaces is independent of the road material and is more accurate than detection by pattern recognition.
For the detection of speed bumps without marked signaling, the stereo vision process has been applied to obtain depth information. To do this, a 3D road reconstruction that have been converted into triangular meshes has been made, which are optimized to reduce the processing time by decimate to simplify the vertices of the meshes while preserving their shape. 3D meshes are smoothed to remove outliers while preserving elevations. These results can be viewed in sections 3.6, 3.7, and 3.8. A selection of the most relevant features of triangular meshes, based on eigenvalues, has been done, so that the feature vector obtained is: lineality, planarity, sphericity, curvatures, and anisotropy. Surface meshes with and without SB have been analyzed and the histogram of each selected feature has been calculated. These are the ones that have the greatest difference between both classes and therefore help to detect speed bump by elevations on surfaces.
The experiments were executed on a computer with the following characteristics: AMD A10-8700P Radeon R6 1.8 GHz processor, 8 GB RAM and Windows operating system. The average execution times for each task of Algorithm 1 are: road segmentation 0.445 sec, Image preprocessing 0.009 sec, marked SB classification 0.044 sec, disparity map generation 9.845 sec, point cloud generation 39.186 sec, surface mesh 2.986 sec, 3D mesh processing 4.327 sec where the total average time is 56.842 seconds.
This work presents a new methodology to detect both marked and unmarked speed bumps applying MUSBD algorithm for decision making of autonomous vehicles. For this purpose, stereo images with a vision system were captured. For road segmentation, a pre-trained convolutional FCN model was tested, obtaining results with high precision with an IoU mean of 91.6% and a dice mean of 93.08% were obtained. Processing techniques were applied to segment the image ROI with well-marked markings, histograms of local binary patterns were extracted, and a classification model was trained using support vector machines. The algorithm detects successfully marked speed bumps with a precision of 84%, a recall of 98%, an accuracy of 89% and an AUC of 91%.
For unmarked speed bumps, stereo vision was applied to generate disparity maps between each pair of stereo images and to make the 3D reconstruction of roads using point clouds. These points were converted to triangular surface meshes applying Delaunay triangulation and a mesh decimation was done to simplify the vertices while preserving the topology. A Laplacian smoothing was applied to triangular meshes in order to eliminate outliers. Selection and extraction of the features, that significantly help to detect speed bumps on road surface meshes, has been made and these are based on eigenvalues: linearity, planarity, sphericity, curvatures, and anisotropy.
Results obtained have an important contribution to the detection of irregularities on road surfaces that affect safety and comfort in autonomous vehicle navigation. In addition to improving existing techniques when considering real-scale environments, various types of road material and acceptable detection results. The total average time for the execution of the proposed algorithm is 56.842 seconds; these times are subject to the hardware used and can be reduced using computers with GPUs.
The future scope of the work is to consider different scenarios, mainly with poor lighting caused by bad weather or by images captured at night, applying alternative techniques when conditions are not ideal. Additionally, a predictive model will be trained for the detection of speed bumps according to the extracted features from 3D surface meshes using some classification algorithms. For that, a more exact geometric feature and based on eigenvalues of the 3D meshes selection will be considered.