
Abstract
In today’s data-rich era, there is a growing need for developing effective similarity and dissimilarity measures to compare vast datasets. It is desirable that these measures reflect the intrinsic structure of the domain of these measures. Recently, it was shown that the space of finite probability distributions has a symmetric structure generated by involutive negation mapping probability distributions into their “opposite” probability distributions and back, such that the correlation between opposite distributions equals –1. An important property of similarity and dissimilarity functions reflecting such symmetry of probability distribution space is the co-symmetry of these functions when the similarity between probability distributions is equal to the similarity between their opposite distributions. This article delves into the analysis of five well-known dissimilarity functions, used for creating new co-symmetric dissimilarity functions. To conduct this study, a random dataset of one thousand probability distributions is employed. From these distributions, dissimilarity matrices are generated that are used to determine correlations similarity between different dissimilarity functions. The hierarchical clustering is applied to better understand the relationships between the studied dissimilarity functions. This methodology aims to identify and assess the dissimilarity functions that best match the characteristics of the studied probability distribution space, enhancing our understanding of data relationships and patterns. The study of these new measures offers a valuable perspective for analyzing and interpreting complex data, with the potential to make a significant impact in various fields and applications.
Introduction
In the field of data science, the comparison and measurement of similarity or dissimilarity between different data are crucial for various applications, ranging from document classification to online product recommendation. There are various problems where it is necessary to measure the similarity of probability distributions [1–8]. The distances between the probability distributions are compared to evaluate how uncertain the predictions are. Similarly, the similarity between the distributions of features extracted from images is used in image comparison, object detection, and pattern classification. Also, in time series analysis and process monitoring, the similarity between probability distributions at various times is used to detect changes or anomalies in the behavior of the data. In recommender systems, the similarity between users’ preference distributions is compared to making personalized recommendations. Therefore, creating new similarity and dissimilarity functions is of great interest, and the present work focuses on creating new similarity and dissimilarity functions satisfying desirable properties and studying how similar these new functions are to each other. The objective of this article is to explore in detail the similarity and dissimilarity functions applied to the field of probability distributions. We will begin by establishing fundamental concepts to create new similarity functions that adhere to the property of co-symmetry. It is desirable that similarity functions reflect the intrinsic structure of the domain of these measures. Recently, it was shown that the space of finite probability distributions has a symmetric structure generated by involutive negation mapping probability distributions into their “opposite” probability distributions and back [9], such that the correlation between opposite distributions equals –1 [10–12]. The important properties of similarity and dissimilarity functions defined over a set with an involutive operation is a co-symmetry reflecting the symmetry of the set with involution operation [12]. For the probability distribution space with the involutive negation the co-symmetry of similarity functions means that the similarity between probability distributions is equal to the similarity between their opposite distributions [12]. This article delves into the analysis of five well-known dissimilarity functions [13], used for creating new co-symmetric dissimilarity functions. To conduct this study, a random dataset of one thousand probability distributions is employed. From these distributions, dissimilarity matrices are generated that are used to determine correlations between dissimilarity functions. The hierarchical clustering is applied for a better understanding of the relationships between the studied dissimilarity functions. This methodology aims to identify and assess the dissimilarity functions that best match the characteristics of the studied probability distribution space, enhancing our understanding of data relationships and patterns. The study of these new measures offers a valuable perspective for analyzing and interpreting complex data, with the potential to make a significant impact in various fields and applications. In Sections 2 and 3, we give a short introduction to negations of probability distributions and to properties of similarity and dissimilarity functions. In the following section, we use the method of developing new dissimilarity functions that comply with the property of co-symmetry. These advanced functions will enable us to accurately and reliably quantify the similarity or dissimilarity between different probability distributions. Finally, we will conduct an empirical analysis using a dataset containing one thousand probability distributions that meet the properties mentioned in [12]. Through scatter plots, we will compare the created similarity and dissimilarity measures. This analysis will provide a profound insight into the correlation between different measures and allow us to determine the effectiveness and relevance of the proposed new functions. Overall, this article aims to make a significant contribution to the field of data science and probability distributions, providing more sophisticated and effective tools for the comparison and analysis of complex data. This could have a significant impact in various application areas.
Involutive negation of probability distributions
The concept of a negation of a probability distribution was introduced by Yager [14] and considered in many works [9–11, 15–24]. The papers [9, 15, 16] studied the general properties of negations. Suppose P = (P1, …, P
n
) is a probability distribution defined on an ordered set of alternatives X = (x1, …, x
n
), where P
i
is a probability of x
i
and

The negation of a probability distribution introduced by Yager [14] is generated by the negator

It is observed that this negation generally does not comply with the involutivity property


We will obtain neg
Y
(neg
Y
(P)) = P = (P1, …, P
n
) when
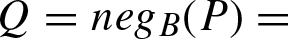
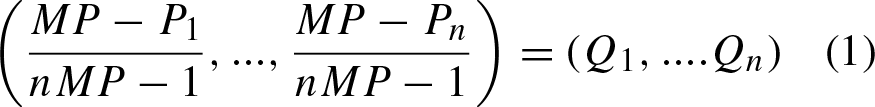
An involutive negator of probability distributions was introduced by Batyrshin [9] as follows:

Let us show that neg
B
is an involutive negation for any probability distribution P = (P1, …, P
n
), i.e. neg
B
(neg
B
(P)) = P . Denote


Finally, obtain involutivity of neg B :
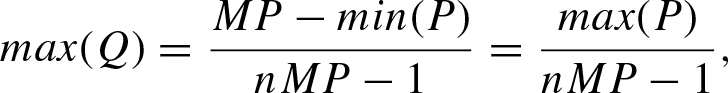
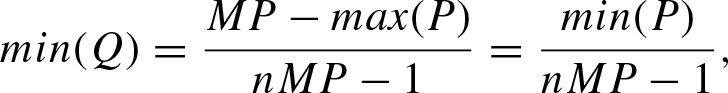
= P
The involutive negation neg B maps probability distributions P to their “opposite” distributions Q = neg B (P) and back: neg B (Q) = neg B (neg B (P)) = P . Such mapping defines a symmetry of the space of probability distributions, establishing one-to-one correspondence between probability distribution and their negations. It is reasonable to reflect this property in the definition of similarity and dissimilarity measures of probability distributions such that the similarity between probability distributions is equal to the similarity between their negations. Similarity and dissimilarity measures satisfying this property are called co-symmetric and considered below. Suppose P = (P1, …, P d ) and Q = (Q1, …, Q d ) are two probability distributions. Consider similarity S (P, Q) and dissimilarity D (P, Q) functions taking values in the interval [0, 1] and satisfying the following properties:
Symmetry:

Reflexivity:
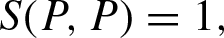
Irreflexivity:
Co-symmetry:


Often, depending on the tradition or the method of their construction, they are considered separately. For example, in [27], co-symmetric similarity and dissimilarity functions are used for the construction of correlation functions over the set of real numbers with involution operation N (x) = - x. In this case the involution reflects the symmetry between positive and negative numbers.
Construction of co-symmetric dissimilarity and similarity functions
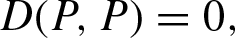
The paper [13] considers some popular similarity measures and distances between probability distributions. Here we propose methods for construction from them co-symmetric similarity or dissimilarity functions. Let D (P, Q) be a symmetric and irreflexive dissimilarity function (distance). Consider equation:
It is easy to verify that this function is a symmetric, irreflexive, and co-symmetric dissimilarity function that can be used as a co-symmetric distance between probability distributions.
General methods of co-symmetrization of similarity and dissimilarity functions can be found in [28].
Distances
Table 1 presents the classical distances between probability distributions mentioned in [13]. It is easy to see that these distances are symmetric and irreflexive dissimilarity functions. Using Equation (2) we will obtain from them co-symmetric dissimilarity functions that can be used as new distances between probability distributions. Some of these distances were used in the construction of correlation functions [29]. Table 2 shows co-symmetric distances obtained from distances from Table 1 using Equation (2).
Original Distances that were considered for this analysis\label tab1

Original Distances that were considered for this analysis\label tab1
New distances created from Equation (2) and the original distances

Taking a data set composed of one thousand randomly generated probability distributions, each with ten entries, we will proceed to construct dissimilarity matrices for the five new distances and the five original distances. Next, with these matrices of size 1000×1000, each of them is transformed into a 1x 499,000 vector; with these vectors, scatter diagrams are created to compare the different distances.
This is done by taking, for example, the vector associated with the dissimilarity matrix of the Soergel distance and scatter plots are created taking as the “x” axis the vector associated with the Soergel dissimilarity matrix and the “y” axis to each of the associated vectors for the original and new distances. This analysis will allow us to determine which distance has the greatest correlation when comparing all the distances generated. By doing so, we can select the most appropriate similarity metric for our data set, giving us a better understanding of the relationships between probability distributions.
Then we will calculate the correlation using the Pearson coefficient for the compared distances. This measure will offer more quantitative insight into how the distances relate to each other and help validate the results obtained in the scatter plots.
A dendrogram is a tree structure that represents the hierarchical similarity between the elements. To construct the dendrograms, each of the original and new similarity matrices is used as data, taking the lower triangular matrix for each distance, and transforming this data to a single vector of size 1×499,000, the union of these vectors forms our new set of data, hierarchical clustering is applied using the average as a measure of similarity. It is important to note that a scatter plot with points close to an upward diagonal line would indicate that the distances obtained using Equation (2) have a high correlation. On the other hand, if the points are scattered and do not follow a clear trend, it could indicate that the obtained distances are less correlated with the original ones.
In conclusion, this process of analysis and comparison will enable us to select the best similarity metric for our dataset and gain a deeper understanding of the relationships and similarities among the probability distributions in our dataset.
Results
Three methods were used to measure the similarity between the dissimilarity functions that were created as well as the new ones, for this an exhaustive comparison was made between each dissimilarity function with all the other dissimilarity functions, whether new or original, these methods are, generating scatter plots, calculating the Pearson correlation coefficient and constructing dendrograms to obtain a comprehensive perspective of existing relationships and patterns. The use of scatter plots allows us to graphically see how these distances are related, which can be seen in Figs. 1, 2 and 3, however the use of Tables 3, 4, 5 gives us the exact value to calculate the Pearson coefficient for distances. When observing Fig. 1 and Table 4, it is observed in the graphs that the points form almost a line and the values of the Pearson coefficient are greater than 0.99 when the distances are compared, Distance Sørensen vs. Distance Soergel and Distance Jaccard vs. Distance Dice, which means there is a strong similarity between these distances. In the same way for Fig. 2 and Table 5, it is observed in the graphs that the points form almost a line and the values of the Pearson coefficient are greater than 0.98 when the distances are compared, Distance Sørensen Co-Avg vs. Distance Soergel Co-Avg and Distance Jaccard Co-Avg vs. Distance Dice Co-Avg, which means there is a close similarity between these distances. It can be seen that when the original distances are compared with themselves, for each of the analyzes very similar values are obtained.

Upper triangular matrix of correlation plots between two original dissimilarity measures.

Upper triangular matrix of correlation graphs between two co-symmetric dissimilarity measures, obtained from Equation (2).

Upper triangular matrix of correlation graphs between two dissimilarity measures, the original ones vs those obtained from Equation (2).
Pearson coefficient of comparing original distances with new distances

Pearson coefficient of comparing original distances with original distances

Pearson coefficient of comparing new distances with new distances

When comparing the Co-Avg distances with themselves, they inherit behavioral patterns, what is obtained are distances that they give us results very similar to their originals, however with the new Co-Avg distances the advantage is that they comply with the property of Co-symmetry. When comparing the original distances with the Co-Avg distances, it is observed in Table 3 that those with the most similarity are Distance Jaccard vs. Distance Euclidean Co-Avg.
Dendrograms are especially useful in cluster analysis, where similar data are grouped into sets called clusters. By looking at a dendrogram, you can easily identify groups and similarities between elements in the data set. The closer two elements are on the dendrogram, the greater their similarity.
In Fig. 4 notice three dendrograms that were constructed for when only the original distances are compared, for when the new Co-Avg distances are compared and when the original ones are compared with the Co-Avg distances. The results observed are the following: the distances that have the greatest correlation are the Sørensen Distance with the Jaccard Co-Avg Distance and the Euclidean Distance with the Sørensen Co-Av Distance, this when comparing the original distances with the new ones. The distances that have the most similarity or are most similar are Sorensen Distance with Dice Distance and Soergel Distance with Jaccard Distance. Those that have the greatest similarity are Soergel Co-Avg Distance with Jaccard Co-Avg Distance and Jaccard Co-Avg Distance with Dice Co-Avg Distance. However, this does not correspond to the analysis carried out with the methods of scatter plots and tables.

Dendrogram to compare the original dissimilarity functions and those created from Equation (1).
Five dissimilarity functions were constructed that complement the co-symmetry property. Based on the analysis with a thousand probability distributions, the similarities that exist between the original and new dissimilarity functions were compared with three different methods. These were compared separately and also together. It is observed that when comparing these dissimilarity functions there is a greater correlation in Distance Sørensen vs. Distance Soergel, and Distance Jaccard vs. Distance Dice. At the same time, when the Co-Avg dissimilarity functions are compared, it is obtained that these have a greater correlation in Distance Sørensen Co-Avg vs. Distance Soergel Co-Avg, and Distance Jaccard Co-Avg v. Distance Dice Co-Avg which is observed both in the scatter plots Figs. 1 and 2 and with Tables 4 and 5. But the same is not obtained in the dendrograms, therefore we can say that the methods with scatter plots and tables they are more trustworthy. Now it is also obtained that when comparing original and Co-Avg dissimilarity functions there is a greater correlation in Distance Jaccard vs. Distance Euclidean Co-Avg, on the one hand the Jaccard distance does not comply with the co-symmetry property, however the Euclidean Co-Avg distance does. With this analysis, methods were compared to determine which similarity functions were most similar to others, since the original distances have already been used in different domains, making this comparison helps us understand the behavior of the new distances and their future applications.
Acknowledgments
This work was partially supported the Government of Mexico through the grant A1-S-47854 from CONACYT, Mexico, by the proyects 20231387, 20232138, 20232080, 20231567 from the Secretarıa de Investigacion y Posgrado del Instituto Politecnico Nacional, Mexico, and by the program of developing the Scientific-Educational Mathematical Center of Volga Federal District. The authors acknowledge CONACYT for the computing resources provided through the Platform of Deep Learning for Language Technologies of the Supercomputing Laboratory of INAOE, Mexico, and acknowledge the support of Microsoft through the Microsoft Latin America Ph.D. Award.