



Abstract
This study underscores the crucial role of image preprocessing in enhancing the outcomes of multimodal image registration tasks using scale-invariant feature selection. The primary focus is on registering two types of retinal images, assessing a methodology’s performance on a set of retinal image pairs, including those with and without microaneurysms. Each pair comprises a color optical image and a gray-level fluorescein image, presenting distinct characteristics and captured under varying conditions. The SIFT methodology, encompassing five stages, with preprocessing as the initial and pivotal stage, is employed for image registration. Out of 35 test retina image pairs, 33 (94.28%) were successfully registered, with the inability to extract features hindering automatic registration in the remaining pairs. Among the registered pairs, 42.42% were retinal images without microaneurysms, and 57.57% had microaneurysms. Instead of simultaneous registration of all channels, independent registration of preprocessed images in each channel proved more effective. The study concludes with an analysis of the fifth registration’s resulting image to detect abnormalities or pathologies, highlighting the challenges encountered in registering blue channel images due to high intrinsic noise.
Keywords
Introduction
Image registration is crucial in many image applications, such as medical imaging, computer vision, and remote sensing. This process involves combining the information from two or more images so that the resultant image contains a richer data set. Image registration is essential in tasks that require combining information from various data sources, such as image fusion, change detection, and multichannel image restoration. There are two primary types of image registration techniques: area-based and feature-based. Over the last fifteen years, several surveys on the use of image registration in different applications and using various methodologies have been published [1–9]. There is limited literature on image registration techniques that are specific to eye fundus image applications. Furthermore, many recent multimodal retinal image registration techniques do not use exact optical and fluorescein angiography (FA) images. A paper by Jan et al. [10] presents an overview of the image analysis activities of the Brno DAR group in the medical application area of retinal imaging. The paper briefly describes preprocessing steps such as illumination correction and signal-to-noise ratio enhancement by registered averaging. Also, it presents mono- and multimodal registration methods developed for specific types of ophthalmological images. In this study, we aim to register eye fundus images using optical and fluorescein angiography images.
Several papers have presented registration algorithms for retinal images.
Benvenuto and colleagues [11], proposed a methodology that seamlessly integrates Convolutional Neural Networks and Spatial Transformation Network into a cohesive pipeline. This unified framework employs a similarity metric to assess image disparities, enabling image alignment without the need for ground-truth data. Once the model completes its training, it demonstrates remarkable efficiency by accomplishing one-shot registrations with just a pair of fundus images as input. Rivas and colleagues [12], introduce a groundbreaking approach to register color fundus images, departing from traditional methods that relied on classical approaches for detecting domain-specific landmarks. Employing deep learning methods for detecting these highly specific, domain-related landmarks and utilizes a neural network to identify bifurcations and crossovers of retinal blood vessels, unique in arrangement and location to each individual’s eyes.
Benvenuto and colleagues [13], introduces a Deep Learning (DL)-based framework for eye fundus registration. The methodology combines a U-shaped fully convolutional neural network with a spatial transformation learning scheme. A reference-free similarity metric facilitates registration without relying on pre-annotated or artificially created data. Once trained, the model accurately aligns pairs of images captured under various conditions, accommodating anatomical differences and low-quality photographs. In comparison to alternative registration methods, our approach attains superior registration outcomes by inputting the desired pair of fundus images without the need for additional annotations or artificial data. Liu and colleagues [14], propose a end-to-end method with jointly trainable keypoint detector and descriptor. Their model is trained semi-supervised, using a network to detect keypoints on the vascular tree. To solve the incompleteness of manual labeling, in this work is proposed a progressive keypoint expansion method to enrich the keypoint labels at each training epoch. Halldorsson and colleagues [15] and Laaksonen and colleagues [16] proposed registration methods for multispectral retinal images. Legg and colleagues [17] introduced a two-stage non-rigid registration process using a similarity measure called Feature Neighborhood Mutual Information, which efficiently incorporates spatial and structural image properties not typically considered by mutual information. This method achieved greater registration accuracy compared to existing methods while maintaining efficient computational runtime. Bernardes, Guimarães, and colleagues [18] proposed a fast fully-automatic algorithm to co-register retinal fundus images from multiple modalities, including optical coherence tomography, color fundus photography, and fluorescein angiography imaging. They showed that the proposed algorithm could handle different vascular network detail, contrast, and resolution levels. Matsopoulos and colleagues [19] presented an automatic scheme to register retinal images, which was tested in a clinical environment using 26 pairs of FA and Indocyanine Green Chorioangiography images with corresponding Red-Free retinal images. These results showed the superiority of combining genetic algorithms with affine and bilinear transformation models.
One highly relevant paper to our goal is [20], which proposes an adaptive fidelity algorithm for automated multi-modality image feature detection, registration, and fusion. The new fusion method incorporates the Adaptive Fidelity Exploratory Algorithm (AFEA) and the Heuristic Optimization Algorithm (HOA), which allows for automatic adaptation from frame to frame with tunable thresholds. The algorithms are tested on two ophthalmologic modalities of nonhuman primate eyes - angiogram grayscale and fundus true color retinal optic nerve head (ONH) images. Control points are detected at the vessel bifurcations using the AFEA algorithm and then adjusted at the sub-pixel level using the HOA algorithm to maximize the objective function Mutual-Pixel-Count (MPC). This algorithm can easily extend to human or animal 3D eye, brain, or body image registration and fusion.
Meanwhile, over the last decade, significant progress has been made in automatic retinal image registration using novel feature descriptors. For instance, [21] introduces the partial intensity invariant feature descriptor (PIIFD), a highly distinctive local feature descriptor, and the Harris-PIIFD framework, a robust automatic retinal image registration method. The PIIFD descriptor is symmetric to contrast, invariant to image rotation, and partially invariant to image intensity, affine transformation, and viewpoint/perspective changes. On the other hand, [22] uses PIIFD and introduces a uniform robust scale-invariant feature transform (UR-SIFT) that is robust against significant content, appearance, and scale changes between color and other retinal image modalities like FA. The UR-SIFT-PIIFD outperforms the Harris-PIIFD and similar algorithms regarding efficiency and positional accuracy over a dataset of 120 pairs of multimodal retinal images.
This paper employs two applications to illustrate the significance of image preprocessing in achieving successful multisource image registration. The applications focus on straightforward registration success. In one instance, a series of carefully chosen preprocessing tasks is applied to each type of retina image, specifically focusing on radiometric results (gray-level) modifications. In the other instance, image fusion is performed directly based on accumulated experience.
The paper is organized as follows. Section 2 describes the problem statement related to the specific biomedical application addressed by our research. Section 3 presents the proposed retina image registration methodology. Section 4 showcases the results of retina image transformations for registration using our methodology at different stages. Finally, in Section 5, we provide our conclusions.
Detecting microaneurysms in retina optic color images
Microaneurysms are tiny blood droplets that appear at the end of the retina’s venues and arterioles, and their presence is the first symptom of diabetic retinopathy. However, detecting microaneurysms in optic eye fundus images can be challenging, especially during the early stages of diabetic retinopathy when they are too small to be observed. Therefore, there is a need to develop a reliable method for early detection.
During routine examinations, doctors may inject a small amount of fluorescein sodium into the patient to help make microaneurysms more visible. This injection causes the patient’s blood to become opaque, making it easier to detect microaneurysms in fluorescein angiography (FA) images. In the images, microaneurysms will appear as minor light points.
A non-invasive method for detecting microaneurysms in the retina would be ideal, but it is a challenging task. Microaneurysms are presented as small dark red dots randomly distributed in the optical retina image and are not directly visible. Even if visible, they appear as a few pixels.
Figure 1 illustrates the difficulty of detecting microaneurysms in optic color images of the retina. Panel A shows an optic color image of an eye fundus, where the microaneurysms are not visible. Panel B shows the same image in black and white, or the green plane of the color image transformed to a black and white image, where microaneurysms are also not visible. Hard exudates, the second symptom of diabetic retinopathy, are the only clear objects in these two images. Panel C shows an FA image of the same eye fundus, where microaneurysms can be visualized as minor bright points. The vascular network and the optic papilla also appear bright, while the luteal macula, surrounded by the vascular network, appears dark. Developing a reliable method for the early detection of microaneurysms in retina optic color images is crucial for the early diagnosis and management of diabetic retinopathy.

Eye fundus images: A) Optic color image, B) Grayscale optic image, and C) Fluorescein Angiography image.
To summarize, our laboratory is currently researching automatically comparing the location and count of microaneurysms in optic retina images and fluorescein retina images of patients with diabetic retinopathy. However, due to the differing radiometric characteristics of the images, a manual comparison of the results was necessary. Therefore, retina image registration is necessary to compare the microaneurysms detected in both types of images automatically.
In this paper, we based our image registration methodology on scale-invariant feature transform (SIFT) descriptors [23] composed of the following four steps: feature detection, feature matching, adjustment of characteristics, and transformation. The presented solution does not include any structural analysis but rather is sensitive to the intensity changes introduced, for instance, by noise, varying illumination, or by using different sensor types or images from different provenance. The stages of proposed image registration are image preprocessing, feature detection, correspondences and adjusting, and image transformation.
Image preprocessing
Registering the two types of retina images was impossible due to their significant differences in gray-level characteristics. Therefore, a preprocessing stage was necessary to make similar the corresponding type of objects in optical and FA images, such as the optical disk, luteal macula, and the venous and arterial vascular networks. The proposed preprocessing aims to enhance the similarity of gray levels present in both images, especially those of the retinal vascular network, which is the most distinctive element in the image.
Figure 2A) illustrates the optical retinal image preprocessing steps, which include: 1. Median filtering to adjust the gray levels of pixels that have a significant absolute difference concerning neighbor pixels (outliers). 2. Histogram equalization to enhance the image contrast. 3. Channel splitting to separate the image channels. 4. Green channel selection, which has been shown to provide better contrast for retinal vessel segmentation. The FA retinal image preprocessing consists of median filtering followed by negative complementation, as shown in Fig. 2B).
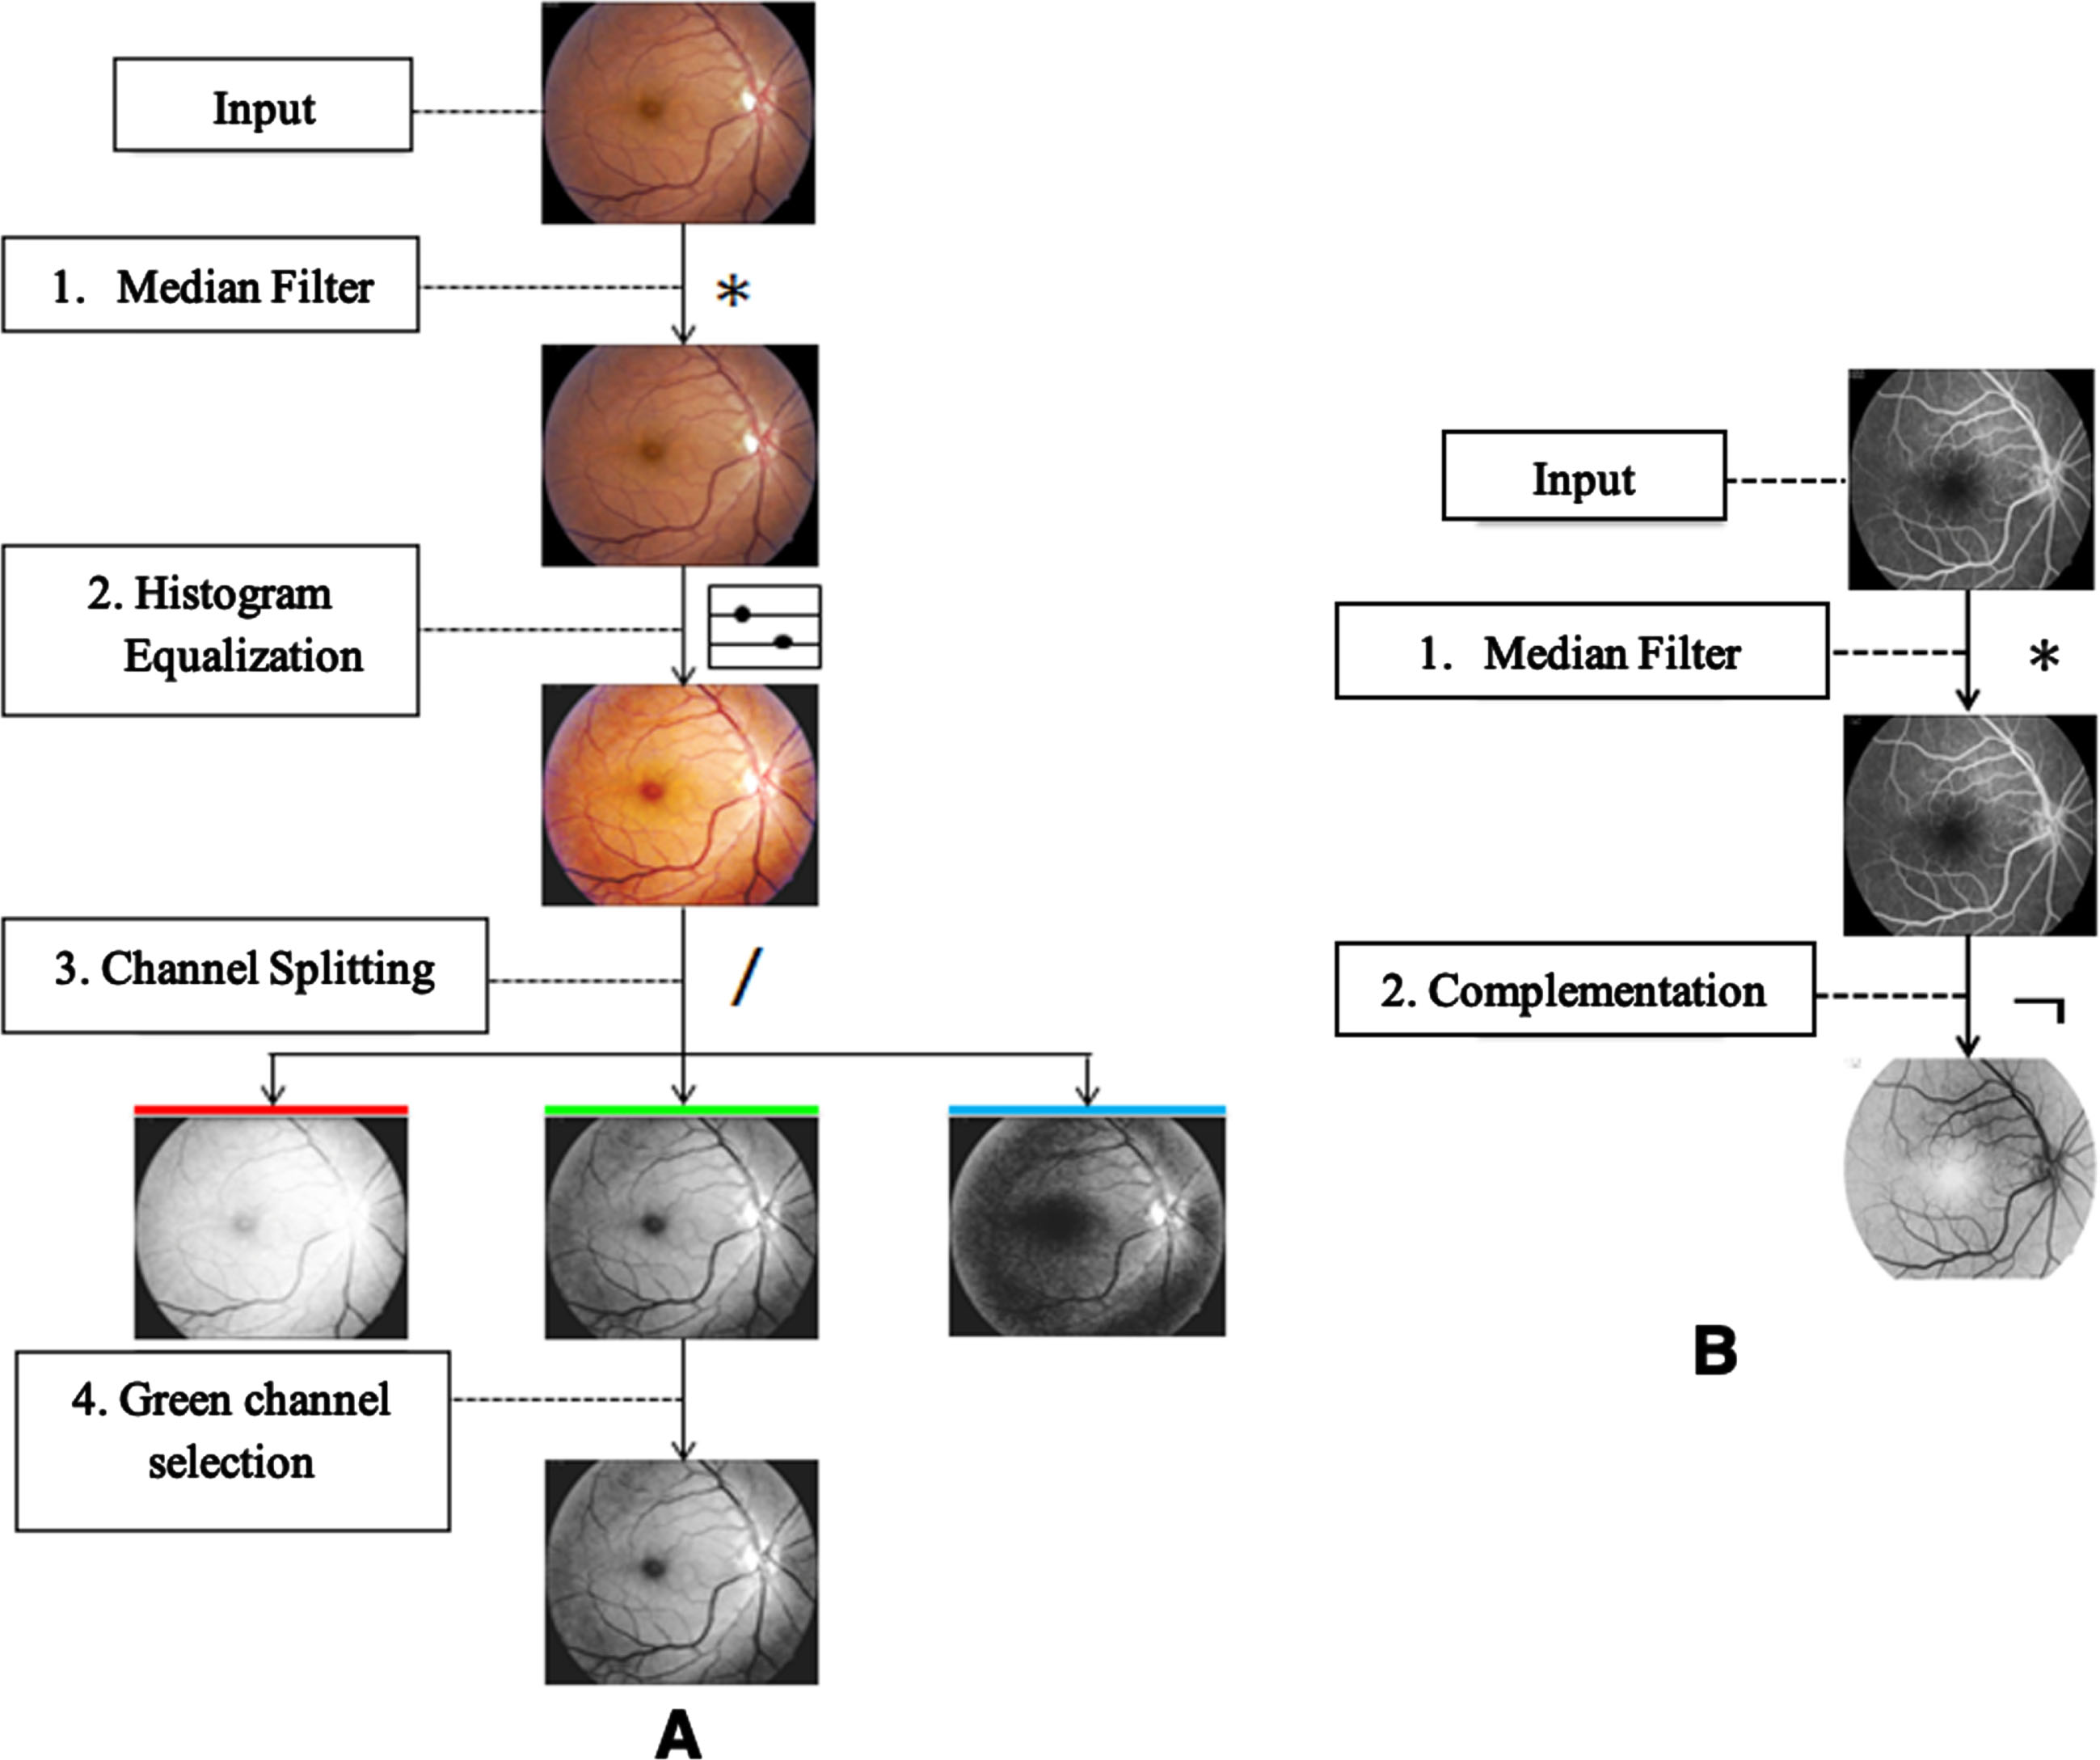
Block diagrams of preprocessing: A) optical image preprocessing; B) FA image preprocessing.
The feature detection step aims to identify key points or characteristics in the images that enable finding correspondences between them. In this study, we used a feature transformation that is scale-invariant, specifically, the scale-invariant feature transform (SIFT). The SIFT process involves detecting key points in a space generated by the difference of the Gaussian algorithm. The steps for obtaining the key points and their descriptors are as follows: Generating the scale space and detecting key points. Assigning coordinates, angle, and scale to key points. Defining descriptors.
The key points of an object have a position represented by (x, y) and a scale denoted by the value of s. These can be assigned to different views of the same object. To detect key points, stable features are searched for using a scale space representation as described in the work of Lowe [23]. The scale space representation is obtained by applying a cascade of Gaussian filters with a convolutional Gaussian kernel for different values of the standard deviation and then calculating the difference of Gaussians (DoG) of two consecutive scales Equation (1):

SIFT frames (key points) are extracted based on local extrema (peaks) of the scale space representations D (x, y, σ). Specifically, the local extrema are identified as all elements whose 3 × 3 ×3 neighbors in the scale space representations have the most minor or most significant values. We identify maximums and minimums to detect key points in the scale space by comparing each pixel to its 26 neighboring pixels belonging to the upper, current, and lower scales, as shown in Fig. 3 (left). A pixel is considered a key point only if it is greater or lower than those in the neighboring scales.
To obtain the most accurate location of the full-resolution key points, especially in lower-resolution scales, we propose to interpolate the local extrema using quadratic interpolation. The key points detected on the optic retina image are shown in Fig. 3 (right) as green circles of different sizes. The size of the circle indicates the scale where a particular point disappears: smaller circles represent features that disappear from the initial scales. In comparison, larger circles represent features that disappear in the upper scales of the scale space representation.
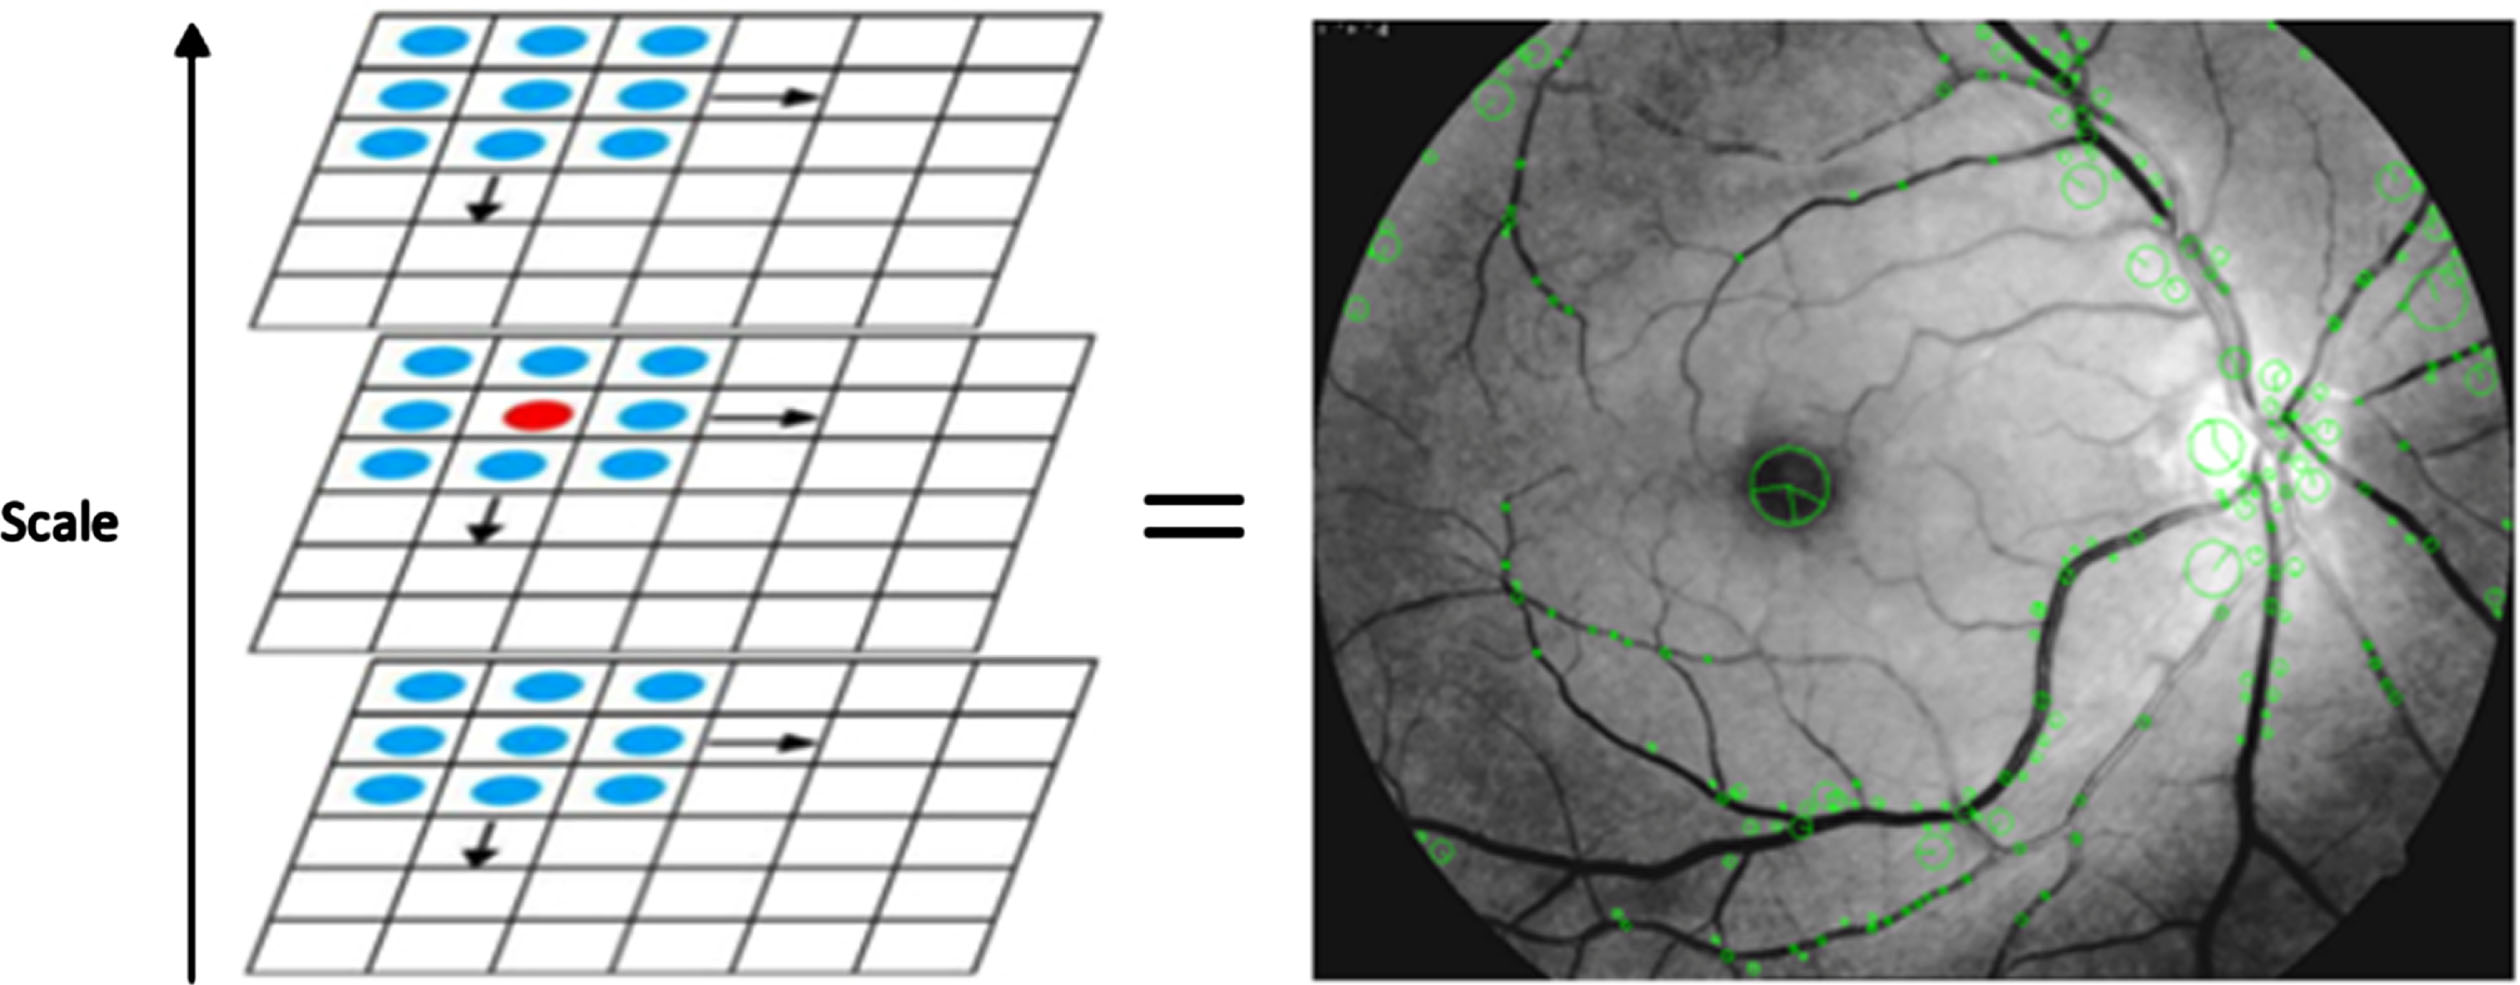
Key Point Detection Using Scale-Invariant Feature Transform (SIFT).
During the feature detection process, the coordinates (x, y) and the key point parameter scale σ are identified and assigned. The next step is to determine the magnitude and direction of the gradient of each key point.
In order to achieve highly robust key points, it is essential to eliminate key points with low contrast. The standard procedure assumes key point discarding if the second-order Taylor [24] expansion of D (x) is less than 0.03. However, we propose to filter them by applying a preset threshold of a given percentage obtained from practice (typically 2%) related to the absolute values of the scale space function D (x, y, σ) of each peak. We also eliminate peaks that are too flat according to the standard SIFT algorithm.
Another crucial characteristic of a key point is its orientation. After filtering the key points, orientations are assigned to the remaining key points. A histogram of the gradient orientations is calculated around the key point within a Gaussian window with a standard deviation of 1.5 times larger than the scale σ of the key point to determine the orientation of a key point. The histogram is normalized concerning its maximum (mode). In addition to the most extensive mode, the other three modes, whose amplitude is within 80% of the most significant mode, are selected and returned as additional orientations [25].
This process is illustrated in Fig. 4, where an orientation (angle) and scale are assigned to a key point. As a result, a key point matrix containing the parameters x, y, θ, σ of each key point (coordinates, angle, and scale) is formed.

Assigning position, scale, and orientation of the key points, using a Gaussian windowing method.
A descriptor for each key point is defined based on the histogram of gradients at a specific scale following the standard SIFT algorithm. At each pixel, the gradient is considered part of a vector consisting of the pixel location and gradient orientation, forming a three-dimensional characteristic. The samples are weighted with the gradient norm and accumulated in a 3-D histogram. Additionally, the gradient is normalized by a Gaussian function to give more importance to the central descriptor elements [25]. The final output of this stage is a set of compound features for each x, y, θ, σ coordinate, with one descriptor associated with each key point:
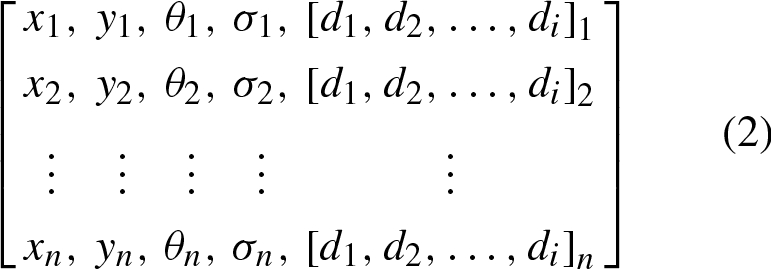
Once the SIFT descriptors for both the test and reference images are obtained, the next step is to establish correspondences, which involves two discriminating procedures. The first procedure uses the Euclidean distance and the k-d tree algorithm [26, 27] as similarity measures. It involves measuring the descriptors associated with the key points to discriminate some features and identify the most similar descriptors. The second procedure follows a voting procedure using the Generalized Hough Transform algorithm [28], which selects only the consistent characteristics, that is, those characteristics that are present in both the test and reference images. The Generalized Hough Transform converts the problem of finding the model’s position into a problem of finding the transformation parameters that map the model within the image. In order to achieve generalization, the representation r = x, y, θ, σ is considered. As a result, the best set of parameters is found for a given object shape, including straight lines. Finally, the feature descriptors are adjusted using the least squares method [23]. This results in finding the affine transformation matrix (Equation 3):
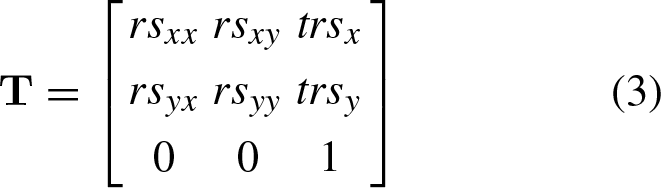
Where the terms rs js represent the angle and the scale factor in the transformations, and the elements trs x or trs y are the translation coordinates.
After obtaining the transformation matrix
Results of retina image registration using the proposed methodology
The proposed image registration methodology was evaluated on 26 pairs of real optic and fluorescein images with and without microaneurysms. The registration error was computed using the root mean square error between the set of consistent features in both the test and reference images. The registration was attempted in both directions, with the optic image as the test image and the FA image as the reference, and vice versa. However, in some cases, registration was impossible due to the poor quality of one or both images. Figure 5 illustrates the reference FA image, the transformed optic image, and the resulting registered image. The registered image demonstrates high alignment between the vascular networks and other features in the test and reference images, resulting in a sharper and clearer image.
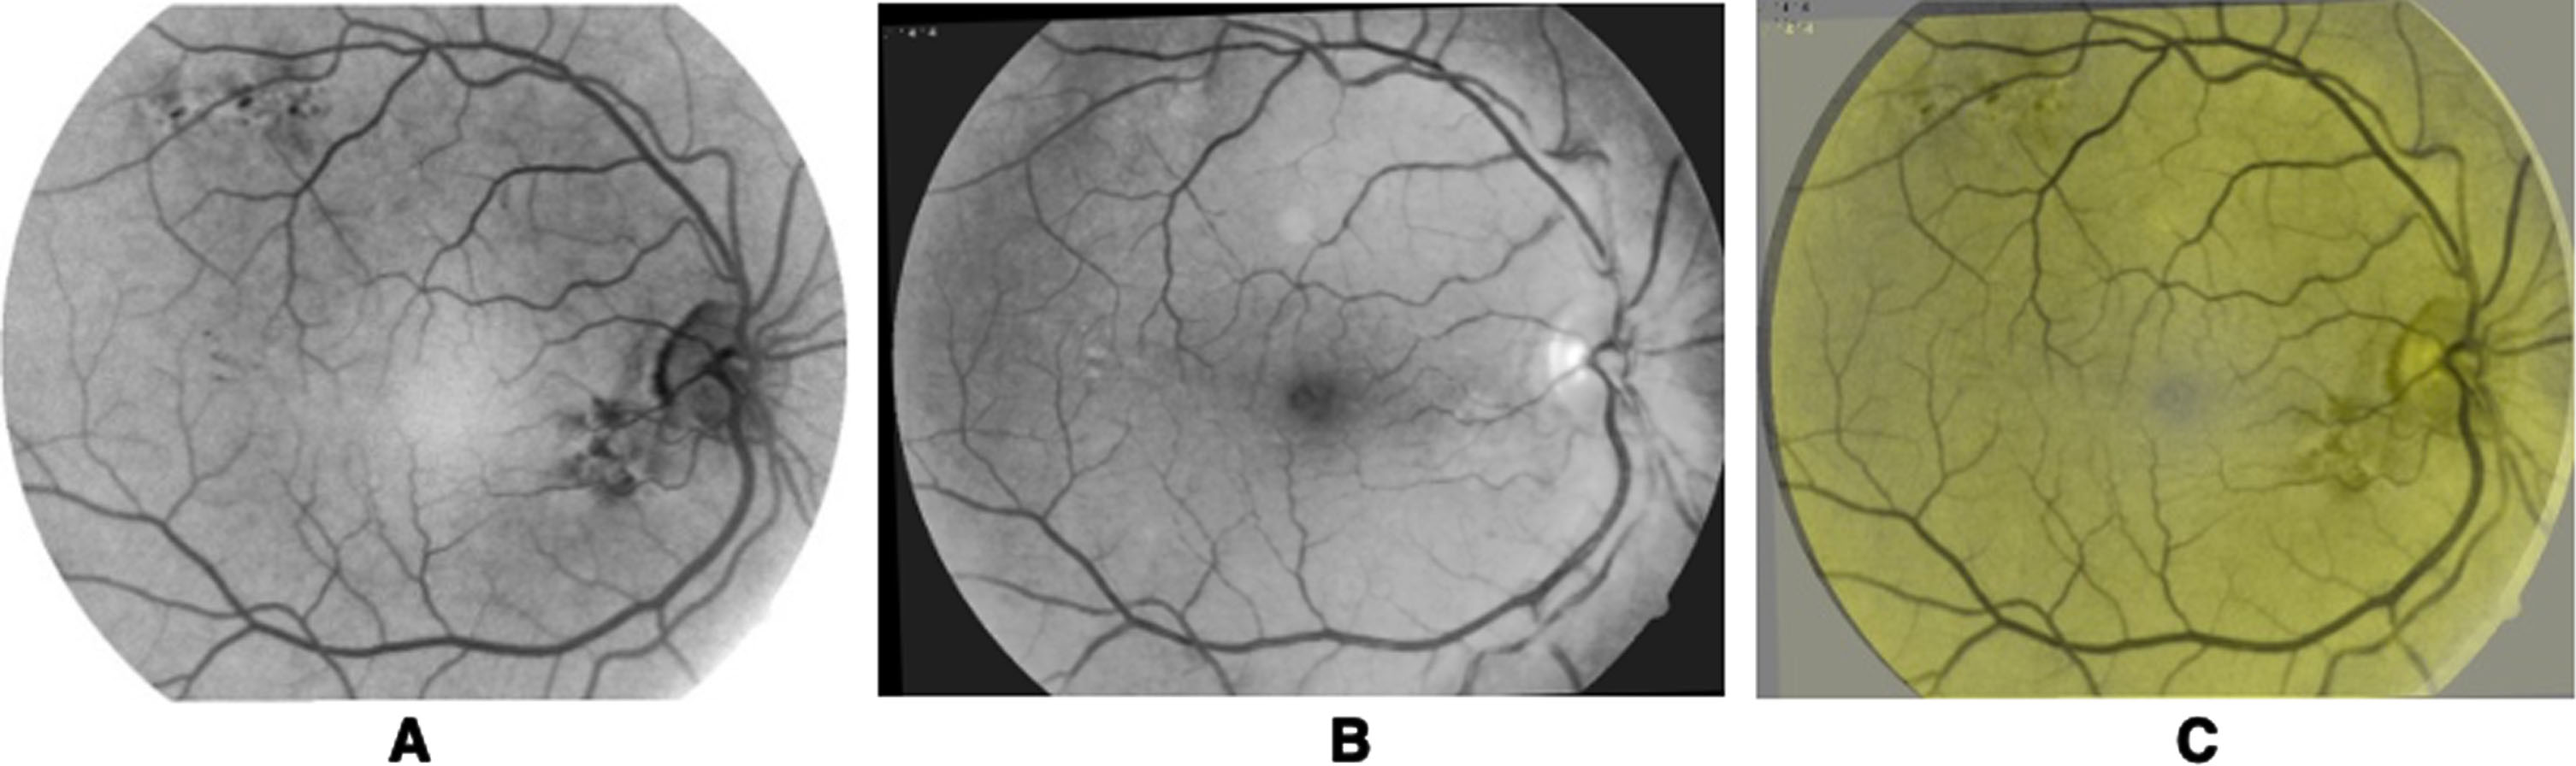
A) Reference image, B) Transformed image, C) Registered image.
Figure 6 displays the graph of root mean square errors calculated from the entire set of consistent features used for image registration. The errors suggest that, on average, each pixel in the registered image is positioned one pixel away (0.96888 pixels, to be precise) from the corresponding pixel in the reference image. Furthermore, from the graph, it is possible to see that the positions of the original 16 consistent features obtained from the test image (indicated by the green triangles) were successfully moved back to their corresponding positions inside the red circles, which represent the location of these features in the reference image after their transformation (indicated by the blue asterisks).
In this example, we considered the FA image to be the test image and the optical image to be the reference image to achieve registration. The results are shown in Fig. 7 and the error graph is presented in Fig. 8. Bidirectional registration was achieved in this case.
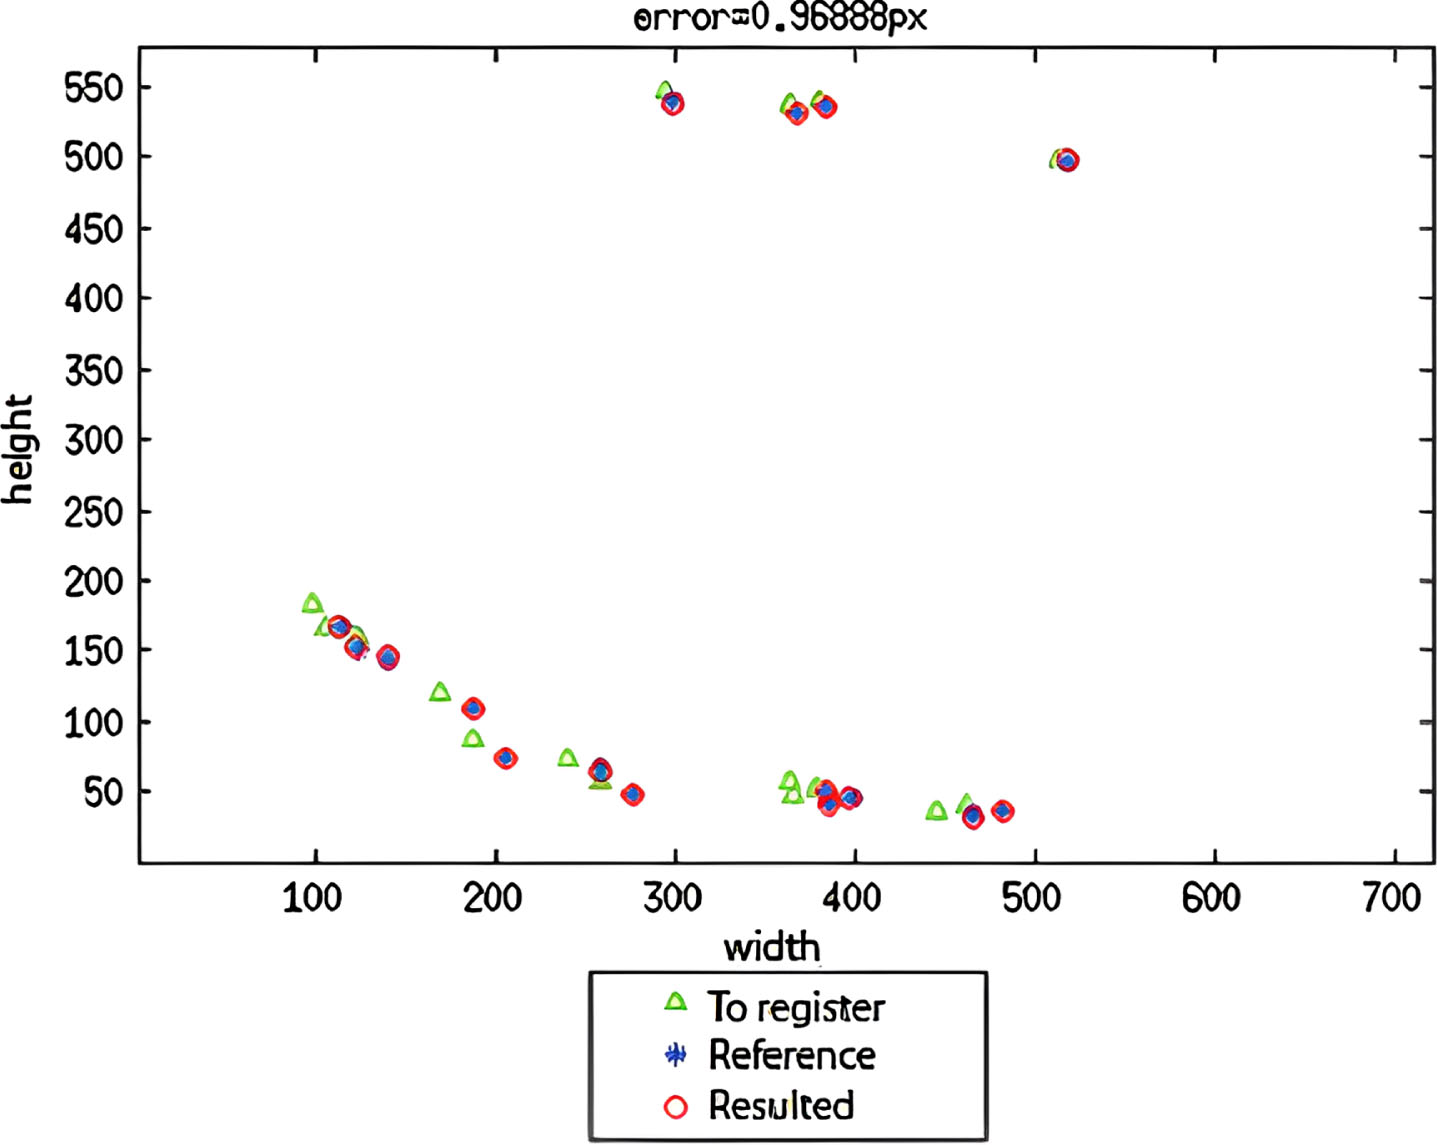
Graph of root mean square errors of the entire set.
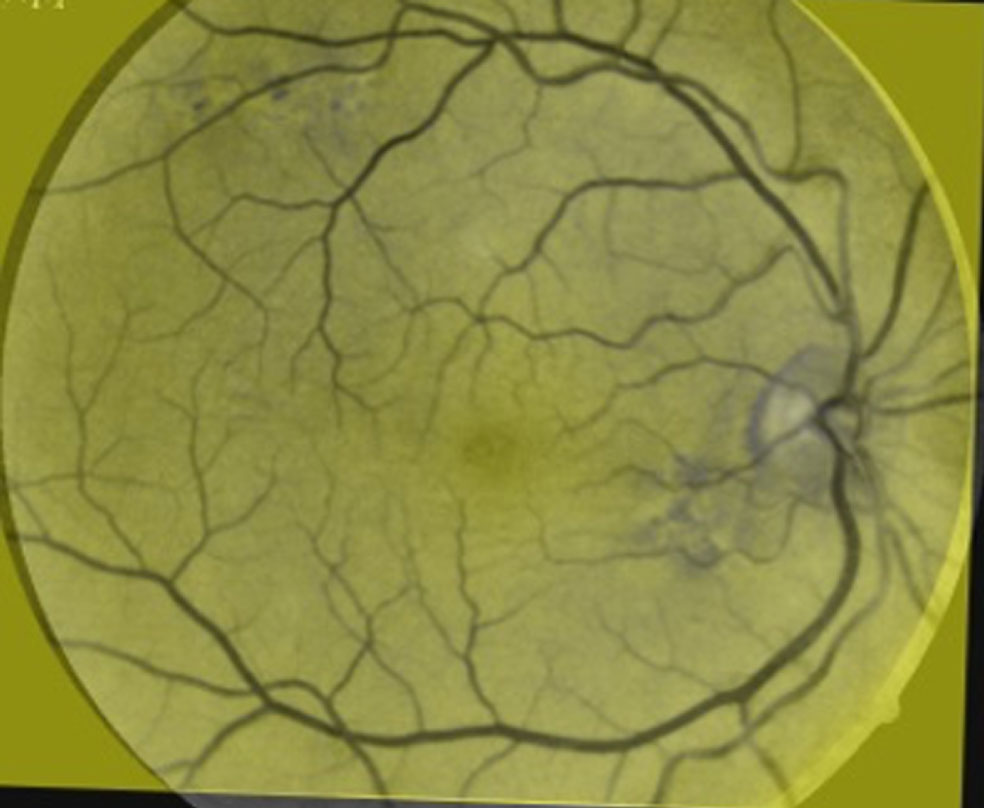
Logical OR of the resulting test FA image and the reference optical image.
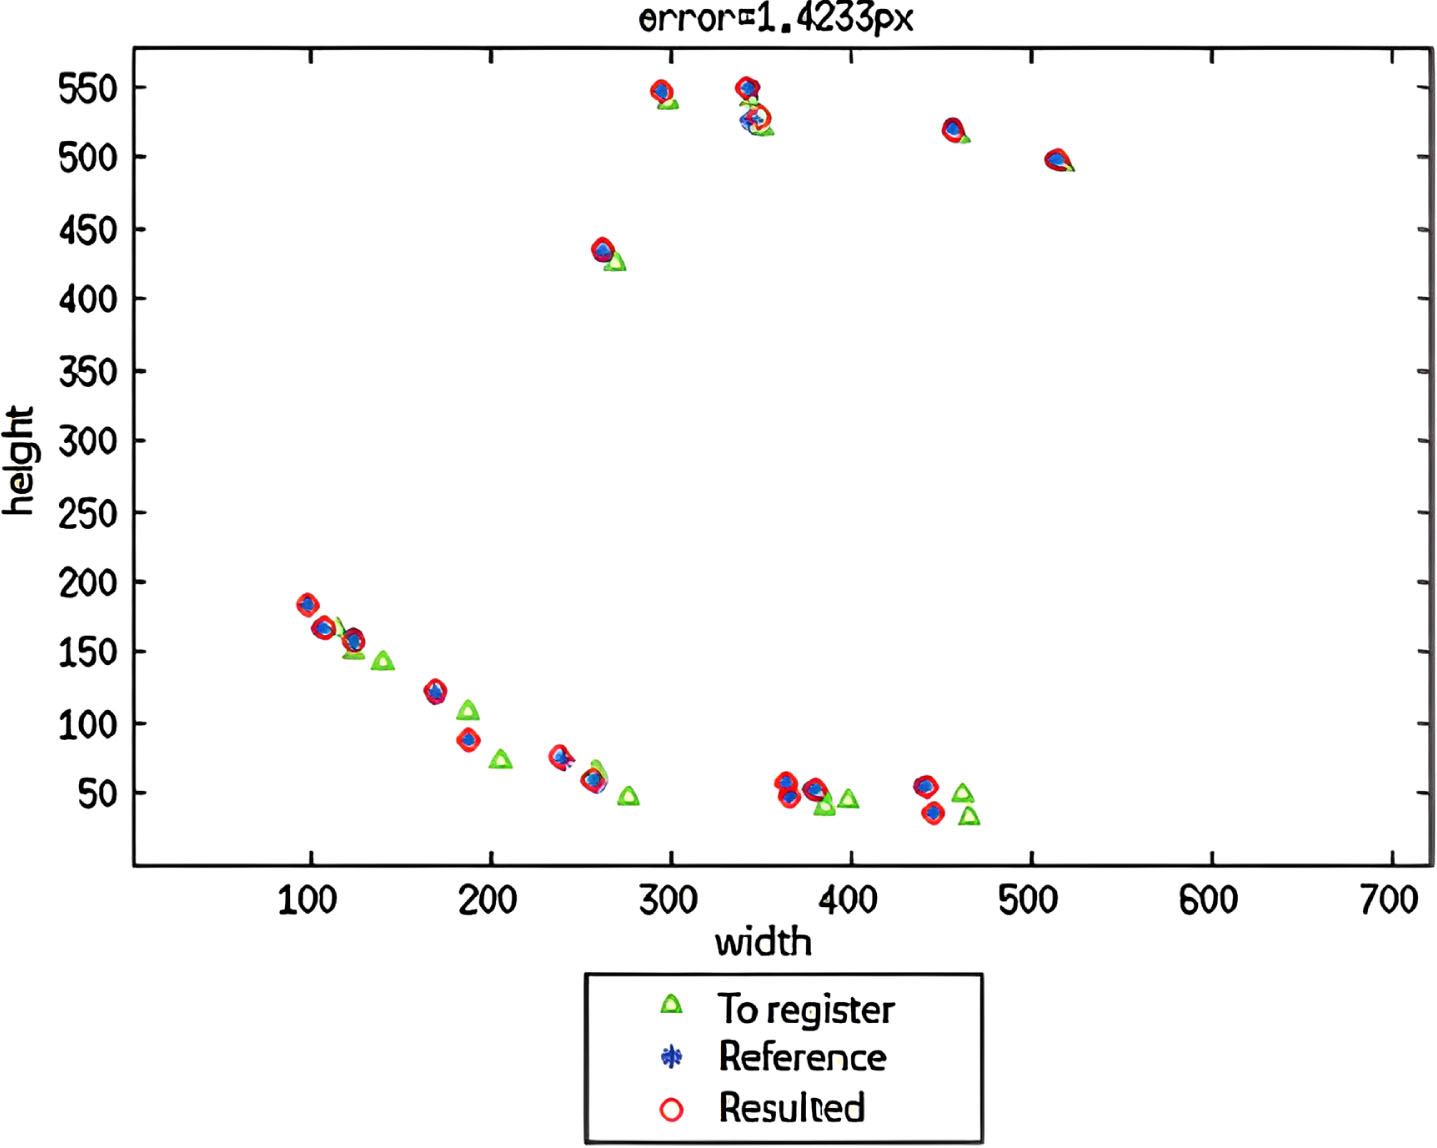
Graph of root mean square errors of the test set.
The errors calculated from both processes are different, with values of 0.96888 pixels and 1.4233 pixels, respectively. This difference is because there are different numbers of correspondences and matched characteristics in the first and second cases, with (21)-16 and (35)-21 correspondences, respectively, located at different positions. However, both sets of characteristics are located within the same zone of the images in both cases, meaning that the error cannot be equal due to the overall error calculation. Nonetheless, the difference between the errors is not significant. Generally, when the FA image is used as the reference image, and the optical image is transformed, the errors are smaller than in the reverse case.
Some pairs of optical and FA images could not be registered. In our opinion, negative results were caused by the fact that at the feature correspondence stage it was impossible to get four or more common features, mainly due to the poor image radiometric characteristics. An example of a such situation of poor image quality is presented in Fig. 9.
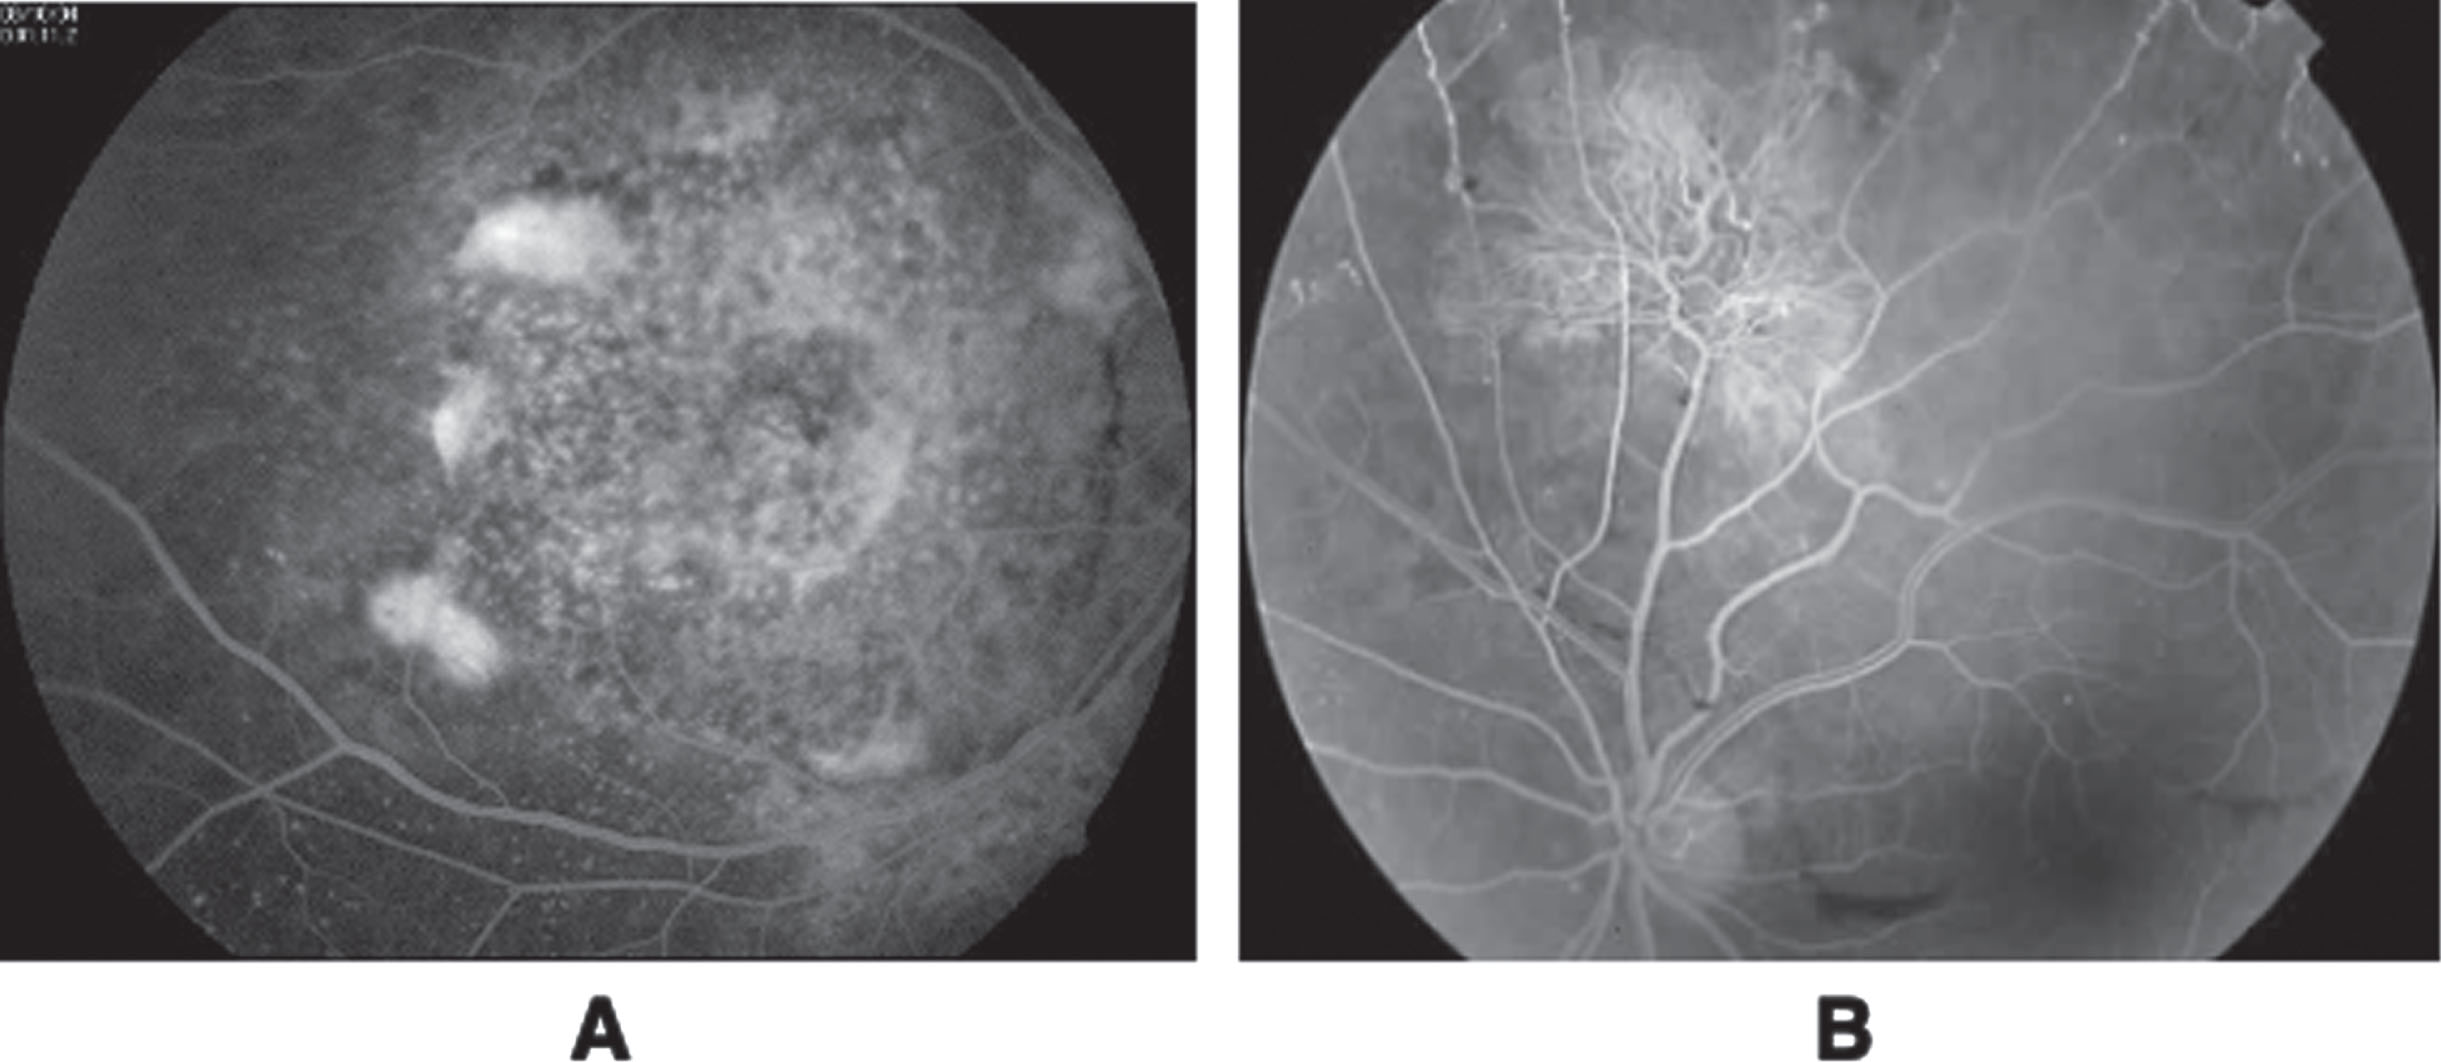
Optical (A) and FA (B) images where the registration was not possible.
In Table 1A), the number, percentage, and maximum errors obtained from the pair of images when the register was viable and not viable are presented. In Table 1B), the number, percent, and maximum errors obtained from the pair of images with and without microaneurysms when the register was viable are presented. Finally, in Table 1C) the number, percent, and maximum errors obtained from the pair of images in the case when the register was viable and could be performed in three possible forms are presented.
Summary of the results obtained from the experiments

We have presented a novel methodology for easily registering optical and FA retina images. Our method includes a preprocessing stage in the general multisource image registration method based on SIFT descriptors, which increases the similarity of both images and enables the successful registration of a pair of optic and FA images of the same retina. With this preprocessing stage, registration is possible.
We have also found that our proposed registration methodology requires four or more well-distributed key points provided for the same number of features found in both images. The venous and arterial vascular networks in human retina images usually satisfy this requirement and occupy many visible pixels on a more or less homogeneous background.
Our method is not affected by the presence or absence of microaneurysms or other retina pathologies, as they concern non-constant characteristics in both images to be registered.
Future research may explore other characteristic correspondence forms, such as speed-up robust feature transform (SURFT) and random sample consensus (RANSAC), with additional usage of changes in perspective and scale.
Footnotes
Acknowledgments
The authors wish to thank the support of the Instituto Politécnico Nacional (COFAA, SIP-IPN, Grant SIP 20240610) and the Mexican Government (CONAHCyT, SNI).