
Abstract
Glaucoma is an eye disease that requires early detection and proper diagnosis for timely intervention and treatment which can help slow down further progression and to manage intraocular pressure. This paper aims to address the problem by proposing a novel approach that combines a model-based Reinforcement Learning (RL) approach, called DynaGlaucoDetect, with ocular gaze data. By leveraging the RL algorithms to simulate and predict the dynamics of glaucoma, a model-based approach can improve the accuracy and efficiency of glaucoma detection by enabling better preservation of visual health. The RL agent is trained using real experiences and synthetic experiences which are generated using the model-based algorithm Dyna-Q. Two different Q-table generation methods have been discussed: the Direct Synthesis Method (DSM) and the Indirect Synthesis Method (IdSM). The presence of glaucoma has been detected by comparing the reward score a patient obtains with the threshold values obtained through the performed experimentation. The scores obtained using DSM and IdSM have been compared to understand the learning of the agent in both cases. Finally, hyperparameter tuning has been performed to identify the best set of hyperparameters.
Introduction
Glaucoma is an eye disease characterized by damage to the optic nerve which connects the eye to the brain. This damage is often associated with increased intraocular pressure, but it can also occur without elevated pressure. If it is left untreated, glaucoma can lead to progressive vision loss and permanent blindness in severe cases. So, early detection of glaucoma is very important as it allows timely intervention and treatment which can help prevent the disease’s further progression. By identifying glaucoma in the early stages, appropriate measures can be taken to preserve optic nerve function. So, the detection of glaucoma disease is very much needed as it plays a significant role in preventing vision impairment and improving the quality of life for affected individuals.
Reinforcement Learning (RL) is an ML method that is particularly a realm of dynamic decision-making by enabling the RL agent to learn optimal behaviors through interactions with the environment by receiving rewards. RL is categorized to have two approaches i.e., Model Free RL and Model-Based RL. Nowadays, RL has significant potential and various applications in the Healthcare domain, offering the advantage of enhancing medical decision-making, treatment recommendation, and patient care. RL in the healthcare domain holds great promising results by enabling the development of personalized treatment, assisting healthcare professionals in making complex decisions in terms of the detection of disease by analyzing large volumes of patient data, and RL models can adapt and optimize the management of chronic conditions also by learning patient data continuously leads to improvement in patient outcomes and enhances the quality of life. However, it is also important to address the challenges such as data privacy, ethics, and interpretability to ensure responsible and effective integration of RL in healthcare.
Various methods are prevalently being used for glaucoma detection methods like machine learning, and deep learning, leveraging the concepts of image processing.
The highlights of the work that we have done in the paper are given below: Introduced the use of reinforcement learning in the field of glaucoma detection Explored existing glaucoma eye-gaze data and created similar synthetic data using the Dyna-Q algorithm Used an intuitive reward system to generate scores for distinguishing between glaucoma subjects and non-glaucoma subjects Performed hyperparameter analysis to obtain the best set of hyperparameters for glaucoma detection application
Artificial intelligence has been revolutionizing the realm of computer-aided (CAD) disease diagnostics by framing it as a classification problem of classifying healthy and glaucomatous subjects. Disease diagnostics is the domain that helps in predicting the presence or absence of a disease by identifying the peculiar characteristics of a disease. This section dives into the various approaches and the evolution of glaucoma detection using machine learning and deep learning techniques. It has been observed that most of the diagnostics of these kinds are based on image data rather than information about visual perception.
Guangzhou et al. [1] undertook the task of distinguishing between healthy and glaucomatous subjects through the identification of concealed patterns within Optical Coherence Tomographic data and Color fundus images. Their approach employed transfer learning along with diverse data augmentation and pre-processing techniques, leading to an impressive accuracy of 96.3% in terms of AUC scores. Building upon this, Daniele et al. [2] and Khalil et al. [3] conducted an exhaustive review of machine learning algorithms and feature extraction methods spanning 2014 to 2019, specifically for the processing of retinal images in glaucoma diagnosis. In a complementary vein, Stephane Cedric Koumetio Tekouabou et al. [4] addressed challenges inherent in traditional machine learning models when dealing with medical data. Notably, their exploration extended to ensemble learning techniques applied to glaucoma analysis via retinal images, yielding a remarkable 97.39% AUC accuracy. Pivoting towards the future, Abdulla Sarahan et al. [5] scrutinized the limitations and potential of early glaucoma identification using 2D and 3D images, alongside discussions of pertinent datasets for retinal analysis. Echoing this, Burgansky Eilash et al. [6] concluded that integrating OCT images significantly heightens the utility of technology in detecting glaucomatous subjects, rendering precise predictions. Nagarajan Harshitha et. al. [7] propose a novel RL approach to detect reading impairment from eye-gaze behavior. The RL model is trained to learn the optimal reading policy from a set of good and poor readers and evaluated on a dataset of eye-gaze data from dyslexic and non-dyslexic children. Their study shows that the RL model is able to achieve high accuracy in detecting reading impairment, even with a less sophisticated model architecture.
Pooja Sharma et al. [8] reviewed various literature on tools available for glaucoma with emphasis on the best evidence available in the literature to support their use in clinical practice. A novel automated glaucoma detection system is proposed by R Bock et al. [9], utilizing cost-effective digital color fundus images. The system’s two-stage classification approach yields a Glaucoma Risk Index (GRI) with 80% accuracy in detecting glaucoma, outperforming a topography-based method in terms of area under ROC (AUC) at 88% . Introducing a novel perspective, Junde Wu et al. [10] presented a teacher-student-learning paradigm wherein latent information from undiagnosed images is encoded by the teacher model and transferred for enhanced glaucoma classification in the student model. Their approach, demonstrated via simulated real-world teaching practices, effectively elevated prediction performance.
Shubam Joshi et al. [11] led the charge in advancing ensemble deep learning techniques, harnessing the power of pre-trained networks: Residual network (ResNet), visual geometry group network (VGGNet), and GoogleNet. Their extensive evaluation spanned five diverse image datasets, meticulously dissecting and evaluating model performance. Concurrently, Fan Guo et al. [12] brought forth a pioneering methodology anchored in the Increasing Field of View model (IFOV), adroitly leveraging a gradient boost classifier. This innovative approach deftly extracted features from segmented optic disc retinal images via the U-Net framework, further enhanced by integrating clinical measurements to elevate diagnostic precision. In a parallel vein, Xiangyu Chen et al. [13] introduced a deep learning architecture for diagnosing glaucomatous patients through image data, featuring a stack of six distinct learned layers. This framework holds the potential to augment early diagnosis and treatment strategies for this progressive ailment. Simultaneously, Shinde et al. [14] proposed a groundbreaking amalgamation, uniting the UNet architecture with supervised machine learning algorithms, culminating in a novel method for detecting glaucoma in retinal images. Their promising approach leaps forward in enabling early diagnosis. A panoramic landscape of deep learning techniques including screening, diagnosis, detection, and current advancements is encompassed in [15].
Michail et al. [16] conducted a comprehensive exploration into the expansive domain of deep learning’s impact on glaucoma, spanning screening, diagnosis, and the detection of disease progression. Their study underscores the vast potential of deep learning methods in elevating the management of glaucoma. Shifting gears, the Dyna-Q method employs a unique approach by utilizing offline simulations and action executions to iteratively update Q functions via a world model. Kaio-Shing Hwang et al. [17] contribute an adaptive model learning strategy rooted in tree structures, significantly amplifying modeling efficiency. This enhancement is exemplified in accelerated training rates within diverse simulations, such as mountain car and maze navigation for mobile robots. Notably, Hwang et al. delve into pheromone-based planning strategies within the Dyna-Q learning algorithm, seamlessly integrating pheromone information to augment planning processes and uplift the overall efficiency and efficacy of the Dyna-Q algorithm [18]. Sushil et al. [19] perform automated glaucoma detection and compare the performance of pre-trained deep neural networks. The pre-trained models used are ResNet50, DenseNet121, and InceptionV3, which are evaluated with a benchmark dataset that is publicly accessible. Their result states that VGG16 outperforms the other models with an accuracy of 100% .
Jang et al. [20] meticulously explore the myriad applications of Q-learning algorithms, offering a comprehensive classification and study of these methods. Their insights serve as a valuable resource for researchers and practitioners eager to grasp and apply Q-learning techniques across various domains. Meanwhile, Sajitha et al. [21] pioneer a novel system that harnesses the potential of eye tracking to enhance glaucoma diagnosis in primary eye care settings. Their system not only exhibits the capacity to enhance precision and effectiveness in glaucoma diagnosis but also introduces Gaze Fusion, a deep neural network model meticulously tailored for glaucoma detection through the fusion of gaze-tracking data. Their pioneering approach [22] demonstrates promising outcomes, affirming its potential for efficient glaucoma diagnosis.
The use of reinforcement learning in the healthcare domain is still developing and there is no work done on the identification of glaucoma. We have presented a novel approach to detecting glaucoma in eye-gaze data and a description of the evolution of Glaucoma detection in the state of the art has been provided (see Fig. 1).
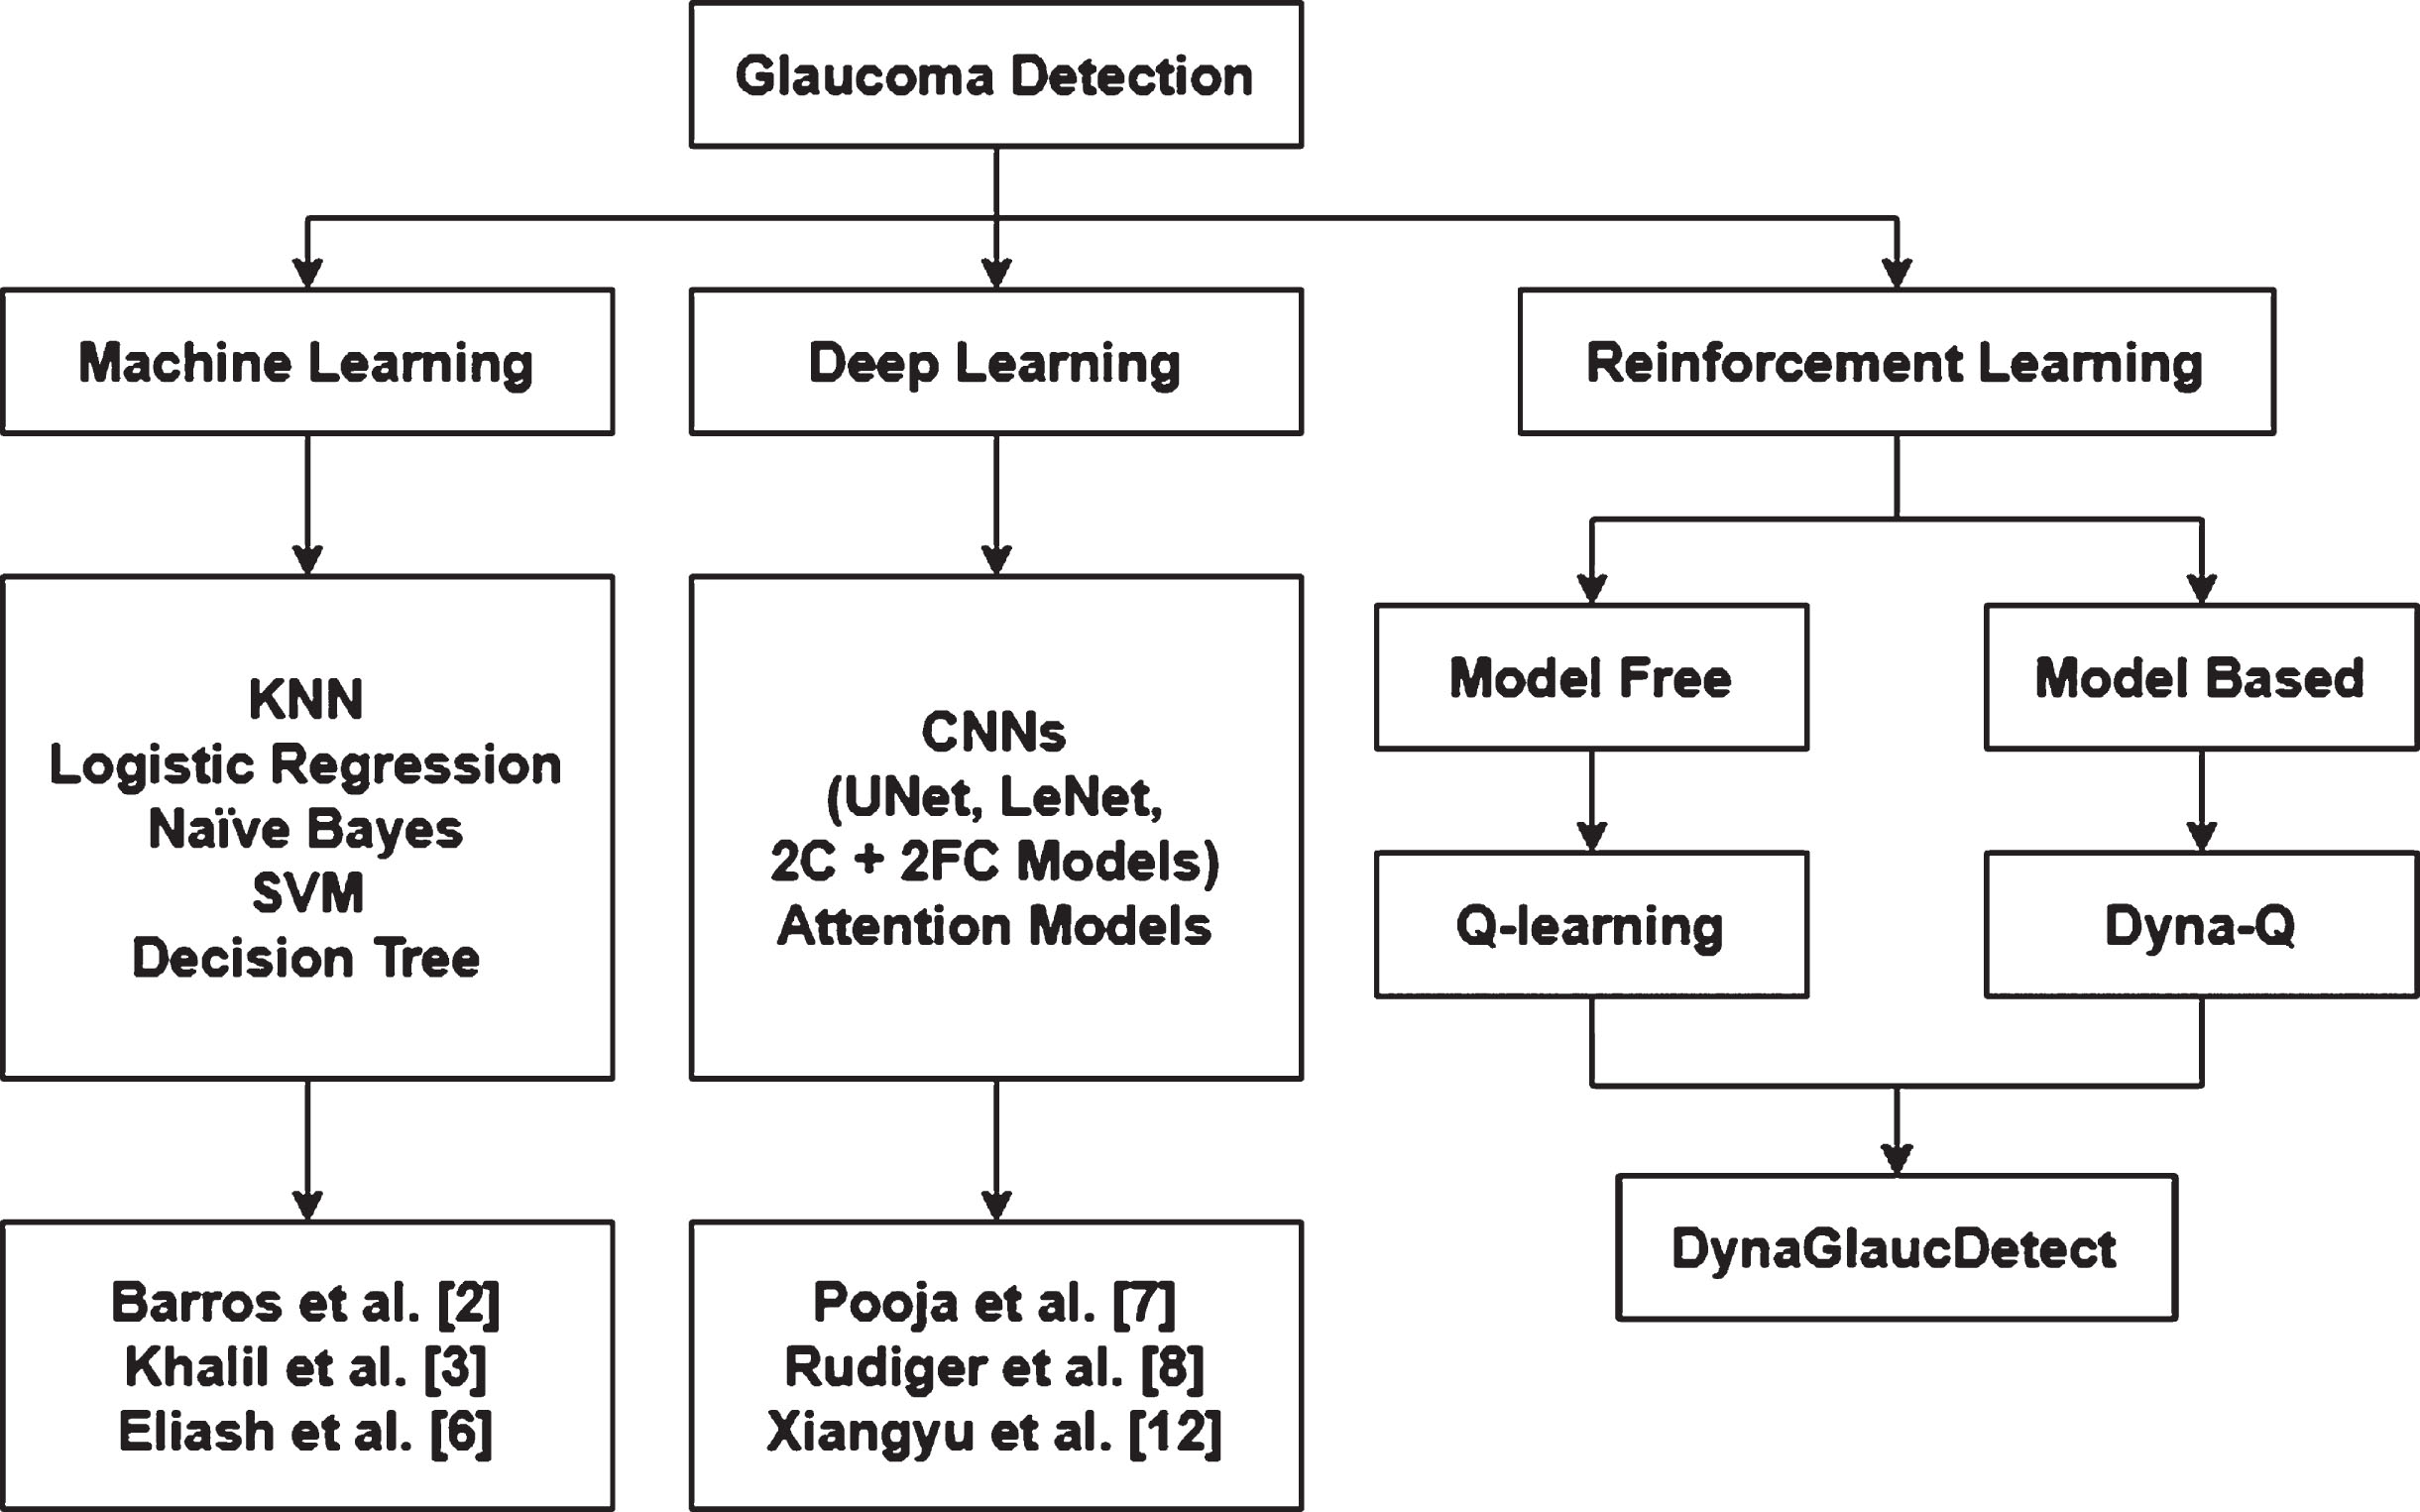
Evolution of Glaucoma detection over the years.
The methodology followed in this paper has been elucidated in this section. For any RL problem, the first step would be to understand the data that is being used for training the agent. In this problem, the RL agent is a score calculator that calculates a score value for both glaucoma and non-glaucoma subjects which can act as threshold values for the detection of glaucoma in a subject. After obtaining a clear understanding of the state space and action space we have designed the reward system to obtain the maximum difference between the scores of glaucoma and non-glaucoma subjects. The Dyna-Q algorithm has been used for synthesizing data similar to the existing data extracted from the glaucoma eye-gaze dataset [23]. Using both the real data and synthetic data, the agent gives an average score for glaucoma subjects and non-glaucoma subjects.
In the proposed RL framework, the agent receives a state (St) from the environment at each time step (t). Based on its policy (π), the agent selects an action (At). The environment, in turn, provides a reward (Rt) to the agent and causes a transition to the next state (St + 1). The interaction between the agent and environment has been explained visually (see Fig. 2).
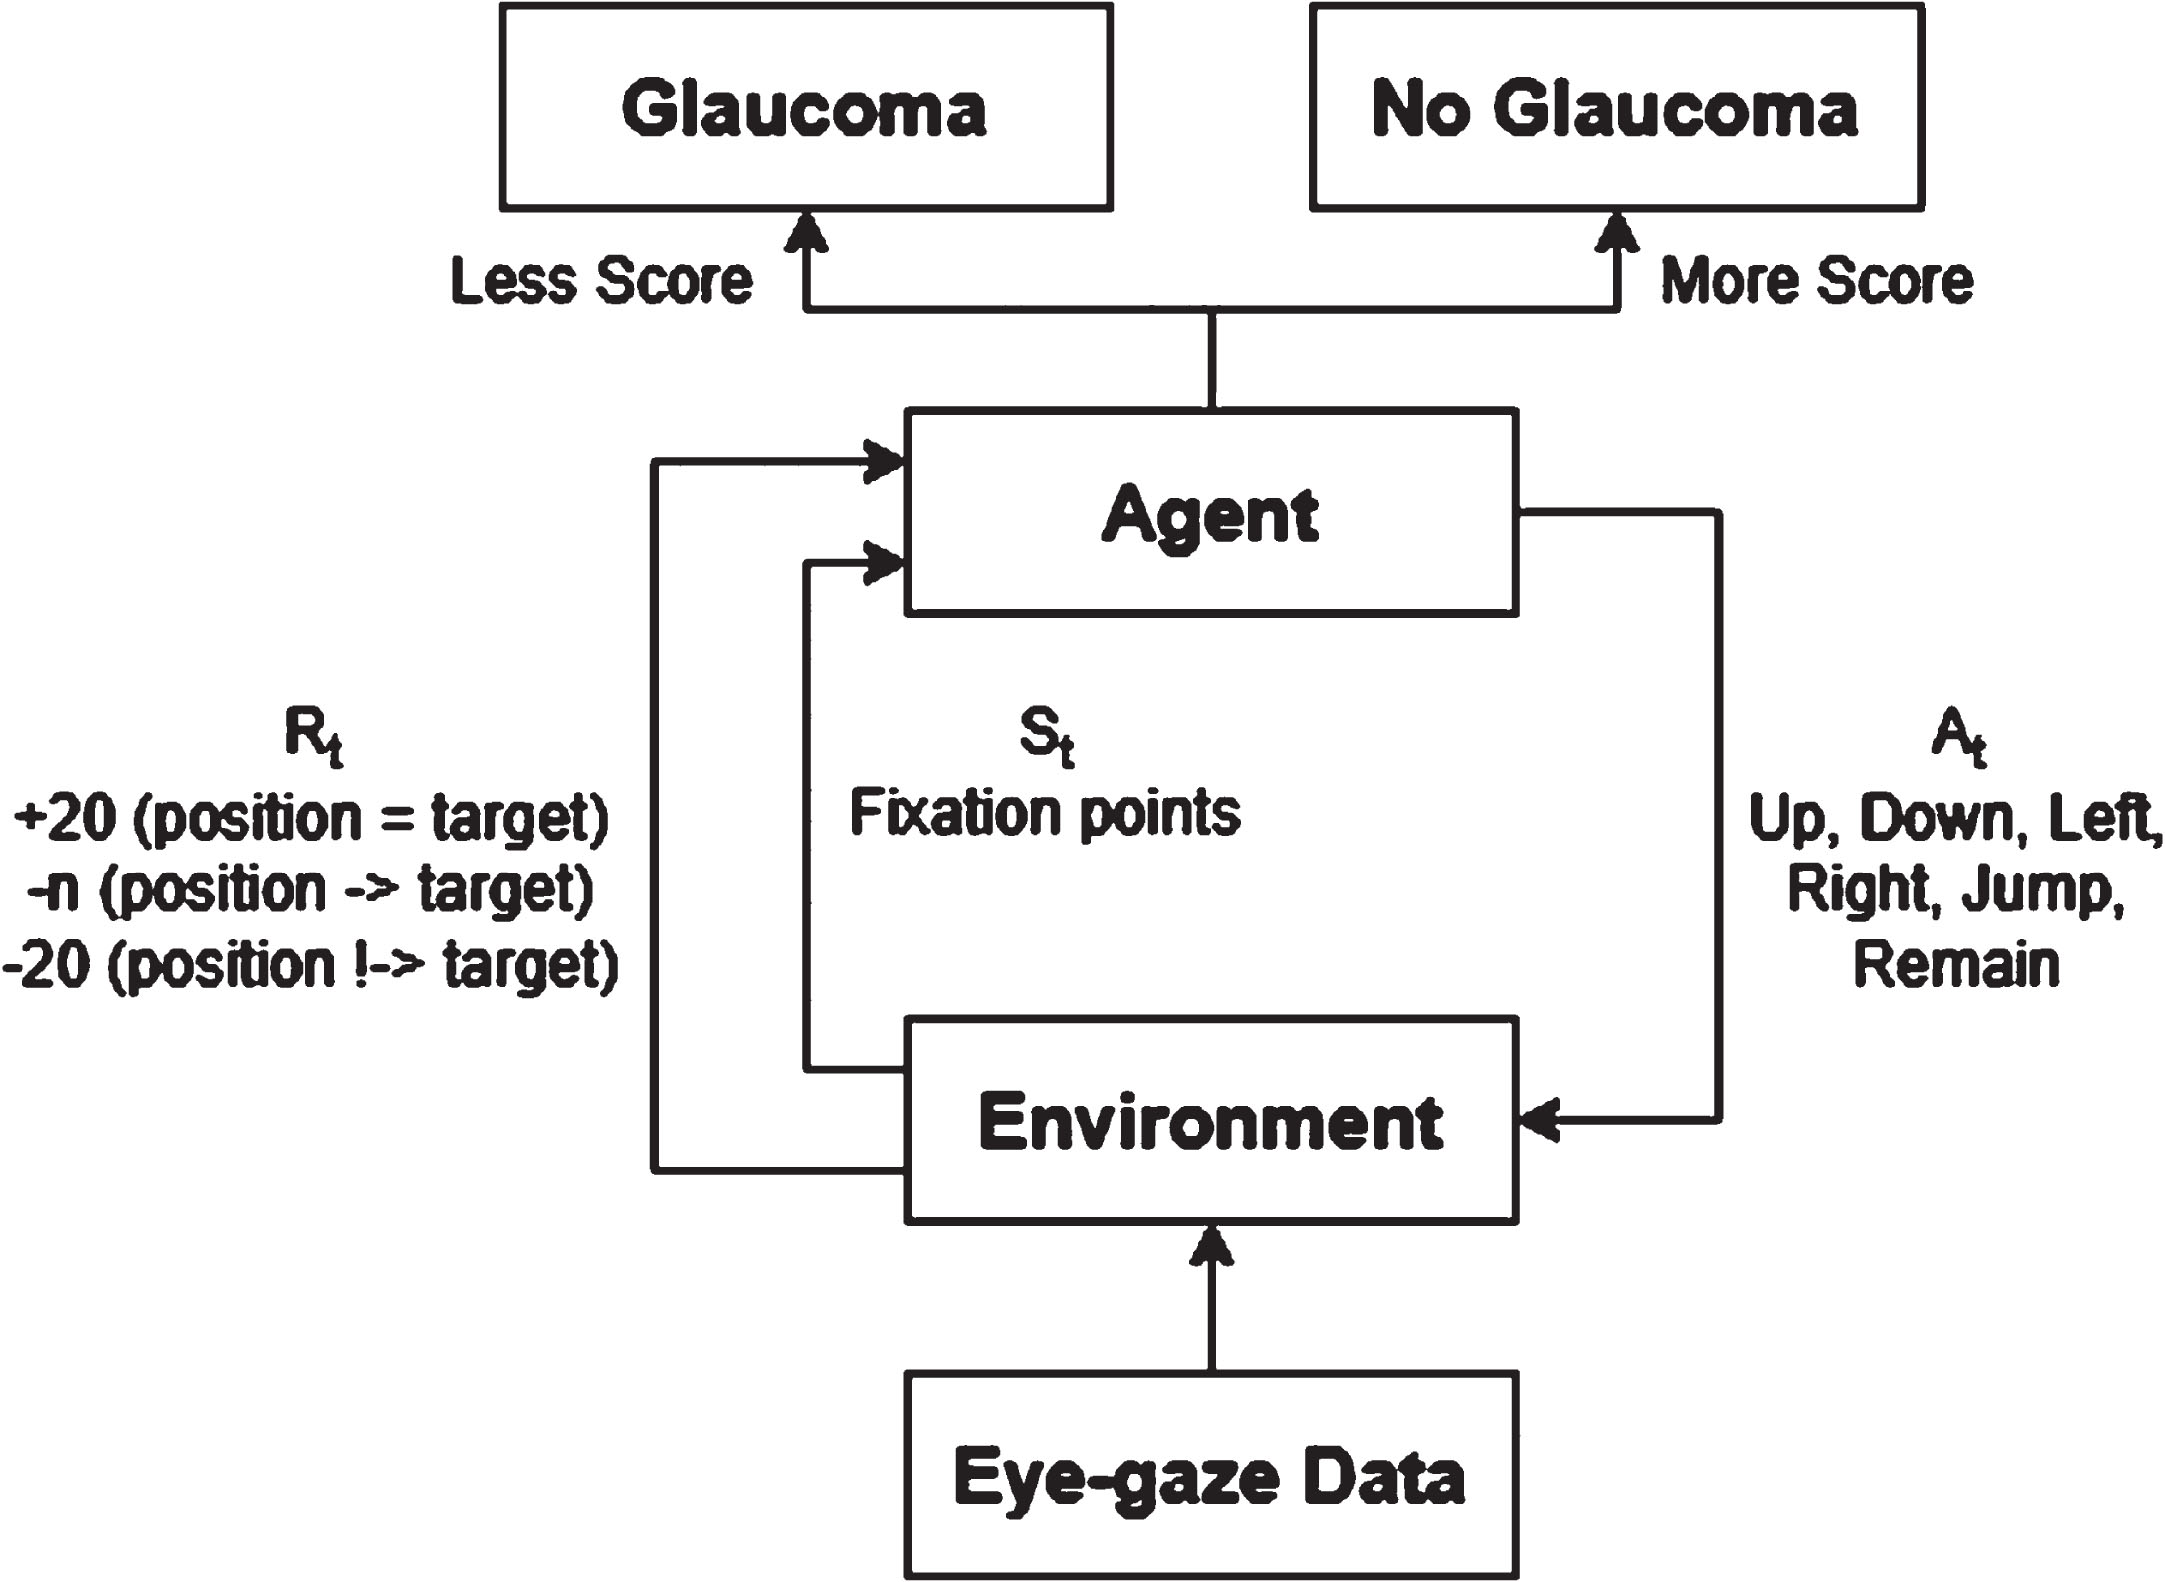
Agent-environment interaction in DynaGlaucoDetect.
The RL agent has been trained using a model-based approach called Dyna-Q, which is an extension of the Q-learning algorithm. The agent learns values for each state-action pair are represented in the Q-table. It interacts with the environment to gain rewards, which are then used to modify the Q-values in the Q-table. In Q-learning, the Q-table is updated using observed rewards and the maximum Q-value of the next state. However, Dyna-Q, an extension of Q-learning, goes a step further. In Dyna-Q, in addition to updating the Q-table, the agent performs planning steps to simulate experiences. These simulated experiences are used to update the Q-table based on the outcomes of those simulations. By incorporating planning, Dyna-Q enables the agent to learn from both real experiences and simulated experiences, enhancing its ability to make better decisions and improve its performance in reinforcement learning tasks. The working of the model-based Dyna-Q approach has been given below (see Fig. 3).

The architecture of the Dyna-Q algorithm used in DynaGlaucoDetect.
In DynaGlaucoDetect two types of Q-table generation methods have been developed: Direct Synthesis Method (DSM) and Indirect Synthesis Method (IdSM). The difference between these methods lies in the process of updating the Q-table.
Direct Synthesis Method (DSM)
In DSM, synthetic data generation, model updates, and Q-table updates take place in the same loop. This indicates that the model update takes place, and it is immediately used for creating synthetic data. The Q-table thus generated is used for generating glaucoma and non-glaucoma scores. A diagrammatic representation of DSM has been represented below (see Fig. 4).

DynaGlaucoDetect direct synthesis method architecture.
In IdSM, Q-table generation, based on real experience, and data and model updates take place in one loop. Using the trained model, synthetic data is generated, and this will be saved in a CSV file. Later this data is again called and used for updating the Q-table values. Finally, the updated Q-table is used for generating glaucoma and non-glaucoma scores. The architecture of IdSM has been presented below (see Fig. 5).
DynaGlaucoDetect indirect synthesis method architecture.
RL formulation is the process of defining a problem within the framework of RL to enable the application of RL algorithms. RL formulation of a Markov Decision Process (MDP) involves four key components, the state space, action space, rewards for each state-action pair, and the transition probability for the agent to undergo the action.
Environment
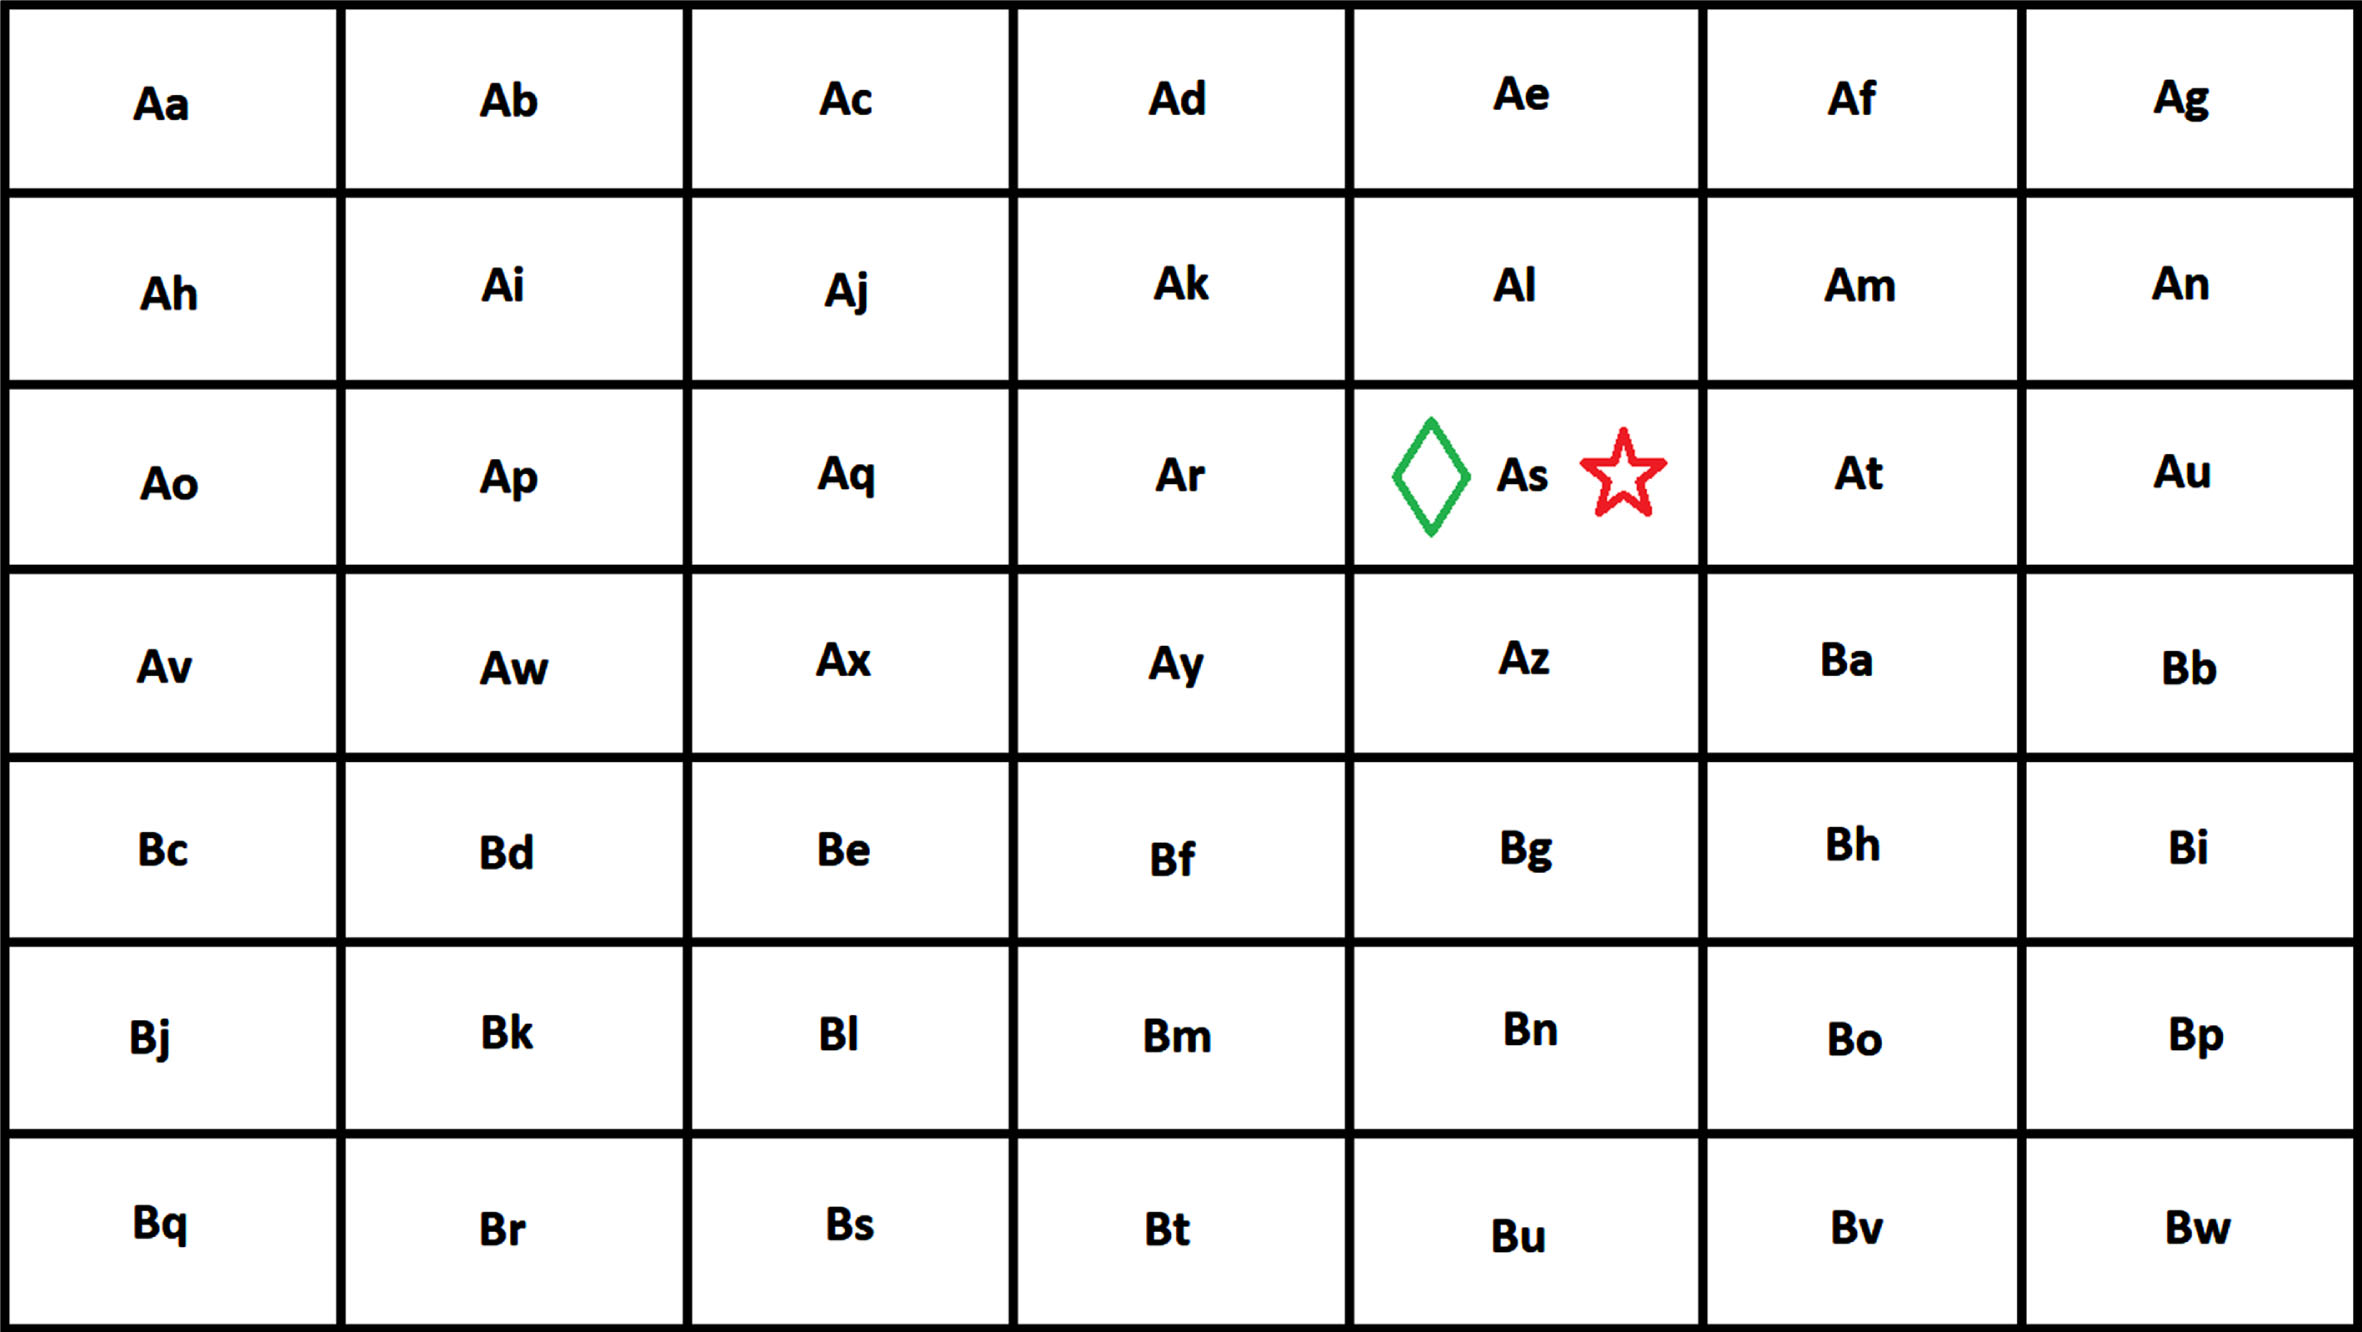
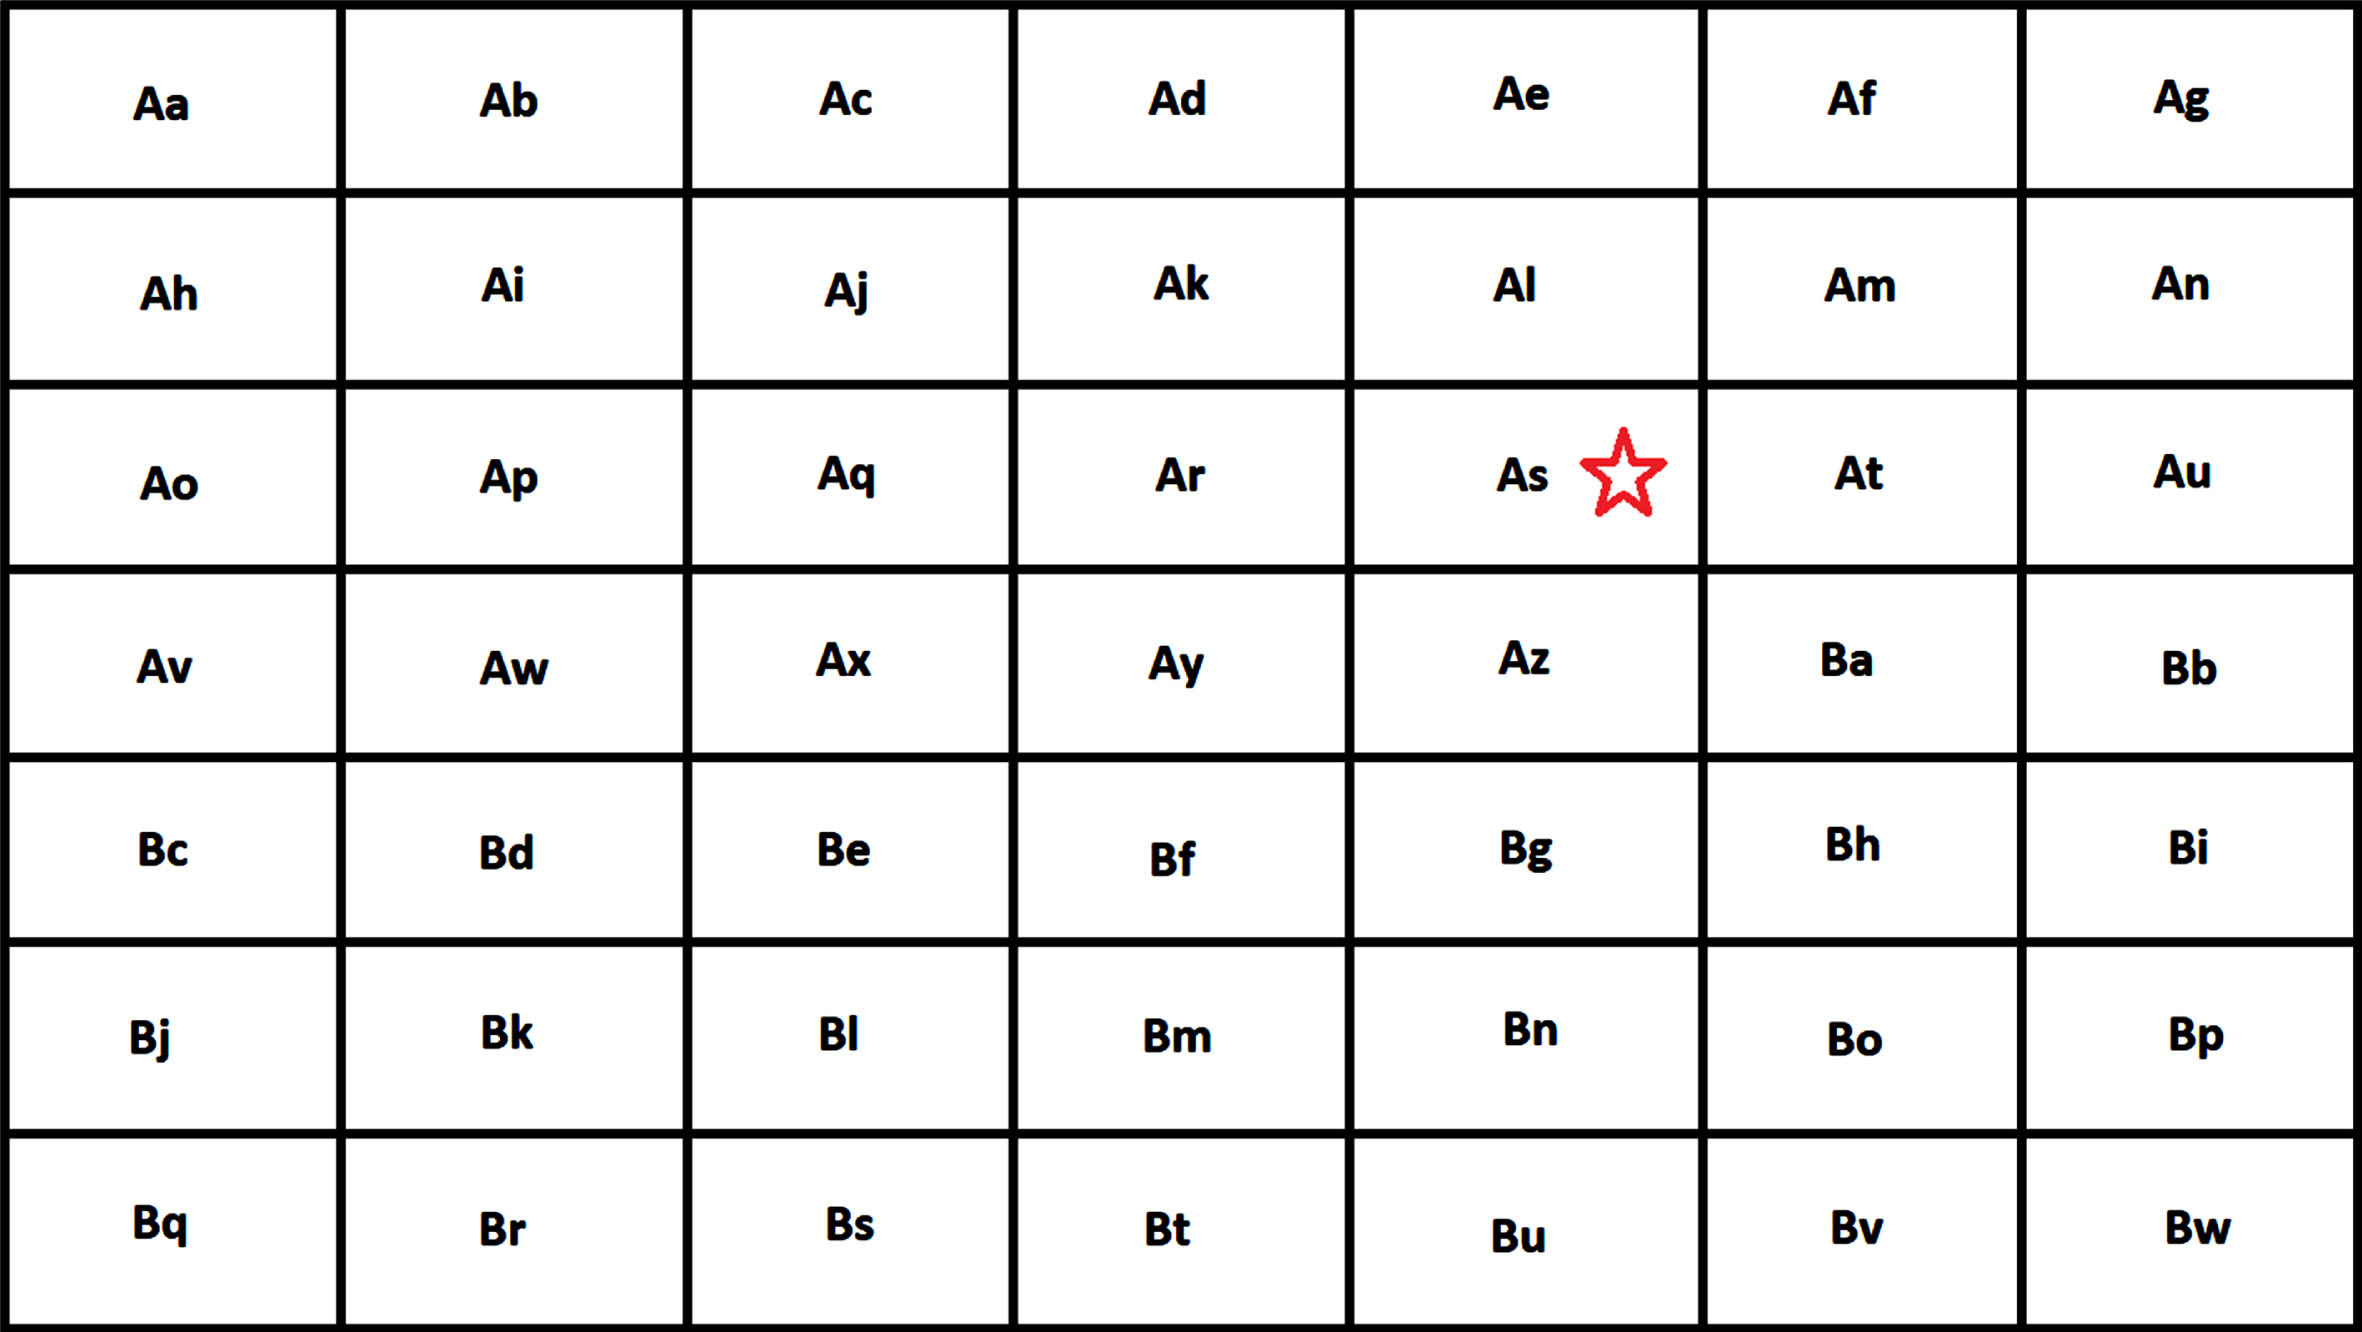
The environment for this problem is a 7 × 7 grid-world environment where each cell is a named state (see Fig. 6). The cells are named from Aa to Bw. We overlay the grid over each image that is shown to the subject and the eye-gaze of the subject falling in one cell of the environment is considered to be in the same state. The subject is required to look into the state that contains the target star.

Grid world environment of DynaGlaucoDetect.
After overlaying the environment on the visual search image displayed to the subject the below image is formed. In this case, the target star is present in the state As (see Fig. 7).

Overlayed visual search images in DynaGlaucoDetect.
As the environment is a 7 × 7 grid world, there are 49 possible states. The states are the fixation points of the subject while searching for the target state on the visual search image. The actions in this problem represent the movement of the eye or gaze position of the subject. The problem has been formulated with six different actions: Up (when the subject gazes at the state above the current state), Down (when the subject gazes at the state below the current state), Left (when the subject gazes at the state on the left of the current state), Right (when the subject gazes at the state on the right of the current state), Jump (when the subject shifts gaze to a state that is not near the current state), and Remain (when the subject continues to gaze at the same state).
Reward system
With each shift in the subject’s gaze location, a reward, either positive or negative, is conferred, influencing their progression toward the target state. The system has been designed such that the reward is dependent on the number of gaze states that need to be shifted to reach the target state. If the subject gazes at the target state in the beginning i.e., the start state is the target state, a reward of +20 is given. If the gaze position of the subject does not correspond to the target state, a reward of –n is given (where n is the number of steps that the gaze position of the subject has to move to reach the target state). In case the target state cannot be reached from the gaze state of the subject a reward of –20 is given. A generic representation of the reward system has been provided (see Fig. 8).

Reward system of DynaGlaucoDetect.
In the formula, k is an arbitrary value that can be changed as needed. The value of k has been taken to be 20 for calculating the scores in this paper. The three cases of reward calculation have been depicted below in the grid world environment. In the figures, the red star represents the target state, and the green diamond represents the gaze state of the subject. In the first case, the reward is +k as the gaze position is the same as the target state (see Fig. 9).
DynaGlaucoDetect reward scene representation when the position same as the target state.
In the second case, the reward is –3 as the gaze position is three states away from the target state (see Fig. 10).
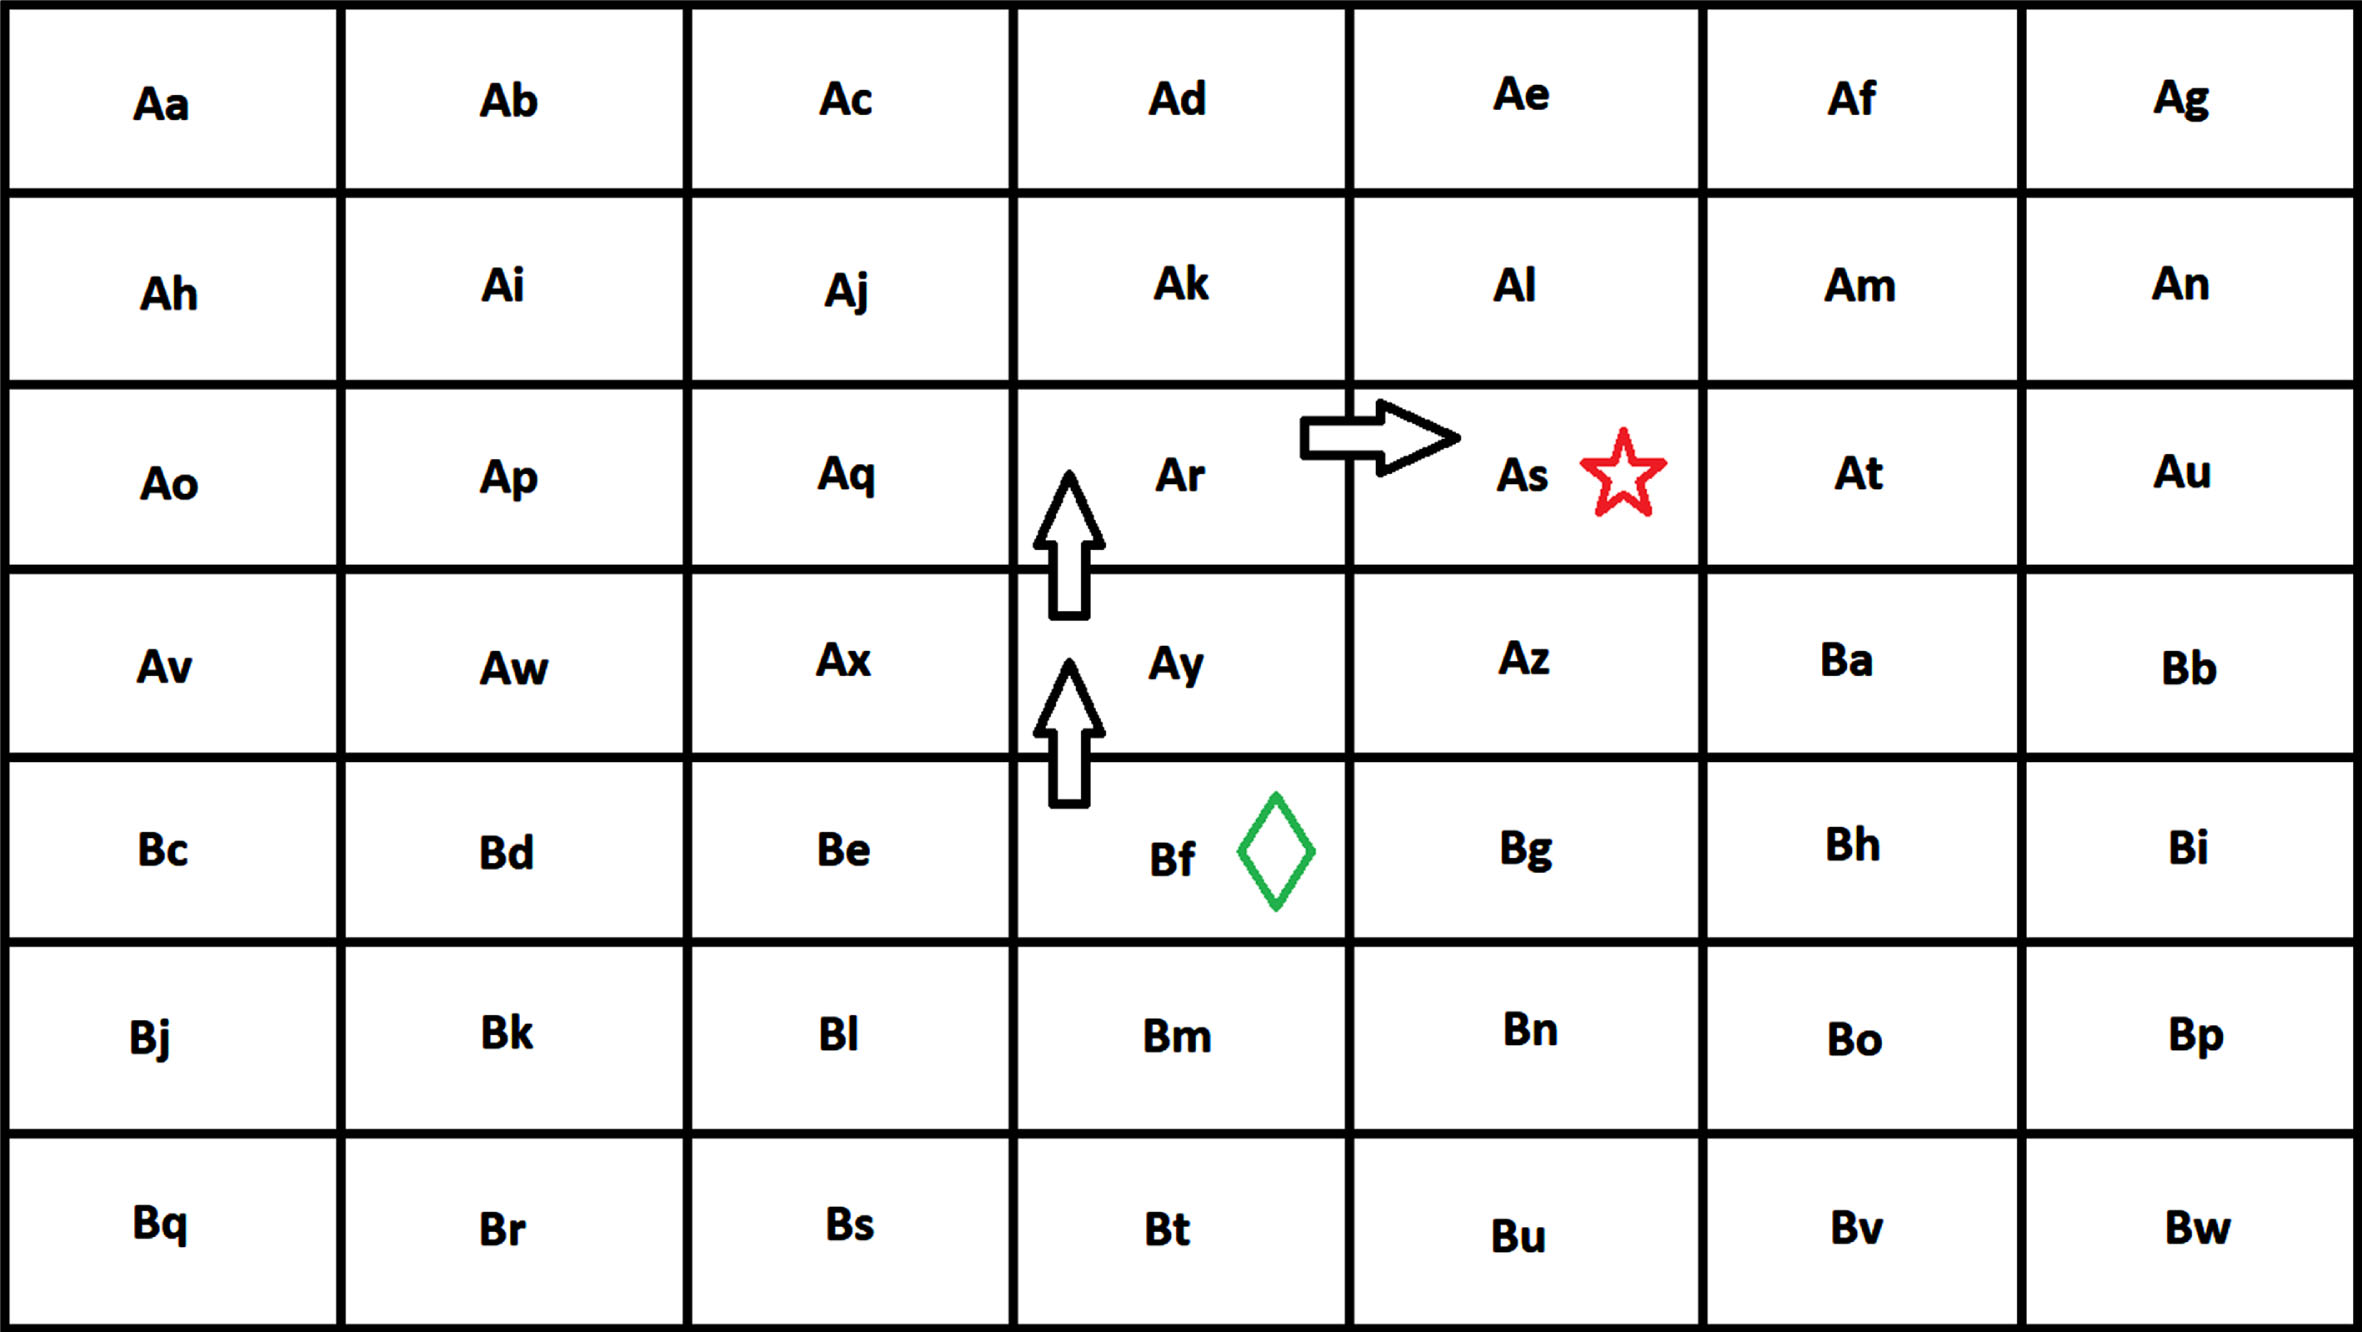
DynaGlaucoDetect reward scene representation when the position is away from the target state.
In the third case, the reward is -k as the target state cannot be reached from the gaze position which is outside the area of the visual search image (see Fig. 11).
DynaGlaucoDetect reward scene representation when the target state cannot be reached from the position.
The dataset used for this work has been extracted from the glaucoma-related eye-gaze data [21]. For the creation of the dataset, various visual exploration tasks were considered. For this work, we have considered the data created during the visual search task. The visual search task involved a task-oriented assignment where a series of 20 cartoon images were displayed on the screen for a certain amount of time. The subject was asked to locate the target in the images (represented by a yellow star) and the eye movements of the subject were recorded. The partial dataset that we have extracted consists of eye movement data of 16 subjects for viewing the defined target on a grid image. All 20 images are used to record eye movement data and the samples are taken from 8 glaucoma subjects and 8 non-glaucoma subjects. From all the attributes recorded, only certain columns were taken that are useful in the decision-making process for agents. These attributes include trial ID, state (fixation), action, and next state (fixation).
System architecture
The architecture of the proposed system, DynaGlaucoDetect, is described in a flowchart (see Fig. 12).
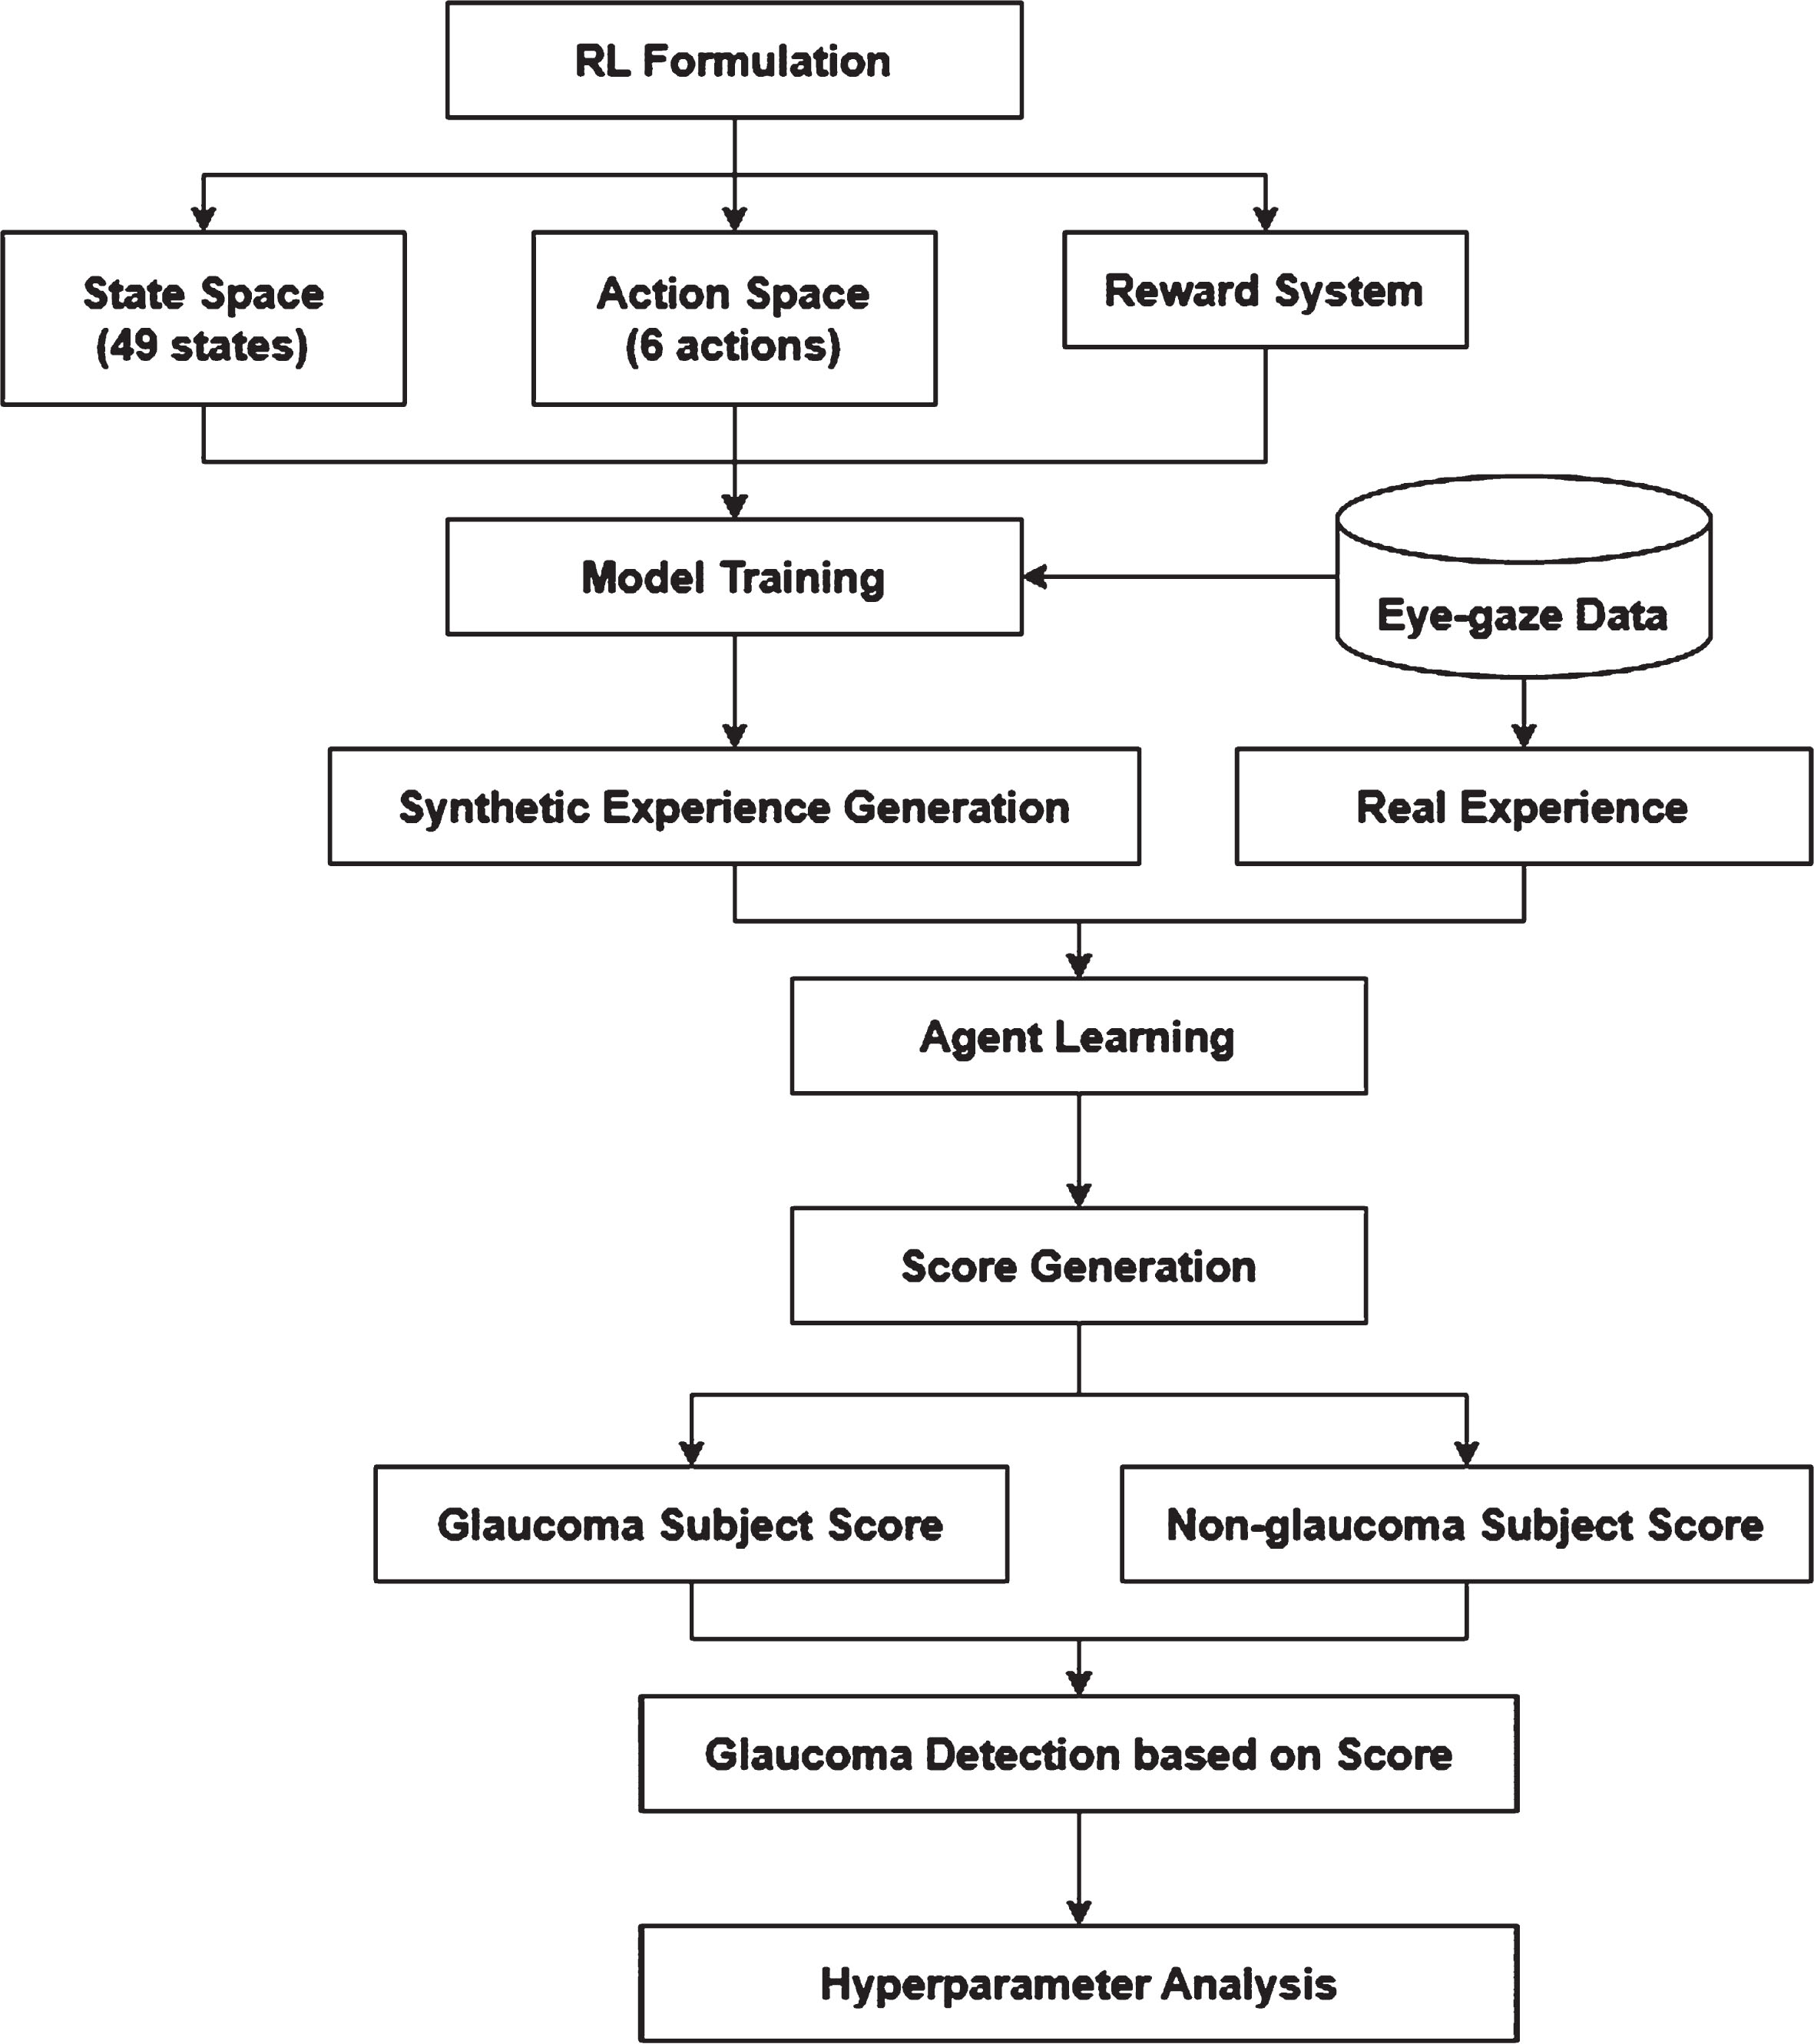
Methodology of DynaGlaucoDetect.
The eye-gaze data is initially used for training a Dyna-Q model and the model is in turn used for the synthetic experience generation. The real experience from the data is combined with the synthetic experience and used for the agent. The agent generates a score that is analyzed for detecting the presence of glaucoma in a particular subject. For performing further analysis, hyperparameter tuning has been done.
Q-learning algorithm training
During this phase, the agent is trained using the Q-learning approach, and the recorded data of both glaucoma and non-glaucoma patients is given to the algorithm separately. The Q-learning algorithm is a model-free RL algorithm that finds an optimal policy for each state-action pair based on the state, action, reward, and next state. Based on the interaction with the environment, the Q-table is updated with the maximum Q-value for each state-action pair which has a maximum reward. The below pseudo code depicts the updating of the Q-table based on state action pairs. The pseudo-code given in Table 1. briefs the Q-table updating using the traditional Q-learning approach. There are three important hyper-parameters used learning rate (α), discount factor (γ), and exploration rate (ɛ). The learning rate controls the extent to which the agent learns from the environmental experiences while the discount factor represents the amount of regulation the past rewards should have on the cumulative reward. The exploration rate determines the probability of the agent choosing a random action over the action it believes to be best based on previous experience from its interactions with the environment.
Pseudo-code of Q-learning algorithm used in DynaGlaucoDetect
Pseudo-code of Q-learning algorithm used in DynaGlaucoDetect
After updating the Q-table based on Q-learning, the Q-table is again updated using the model-based approach, Dyna-Q algorithm. In Dyna-Q, in addition to the Q-table updating, the agent performs planning steps to simulate experiences. These simulated experiences are used to update the Q-table based on the outcomes of those simulations using the traditional Q-learning approach only. The pseudo-code provided in Table 2. depicts the Q-table updating based on the Dyna-Q approach.
Pseudo-code of Dyna-Q algorithm used in DynaGlaucoDetect
Pseudo-code of Dyna-Q algorithm used in DynaGlaucoDetect
The pseudo-code given is for the Dyna-Q approach, which is an extension of Q-learning, so the same hyperparameters are used. In the given pseudo code s is the current state, a is action, s’ is the next state and r is the reward.
Using the RL agent, rewards at each step taken by the gaze points of the subjects are added up to generate a score. Thereby the RL agent is acting as a score calculator. The scores obtained with all the glaucoma subjects and non-glaucoma subjects have been averaged to obtain the glaucoma score and non-glaucoma score.
For analyzing the scores obtained for glaucoma and non-glaucoma subjects, a hyperparameter tuning has been done. Hyperparameter tuning is critical in machine learning and deep learning model development. It is also important to tune hyperparameters in reinforcement learning because they affect the overall training of the model. The values of learning rate, discount factor, and exploration rate are initially considered to be 0.1, 0.9, and 0.1. The results of various hyperparameter tuning are given below in Table 3. The resultant scores have been obtained separately for both DSM and IdSM. The hyperparameters have been tuned keeping two of them as constants and varying the last one as 0.1, 0.5, and 0.9. The idea behind this comparison is to obtain the ideal hyperparameter. The combination can be said to be optimal when they can maximize the difference between the scores obtained for glaucoma subjects and non-glaucoma subjects. This provides a better comparison bracket and helps in a clear differentiation between the condition of the subject. The scores obtained are averaged taking each state of the 49 states as the start state and moving to the target state using the built Q-table.
Hyperparameter tuning in DynaGlaucoDetect
Hyperparameter tuning in DynaGlaucoDetect
From the hyperparameter analysis, we can analyze the trends of the glaucoma and non-glaucoma scores as the hyperparameters are increased or decreased. We observe that for DSM the magnitudes of the scores obtained are higher while IdSM gives lower magnitude scores in decimal values. For DSM, as the discount factor is decreased, the scores shift towards the positive side of the scale from the negative side. Similarly, when the learning rate is increased, the scores tend to shift towards the positive side of the scale. Changing the exploration rate does not affect the scores significantly. For IdSM, when the discount factor is decreased there is not much significant change in the scores. However, if the learning rate is increased, the scores increase gradually. Increasing the exploration rate changes takes the scores along the increasing trend first and they again start decreasing gradually.
It can also be understood that the optimal values are 0.1 for the learning rate, 0.9 for the discount factor, and 0.1 for the exploration rate. The proposed approach and reward system can identify the differences between glaucoma and non-glaucoma subjects’ data and have performed well in obtaining the scores accordingly. The average scores obtained for each state in the environment are obtained and based on the analysis the hyperparameters tuning learning rate 0.1, discount factor 0.9, and exploration rate 0.1 are considered as ideal parameter values. The average scores of the considered parameters are provided in graphical format (see Fig. 13). Graphs have been created separately for DSM and IdSM. The findings indicate that individuals with glaucoma exhibit lower scores, whereas those without glaucoma show higher scores.

Graphical representation of ideal scores DynaGlaucoDetect.
This study concentrates on developing an innovative model-based reinforcement learning (RL) technique, DynaGlaucoDetect, designed for glaucoma detection. DynaGlaucoDetect, crafted from the Dyna-Q algorithm, has been used to analyze the eye gaze data of different subjects in viewing a visual search image and determine whether an individual has glaucoma or not. Further, the work has explored two methods to synthesize the Q-table: the Direct Synthesis Method and the Indirect Synthesis Method. The distinct eye movement patterns between individuals with glaucoma and those without have been discerned through a predefined reward system. The score obtained for glaucoma subjects is –1053 and for those without glaucoma is –677 when the direct synthesis method is used. Similarly, the score obtained for glaucoma subjects is 0.18 and for those without glaucoma is 0.84. The motive of the current research is to build the model such that it shows more difference between the scores obtained for glaucoma and non-glaucoma subjects. From the scores, it is evident that only DSM has been able to draw a larger line of difference between glaucoma and non-glaucoma subjects. Therefore, it is understood that the scores obtained by glaucoma subjects are lower than those obtained by subjects without glaucoma.