
Abstract
Small and medium-sized enterprises (SMEs) have been suffering from the problem of “difficult and expensive financing.” The few loans available are allocated unevenly to SMEs, resulting in a financing mismatch. To address this problem, this paper constructs a system dynamics model to simulate and calculate the theoretical loan amounts of SMEs. Compares the values between the theoretical and actual loan amount to find out the enterprises with extreme values of the difference. Then, it analyzes the characteristics of the index data of these enterprises to explore feasible solutions to solve the financing mismatch problem. The CRITIC and AHP weight determination methods will be used to calculate weights and screen indicators. The data will be quantified and calculated according to the standardized scoring table of enterprise borrowing factor indicators. The results show that enterprises with actual borrowing amounts higher than the theoretical borrowing amount perform better than other sample enterprises in three indicators: growth rate of primary business income, the upper limit of the loan amount, and subsidy amount. The actual loan amount can be increased by improving these indicators. This research can help solve the problem of financing mismatch to realize effective resource allocation and provide significant guidance for the research on enterprises to obtain more loans.
Introduction
In response to the U.S. economic embargo and domestic and foreign changes, General Secretary Xi Jinping proposed a dual-cycle development strategy at the Fifth Plenary Session of the 19th Central Committee in May 2020. To accelerate the construction of a new development pattern in which the domestic double cycle is the mainstay and the domestic and international double cycles promote each other, achieve a stable and stable economy. The dual-cycle strategy is a long-term development strategy proposed by China from the perspective of building a solid socialist modern state, a significant long-term strategic deployment made by the Party in the new era from the judgment of the domestic and international situation, and also the way to achieve long-term sustainable development of China’s economy. To some extent, the dual-cycle strategy is historically derived. It continued and developed the supply-side reform strategy of the last five years, extending from supply-side reforms to reforms in production, distribution, consumption, and circulation [1]. The previous development strategy is adjusted for the following reasons: First, the external dependence of China’s economy is decreasing, while the importance of endogenous power is increasing [2]. It is essential to adjust the development strategy to focus on developing the domestic economy. Second, the international situation is changing rapidly, confrontations and frictions are becoming increasingly intense, and the domestic people’s desire for their economic development to be strong and no longer be subject to others is urgent [3]. Only if they are strong can they avoid strife. Third, under the epidemic’s impact, China has gained unparalleled exposure for overcoming the epidemic early and achieving economic growth. While the world’s attention is focused on itself, it is critical to make the domestic market bigger and attract more foreign investment to promote Chinese development. Therefore, it is necessary to implement a double-cycle strategy for the country. SMEs provide a significant boost to economic development for the large domestic cycle. Because SMEs, an indispensable part of a country’s economy, play a vital role in GDP growth and long-term healthy economic development. According to the data previously given by Yi Gang 2018, the central bank governor, SMEs have grown to more than 60 million individual businesses, in addition to more than 20 million legal persons, contributing to more than 50% of China’s tax revenue, more than 60% of GDP, more than 70% of technological innovation, more than 80% of employment and more than 90% of the number of enterprises [4]. Suppose the SMEs with great potential can obtain adequate credit support. In that case, they will be able to contribute to economic development and provide greater impetus to achieve the goal of dual cycle development. However, the problem of expensive and challenging financing for SMEs [5–7] has been challenging to be solved completely over the years. SME’s traditional financing methods are characterized by time-consuming, high threshold, multiple conditions, and low willingness, which reduce the possibility for enterprises to obtain financial support from mainstream channels and weaken their operation and innovation ability. Therefore, it is essential to study how to help SMEs get more loans.
Since SMEs are still facing financing problems, which are hindering the growth of enterprises, many researchers in China and abroad have conducted much research on this issue. Due to many limitations such as smaller size, higher operating risks, and weaker profitability, SMEs find it difficult to reach the threshold of direct financing and thus focus more on obtaining loan support through indirect financing channels of bank credit. However, different types of banks have different attitudes and decisions regarding credit operations with SMEs, which affects the access to SME bank credit facilities. In examining the external influences on the number of loans available to SMEs, Lu et al. [8] used Chinese SME data to empirically find that digital financial inclusion and the proportion of local bank branches are negatively associated with SMEs’ financing constraints. Lu et al. [9] use firm-level data on listed SMEs in China to empirically find that a higher level of financial inclusion with low bank concentration facilitates credit availability to SMEs. Bonfim et al. [10] empirically tested that banks set aside a certain percentage of their loans for relationship loans. Smaller banks provide more and more expensive relationship loans to smaller firms. Hasan et al. [11] found by analyzing the dataset that a strong position of the local cooperative bank will facilitate the firm’s access to bank financing and reduce the financial cost. However, suppose the foreign bank is in a strong position. In that case, it will lead to the opposite situation, where the SME will receive less bank financing. Moreover, the numerous internal factors of SMEs themselves will affect the success rate of obtaining a bank credit business. Cassar et al. [12] argue that the larger the firm’s size, the more significant the proportion of the firm’s financial and long-term debt and bank financing. Firm size can be used as a signaling effect in credit operations to influence bank decisions. Fatoki et al. [13] found through a questionnaire survey of South African SMEs that factors such as firm age, size, collateral, and entrepreneurial characteristics will directly impact SMEs’ access to bank debt financing. In his publications comparing a sample of data from listed, large unlisted, and small and medium-sized firms in Ghana, Abor [14] found that factors such as gender of the entrepreneur, export status, and geographical location of the firm explain a lot about the choice of capital structure. Similarly, Abor [15] also found that industry type is essential in explaining the capital structure of SMEs and will be used as an essential consideration for firms to obtain loans. In summary, although there is a large amount of research on both external financing and internal factors affecting SME financing, the literature is more from an empirical perspective and technical. Only the impact of changes in individual or several variable indicators on the number of corporate loans is considered, and factors acting together and dynamically on the number of loans are not considered. Instead, this paper will consider the impact of multiple variables mentioned above acting together and dynamically on the amount of SME loans. From a complex systems perspective, we use system dynamics to model and simulate changes in corporate loan amounts. Numerous scholars have used a system dynamics approach to study the impact of multiple variables acting together and dynamic changes on the objectives. For example, some scholars have studied the impact of several economic factor variables on China’s financing structure [16], analyzed the potential impact of developing a green economy on China’s economic, social, and environmental systems [17], and studied the impact of the development of science and technology finance on the development of high-tech industries (Wang, 2016) [18], among others. This paper will also refer to the above research paradigm and use a system dynamics approach to study the lending problems of SMEs to bring a new research idea.
In summary, this paper will first screen the metrics to be used in this paper by reading the literature and referring to the metrics already available in various databases. Apply knowledge of system dynamics to create causality and stock-flow diagrams between variables, describing the causal and logical relationships between them. Then, based on the causal and logical relationships in the previous step, the CRITIC weight determination method and the AHP weight determination method, i.e., a combination of objective and subjective methods to screen out the impact indicators with greater weights, construct the system dynamics equations between the variables and simulate the calculation of the theoretical loan amount due to SMEs. Finally, simulations are conducted to reveal the impact of the dynamic changes among multiple variables on the loan amount that SMEs should obtain. When the actual loan amount is compared with the loan amount that enterprises should obtain, the sample of enterprises with the most significant positive and negative differences is screened out. Then, the indicators that have the most significant impact on the loan amount of enterprises have been figured out. It enables companies whose theoretical loan amount is much higher than their actual loan amount to have specific directions for improvement to obtain more loan support and achieve greater growth. Moreover, making a more outstanding contribution to economic development and to the dual-loop strategy.
Our contributions to this work include the following three points. We construct a simulation model calculating the theoretical loan amount of the enterprise based on system dynamics. System dynamics is suitable for analyzing the impact of dynamic changes of multiple factors on target indicators in a complex environment. We can find out the enterprises with financing mismatch problems, which means unequal values exist between the actual and theoretical borrowing amounts. By analyzing the characteristics of enterprises whose actual borrowing amount is higher than the theoretical borrowing amount, we find out the indicators that affect the actual borrowing amount of enterprises and provide the improvement direction for the enterprises with financing demand. This paper finds that the growth rate of an enterprise’s primary business income, the upper limit of the bank loan amount, and the amount of government subsidy positively correlate with the actual borrowing amount of enterprises. Using Vensim software to simulate the theoretical loan amount of enterprises, we find that the ability to adjust the profitability and operating capacity of enterprises can also increase the theoretical loan amount of enterprises. We also derive results on the impact of several dynamic indicators on the theoretical loan amount of the firm. The empirical results show that the model has specific feasibility and authenticity.
Construction of the theoretical loan volume model for enterprises
Numerous factors affect the number of enterprise loans in various degrees. However, the enterprises’ demand for loans will increase in the growing process. Therefore, it is necessary to construct a model to calculate the number of loans that should be granted to companies from multiple aspects, perspectives, and dynamic change processes. By comparing the theoretical and the practical amount of loans of different enterprises and the number of loans obtained by the same enterprise in different years, we analyze the indicators that have the most significant impact on the number of loans. It helps enterprises satisfy loan demand by improving the indicators correlated with the loan amount. We can construct a theoretical loan model for enterprises following the steps below.
It can be seen from Fig. 1 that the algorithm of this paper contains six steps: the first step is a theoretical description to lay the theoretical foundation for the feasibility of this paper. The second step is to analyze the causal relationship of subsystems affecting the theoretical loan amount and initially clarify the modeling thoughts. The third part is to select indicators based on previous studies to enrich the academic foundation of this paper. The fourth step is to screen indicators to reduce the complexity of the calculation and improve the feasibility of the analysis. The fifth step is to construct equations and simulations. The sixth step is to analyze the results, explore the actual factors affecting SMEs’ financing, and seek solutions that can change the financing dilemma of SMEs. The six steps of the algorithm are described in detail below.
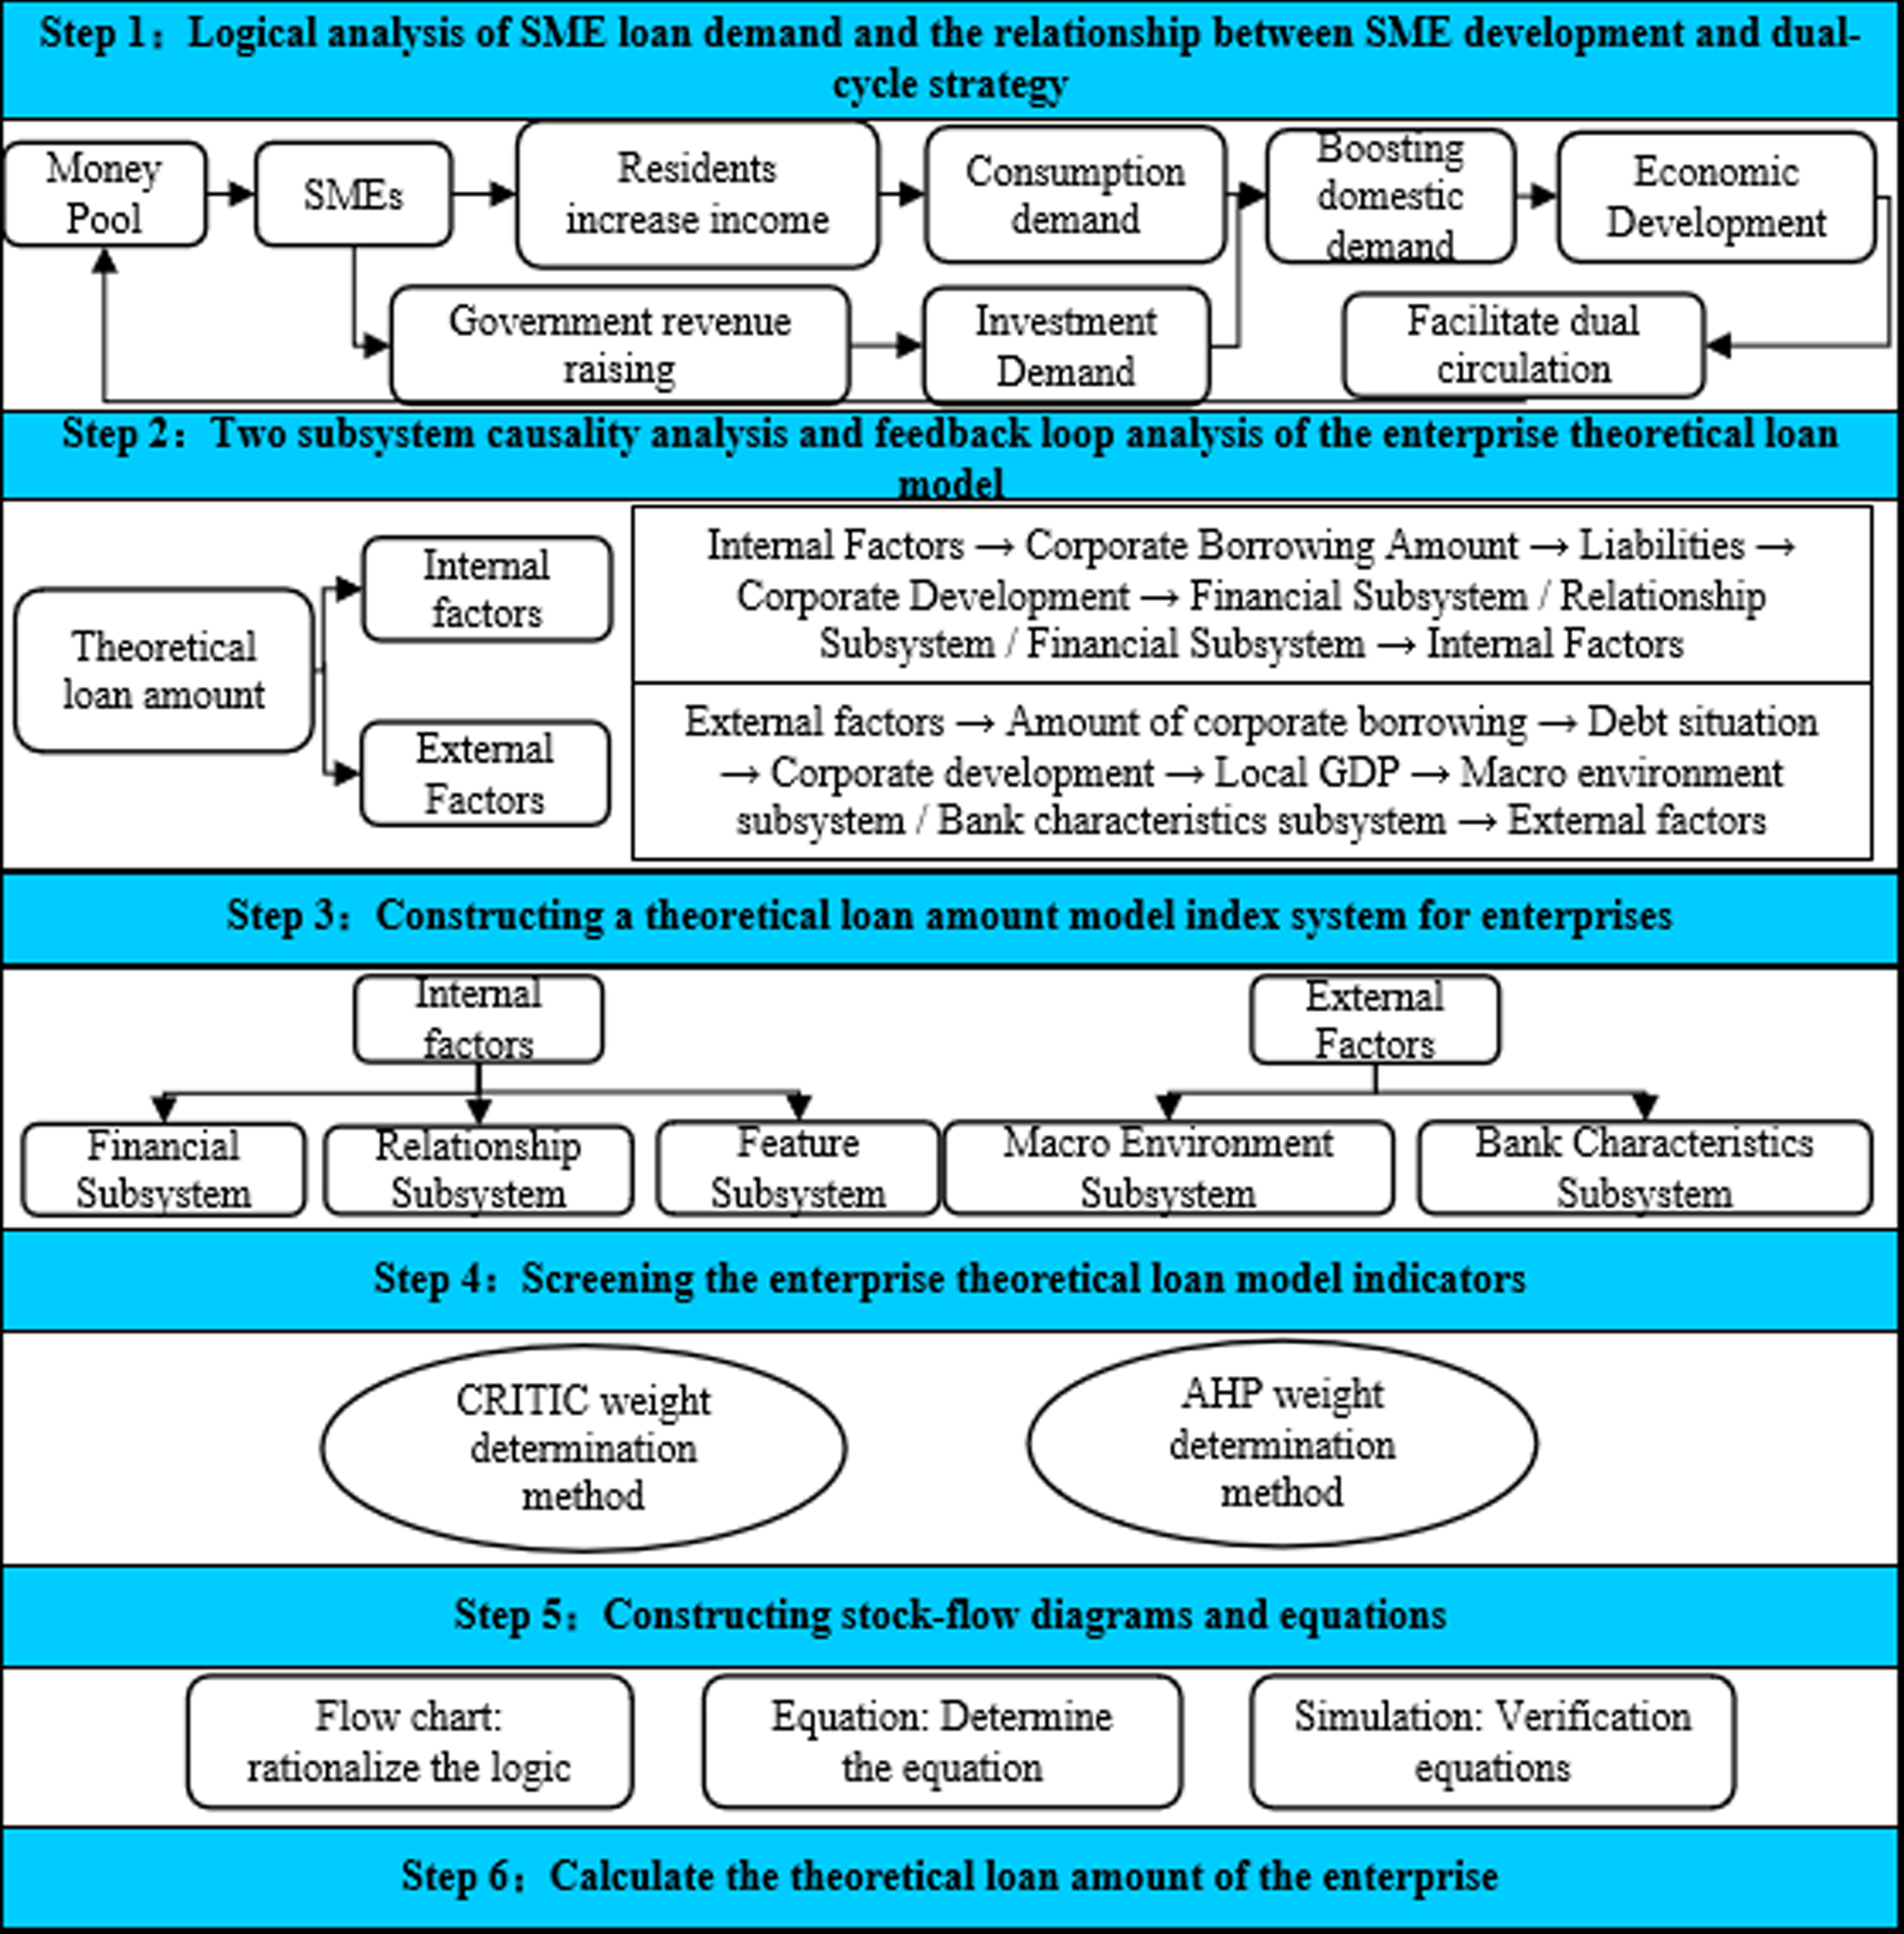
Algorithm step-by-step diagram.
In the first step, it is necessary to analyze the logic of SME loan demand and the relationship between SME development and the dual-cycle strategy to show that business development is closely related to loans. The reality is that the development and growth of enterprises are inseparable from financial support and that the implementation of the dual-cycle strategy is inseparable from the development and growth of SMEs. With that causal chain premise, the theoretical loan amount model for firms designed in this paper can be given more theoretical importance. The current situation of domestic SMEs is that although they play a huge role in economic development, they have been facing the problem of insufficient financial loan support for various reasons. However, SMEs that obtain sufficient loan support are better able to grow and develop, driving local economic development and helping to implement the dual-cycle strategy. The specific schematic diagram is as follows.
As shown in Fig. 2, the funds for enterprise development come from capital market financing, bank and guarantee institution financing, own funds, and extra-institutional financing, which form the pool of funds that enterprises can obtain loan support. Enterprises that obtain sufficient funds from the above-mentioned channels, together with government support policies and more information on government documents, will be able to help them grasp the direction of policies and opportunities and develop at a fast pace. The development and growth of local enterprises can further develop their scale and efficiency, allowing the local economy to develop and contribute more tax revenue. With increased government revenues, the government will be more willing and able to take measures to help incubate more businesses and support more enterprise development. At the same time, the local developed economic level and high wage income will be able to attract more local and foreign people to stay and develop, attract more supporting industries, stimulate local consumer demand and investment demand, and ultimately achieve the purpose of boosting local domestic demand. Most importantly, boosting domestic demand is the key to smoothing domestic circulation. Providing funds to support local SMEs enables local economic development, helps the government achieve long and short-term economic goals, and makes the local economy more affluent. Furthermore, suppose the local economy becomes affluent. In that case, whether they save or spend, the people can help the local business development capital pool to further develop and grow. This can also provide more financial support to SMEs, creating a positive feedback loop.

Impact of SME development on economic development.
The above cause-and-effect relationship of SME development on economic development shows that SME development plays a positive feedback role on local economic development and helps realize the domestic circulation strategy. At the same time, it is only by paying attention to the development of small and medium-sized enterprises and through the logic of enterprise development leading to economic development that the domestic consumer market can be made more significant. In turn, due to the profit-seeking nature of capital, this will draw the attention of foreign capital to the domestic consumer market, prompting the inflow of foreign capital into the country and leading to its investment development. And then, with the national import and export trade action, to achieve the purpose of the external cycle and ultimately realize the new development pattern of domestic double-cycle as the main body, domestic and international double cycle to promote each other. In this regard, SMEs play a crucial role. In conclusion, if SMEs are supported by loans to achieve good development, then the above logical deduction will likely become a reality and facilitate the implementation of the dual-cycle strategy. Therefore, the theoretical loan volume model of enterprises established in this paper can help SMEs find the direction of improvement and improve their lending situation by finding out the factors that affect the actual loan volume of enterprises. The theoretical significance of this article becomes particularly important.
Firstly, the two subsystems are analyzed as feedback effects of each other. Because many factors affect the loan volume of enterprises, which can form an extensive complex system. This paper distinguishes these factors in a way that affects the loan number of enterprises: the endogenous influencing factors of enterprises as the factors of the internal factors subsystem, the factors of the external environment affecting the loan amount of enterprises as the factors of the external factors subsystem, and the internal and external subsystems are mutually influencing each other. The three mutual effects become a complex system dynamics model with positive and negative feedback effects. The internal factor subsystem in this paper contains three subsystems: the financial subsystem, the relationship subsystem, and the characteristics subsystem. The external factor subsystem is divided into the macro-environment and bank characteristics subsystem. It is composed as shown in the following figure:
As shown in Fig. 3, there are mutual feedback influences between the higher-level subsystems, i.e., the internal and the external factors subsystem, including positive and negative feedback influences. The positive feedback effect is reflected in the fact that when the internal factors perform well, the external factors will also adjust their company assessment. In other words, suppose the three subsystems of the financial subsystem, relationship subsystem, and characteristics subsystem perform well in general. In this case, the bank and macro environment subsystems pay more attention and provide more support. It is easy to understand, such as Huawei, Laoganma, and Wahaha, that when companies with good efficiency and healthy operation are considered potential high-quality enterprises, local governments and financial intermediaries such as banks are willing and inclined to invest in them. Similarly, when the overall macro environment is favorable, its advantages and benefits will radiate to many enterprises within its jurisdiction. When the local government policy supports the SMEs development more strongly, and banks are more open to credit, the number of loans available to SMEs will be significantly increased. It will also have a positive impact on the internal subsystem of enterprises. Thus, the internal factor subsystem and the external factor subsystem have positive feedback influence on each other. However, both can also show adverse feedback effects, i.e., when the internal factors of a company perform poorly, external factors will also refuse to offer loans to that company. When external factors are sluggish, the amount of lending to SMEs in the jurisdiction will be significantly reduced.
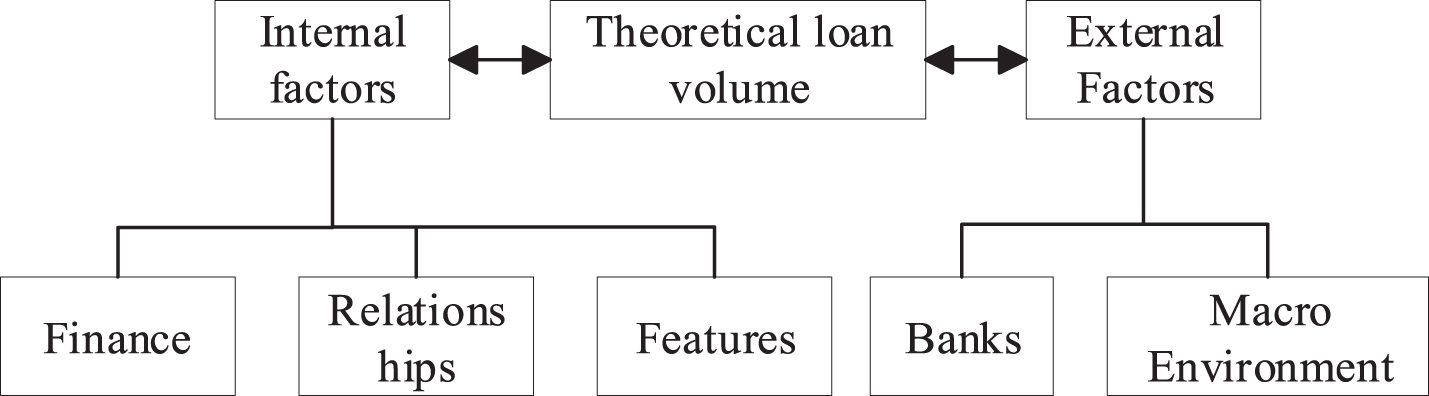
Composition of the theoretical loan volume model for enterprises.
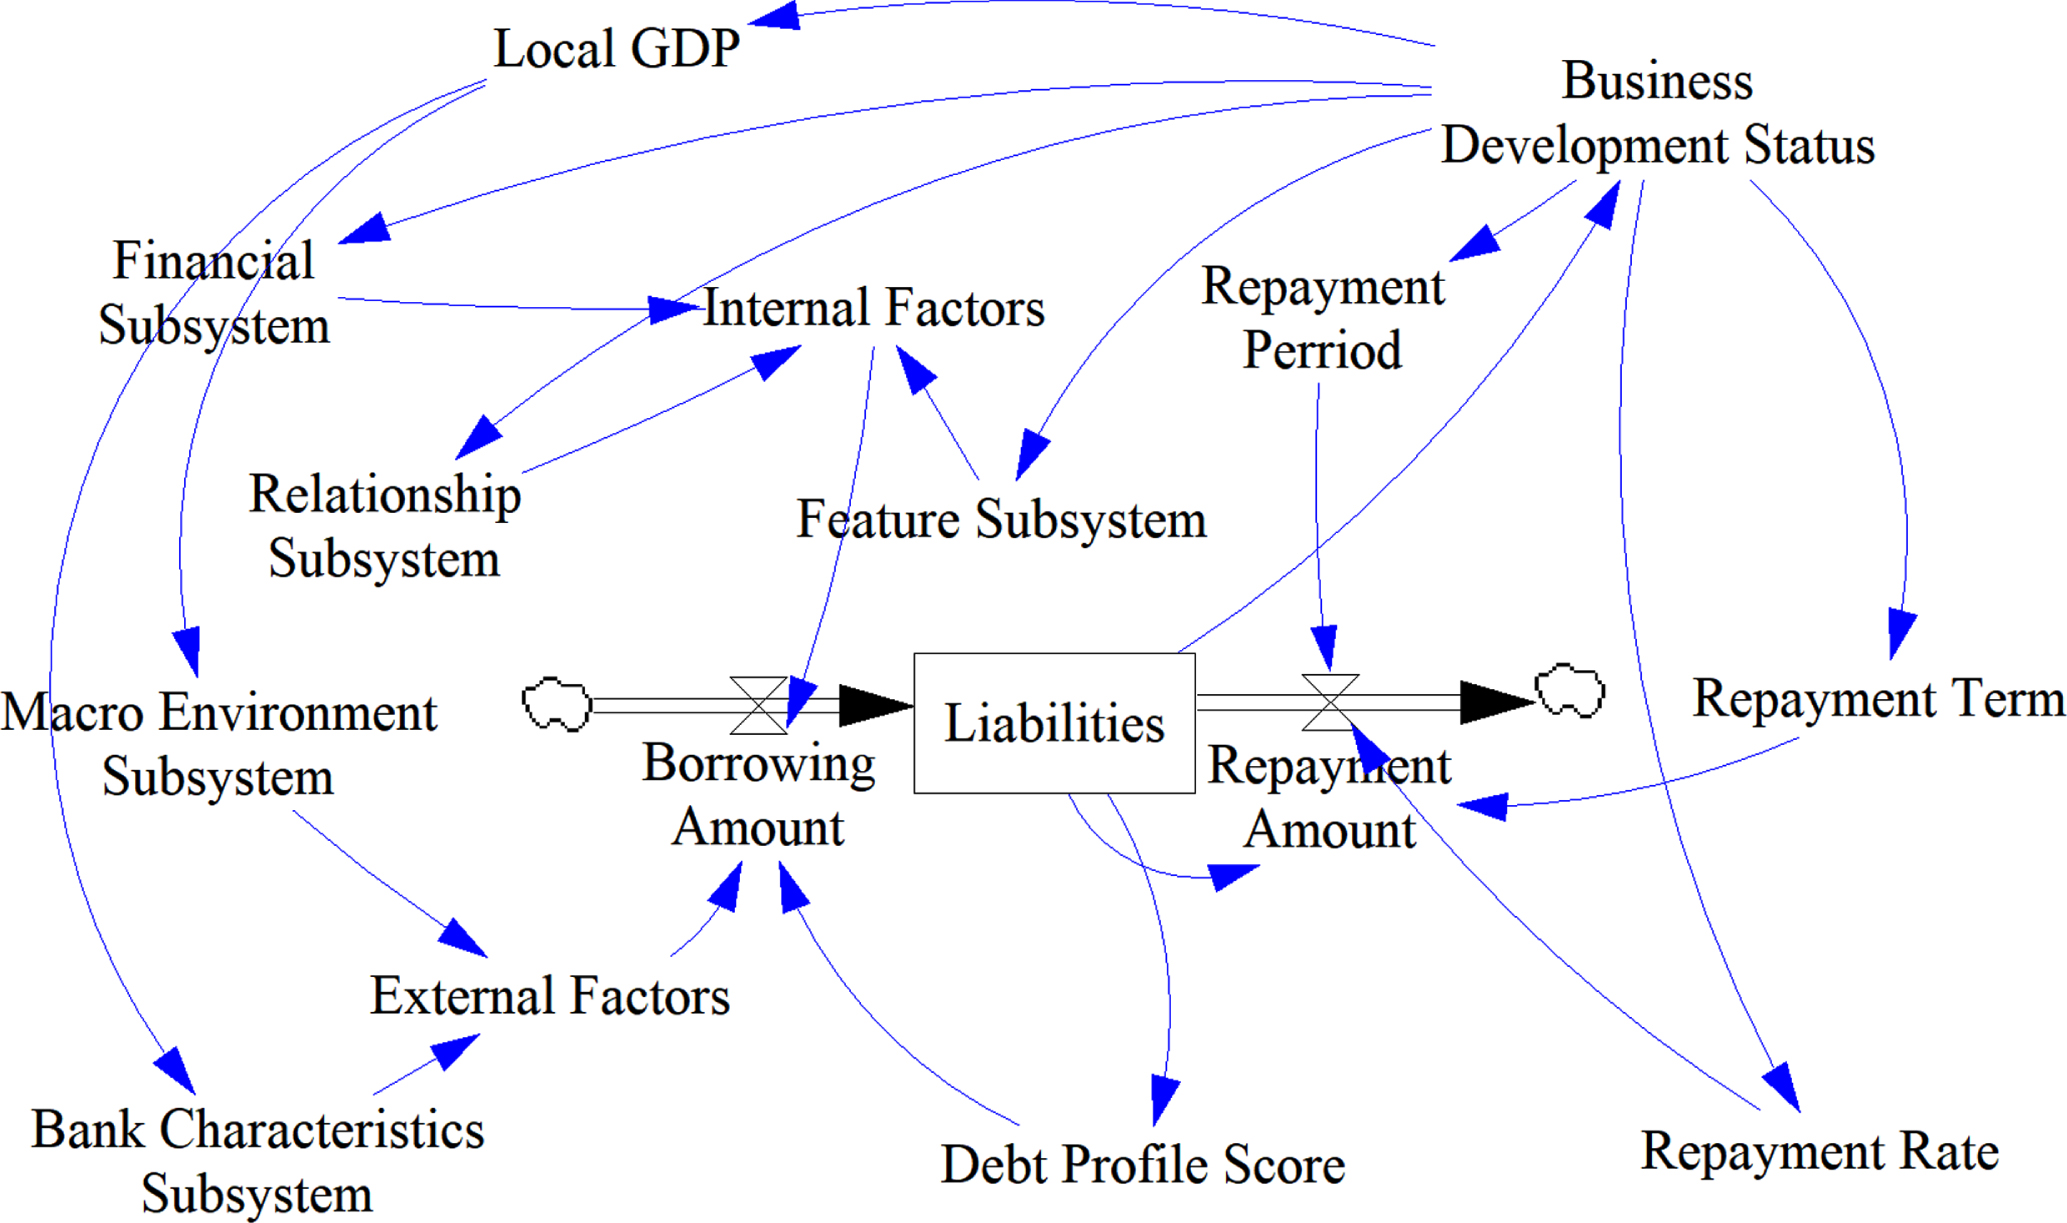
As shown in Fig. 4, the loan amount of a firm is influenced by both internal and external factors. The theoretical loan volume model of the firm in this paper consists of three main feedback loops: the internal factors supporting the firm’s development loop the external factors supporting the development loop the liabilities situation supporting the repayment loop

Cause-and-effect diagram of subsystem interactions.
The loop of Internal factors supporting corporate development: internal factors ⟶ corporate borrowing amount ⟶ liabilities situation ⟶ corporate development ⟶ financial subsystem/relationship subsystem/characteristics subsystem ⟶ internal factors. Internal factors supporting the business development circuit mean that a company whose internal factors indicators meet the audit threshold of banks and other financial institutions will have a better chance to obtain financial support to develop and grow. It also achieves a healthy debt situation and excellent business development status. At the same time, the development status of a good business will promote key internal factors such as the company’s finances, relationships, and characteristics. In short, the loop of the internal factors supporting the business development is positive.
The loop of External factors supporting enterprise development: external factors ⟶ enterprise borrowing amount ⟶ debt situation ⟶ enterprise development ⟶ local GDP ⟶ macro-environment subsystem/bank characteristics subsystem ⟶ external factors. External factors supporting the enterprise development circuit mean that the business environment in the area where the enterprise is located is good. Local financial institutions have the ability and willingness to provide financial support for SMEs. So that SMEs obtain better development opportunities, contribute to more tax revenue and jobs and improve enterprise profits, thus increasing the value of local GDP. Moreover, local economic development can also provide a better business environment for enterprises, positively impacting external factors such as the macro environment and bank support. The loop of the external factor supporting the development is positive.
Liabilities situation supporting the repayment: Liabilities situation ⟶ Business development status ⟶ Repayment cycle/Repayment rate ⟶ Repayment amount ⟶ Debt profile. It means that a healthy debt profile of a company brings more growth opportunities, access to better development, and more loan support, i.e., longer repayment cycles and lower repayment rates, requiring lower single repayment of loan principal and interest, and a more favorable debt profile of the company. The debt situation supports that the repayment loop is positive. In summary, this paper will construct the system dynamics equations for the theoretical loan volume of the enterprise based on these three feedback loops and conduct subsequent analysis.
The third step is mainly through extensive reading of the literature to learn from the index system selected by previous authors and the selection of indicators contained in existing databases, the combination of the two methods to get this paper’s theoretical loan amount model index system for enterprises. The factors affecting corporate borrowing in this paper are divided into two aspects of internal and external factors. The internal factors contain three subsystems of the financial subsystemml: the relationship subsystem and the characteristics subsystem. The external factors contain two subsystems: the macro-environment subsystem and the bank characteristics subsystem.
The financial sub-system contains four modules: solvency, operating capacity, profitability, and growth capacity. The selected solvency indicators are financial leverage, current ratio, tangible net worth debt ratio, gearing ratio, and operating cash flow ratio. The selected indicators of operating capability are enterprise size, inventory turnover, accounts receivable turnover, and current asset turnover. The selected profitability indicators are total investment return, net asset margin, net sales margin, and return on investment. The selected indicators of growth capability include the growth rate of primary business income, R&D expense rate, net profit growth rate, and capital accumulation rate. The specific schematic diagram is as follows:
As shown in Fig. 5, the four modules of enterprise’s solvency, operating capacity, profitability, and growth capacity are all positively related to the financial subsystem. In other words, the stronger the enterprise’s solvency, the stronger the operating capacity. The stronger the profitability and the growth capacity both indicate, the stronger the enterprise’s financial situation is good. It can boost the enterprise’s confidence to complete the loan business to a certain extent. Most of the specific indexes of these four capabilities are positively related to the four capabilities. Specifically, debt service capability is positively related to the current and operating cash flow ratios. Tangible net worth debt ratio, gearing ratio, and financial leverage are negatively related. Operating capability is positively related to enterprise size inventory turnover, accounts receivable turnover, and current asset turnover. Profitability is positively related to total return on investment, net asset margin, net sales margin, and return on investment. Growth capability is positively related to revenue growth rate, R&D expense ratio, net profit growth rate, and capital accumulation rate. Profitability is positively related to total investment return, net asset margin, net sales margin, and return on investment. Growth capability is positively related to the main business income growth rate, R&D expense ratio, net profit growth rate, and capital accumulation rate.

Composition of financial subsystem indicators.
The relationship sub-system includes banking-enterprise relationship, government-enterprise relationship, and credit rating module. The bank-enterprise relationship module measures the relationship between enterprises and banks. The selected indicators are the number of lending banks and the upper limit of the loan amount. The government-enterprise relationship is used to measure the relationship between enterprises and the government, measured by the number of government subsidies for enterprises used. Credit rating indicators describe the credit rating module. And credit rating is a rating given by financial institutions based on the comprehensive performance of enterprises in the past, which can represent the attitude of financial institutions toward enterprises to a certain extent. The specific schematic diagram is as follows:
As shown in Fig. 6, the three modules of the enterprise’s bank-enterprise relationship, government-enterprise relationship, and credit rating are all positively related to the relationship subsystem. For example, the stronger the government-enterprise relationship, bank-enterprise relationship, and higher credit rating is, the more substantial relationship ability enterprise has. It can get more loan support through more banking channels and better government and rating agency endorsement ability. The higher the subsidy amount represents, the strong relationship between the enterprise and the local government is positively related to the government-enterprise relationship. The higher the credit rating, the excellent credit record of the enterprise, which is positively related to the credit rating. The higher the number of lending banks and the upper limit of loan amount, the enterprise has enough experience to maintain the relationship with the banks, positively related to the banking-enterprise relationship.

The composition of relational subsystem indicators.
The characteristic subsystem consists of the age of the enterprise and the financing scale indicator. The former refers to the time from when the enterprise is listed. While the latter refers to the current accumulated loans of the enterprise, which can be calculated by the payable interest indicator of the enterprise. Meanwhile, the age of an enterprise is positively influenced by the characteristic ability because the survival and development time can represent the ability of an enterprise to a certain extent. At the same time, the financing scale of an enterprise is negatively influenced by the characteristic ability of an enterprise. Suppose the financing level of an enterprise is too high. In that case, it means too much-accumulated debt amount to obtain the subsequent loan.
The macro-environment subsystem consists of the macro environment policy module, the financial structure module, and the local government policy module. The macro-environment policy module consists of GDP growth, benchmark interest rate, and monetary liquidity. The financial structure module consists of three indicators: local market concentration, the relative position of small, and medium-sized banks and the proportion of bank intermediation. The local government policy module consists of government guarantee policies, financial support and tax incentives.
As shown in Fig. 7, macroeconomic policies are used to measure the macroeconomic environment faced by enterprises during their operation. The relationship between each indicator and enterprise development is as follows: an increase in GDP growth rate means that the domestic economic development situation becomes better, which positively impacts enterprise development and borrowing conditions. A lower benchmark interest rate enables enterprises to obtain loans with lower interest rates, which positively impacts enterprise development. Enhanced monetary liquidity means that banks have more funds available for lending operations. The financial structure coefficient is used to measure the local financial development conditions in the enterprise. It and the development of the enterprise are mutually reinforcing each other. The composition of an excellent financial structure can better help the enterprise to obtain loan support for development. While the development of the enterprise itself will also give back to the local economy, helping the enterprise itself and the workers of the upstream and downstream supply chain enterprises to increase their income. It will help banks and other financial institutions draw loans and have more funds for business. Market concentration refers to the proportion of the total assets of the top five banks with the largest total assets in the total assets of all sample banks, which is negatively related to the relative position of small and medium-sized banks in the banking industry. Because the relative position of small and medium-sized banks is calculated as the proportion of total assets of small and medium-sized banks in the total assets of the banking industry. The higher the percentage of assets of the head bank, the more unfavorable to the bottom small and medium-sized banks. The small and medium-sized banks can grasp the soft information of local enterprises and are more willing to lend to SMEs. Therefore, Smaller banks with fewer state assets are more likely not to lend to companies. The ratio of bank intermediaries to the financial market is the ratio of total loans of financial institutions to the market value of stocks. The ratio of bank intermediaries to financial market BS and the relative position of small and medium-sized banks in the banking industry SMB are two financial structure indicators. The former portrays the structure of the financial system in terms of significant financing channels. In contrast, the latter portrays the structure of the banking sector in terms of size and distribution. A rise in SMB drives a rise in BS, and there is a positive correlation between them. Local government policy is also an essential factor influencing the borrowing of enterprises. If there is a corresponding guarantee policy, it can help enterprises obtain loans. Financial support and tax incentives are support means to help enterprises reduce expenses and help enterprises obtain better statements of earnings to obtain loans. Both policies have a positive impact on the number of business loans.

Composition of macro environment subsystem indicators.
The banking industry characteristics subsystem consists of two modules: the conventional characteristics module and the bank operation module. The conventional characteristics module is composed of the competitive situation of the regional banking industry. The bank operation module is composed of bank risk and lending capacity. Bank risk indicators are divided into capital adequacy constraints and non-performing loan ratios, and bank size indicators indicate lending capacity. The details are as follows:
As shown in Fig. 8, bank operation represents the operation of the lending bank itself. Banking competition represents the competition among local banks. Both of which are positively related to the ability of the bank characteristics subsystem. Because of the more intense competition among banks, enterprises will enjoy more favorable bank lending services. The better the bank’s operations, the more ready funds will also be available to provide borrowing services to SMEs. The bank’s operations are measured by borrowing capacity, capital adequacy constraint, and non-performing loan ratio. Higher capital adequacy constraints and non-performing loan ratio represent a higher risk for the bank and indicate poor operations. Borrowing capacity is positively related to the firm’s operations.
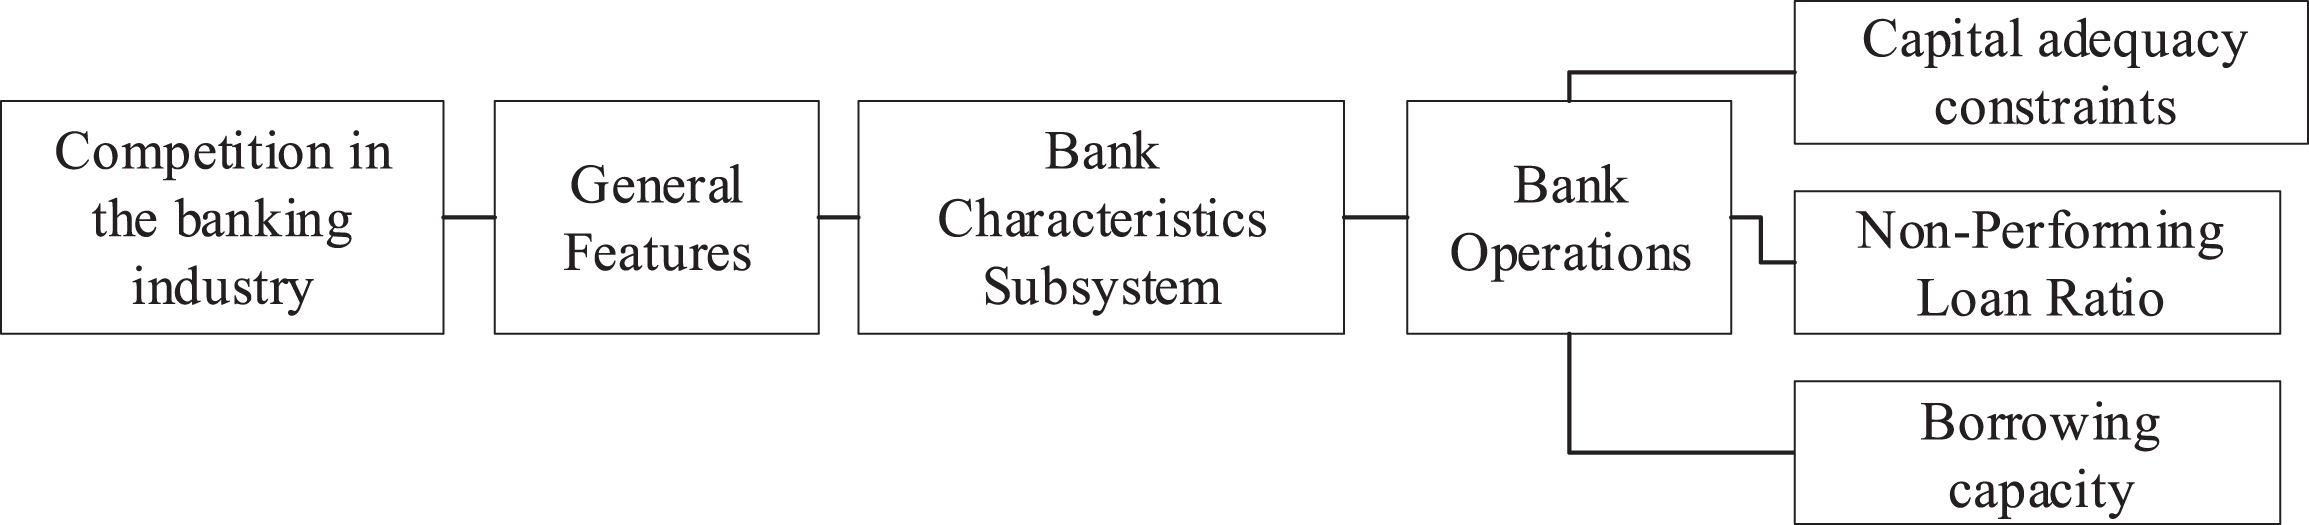
Composition of bank characteristics subsystem indicators.
In summary, the index system influencing the factors of corporate borrowing in this paper has been initially constructed, and the specific tables are shown below:
As shown in Table 1, the table contains specific indicators for each subindex system in Figs. 4 –Fig. 7. The financial subsystem consists of four layers: solvency, profitability, operational capability, and growth capability. The relationship subsystem contains three layers: bank-enterprise relationship, government-enterprise relationship, and credit rating. The characteristics subsystem contains two indicators: ownership nature and age of the enterprise. The macro-environment subsystem consists of macroeconomic policy, financial structure, and local government policy. The bank characteristics subsystem consists of bank operation and general characteristics criteria. The specific indicators of each criterion layer above are shown above, which are the relevant indicators of preliminary sea selection. Combining each specific indicator is used to measure different aspects of the target. Considering multiple aspects of indicators can measure the target more practically and precisely. However, multiple indicators should be processed by dimensionality reduction to facilitate the construction and calculation of the equation.
Composition of the evaluation index system of enterprise borrowing factors
In this paper, we will use the combination of the CRITIC method and AHP method to give different weights to different types of indicators and rank the weight values of each indicator. Moreover, when the sum of the weights of the top-ranked indicators exceeds 85%, the indicators that have not been accumulated will be screened out to achieve the effect of screening indicators. CRITIC method: The objective weighting method is characterized by determining the weights by measuring the characteristics of the data itself, which can make the weights more objective. AHP method: Hierarchical analysis, a multi-criteria decision analysis method combining qualitative and quantitative analysis, is suitable for weight determination in the presence of uncertainty and subjective information. This step will determine the indicator weights by combining the CRITIC method and the AHP method and screen the indicators by of 85% accumulation threshold of weighted indicators.
The CRITIC indicator weight determination method can determine the weights from the data using the standard deviation and correlation coefficient of the indicator data. Consider two aspects of indicator variability and indicator conflict: indicator variability is expressed using standard deviation. If the standard deviation of the data is significant, it indicates greater volatility and higher weight. Indicator conflict is expressed using a correlation coefficient. If the correlation coefficient between indicators is significant, it indicates less conflict, and then its weight is lower. Determining the weights by measuring the characteristics of the data itself can make the weights more objective.
The calculation steps contain three steps: First, the indicators are isotropic. When the actual selection of indicators, not all indicators are generally isotropic with the target, then it is necessary to assimilate the negative indicators into positive indicators. The conversion formula is:
Among them, max |X i | indicates the maximum value of the i - th indicator, i.e., the maximum value of row i in matrix X. p is the coordination coefficient. After processing the above equation, the normalized evaluation matrix X′ can be obtained.
Second, the dimensionless of the indicator data is to eliminate the adverse effects of non-uniform units. The formula is expressed as shown in formula (2).
Third, the objective weights of the indicators are calculated. The variance and correlation coefficients of the indicators are calculated to indicate the indicator variability and conflict between the indicators, respectively. The specific formulas are as follows:
Where s
i
is the standard deviation, ρ
ij
is the correlation coefficient, is the standard matrix,
Where
The AHP method’s basic idea is to transform the overall judgment of the weights of multiple elements composing a complex problem into a ‘two-by-two comparison’ of these elements to choose the relative importance of the factors in the hierarchy. Then, integrate the expert’s judgment to determine the overall ranking of the relative importance of each element. The specific implementation steps are:
First, establish a recursive hierarchy. The index elements in the index system are divided into several groups according to different attributes to form different levels. The elements of the same level serve as guidelines, which both dominate individual elements of the next level and are governed by the elements of the previous level, thus forming a progressive hierarchy. The uppermost level is the goal level, where generally, only one element represents the pre-defined goal of the analyzed problem. The middle level is the criterion level, meaning the rules of comparison. Moreover, the bottom level is the solution level for decision-making.
Second, the judgment matrix for two-by-two comparisons is established in the following formml:
Where the matrix C is a positive reciprocal inverse matrix with the following properties: C ij > 0, C ii = 1 (i = 1, 2, ⋯ , n), b ij = 1/b ji (i, j = 1, 2, ⋯ , n). And b ij is the relative importance judgment value corresponding to the previous level element b j to its next level b i , generally using 1-9 proportional scale to illustrate the importance and weight of indicators. The number 1 indicates that the two elements with to be essential. The larger the value represents, the former is more important than the latter. The number 9 indicates that the former is extremely important.
The third is the single hierarchical sort. The purpose is to determine the weight values of the order of importance of the elements with which this level is associated. It can be calculated by computing the eigenroots and eigenvectors of the judgment matrix as follows:
λmax is the maximum feature root of A, W is the regularized feature vector corresponding to λmax, and the component W i of W is the weight value of the corresponding element single sort.
Fourth is the consistency test. The purpose is to test the consistency of the judgment matrix, and the formula to be used is as follows:
The calculation structure has the following cases: when CI = 0, the judgment matrix A is consistent. When CI > 0, the larger the value means the consistency of the judgment matrix is worse. It is difficult to achieve complete consistency in real research, and it is necessary to use “satisfactory consistency”. The consistency of the judgment matrix can reach the target level required by the research. The index of “satisfactory consistency” is expressed as RI. Generally, when RI < 0.1, the judgment matrix can be considered to have satisfactory consistency.
In summary, this step introduces the CRITIC method and the AHP method for determining the weights and simplifies the index by setting the weight accumulation threshold of 85% to lay the foundation for the next step of equation construction.
Before establishing equations of system dynamics, the stock-flow should be constructed. Stock flow is built based on a causality diagram, which further distinguishes the nature of variables and more directly represents the logical relationship between system elements. Then, clarifying the role of each element in the dynamics equations. In the dynamics model constructed in this paper, the debt situation is formed by the interaction of borrowing and repayment amounts. So, the rate variables are the borrowing and repayment amounts, and the state variables are the debt situation.
Based on the logical relationship of the above flow chart for the amount of construction of the model in this paper. In order to study the influencing factors affecting the volume of enterprise loans as well as the causal relationships and interactions among the influencing factors, a total of 59 indicator variables related to enterprise loan behavior are considered in this paper: borrowing amount, repayment amount, internal factors, external factors coefficients, debt situation score, amount coefficient, debt situation, repayment interest rate, repayment cycle, repayment period, financial capacity, relationship coefficient, characteristics coefficients, macro environment coefficient, bank characteristics coefficient, bank-enterprise relationship coefficient, government-enterprise relationship coefficient, credit rating coefficient, financing scale coefficient, age coefficient, macroeconomic policy coefficient, financial structure coefficient, local government policy coefficient, bank operation coefficient, conventional characteristics coefficient, solvency coefficient, operating capacity coefficient, profitability coefficient, growth coefficient, loan number of banks, maximum loan amount, GDP growth rate, benchmark interest rate, monetary liquidity, market concentration, relative position of small and medium-sized banks, bank intermediation ratio, government guarantee policy, financial support and tax incentives, lending capacity, asset-liability ratio, financial leverage, tangible asset ratio score, tangible asset ratio score, current ratio score, operating cash flow ratio score, enterprise size, inventory turnover ratio score, accounts receivable turnover ratio, current asset turnover ratio, return on total assets, return on net assets, net sales margin, return on investment, primary business income growth rate, capital accumulation rate, net profit growth rate, R&D expense ratio, capital adequacy constraint, and non-performing loan ratio. The assumption of mathematical notation for each indicator variable is shown in the following table:
As shown in Table 2, 59 indicators are given numerical symbols for the subsequent calculation of the system dynamics equation. In constructing the equation, it is necessary to derive the weights of each indicator in the factors influencing the loan volume for the enterprise using CRITIC indicator weight determination. After the weights are determined, the corresponding calculation formula is shown in the following table:
Mathematical symbol representation of indicator variables
It should be pointed out that Table 3 is the overall formula expression of indicators. However, in the empirical process, some indicators will be screened out after the fourth step of indicator screening. In this step, the formula of each part is summarized, and the final formula of this paper is as follows:
Main equations of the evaluation index system of enterprise borrowing factors
x1 is the company’s indebtedness, described using the difference between the amount borrowed x2 by the company and the integral amount of the repayment amount x3 for each period, as shown in Equation (11). Assuming that the repayment interest rate, repayment period, and repayment cycle of the enterprise are specified for each loan obtained by the enterprise, the company’s indebtedness for each period can be calculated using the formula (11). Similarly, using formula (10), the repayment amount for each period can be calculated, assuming that the bank accrues interest in a compounded manner. Equation (9) is the focus of this paper, which is to simulate the possible borrowing amount of the company by analyzing the internal and external factors affecting the theoretical loan. And comparing it with the actual borrowing amount of the company to find the variable that has the most significant influence on the borrowing amount of the company. We also look for the characteristics of enterprises with a large gap between the actual borrowing amount and the simulated calculated amount and conduct a comprehensive analysis of these enterprise characteristics. Then, summarize the rules and propose corresponding suggestions for enterprises with higher theoretical loan amounts than the actual loan amount to improve their loan situation and develop them better.
The actual borrowing amount is compared with the theoretical borrowing amount and the companies that show the most significant positive and negative differences are identified. By mining and analyzing the indicators of these companies, we identify feasible measures to improve the actual borrowing amount of the companies and make recommendations.
The empirical data in this paper are obtained from the CSMAR database, RESSET database, Wind database, and relevant macroeconomic databases. By limiting the geographical area to Guangdong and the enterprises to those previously listed on the SME board, 262 targets were listed as SMEs. The data are collected one by one according to the indicators used in the screening of this paper, with the period limited to January 1, 2012, to December 31, 2020.
It should be noted that the calculation formula in this paper contains numerous ratings for each indicator, and it is necessary to standardize the ratings for each indicator before the calculation can be carried out successfully. Through the reference, the state-owned Assets Supervision and Administration Commission’s “enterprise performance evaluation standard” and the market competition standard, etc., the advantages and disadvantages of the indicators of small and medium-sized enterprises are divided. Use “excellent”, “good”, “medium”, “low”, “poor” five grades to delimit. The following table lists the standard values. For which standardized scores in the range of [0,1] are used in the calculation:
As shown in Table 4, the standardized scores of each index were determined and used as input values for each index into the Vensim kinetic equation model to simulate the kinetic model of enterprise borrowing factors and complete the simulation model of this paper. Among the internal factors, enterprise size, operating cash flow ratio, inventory turnover, accounts receivable turnover, current asset turnover, net sales margin, return on total assets, return on net assets, return on investment, main business income growth rate, R&D expense ratio, capital accumulation rate, net profit growth rate, current ratio, number of lending banks, maximum loan amount, subsidy amount, credit rating, age, and GDP growth rate indicators are positively correlated with the borrowing amount of enterprises. Among the external factors, GDP growth rate, monetary liquidity, the relative position of small and medium-sized banks, the proportional composition of bank intermediaries, government guarantee policies, financial support and tax incentives, capital adequacy constraints, borrowing capacity, and competition in the banking industry is positively correlated with the borrowing amount of enterprises. The internal factors of tangible net worth debt ratio, financial leverage, gearing ratio, and financing scale indicators are negatively correlated with the borrowing amount of enterprises. The external factors of benchmark interest rate, market concentration, and non-performing loan ratio are negatively correlated with the borrowing amount of enterprises. When determining the weight of each indicator in the formula, the negatively correlated indicators need to be regularized and then calculated accordingly. In addition, according to the type of data and the purpose of model calculation, this paper uses a combination of CRITIC indicator weights and the AHP weight determination method to derive the weights for each enterprise borrowing factor rating system indicator. For the indicators with a large amount of data, the CRITIC indicator weight determination method is used, which includes the content of indicator conflict and indicator variability to determine the amount of information and thus assign the weights:
Taable of evaluation index system of enterprise borrowing factors
Taable of evaluation index system of enterprise borrowing factors
As shown in Table 5, the weight values calculated using the CRITIC indicator weighting method for the five composite indicators of bank-enterprise relationship, solvency, operating capacity, profitability, and growth capacity. The weight values of each of the five components are summed to 1. The weights are assigned according to the amount of information. Within the bank-enterprise relationship indicators, a29a30 set, a29anda30 weight values are 48.41% and 51.59 respectively, with average distribution without screening indicators. Within the set of solvency indicators, a13a14a15a16a17 the lowest is 14.21%, and the sum of the weights of a13a14a15a16 is 85.79%, exceeding the threshold of 85%. Thus, the indicator corresponding to a17 can be screened out. Similarly, among the sets of a18a19a20, a19 has the lowest weight of 3.33%, and the indicator corresponding to a19 can be screened out. Among the sets of a21a22a23a24, a21 and a24 have the lowest weight values, 8.18% and 5.78%, respectively, and the indicators corresponding to a21 and a24 can be screened out. In the set of a25a26a27a28, the lowest weight value of a27 is 5.44%, and the indicators corresponding to a27 can be screened out. Therefore, after filtering out the indicators, the CRITIC weighting analysis was performed again on the remaining indicators, and the results are as follows:
Determination of weight values of CRITIC indicators
The data in Table 6 are the weight values of the screened indicators after screening and then using the CRITIC indicator weighting method to calculate the weight values of the screened indicators. The weighted data in the table tends to be average and can be used as data for the following analysis. The AHP weight determination method was used for the comprehensive indicators with a small amount of data, and the results are shown in the following table:
Determined values of CRITIC index weights after screening
Table 7 uses the AHP weight determination method to determine the weight of external factors, macro-environment coefficient, bank characteristics coefficient, macroeconomic policy coefficient, financial structure coefficient, local government policy coefficient, bank operating conditions coefficient, and bank risk coefficient. The weight values were evenly distributed, and no indicator with a small percentage was screened. Finally, according to the screening results of indicators, the data of 262 listed companies collected in this paper were input into Vensim software. Then the determined weights were simulated into the Vensim model to obtain the following results:
AHP index weights determination values
As shown in Fig. 10, the Vensim simulation calculation diagram designed in this paper divides the factors affecting the borrowing amount into internal and external factors. The internal factors include the financial subsystem, relationship subsystem, and characteristics subsystem. The external factors are divided into a macro-environment and bank characteristics subsystem. The indicators that can evaluate the subsystem are selected among each subsystem to build a comprehensive indicator evaluation system. The simulation results show that the theoretical borrowing amount of the enterprise with code 002130 is much higher than the actual borrowing amount in 2020. Therefore, enterprise 002130 is selected as the analysis case, and the data of the last eight years are selected for simulation again, and the results are as follows:
Flow chart of the impact of corporate borrowing factors.
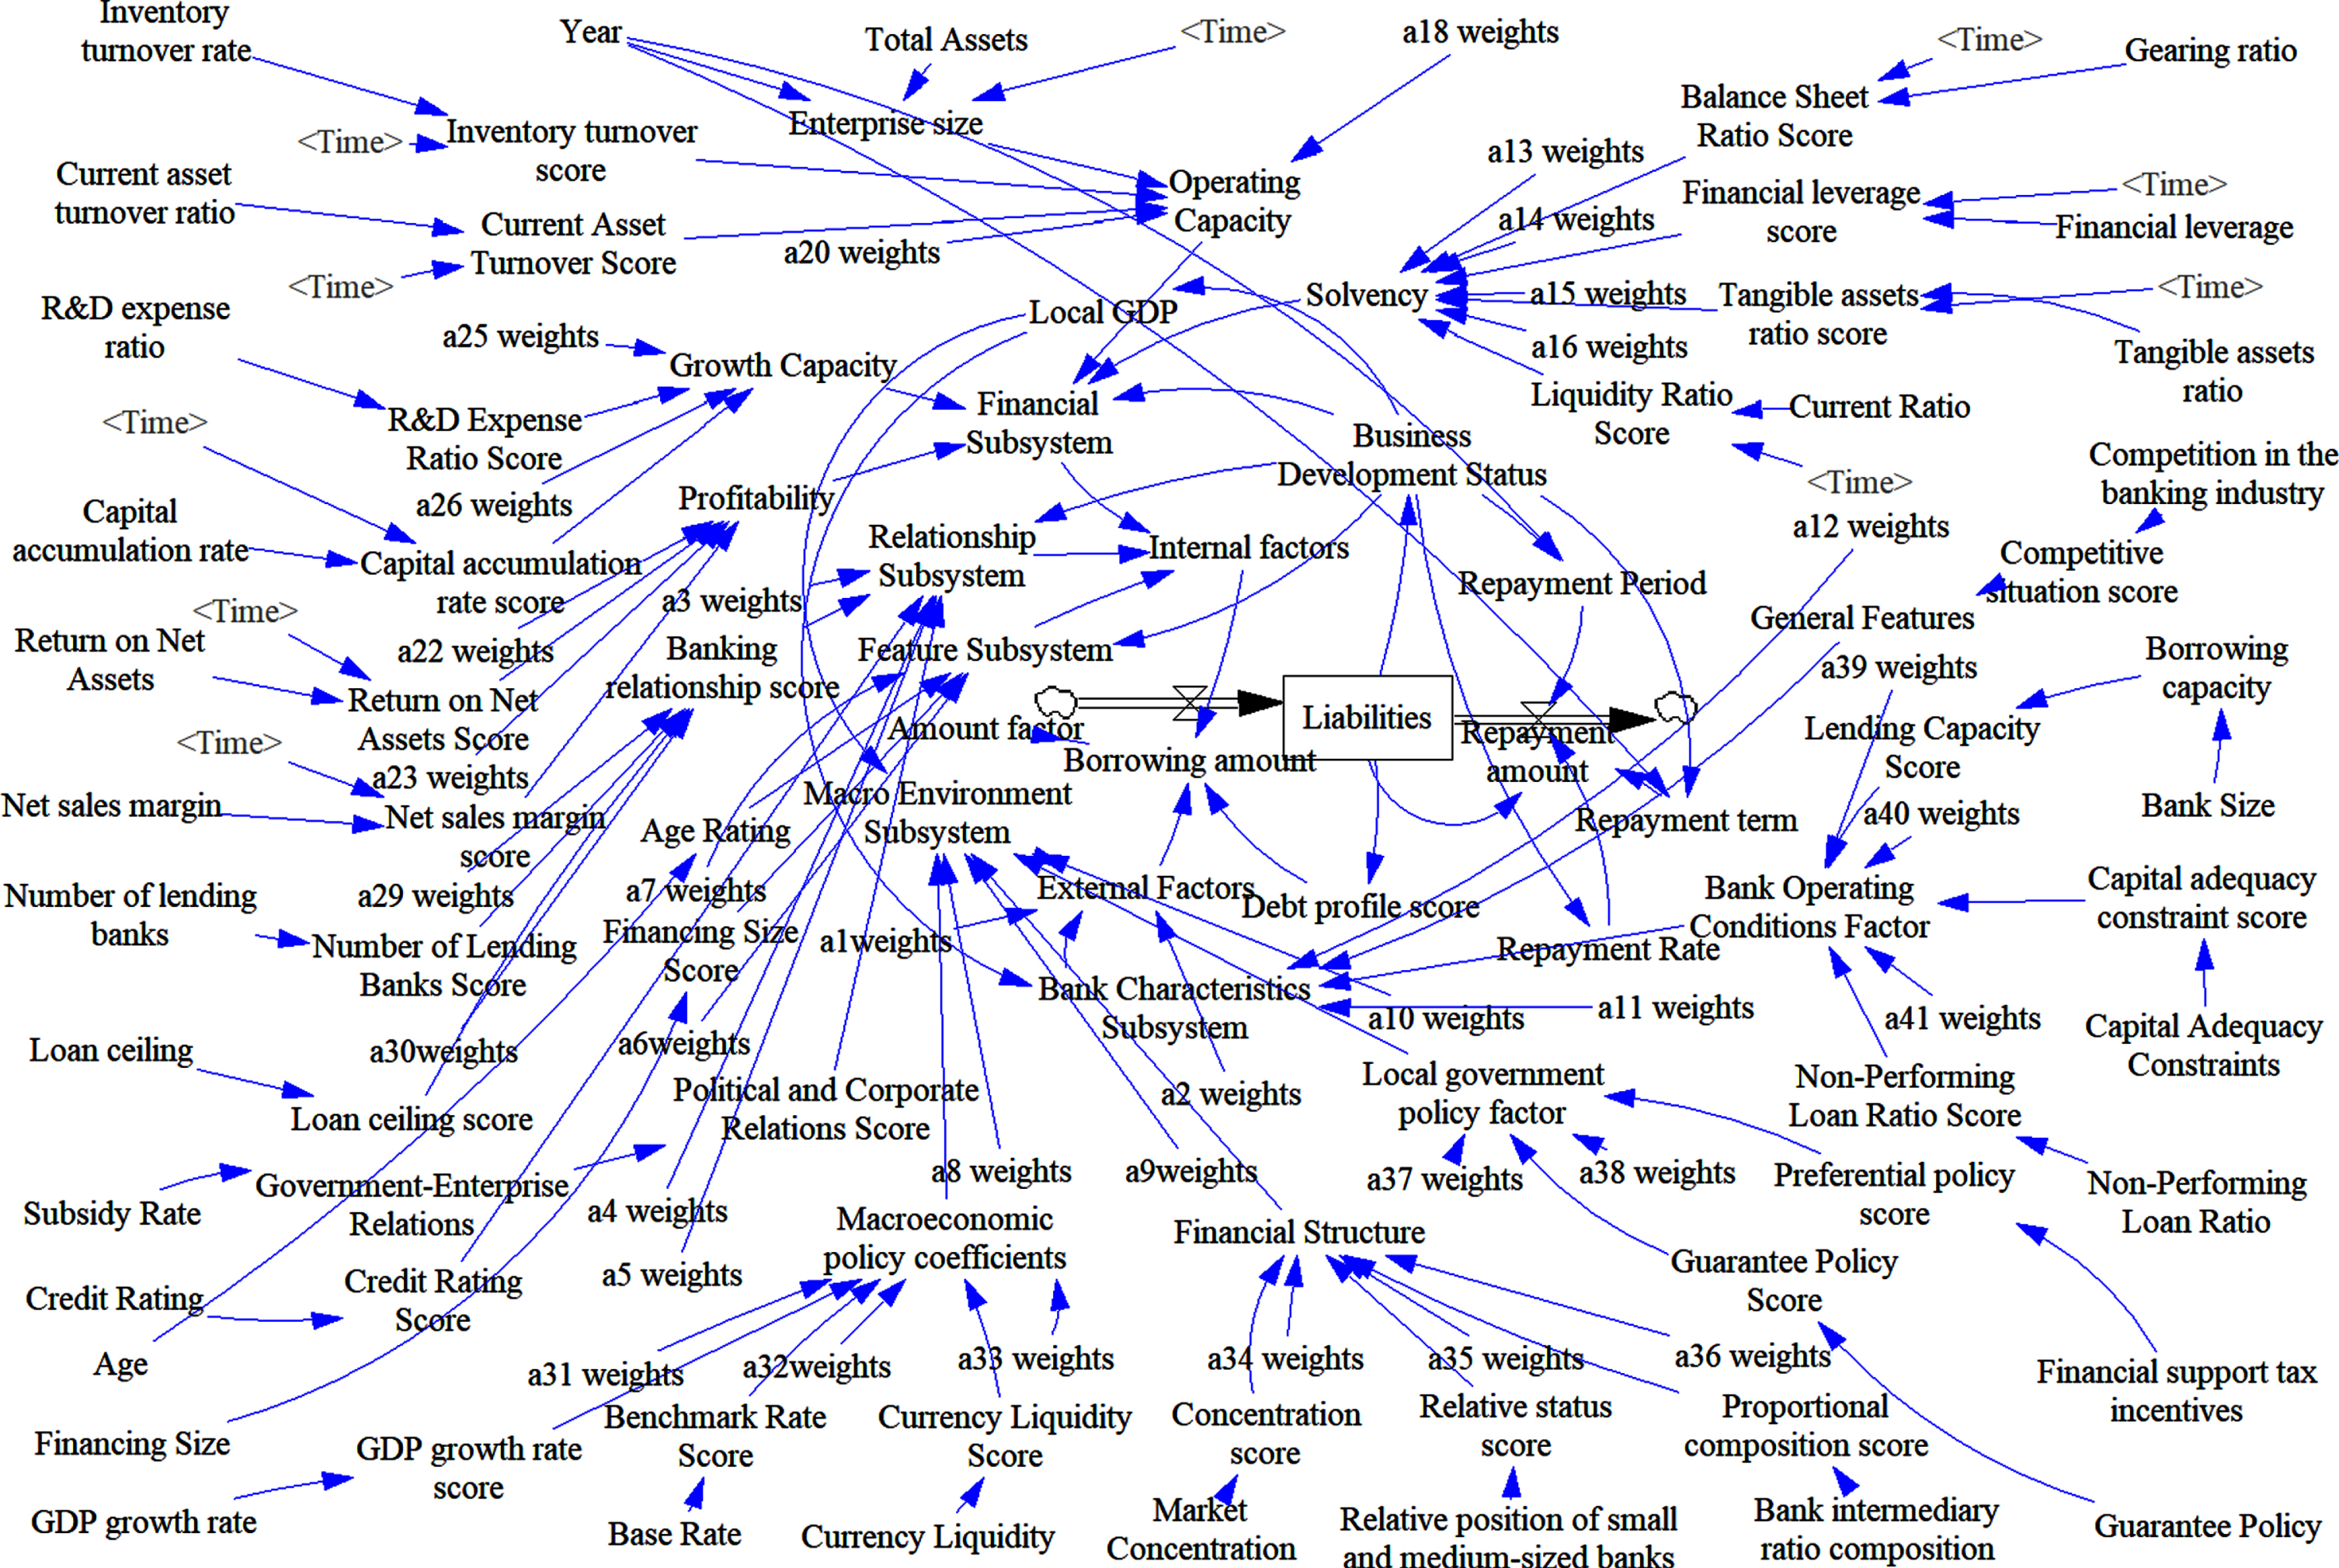
Vensim simulation calculation chart.
As shown in Fig. 11, the final code is the final simulated borrowing amount of the listed company 002130, and the simulated values for nine years are 2.82, 5.50, 6.60, 17.85, 5.25, 12.03, 9.24, 20.21, and 2.641 billion yuan. The actual amount of bank credit used by the company is 2.32, 3.86, 8.97, 10.59, 0, 0, 1,804, 2,362 and 1,336 million yuan. The actual amount of borrowing for the enterprise in 2016 and 2017 is a missing value, and the value of 0 is used here instead. It can be found that the theoretical loan amount of the enterprise 002130 is higher than the actual borrowing amount in four years within the seven years of complete data. The average value of the theoretical loan amount of $1.266 billion is higher than the actual borrowing amount of $1.154 billion, indicating that the enterprise still needs more support from the actual borrowing amount.
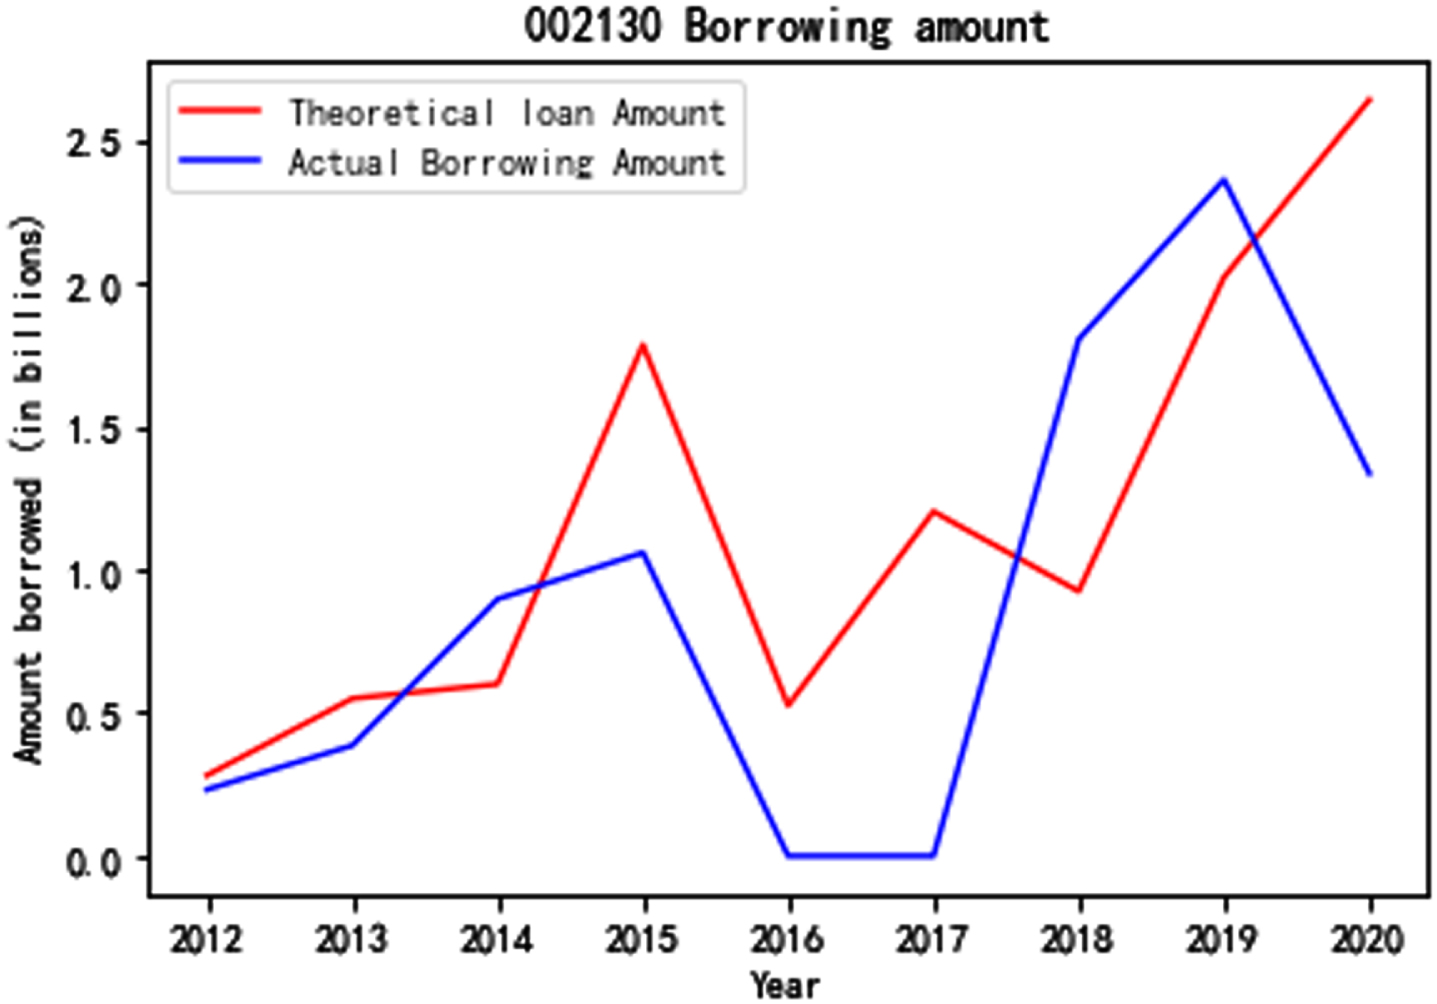
Comparison of theoretical and actual borrowing connection of 002130.
Through the above test, it is clear that the model still has some errors in simulating the possible loan amount of the enterprise. However, among the 262 enterprises in this paper, there will be a sample of enterprises whose actual loan amount is higher than the calculated loan amount. Moreover, by analyzing the value of their indicators, we can suggest where other enterprises should improve to obtain more loan amounts. Therefore, the 262 enterprises that collected data were substituted into the model. Three enterprises were selected in which the actual borrowing amount was higher than the theoretical borrowing amount, as shown in the following table:
As shown in Table 8, the above three representative enterprises all have actual borrowing amounts exceeding the theoretical borrowing amount, in which there must be indicators that affect the borrowing amount. The net profit growth rate of 002060 is 1.01, the growth rate of primary business income is 0.09, the number of banks is 10, the maximum loan amount is 1.395 billion yuan, and the amount of government subsidy is 13.15 million yuan, the above five indicators are better than similar enterprises. The gearing ratio of 002340 is 0.49, and the debt ratio of tangible assets is 0.49, the first two of these five indicators are lower than those of similar enterprises. At the same time, the last three are higher than those of similar enterprises. The above five indicators are higher than similar enterprises, with the maximum loan amount of 200,000,000 yuan and the government subsidy amount of 25,680,000 yuan. It can be seen that the above three enterprises in the five indicators of common performance are to get a lot of government subsidies, an excellent growth rate of main business income, and single loan amount ceiling than the same type of enterprises. The other two indicators according to the nature and characteristics of different enterprises and different. However, the overall will be due to other enterprises obtaining more borrowing amount. As an experiment, the data of the three indicators of the code 002130 enterprise’s primary business income growth rate, government subsidies, and the maximum amount of a single loan can be adjusted to rise to a corresponding level in the scale. The simulation results are as follows:
Borrowing amount results
As shown in Fig. 12, the above simulation results, the simulated value of the theoretical borrowing amount of 002130 enterprises generally shows an increasing trend. The simulated value of the theoretical borrowing amount of the enterprise also increases after adjusting the maximum single loan amount of the bank, the amount of government subsidy, and the combination of the two by one notch, respectively. Among them, increasing the theoretical loan amount of enterprises after increasing the single loan amount is better than the effect of increasing the subsidy amount.

002130 simulation results graph.
Similarly, as shown in Fig. 13, adjusting the operating capacity of 002130 enterprises by raising the inventory turnover ratio and current asset turnover ratio and the combination of the two by one notch, the overall theoretical borrowing amount simulation calculation value generally tends to increase. Among them, increasing the theoretical loan amount after increasing the current asset turnover ratio is better than increasing the inventory turnover ratio.

Simulation results of 002130 operating capacity adjustment.
Again, as shown in Fig. 14, the profitability of 002130 enterprises is adjusted by raising the return on net assets and sales margin as well as the combination of both by one notch for the simulation. The overall theoretical borrowing amount simulation calculation value shows an overall increasing trend. Among them, the effect of increasing the theoretical loan amount of the enterprise after increasing the return on net assets is better than the effect of increasing the sales margin.

Simulation results of 002130 profitability adjustment.
Therefore, there are still many enterprises facing the problem of insufficient actual borrowing amounts. Suppose we can solve the financing mismatch problem of enterprises and achieve efficient resource allocation. In that case, enterprises can achieve more significant progress and development, and as feedback, the local economy can achieve more excellent development. The paper’s theoretical loan system dynamics model can reflect which enterprises have insufficient actual loan support. Assuming that the government can accurately identify and give more support and connect with external financial institutions to give more attention and support. The enterprises can have more power and confidence to invest capital, purchase equipment, hire talents, and research and development innovation. Finally, High-quality development can be achieved.
In this paper, we analyze the critical role of SME development in the healthy and sustainable development of the national economy and discussing the necessity of SME to raise the government’s attention to SME development in the context of a dual cycle. However, expensive and challenging financing has been an intractable problem for SMEs to solve, hindering the SMEs’ development. It is necessary to construct a model to calculate the amount of corporate theoretical loans. The financing mismatch problem of enterprises can be solved, and small and medium-sized enterprises can obtain more loan fund support by efficiently identifying enterprises with significant capital demand but insufficient support. This paper mainly constructs a dynamic model of enterprise loans by analyzing the leading indicators of the enterprise loan capital and the functional relationship and feedback structure among them based on system dynamics. On the one hand, by collecting and analyzing the data of each index of A-share listed companies in Guangdong Province, the simulation results can reflect the borrowing situation of enterprises to a certain extent. On the other hand, by comparing the theoretical and actual borrowing amount values, we can find the enterprises whose actual borrowing amount can exceed the theoretical borrowing amount. Furthermore, analyze and explore the common characteristics of these enterprises.
The empirical results show that the typical characteristics of the enterprises with actual borrowing amounts higher than the theoretical borrowing amount are: the growth rate of primary business income, the number of government subsidies, and the maximum amount of single bank loan have better performance than the same type of enterprises. Thus, the rest of the enterprises can improve concerning the findings of this paper in order to obtain more financial support. The specific measures can be to improve the growth rate of primary business income and strengthening the growth ability of the company so that the lending banks can pay attention to the company with excellent development potential. Moreover, the SMEs should maintain the relationship with the lending banks to be willing to approve the company’s large loan applications, giving other banks a signal that the company can be trusted. These are the efforts that the company can make to get more financial support for itself. However, the amount of government subsidies is a uniform standard for all companies in the industry and cannot be changed for individual companies, so it is impossible to improve through its own efforts.
Small and medium-sized enterprises get sufficient financial support to achieve better development. For one thing, they can expand employment, improve the residents’ income, increase the willingness to consume, and enhance domestic demand. For another, the enterprises can provide more tax revenue and increase local government revenues. Local governments then invest more in infrastructure construction and increase construction-related jobs, increasing the income of the relevant employees and providing public places and facilities for residents, and improving the consumer environment. Promoting consumption boosts domestic demand, increases income savings and financial management, and also increases the capacity of the pool of funds available to enterprises for financial support. It acts as a healthy positive feedback loop to drive economic development. Improving local development and the diffusion of advanced experience will lead to national economic development and further attract foreign investment to domestic enterprises. Thus, realizing a new development pattern in which the domestic double cycle is the mainstay and the domestic and international double cycles promote each other.
The shortcomings of this paper and future directions for improvement are as follows: First, the paper is based on the assumption that increased investment in SMEs will inevitably bring positive feedback to China’s economic development. However, this is only an ideal situation, and the reality will be more complicated. In the future, we will consider that increasing investment in SMEs will bring other adverse effects on China’s economic development, such as inflation caused by increasing investment, and add these negative indicators to the system dynamics model to build a negative feedback loop, making the model more logical and realistic. Second, the data subjects in this paper are Chinese SMEs on the former SME board, which are representative, but there is room for improvement, such as adding data on unlisted SMEs in the region. Generally speaking, more comprehensive research data subjects will lead to more convincing conclusions. In the future, the authors will make more efforts to collect data from some unlisted enterprises to obtain more comprehensive data and make a more logical and convincing study.