



Abstract
Big Data is a popular research area where a vast amount of data is created, replicated, and consumed by society. The quality of the data used directly influences big data knowledge discovery. The existence of noise is the most prevalent problem influencing data quality. The following techniques were developed to reduce noise in data with a distributed setting: Homogenous Ensemble for Big Data (HME-BD) and Heterogeneous Ensemble for Big Data (HTE-BD). In this article, the performance of HTE-BD is improved further by developing Enhanced HTE-BD (EHTE-BD), which combines Logistic Regression based Support Vector Machine (LR-SVM) in conjunction with RF, LR, and KNN to reduce noisy data. Furthermore, the Multi-Objective Evolutionary Fuzzy Method for Subgroup Discovery throughout Big Data (MEFASD-BD) was used to resolve the multi-objective optimization challenge, and the Non-Dominated Sorting Genetic Algorithm-II (NSGA-II) was utilized to handle the rising dimensionality issue through subgroup discovery. To address the NSGA-II’s slow convergence rate, an Improved Multi-Objective Meta-Heuristic Fuzzy approach for discovering subgroups in big data is described, that contains a meta-heuristic method for subgroup discovery known as the Multi-Objective Differential Search Algorithm (MODSA). It selects the most relevant subgroups from vast amounts of data, reducing the data’s dimensionality. The Fuzzy Deep Neural Network (FDNN) classifier assesses the main subgroups. By removing noisy data and selecting the most relevant subgroups, the performance of FDNN in classifying vast amounts of data is improved.
Keywords
Introduction
Today, we are surrounded by vast volumes of information. Because of the availability and rapid expansion of storage and network capacity, systems, including the Internet, generate data exponentially. The digital world is expected to be ten times larger than in 2013, totaling 44 zetta-bytes [1] by 2020. The current volume of data exceeds the processing abilities to exist data gathering tools [2], prompting the creation of new methods for preserving and evaluating this data. The Big Data era is widely believed to have begun [3]. The term “Big Data” denotes a group of techniques that allow for processing vast volumes of data [4]. Big Data collecting aims to learn as much as possible about people and our surroundings. We live in a period when everything has reached its limitations.
Corporations and researchers must push further to uncover alternative resources of information and novel streams of knowledge that would enable us to advance and adjust further [5]. Corporations and researchers are now striving for knowledge that they would be previously disinterested in, but it is now the only option to move forward. All of this information is gathered from several organized and unstructured resources [6]. Nonetheless, all these corporations and academics are running across new obstacles when it comes to coping with the modern paradigm’s Volumes, Velocity, Factuality, and Valuation [7]. Whereas the volume, variation, and velocity factors are involved with the data generation processes and how the data is collected and saved, the integrity and worth aspects were focused on the quality and usability of the data. Those two last features are crucial in any Big Data approach since the data quality strongly influences the retrieval of useful and relevant information. Traditional preprocessing procedures [8–10] are considerably more time-consuming and resource-intensive with Big Data, making them unworkable in most circumstances.
Data science arises to extract information from enormous amounts of data, but new methods, tools, and so on are required to achieve this goal. The most well-known of these new paradigms is Map-Reduce [11, 12], which seems to be a shared processing methodology that utilizes the split and conquers strategy. There is now a rise of enthusiasm for developing novel algorithms addressing massive data issues that use this method in current years. Subgroup discovery (SD) is an exciting area of data science and data extraction in creating novel algorithms for such big data scenarios [13, 14]. SD is indeed an information retrieval task wherein the intention is to identify subgroups whose behaviour departs from the overall set dependent on a data set property (any variable of concern, often known as the target attribute). The information obtained from an SD task is frequently stated as rules. These rules leverage the conditions stated in the antecedent to detect transactions whereby a specific property in the target object (or set of items) holds. Thus, subgroup discovery is indeed a work that combines predictive as well as describing induction [15], and it has been integrated along with other tasks such as difference set mining [16] and also emerging feature mining [17] beneath the banner of supervised description patterns mining. Therefore, reference evolutionary algorithms (EAs) [18, 19], which also imitate the basic tenets of natural advancement to resolve optimization as well as learning difficulties, seem to be well adapted to undertake the SD task due to their capability to reflect variable interaction in such a rule-learning procedure even while delivering excellent flexibility there in depiction [20].
Moreover, considering several performance standards must be optimized simultaneously, multi-objective EAs are very well adapted to this sort of situation. The use of fuzzy rules relies on fuzzy logic [21] but, on the other hand, enables the account of uncertainties and the depiction of continuous data, which is more analogous to human perception. A slew of distributed and parallel paradigm-based techniques have emerged to respond to a Big Data era [22]. But on the other hand, currently proposed SD techniques are ineffective in coping with enormous amounts of data in such a big data setting. The Multi-Objective Evolution Fuzzy Algorithm with Subgroup Discovering for Massive Data Domains [23] was developed for big information subgroup recognition. Still, it utilizes the Map-Reduce functions to analyze the quality of subgroups concerning the major dataset and raise the subgroup’s quality. Another token contest operator has been utilized in the reducers to choose the best rules from multiple mappers. Any noise within the data does have a significant impact on its quality.
Noise is a partial or total change in the information obtained for a data item induced by an external element unconnected to the distributions that generate the data. Pattern recognizing, computer vision, and data mining deal with learning from noisy data. Noise will result in too complicated models with poor performance [23]. The detrimental impacts of noise will grow in proportion to the amount of data [24]. Smart Data, primarily focused on authenticity & value, has lately been created to filter the noise and emphasize the crucial data that governments and organizations can successfully exploit for planning, operations, supervision, controlling, and intelligent decision making. Because it is among the utmost crucial steps of every data-mining operation, data preparation is inexorably linked to the concept of Smart Data. Original data is prone to defects, redundancies, and inconsistencies, making it inappropriate for data extraction. Data preprocessing aims to cleanse and fix defects inside the data so that the consequent machine learning operation may perform much better. Unfortunately, data preprocessing techniques are also hampered by the escalating quantity and the data complexity, making it unfeasible to acquire a pretreated/smart dataset in a given timeframe. Thus, it must be regenerated by employing Big Data technologies. Eliminating the noise interference [25] is a complex task that requires reliable detection of defective samples in data. Even though huge amounts of noise are virtually always present in a Big Data setting, little research has been committed to dealing with noise in Big Data [26]. As a result, removing noise from large amounts of data is becoming increasingly important, as it considerably enhances big data processing.
In the current research works, by transforming raw data into smart data, the problem of noise in big data categorization was eliminated. Numerous noise filtering techniques were presented to address the difficulty of huge data categorization. These filtering strategies are based on building ensembles of classifiers that are run in various mappings, allowing the practitioner to cope with massive datasets. Different data segmentation and ensemble classifier combination procedures have resulted in three distinct approaches. Two techniques have been developed to eliminate noisy data from Big Data. The first was a homogeneous ensemble called Homogeneous Ensemble for Big Data (HME-BD), which employs a single base classifier throughout a training set split. The second ensemble was a heterogeneous ensemble called Heterogeneous Ensemble for Big Data (HTE-BD), which employs many classifiers to detect noisy occurrences, including Random Forest, Logistic Regression, and K-Nearest Neighbors (KNN). These methods are used to eliminate noise from huge data.
The key contributions of this work are summarized below, The noise reduction depending on HTE-BD is improved by merging the RF, LR, and KNN. with Logistic Regression based Support Vector Machine (LR-SVM). The improved Multi-Objective Meta-Heuristic Fuzzy Approach with discovering subgroups in Big Data overcomes the NSGA-II’s slow convergence time in MEFASD-BD (IMEFASD-BD). A meta-heuristic Multi-Objective Differential Search Algorithm (MODSA) is used to handle the multi-objective optimization problem in IMEFASD-BD. IMEFASD-BD then determines the best subgroup of huge data using MEFASD-BD. The Fuzzy Deep Neural Network processes the filtered data, and the best subgroup is selected (FDNN).
The following is how this research paper is arranged: Section 2 examines a few of the previous works performed to reduce noise and identifies the subgroup. Section 3 utilizes mathematical equations to define the proposed methodology, Section 4 depicts the results, and Section 5 ends the research effort.
Literature review
Big data has very high dimensions in the modern digital era and demands a great quantity of room for data storage. As a result, when huge data comprises many dimensions, a lossless data interpretation will be problematic. However, these aspects in large data may be irrelevant or connected, resulting in attribute set redundancy. Dimensionality reduction is a strategy that focuses on reducing the features and complexity of a high-dimensional data set. A comprehensive examination of several dimensionality reduction approaches is presented in the literature.
Kuang et al. [27] established a unifying tensor framework for expressing unorganized, semi-structured, and structured data to describe and understand heterogeneous information recorded from many resources. Mostly in this proposed scheme for dimensionality minimization on large data, an incremental complex system singular value decomposition (ICSSVD) technique is described, which can overcome the difficulties of breakdown recalculation and order inconsistency. Based on the modified orthogonal bases, a new core tensor was developed. The approach’s temporal complexity, on the other hand, maybe enhanced.
Mostly in this big data era, analyzing and deriving information from huge data sets is indeed an impressive and difficult task. Triguero et al. [28] proposed using MapReduce to categorize huge amounts of data. This technique utilized a group of instances to learn the data during the map phase. As an outcome, a finalized vector with feature weights was generated. The subset of characteristics was chosen to utilize a threshold. Naive Bayes, SVM, and Logistic Regression models were used to classify the data. It was proposed to minimize massive data dimensions thoroughly.
Laurence T. Yang et al. [29] provided a complete strategy for distributing big data dimensionality minimization to solve three fundamental issues: large data fusion, dimensionality minimization methods, and the creation of shared computation systems. A chunk tensor approach was proposed for merging unorganized, semi-structured, and structured data into a cohesive paradigm wherein most heterogeneous data attributes and the tensor order are accurately arranged. A Lanczos-based Higher Degree Singular Value Breakdown technique is proposed to reduce the dimensionality of a coherent framework.
Azar et al. [30] constructed a linguistic hedges neuro-fuzzy classification using chosen features (LHNFCSF) for selecting features, dimensionality reductions, and categorization. The purpose of using a neuro-fuzzy system is to learn from this and develop a fuzzy framework that represents the mechanism behind the data. Neuro-fuzzy systems’ link weights, propagation, and activation functions vary more than normal neural networks. So no requirement to create any assumptions regarding variable distribution or dependencies. The presented technique not only assists in lowering the overall dimensionality of large data sets but even minimises a learning algorithm’s computational time and thus simplifies the categorization. The shortcoming of fuzzy logic is whether it requires proper membership function identification and linguistic variables overlapping.
This huge amount of data cannot be handled efficiently using traditional data mining methods. Hence it is crucial to adjust and design novel techniques for distributed approaches, including Map Reduce. Such a condition is indeed a concern for society, which is being researched under the commonly used phrase “big data.” The following literature comprehensively discusses numerous methodologies for discovering the subgroup.
Carmona et al. [31] proposed a Non-Dominated Multi-Purpose Evolutionary framework for Retrieving Fuzzy Regulations in Subgroup Discoveries (NMEEF-SD) that tackles subgroup revelation obstacles by merging fuzzy logic plus genetic algorithms. This NMEEF-SD technique employs specialized operators to ease the extraction of specific, easy to interpret, and high-quality S.D. regulations. In contrast, the NSGA-II method employs a multi-objective methodology. This technique includes biased initialization, biased mutation controllers, and the aims described inside the evolutionary technique to increase the generality. Ultimately, NMEEF-SD is indeed a powerful method that improves outcomes by directing the genetic search along with unnaturalness but also assistance, resulting in simple, precise, as well as easy interpret subgroup characterizations which achieve successful performance not just for the quality metrics utilized in the evolutionary procedure, but also towards the other quality metrics deemed for S.D.
Padillo et al. [32] developed two novel techniques for identifying subgroups in Big Data that are dependent mostly on the Map-Reduce framework and the open-source Spark integration. This AprioriK-SD iterative method is Apriori-dependent, but the PFP-SD methodology is SD-MAP, SD-MAP*, and DpSubgroup-based. Both have been proposed and demonstrated to be highly effective in extracting subgroups from Big Data, but also they can work with binary, numerical, and nominal objectives.
Padillo et al. [33] introduced two novels Map Reduce techniques for discovering subgroups in Big Data. To meet the Big Data needs, Apache Spark was deployed. The two suggested methods are very efficient in mining subgroups from Big Data. Both trim the search space using optimistic estimations without losing any subgroups. These methods, however, are costly to compute.
Pulgar-Rubio et al. [34] introduce MEFASD-BD, a novel approach for subgroup discovery. The technique was created in Apache Spark using the Map-Reduce paradigm and can efficiently deal with high-dimensional datasets. In reality, this approach is the first evolutionary fuzzy system approximation to huge data for subgroup findings. It employs novel Map Reduce functions that may examine the overall subgroup quality formed for every map regarding the initial dataset and improve the qualities of such subgroups. Importantly, the final minimization function of the method employs the token contest operation and then selects the best rules derived from the different maps.
Valmarska et al. [35] provide two innovative pattern learning strategies; and the first is for subgroup identification, while the other is for categorization rule learning. Most techniques leverage beam searching and effectively utilise various strategies for rule refinement, including rule selection, especially Double Beam-Subgroup Discoveries (Double Beam-SD) and Double Beam-Categorization Rules (Double Beam-RL), presented as novel beam searching rule learning approaches. Two separate beams were employed to refine and choose rules. It broadened the search area and improved rule discovery. However, the classification accuracy of these methods has to be improved.
Many areas currently need to cope with huge datasets, including a significant number of attributes. Strategies toward feature selection attempt to reduce noisy, redundant, or unnecessary features, which may affect classification accuracy. The following literature examines many large data classification approaches in depth.
Peralta et al. [36] presented an adaptive computation dependent on a feature selection strategy for extracting subsets containing attributes from huge datasets employing the Map-Reduce framework. This algorithm breaks down the initial dataset into a group of instances in an attempt to learn from them during the map phase; after that, during the minimization phase, the acquired incomplete outcomes are unified into an ultimate vector of feature weights, making it possible for an adaptable implementation of the feature selection methodology relying on a threshold to evaluate the chosen set of attributes. Three well-known classifiers created inside the Spark framework to solve large data challenges are used to assess the feature selection approach.
Priyadarshini et al. [37] developed an SVM relying on Map Reduce with large-scale data by breaking massive datasets into smaller parts and evaluating SVM penalty and kernel parameters. It is also discovered that the SVM with a multi-node cluster takes less time to compute for big datasets than the SVM with a single node cluster. Support vector memory is proportional to the number of vectors. As a result, the data is distributed using Map Reduce to conserve memory and speed up SVM calculation. The suggested method was only validated on 1 G.B. datasets.
Del Rio et al. [38] established a Chi-FRBCS-Big Data approach, a linguistic fuzzy regulation-dependent categorization scheme that learns and fuses rule bases via Map-Reduce technology. This approach provides an interpretable architecture able to manage massive quantities of data with high precision and quick response times, so it uses the Map-Reduce computing methodology on the Hadoop platform, which is becoming among the most prominent ways of effectively coping with big data. This suggested methodology distributes computing utilizing its map function and afterwards aggregates the results via the minimization function.
Yan et al. [39] developed a scalable classifier ensemble architecture supported by a collection of judges for integrating the outputs of several classifiers for multimedia big data categorization. A set of judges is grouped into a hierarchically arranged judgment model to rely on the different classifiers’ extracted features. More judges will be produced if additional classifiers are incorporated, perhaps leading to even greater performance. However, extra judges were required due to the vast amount of data.
Deng et al. [40] created an efficient K-Nearest Neighbor (KNN) approach, which was utilized to massive segment amounts of data. The KNN algorithm was employed in the testing method to group each test sample into its nearest cluster. The training time is the main downside of the K-nearest neighbour method. It also detects insignificant or distracting qualities. The presence of a high number of dimensions improves the algorithm’s performance.
Elkano et al. [41] introduced CHI-BD, a unique networked FRBCS addressing Big Categorization difficulties, and an innovative Map-Reduce methodology that achieves the same categorization efficiency regardless of any amount of mappers engaged in its implementation. The proposed strategy splits the learning process into two sections to spread the rule formulation process and the computation of rule weights.
Lin et al. [42] offered two strategies for improving the classic CSO algorithm and applying the ICSO method to discover attributes in a large data text categorization operation. Produce potential solutions in the initial stage of research mode by utilizing a crossover procedure. In the seeking mode, they change the prior technique employed to change the placement of the cats. However, the tracing mode in I.C.S.O. will not be enhanced.
Sun et al. [43] proposed a Lossless Pruned Naive Bayes (LPNB) classification technique with hundreds of classes targeted to real-world, large-data applications. It employed Information Retrieval (IR) techniques to effectively explore and reduce the posting list and accomplish rank-safe pruning. Upper bounds were used to remove hopeless classes during calculation swiftly. The LPNB does not prioritize categorization accuracy.
Elkano et al. [44] created CFM-BD, a unique distributed learning framework for developing efficient and compact fuzzy regulation-based categorization algorithms for Big Data. So far, the bulk of fuzzy classifications designed for Big Data has been tweaks or extensions of conventional learning approaches. None of these strategies was designed from the bottom up to provide a reasonable trade-off between accuracy and interpretability in Big Data issues.
In the context of big data, Dubey et al. [45] established an efficient ant colony optimization (ACO) as well as particle swarm optimization (PSO)-a dependent framework for data categorization as well as preparation. Data segment ratings have been assigned depending on segment size, contents, and keywords. The number of data fragments was considered for the initial attribution. Depending on the content and keywords, weights have indeed been allotted to the subsequent attributes. After that, data preparation was completed. The ACO, as well as PSO procedures, were utilized on the preprocessed weights enabling categorization but also data aggregation. The functional weights were used to categorize the resulting weight. ACO-SAW and PSO-SAW have been programmed with the total classified weight. Instead, the appropriate parameter has still not been chosen. Many efforts in big data analytics have been offered in terms of noise filtering, dimensionality reduction, and classification.
However, several issues have not been addressed, such as the high redundancy of the instances posing is challenging to noise preprocessing algorithms, serious dimensional problems in big data that affect the effectiveness of big data classification, and also the linear algorithms used in the ensemble classifiers may affect the accuracy of big data classification. The next section briefly outlines the potential ways to resolve the previous works’ problems.
Proposed methods
An effective large data classification is addressed in detail in this section and illustrated in Fig. 1. Before data categorization, the Linear Regression dependent SVM was developed (LR-SVM) to improve data quality by removing noise in huge data.
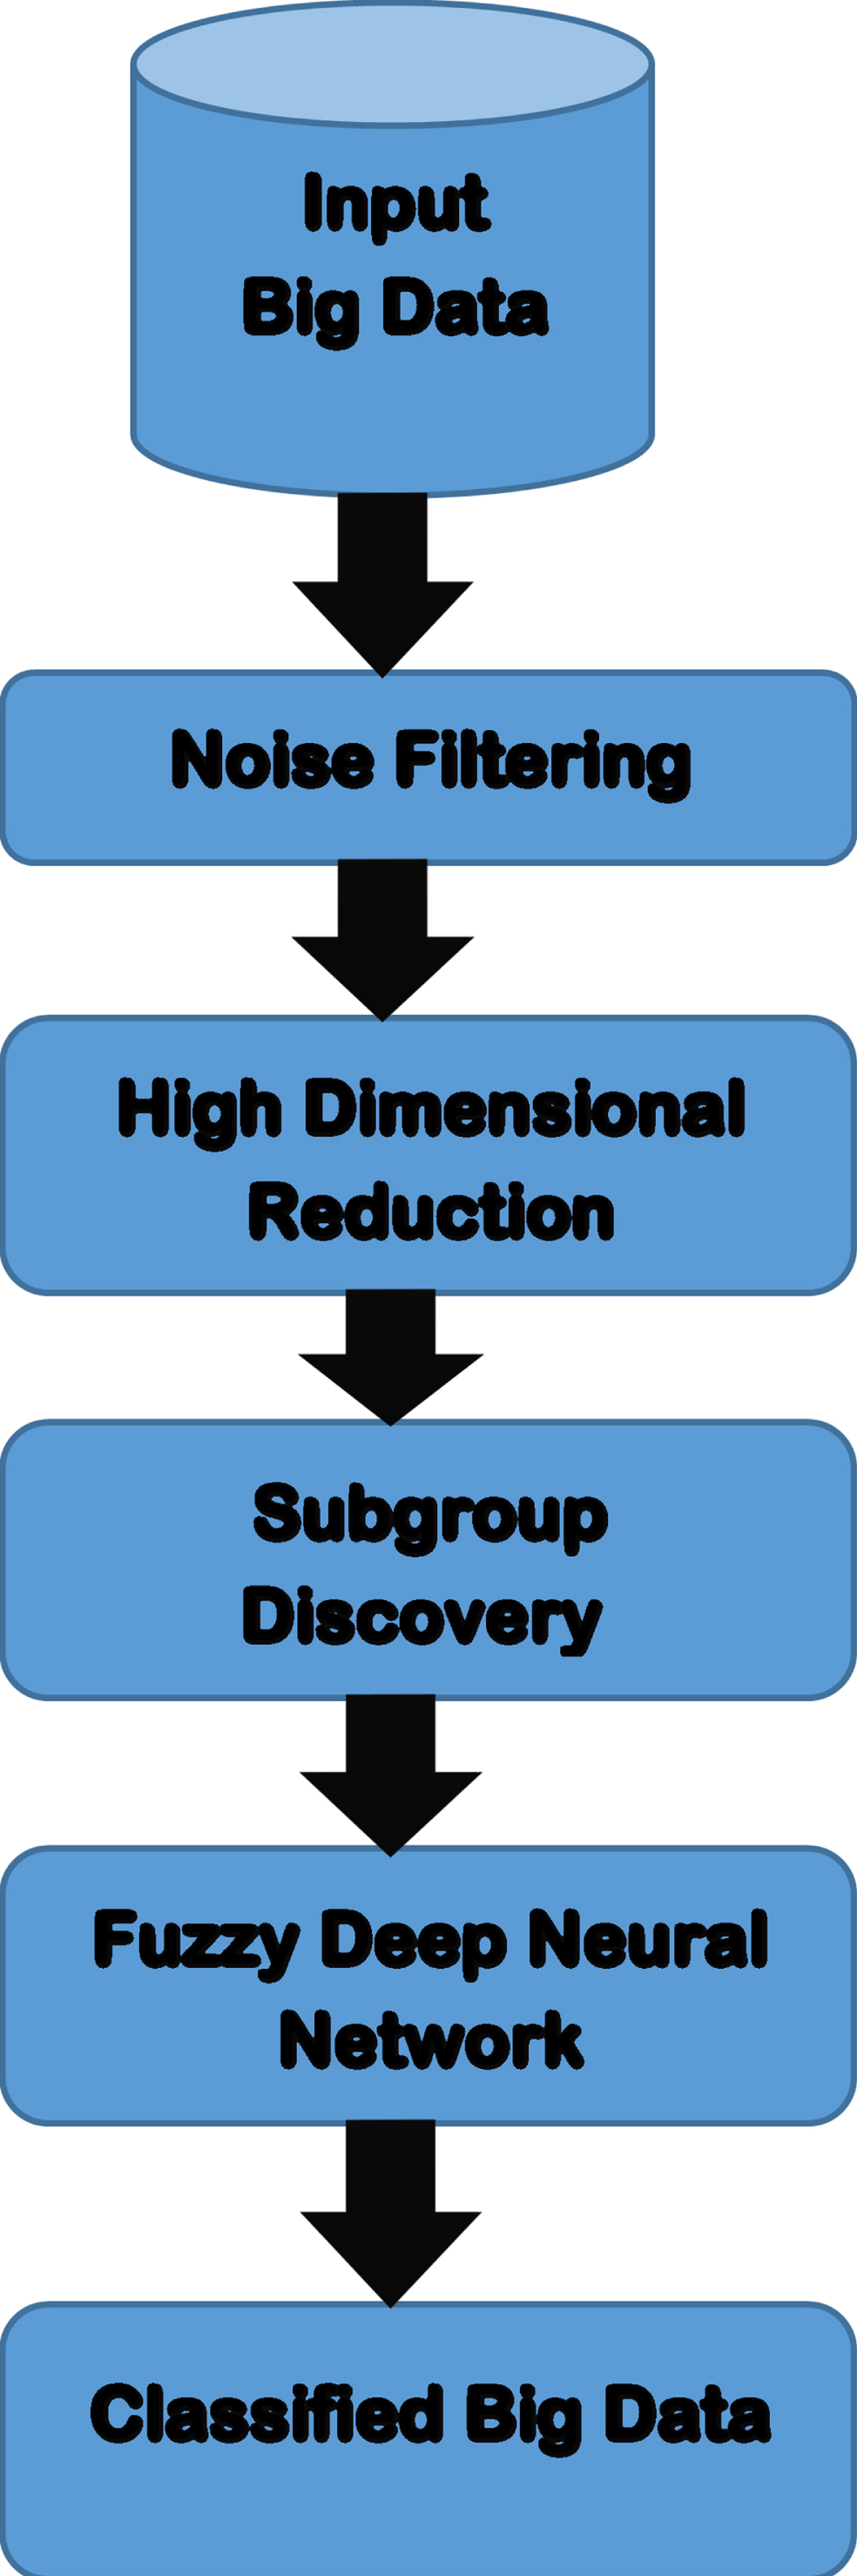
Classification Flow Diagram for Big Data.
The Differential Search Algorithm, mostly in the Multi-Objective Fuzzy Model for Subgroup Discovering, is then utilized to solve the excessive dimensionality issue (MEFASD-BD). In vast amounts of data, it identifies the most significant subgroups and eliminates redundant data. Following preprocessing and subgroup discovery, the massive amount of data is put into a hierarchical Fused Fuzzy Neural Network (FDNN) that categorizes it. The next section describes the noise filtering method in the supplied large data in detail.
Throughout this section, we discuss the Apache Spark Massive Data architecture for minimizing noisy samples, which is dependent on the MapReduce model, and we show its effectiveness in large-scale scenarios. It is a Map-Reduce design that distributes all noise filter operations. This Map Reduce concept is utilized to decrease data noise. The MapReduce architecture is used to spread all noise filter operations. The Homogeneous Ensembles for Big Data (HME-BD) and Heterogeneous Ensembles of Big Data (HTE-BD) are utilized for data purification. The HME-BD is indeed a homogeneous ensemble that employs Random Forest (RF) for classification. Meanwhile, the HTE-BD is a heterogeneous ensemble that employs RF., Logistic Regression (LR), but also K-nearest Neighbor (KNN). In addition to the RF, LR, with KNN, a Linear Regression dependent SVM is utilized for cleansing the data to improve the efficacy of HTE-BD. The Map-Reduce framework is used to implement both the HME-BD and the HTE-BD. MapReduce mappers utilize classifiers to categorize huge data as noisy or clean, and the findings of each mapper are pooled in the reducer phase.
In LR-SVM, SVM learns with generic nonlinear kernels. SVM employs a linear regression strategy to estimate the gradient computation in the dual coordinate descent solver. SVM necessitates the employment of a definite positive kernel as well as its accompanying feature mapping such that φ (x) Tφ (y) = k (x, y) and a set of training examples
Where α = (α1, α2, α3, … α
n
) the Lagrange multipliers, and n are represents the number of training instances. The classifier’s weight vector is as follows:
A dual coordinate descending method [46] might be implemented to solve the aforementioned twofold SVM problem. When solving a dual SVM issue, it is critical to estimate the gradient G and update its classifier as soon as possible.
The gradient G quantifies the variations in (α) concerning α
i
and can be calculated as,
However, due to the use of the dual coordinate descent approach, the computing complexity of this method is significant. Moreover, the dual coordinate descent technique cannot even perform the update step when the mapping is infinitely dimensional or cannot be computed explicitly. Consequently, linear regression is used to estimate the gradient appropriately and finish the update phase.
w
T
φ (x) denote either the gradient calculation during training or the predictive function evaluation during testing. As a response, it is much more critical to estimate w
T
φ (x) effectively. Linear regression may accomplish this goal with proper explanatory variable choice. Consider this computational barrier as a function,
Its input would be any vector q that corresponds to big data denoted as R
d
, whereas α
i
, y
i
and x
i
are constant in this function. The output of this function g(.) is estimated using a linear regression model, which is given as follows:
c
i
ɛR
d
is a handy tool when learning regression restrictions, including their real reliant variable values, provided a collection of n′ samples.
The ordinary least square solution to the linear regression model is
Where
There is no need to save w in LR-SVM; instead, the values of
Where,
It provides a vector that estimates the kernel resemblance between q and each point in the massive data set, where s(q) is the similarity function. At the same time, the regression coefficients are updated using a simple procedure,
The preceding LR-SVM method explains the whole LR-SVM technique.
LR-SVM Algorithm has been mentioned below,
Input: Big data R d , training sample { (x i , y i ) }
Output: sgn(e(q)
T
α ⟵0, Calculate Q
ii
=||φx
i
||2=κ(x
i
,x
i
), i=1,2,…,n While α is not optimal, do For i=1: n, do G=y
i
w
T
φ(x
i
)-1
end for end while
The LR-SVM technique described above is also utilized in HTE- B.D, the RF, LR, and KNN, to filter noise in large data and identify mislabeled occurrences in a dataset. Mostly on training data, it does k-fold cross estimation. Four strategies are tried on the other k-1 components in each k part. A separate classifier assesses each test case in either clear or noisy massive data. Every sample of the input enormous data has indeed been tagged after the k-fold. Finally, an opt-out technique is employed to reach a final choice, after which noisy data is deleted. The following is the overall flow of the EHTE-BD:
Input:
Output: filtered
partitions ← kFold (R
d
, P) filteredData← ø for all train, test in partitions do ClassifierModel1 ← learnLR - SVM (train, Rd) ClassifierModel2 ← learnRF (train, nTrees) ClassiferModel3 ← learnLR (train) ClassifierModel4 ← learnKNN (train, k) predictions ← predict (ClassifierModel1, ClassifierModel2, ClassifierModel3, ClassifierModel4, test) markedData ← map (LR - SVM, RF, LR, KNN, orig) count ← 0 if LR - SVM ≠ label (orig) , then count ← count + + end if if RF ≠ label (orig) , then count ← count + + end if if LR ≠ label (orig) , then count ← count + + end if if KNN ≠ label (orig) , then count ← count + + end if if vote = majority, then if count ≥ 2, then (label = ø , features (orig))} end if 22 . if count < 2, then orig end if else if count = 3, then (label = ø , features (orig)) end if 27 . if count ≠ 2 then orig end if end if end map filteredData ← reduce (filteredData, markedData) end for return (filteredData)
The explosion in development and gathering the massive datasets had also propelled the knowledge extraction and evaluation procedure, with the hope that perhaps the exponential expansion in information dimensionality will enhance the reliability of the systems generated. There seems to be an increasing curiosity about big data, which pertains to massive amounts of data that are tough to control and evaluate utilizing traditional technology.
However, standard algorithms are typically incapable of dealing with these massive datasets, necessitating the adaptation or redesign of existing learning algorithms to handle high dimensional challenges, like data extraction systems’ capability and potential reduction as the size of either the dataset rises. Indeed, storage employment and runtime grow significantly, necessitating the deployment of ever-more-powerful computers to tackle the task of information extraction. The creation of algorithms for distributed systems is a frequent solution to the problem of dimensionality.
After the noisy data has been removed, the problem of high dimensionality is evaluated. A Multi-Objective Evolution Fuzzy Algorithms towards Subgroup Discovery with Massive Data (MEFASD-BD) [34] was employed to find subgroups of big data with high dimensionality. It’s also employed by Map-Reduce technology. Also, uncovering statistically interesting subgroups of the population is known as subgroup discovery.
MEFASD-BD is indeed a multi-objective evolution approach that employs the Non-Dominated Sorted Genetic Algorithm-II (NSGA-II) strategy to identify interesting fuzzy subgroups by utilizing the rule set’s responsiveness and unnaturalness [31]. MEFASD-BD is a cross between an evolutionary algorithm (EA) and fuzzy logic. MEFASD-BD divides the dataset into subgroups at first. The GA is then run in each map, and the rule set is produced from each map using fuzzy logic. In the reduce function, the rule sets of each map are merged to form the final rule set. However, compared to the Differential Search Algorithm, the NSGA-II technique has a slower convergence rate (DSA). So, in MEFASD-BD, a DSA is employed for subgroup finding, and it is known as Improved MEFASD-BD (IMEFASD-BD).
Initially, the IMEFASD-BD method divides the entire dataset into subsets and then fed into the mappers. Following the HME-BD and HTE-BD algorithms, each mapper applies the MODSA. To each value of a target attribute. Each mapper develops a starting rule set with non-dominated regulations throughout all subgroups regarding sensitivity and unusualness. It is executed for every value of a target variable (Target value), initially generating an entire population (count of artificial beings), then a meta-heuristic MODSA. A DSA is a novel meta-heuristic system concentrated on the migratory behaviour of actual animals that migrate aside from food-limited areas. A super organism’s migration demands the movement of many individuals. It migrates to a more food-rich habitat. Food capacity represents the sensitivity and uniqueness of subgroups in this context.
When a super organism discovers a new productive habitat (one with higher sensitivity and unusualness), known as a stopover site, it rests there for the time being before continuing its migration to a new production environment with higher sensitivity and unusualness. DSA is used to generate individuals of the relevant optimization problem linked to an artificial-super organism. Each artificial-super organism strives to migrate from its current location to the global minimum value, i.e., towards a more sensitive and uncommon artificial-super organism. The DSA is paired with Pareto dominance to handle the multi-objective problem. This strategy employs an external repository to assist in artificial migration. The MODSA is used to identify subgroups of organisms in the MEFASD-BD. However, considering these subgroups were created from such a portion of the initial dataset, therefore do not reflect the complete dataset. As a result, the MEFASD-BD methodology calculates global quality metrics for such rules throughout the entire dataset. It is critical to avoid creating insufficient subgroups that are only helpful for a subset of the data. The entire flow of IMEFASD-BD is as follows.
Input: Filtered data,
Output: Final reduced RS matching to the most appropriate subgroups
Initialize nummaps In each map, adjust the Artificial-Super organism (SUP) a.For i=1 to number of artificial organism b.Initialize RS to each SUP Evaluate each of the SUP based on the sensitivity and unusualness of RS Stock the spots of the SUP that signify non-dominated results in the peripheral repository (REP). Create hyper-cubes of the previously searched search space and use them as a reference frame to find the SUP’s, with each SUP’s location specified by its goal parameters (better sensitivity and unusualness). Replicate the subsequent steps until the determined number of iterations a. Calculate p1, p2 and Scale
The frequency of perturbation of members in a position corresponding to an individual is determined by p1 and p2. Scale is used to determine the amount of perturbation of members in the size of the position of the members in individuals. A gamma random number generator rand
g
is used to create it. The uniform random number generators are rand1, rand2, rand3, rand4 and rand5 a. Calculate random progression selected as map for every artificial organism of the super-organism via the stochastic scheme b. Calculate the position of each artificial-organism as
a. Calculate the new SUP position by combining the previous step’s position with the new position.
c. Appraise the artificial organism within the search space d. Update the SUP’s contents: This revision adds non-dominated solutions to the repository and removes dominated solutions from the REP. Artificial organisms in less populated regions are preserved after the REP is full. e. Once the artificial-memory organism’s position does not match the current location, the artificial-position organism’s is changed to match the current position. The principle of Pareto dominance is used to determine whether or not the location from memory should be maintained Returns the optimal Rule Set (RS). The token competition operator finds the optimal rules based on global quality metrics. Combine the rules of each mapper in the reducer phase and get the final set of rules.
Lastly, the optimal rules depending on the worldwide quality standards are identified by employing an uncommon token fulfilment operator. The next part proves how to use a Fuzzy deep neural network to classify large amounts of information.
After locating subgroups for each mapper, categorization is performed in each mapper. These discovered subgroups are sent through the Fuzzy Deep Neural Network for huge data categorization (FDNN). A fuzzy deep neural network (FDNN) collects fuzzy and neural model data. This knowledge gathered from such two views is integrated into a fusion layer to produce the ultimate data categorization presentation. Specifically, fuzzy representation reduces uncertainty, while neural representation removes noise from the source data. The suggested FDNN. It generates the fused model for final classification using these two better representations. Consequently, FDNN might be appropriate for application in more complicated pattern classification tasks with ambiguous input, including noise.
This FDNN has four different learning elements: fuzzy logic description, neural characterization, a fuzzy plus deep characterization fusion part, and an undertaking learning phase.
Fuzzy logic illustration
Every node in the FDNN input layer handles the discovered subgroups of massive data. This input layer’s node was linked to the membership function, which gives phonetic labels to every other input variable and is one of the input vector’s dimensions. This fuzzy membership function determines how much of an input relates to a fuzzy collection. Every x-the fuzzy neuron ux (.) : R → [0, 1] on the fuzzy representational layer converts the h-th input to a fuzzy degree.
In this approach, we employ the Gaussian membership function having mean μ
x
and variance
This component employs the neural learning concept to transform the input into high-level descriptions. This parameter represents the overall amount of data loss during data transfer from the SN to the DN.
The neural representation aspect of FDNN takes full advantage of neural learning perception. It converts the input to a higher-level representation. In this part, every node here on (l)-th layer is linked to full nodes on the (l –1)-th layer with the constraints (l) = {wl, bl}. Later, the layers are interconnected. The brain representation process is represented by the equation below.
Where
Recent multi-modal learning triumphs mostly influence the merged notion employed here. Owing to multi-modal learning, gathering features from a single perspective is inadequate for comprehending the complex architecture of high-content information. Consequently, these approaches always generate several features from differing elements and combine them into high-level representation for categorization. We combined fuzzy plus neural components with FDNN to seek better approximations by decreasing uncertainty and noise in the data input. We introduce that readers interpret the fuzzy part’s output as that of the feature instead of the original fuzzy underlying to understand our model design better.
Additionally, the neural network has both neural learning and fuzzy learning components. Consequently, including the feature fusion step in the neural network setup is rather logical. This paper employed the widely utilized multi-modal neural network structure that combines neural and fuzzy representations utilizing dense-connected fusion layers.
If o d represents the deep representation part’s outputs, of represents the fuzzy logic representation part’s outputs, then o f and of are fused using the deep and fuzzy representation portions’ weights wd and wf, respectively. Following the fusion layer, the fused data is extensively altered by adding numerous all-connected layers. The results of the fuzzy degrees and neural representation sections were combined.
The fused representation is placed in the relevant category by the categorization layer. A soft-max approach is used to classify the huge data in the task-driven part. Every x-th input, as well as its labels, are indicated by (fx, yx), wherein (fx) signifies the feed-forward transition from the input layer towards the task-driven layer.
This accompanying soft-max function is utilized as the output layer, having the m-th entry given by,
Where, W
m
is indeed the m-th class’s regression coefficients, and bm seems to be the m-th class’s biases. The neural network’s anticipated labels with k classes are represented as
Where y
x
indicates the actual label whereas
Careful adjustment is necessary to train the entire FDNN in such a task-driven approach. Fine-tuning allows for exact adjustments to the neural network’s parameters to increase the indiscriminant ability of the final feature representation. A back-propagation approach is used to compute the gradient of all variables in the system. For neurons within a deep fusion and task-driven portions of the brain, linear weights w and biases b were expressed. This fuzzy layer comprises a distinct kind of neuron that contains the μ x as well as σ x to be altered parameters. θ is utilized to describe the FDNN’s entire parameter collection.
To fine-tune the FDNN variable set to utilize the stochastic gradient descending approach is utilized. The parameters’ adoption law is as follows:
When the prior velocity and the current gradient define the velocity vector v (t), t keeps track of the number of iterations, controls the information provided by the previous gradient, ranges from 0-1, represents the learning rate, and
Input: Training samples as well as their labels { x i ,y i }, input feature dimension n, maxcycle
Output: classified big data
In each mapper, process the FDNN. classification Initialize k × n neurons on the fuzzy layer using equation (17) Set the weights of such deep and fusion layers to zero. for (t:1 to N), do Dropout at randomly p% of neurons there in the FDNN and acquire FDNN
remain
, FDNN
dr
denotes the neuronal dropout. for (neurons FDNN
remain
neurons) for (every x neuron within fuzzy depiction) Regarding fuzzy degree, map each x-th fuzzy neuron towards the input. end for for (every x neuron in neural depiction) Converts input into high-level representation using (18). end for for each (Part of the neuron infusion) Integrate fuzzy with neural components utilizing equation (19). end for for (every neuron within the task-driven section) Categorize the big data utilizing equation (21). Determine this mean square error utilizing equation (22). end for Propagate this same fitting error L back via FDNN
remain
and also perform the adaption rule to modify the unique parameterset Maintain all dropout neurons’ parameters the same that the values in the previous criteria, which is θt+1 = { end for Categorize the huge data utilizing trained FDNN with θt+1 Combine the classification results of each mapper in the reducer.
For robust data categorization, FDNN hierarchically integrates neural and fuzzy logic models. The data ambiguity is mitigated in the fuzzy view by using numerous fuzzy rules. This deep perspective minimizes input noise, leading to significantly cleaner data models that ‘meet’ well with the fuzzy logic description. This FDNN, while utilized as a classifier, might generate higher useful features, leading to much greater classification results. This simulation performance of the proposed methodologies is shown in the section below.
The performance of noise filtering, subgroup finding, and massive classification algorithms is examined in this section. Two classification datasets, super-symmetric (SUSY) and HIGGS, were employed for the experiment. The upcoming section describes the dataset used in this research.
Dataset description
SUSY dataset [48]
Monte Carlo simulation has been used to generate the SUSY dataset containing 5,000,000 occurrences, including 18 attributes. The first eight parameters are kinematic attributes gathered from the particle detectors of such an accelerator. Those remaining features were high-level features established by physicists to assist the difference between the two groups and are functions of the first eight factors.
HIGGS dataset [48]
The HIGGS dataset comprises 11,000,000 instances as well as 28 attributes. The data were acquired using Monte Carlo simulations. The first 21 characteristics were kinematic features determined by the particle trackers on the accelerator. The following seven features include functions of the first 21 features; those were high-level features established by physicists to aid with grouping discrimination.
EPSILON dataset
The EPSILON Dataset consists of 500,000 instances and 2000 attributes. The data has been produced using PASCAL Challenge 2008. The raw data set (epsilon_train) is instance-wisely scaled to unit length and split into two parts: 4/5 for training and 1/5 for testing. The training part is feature-wisely normalized to mean zero and variance one and then instance-wisely scaled to unit length. Using the scaling factors of the training part, the testing part is processed in a similar way. These train and testing data sets are used in GXY11a with 2 class labels.
ECDBL14 dataset
The ECDBL14 Dataset has 32 million instances, 631 attributes, 2 classes, 98% of negative examples and occupies, when uncompressed, about 56GB of disk space. The dataset is available in the ARFF format of the WEKA machine learning package. The dataset select for this competition comes from the Protein Structure Prediction field, and it was originally generated to train a predictor for the residue-residue contact prediction track of the CASP9 competition. The details of the dataset generation and a learning strategy used to train a method for this problem using evolutionary computation have been published in this Bioinformatics article on contact map prediction and described in Table 1.
Dataset description
Dataset description
Table 2 describes the mapper used in the Map Reduce program, which processes all the inputs from a file; in this research, 16 mappers have been used.
Mapper’s description
The number of partitions P is assigned as 4 and 5 in HME-BD and HTE-BD based noise filtering algorithms. In HTE-BD based noise filtering, K is set to 1, and Euclidean distance is employed to calculate distance. In HTE-BD noise filtering, maxDepth is set to 10, and maxBins is set to 32 for a random forest. Unusualness and sensitivity are employed as ideas in the subgroup discovery process, along with three linguistic descriptors. In the meta-heuristic MODSA, Set the population size to 100, the repository size to 100, and the grid size to 10. The dimension of the input feature is denoted by n in FDNN-based big data classification, while the number of classes to be categorized is denoted by k. FDNN’s neural representation comprises 64 neurons and two layers. FDNN’s fusion component contains 64 neurons and two layers.
MATLAB2018a implements noise filtering, subgroup finding, and large data categorization in this research. It is a sophisticated and adaptable data mining tool consisting of pre-programmed complicated statistical components. As a result, there is no need to write different codes, and the code is concise. It takes less time to test the complex technique. The user can create their function, which they can reuse for data analysis. We use the MapReduce programming technique available in MATLAB in our research work. It can handle very large databases. It is powered by a Microsoft Windows 7 working system, a 2.70 GHz Intel CPU, and 4 G.B. of RAM.
Performance analysis
Noise filtering
The performance of HTE-BD with RF, LR, and KNN classifiers and EHTE-BD with LR-SVM, RF, LR, and KNN classifiers are examined in terms of the percentage of properly deleted instances in the analysis of noise filtering results. 5-cross-authentication and three executions per dataset decide the executions.
Table 3 shows the average proportion of appropriately deleted instances after running the HTE-BD and EHTE-BD algorithms on 4 datasets and the partitions count that has minimal influence on the proportion of appropriately eliminated instances.
Average percentage of correctly removed instances for HTE-BD and EHTE-BD
Average percentage of correctly removed instances for HTE-BD and EHTE-BD
In the analysis of noise filtering results, the performance of HTE-BD with RF, LR and KNN classifiers and EHTE-BD with LR-SVM, RF, LR and KNN classifiers are tested in terms of percentage of correctly removed Noise instances. The executions are determined by 5-cross-validation and 3 executions for each dataset. In Table 3, the average percentage of correctly removed noise instances after processing HTE-BD and EHTE-BD algorithms for two datasets is presented. From Table 3, it is known that the number of partitions doesn’t much influence the percentage of correctly removed noise instance. The EHTE-BD removes morenoisy instances around 7.41%, 18.91%, 7.34%, and 8.12% (for partition 4) and 10.35%, 19.02%, 9.48% and 7.36% (for partition 5) than HTE-BD in SUSY dataset, HIGGS dataset, EPSILON datasets, ECDBL14 datasets for instance 20%. The EHTE-BD removes more noisy instances in the dataset than HTE-BD. In view of the results, it is conclude that EHTE-BD is the most suitable ensemble option to deal with noise in big data problems.
The examination of subgroup discovery findings demonstrates the benefits of IMEFASD-BD in higher dimensional situations. MODSA is utilized in IMEFASD-BD to address the multi-objective optimization problem.
The average results of 15 executions for normalized unusualness (UNUS.), fuzzy confidence (FCNF), and sensitivity (SENS) are shown in Table 4. The count of regulations (Rules) as well as variables (Vars) within the antecedent element of each subgroup also was presented, as seems to be its runtime per second (T (sec)).
MEFASD-BD as well as IMEFASD-BD average findings
MEFASD-BD as well as IMEFASD-BD average findings
According to Table 4, more rules are produced by utilizing a greater number of mappers. The IMEFASD-BD generates a greater number of rules than the MEFASD-BD.
IMEFASD-BD performs well regarding subgroup information gains since there was no information loss whenever many mappings were utilized. It is represented as unusualness in Table 4. IMEFASD-BD has a higher sensitivity and confidence than MEFASD-BD. The convergence speed for subgroup findings is boosted by employing MODSA. As a result, employing IMEFASD-BD reduces the time required to detect subgroups. These findings indicate that IMEFASD-BD functions effectively in high-dimensional datasets, minimizing runtime while retaining interpretability and a trade-off between sensitivity and confidence. In SUSY, the runtime for 4 mappers is 8321 s in MEFASD-BD and for IMEFASD-BD is 5789. It is lesser than 2 mappers, which have a runtime of 38147 s. Table 4 can conclude that the run time will decrease when we increase the number of mappers.
Table 5 presents the categorization accuracy for FDNN and Dynamic Evolving Neural- Fuzzy Inference Network (D.E.N.F.I.S.) [47] together in a distributed context. The D.E.N.F.I.S. has a classification accuracy of 62% in SUSY datasets and 57% in the HIGGS dataset, the FDNN without Noise Filtering and Subgroup Discovery (FDNN without NF&SD) has a classification accuracy of 67% for the SUSY dataset, and 63% for HIGGS dataset, the FDNN with Noise Filtering based on EHTE-BD (FDNN with NF) has 72% classification accuracy in SUSY dataset, and 69% for HIGGS dataset, the FDNN with Subgroup Discovery based on IMEFASD-BD (FDNN with SD) has the classification accuracy of 74% for SUSY and 71% in HIGGS dataset, and the FDNN with Noise Filtering based on EHTE-BD and Subgroup Discovery based on IMEFASD-BD (FDNN with NF and SD) having the classification accuracy of 91% for SUSY datasets and 87% for HIGGS dataset.
Average results of big data classification accuracy (using 10 mappers)
Average results of big data classification accuracy (using 10 mappers)
Figure 2 compares classification accuracy for SUSY and HIGGS datasets between DENFIS, FDNN without NF&SD, FDNN with NF, FDNN with SD, and FDNN with NF&SD. This X-axis represents the SUSY, HIGSS, EPSILON and ECDBL 14 datasets, whereas the Y-axis indicates the categorization accuracy percentage.
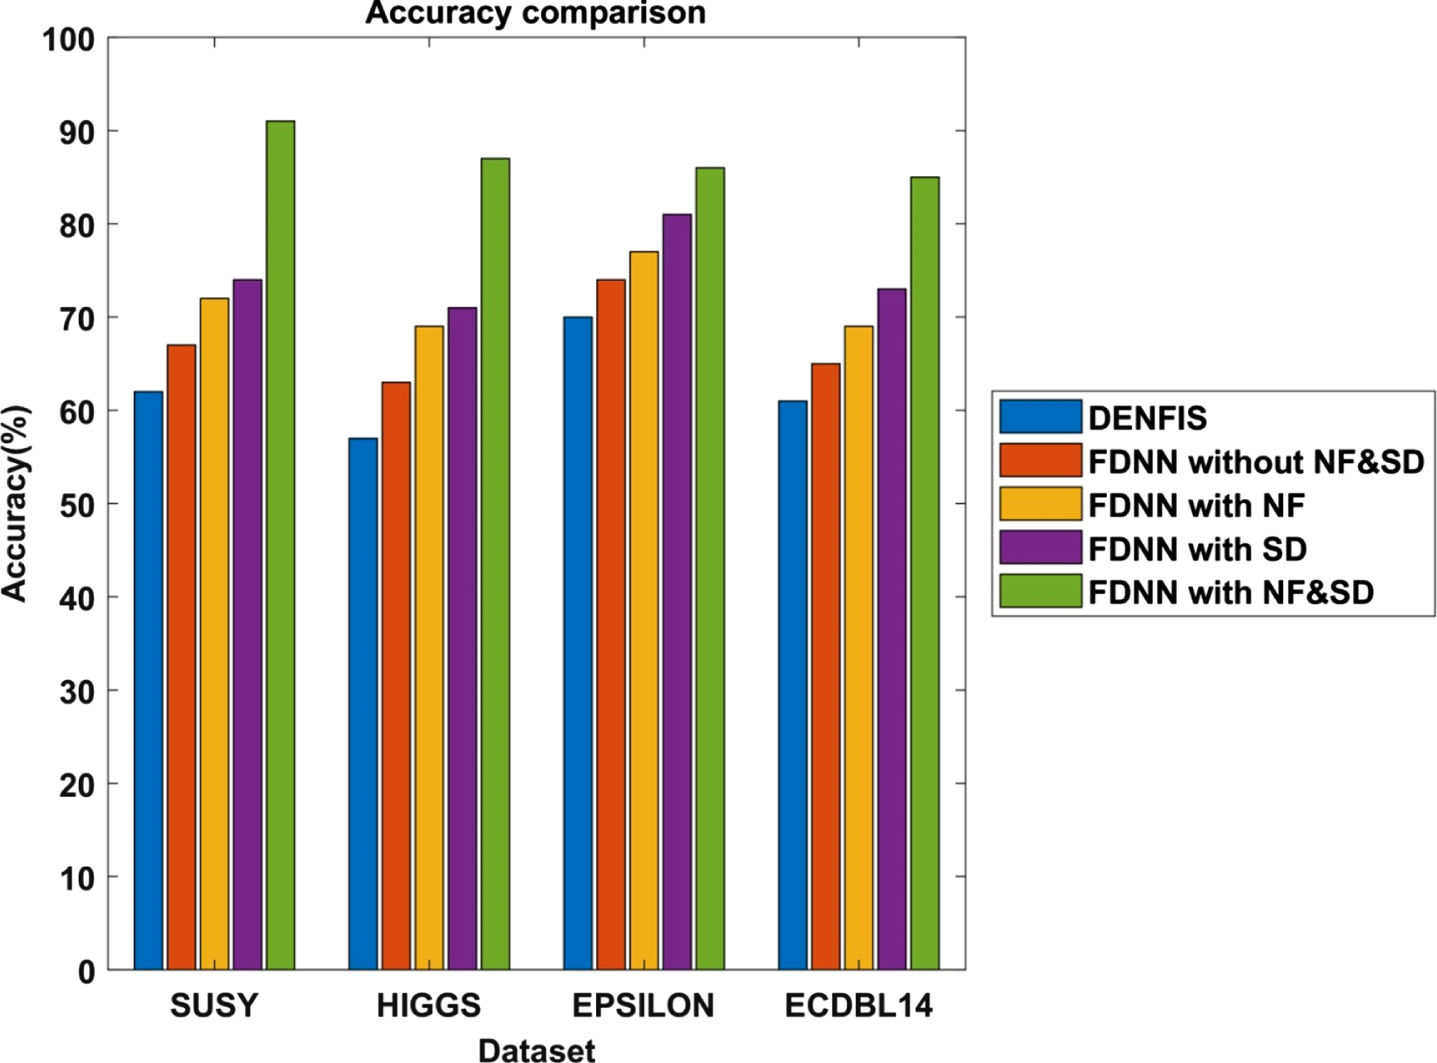
Average results of big data classification accuracy.
The classification accuracy of FDNN with NF & SD is 46.77%, 35.93%, 25.71% and 47.54% greater than DENFIS, 35.82%, 26.09%, 18.91% and 38.46% greater than FDNN without NF & SD, 26.38% 14.47%, 14.28% and 30.43% greater than FDNN with NF and 12.34%, 6.09%, 4.76%, and 8.43% greater than FDNN with SD for SUSY, HIGGS EPSILON and ECDBL14 dataset respectively. From this analysis, it is demonstrate that the FDNN with NF based on EHTE-BD and SD based on IMMFASD-BD shows better accuracy than the other classification methods.
The HTE-BD-based noise filtering is enhanced in this research by a recursive technique called LR-SVM, which is used in conjunction with the LR, RF, and KNN. The LR-SVM, RF, LR, and KNN classifiers distinguish between noisy and clean data in a distributed setting. The choice to use noisy or clean data is made using the majority vote approach. The most relevant subgroups in huge data were then identified using MEFASD-BD. The multi-objective optimization issue was solved using an NSGA-II. MODSA, a meta-heuristic methodology, is utilized to address this multi-objective optimizing issue due to its slow convergence rates.
Moreover, it facilitates the efficiency in locating subgroups. The clean data and most relevant subgroups are sent into FDNN, which more successfully classifies the huge data having an accuracy of 91% for the SUSY dataset and 87% for the HIGGS dataset. The experimental findings reveal that the proposed technique outperforms the other way in terms of the percentage of correctly deleted instances, rules, number of variances, unusualness, sensitivity, fuzzy confidence, time, and accuracy. The result shows that IMEFASD-BD in high dimensional datasets, with a huge reduction of the run time, maintains the levels of interpretability while increasing the number of mappers. Further, the sensitivity and confidence of IMEFASD-BD are higher than MEFASD-BD. Furthermore, this research can be extended up to 32 mappers.