
Abstract
Defense organizations, like the ministry of defense, the armed forces, the general staff of the armed forces, the army, the navy, or the air force units, use a specific business technology. What makes their business technology specific is a predictable changeability of their business processes. Namely, these organizations function in more than one state, each having its own business processes. An organization transits from one state to another in a predictable manner, thus changing its business processes. This kind of business technology is not exclusively restricted to defense organizations, as it also applies to police as well as crisis management organizations. In order to develop information systems (IS) supporting these organizations properly, the complexity of their future IS should be assessed first. This assessment can be performed by relying on existing genetic taxonomies, i.e., by situating the planned defense IS inside the IS genetic taxonomy space, with regard of relevant characteristics of organizational processes supported by the IS. A behavioral dimension described in this paper addresses the dynamics of states defense systems operate in, offering to contribute to the understanding of defense systems’ response to changes in dynamic ecosystems, assisting thereby researchers and practitioners in describing dynamic properties of investigated systems.
Introduction
Whereas there are many different methods for the assessment of the amount of work needed for software application development, there are just a few such methods for assessing the amount of work needed for the development of a complete IS. The latter are generally based on the experience of the development team members. It is even intuitively understandable that the amount of work needed for IS development depends on its complexity. Each IS is unique and reflects the structure of the organization it supports. Therefore, IS complexity is best described through the complexity of the organization it belongs to. Generally, we can consider IS complexity as a function of certain characteristics of business processes supported by an IS inside the organization. This approach leads us towards the IS genetic taxonomy space [2], which is a tool for a three-dimensional classification of IS, based upon certain characteristics of organizational processes that the IS supports. The significance of genetic taxonomy, as opposed to descriptive taxonomies [11, 12], is that it does not merely classify an IS, but provides a foundation for the assessment of the IS complexity [2, 5], as well as for the choice of IS development methods [7]. Although genetic taxonomy, as a method, is suitable for the assessment of IS complexity for a variety of organizations, it is not sufficient for the assessment of the complexity of ISs used by defense organizations. These organizations have certain characteristics that differentiate them from other private or public sector organizations. The most important one is that defense organizations have more than one state of functioning. Each state is defined by its own business technology, i.e., its own process model and data model whose combination seems to force also different ways of how processes deal with data, raising thereby the complexity of IS design and development issues as noted by [17]. While some industries show high volatility in regard to disruptions [26] switching between ability state and inability state [29], defense as a sector is a relatively steady functioning sector. The transition from one state to another is caused by a certain event. This type of organization is called an “organization with time changeable functions” [10]. For example, the ministry of defense has two outermost states: the peacetime state and the wartime state, each having its own business technology. The event causing the transition from the peacetime state to the wartime state is the declaration of military mobilization. Compared with other organizations, defense organizations are more complex, owing to their ability to change their states of functioning within a short time. Therefore, an IS that supports a defense organization is more complex and the amount of work needed to develop it is greater. Taxonomies promise to be a valuable tool for classifying, systemizing, and building upon existing knowledge in exploring many concepts [19, 31]. The IS genetic taxonomy, as a method for the assessment of IS complexity, is applicable to ISs that support traditional organizations with one single state of functioning. If we are to use this method for the assessment of a defense IS complexity, an additional dimension needs to be added –the number of states that the organization can be found in. Thus, an increasement of the resolution of the genetic taxonomy space is needed so that it becomes sensitive to organizations with time changeable states, i.e., it can recognize an IS of a defense organization, as opposed to other organizations’ IS.
Defense organizations are not the only ones featuring time changeable functions. Similar characteristics are found in some police organizations, organizations aimed at preventing the consequences of natural disasters, organizations dedicated to arranging and monitoring social events including large number of participants, crisis management organizations etc.
This paper proposes an addition to the genetic taxonomy approach, with a view to estimating the complexity of defense ISs more accurately. As this estimation relates to the very nature of defense organizations, a conceptual research method is used [25]. In the paper, some of the results gained through the ongoing research project “Strategic Planning and Development of Defense Information Systems” are presented. The project is led by the Faculty of Organization and Informatics, Varaždin, University of Zagreb, and sponsored by the Institute for Defense Studies, Research and Development at the Ministry of Defense, Republic of Croatia.
Brief literature review of taxonomies related research based on a focused keyword search strategy
Brief literature review of taxonomies related research based on a focused keyword search strategy
This paper is structured as follows. In Section 2, a brief overview of existing literature is provided. Next, the applied research methodology is explained in section 3, followed by a more detailed overview of IS Genetic Taxonomy and IS complexity, offering relevant terminology and describing the problem domain (Section 4). In Section 5, Defense ISs and their positioning in the Genetic Taxonomy Space (GTS) are introduced. Further on, Section 6 offers a visual representation of the behavioral dimension described through different finite states as a fourth variable in the existing three-dimensional GTS. Finally, discussion, further research and conclusions are given.
To obtain insights on recent literature dealing with taxonomies, a brief overview was conducted by exploring two reference sources –Scopus and Web of Science. The search strategy was performed very focused, by searching papers with the title including keywords “Taxonomy”, and “Information Systems” in past five years. The search in Scopus resulted with 17 papers (one of which was referenced twice, giving only 16 different papers), and the Web of Science search resulted with 7 papers, whereby 6 of them were overlapping with Scopus search results. All papers were reviewed in order to summarize, compare and synthesize existing research topics and research gaps by applying qualitative data-extraction and assessment methods. The respective quality criteria for literature analysis were as follows: (1) Is the research topic relevant to our literature review? (2) Does the paper tackle with the generation process of taxonomies or with taxonomy quality? (3) Does the paper address some specific domain? (4) Which findings could be relevant for positioning our research? We extracted three data sets: (a) Domain-related data, (b) Findings related to the taxonomy design, development, and application, (c) Findings addressing taxonomy quality and finally compiled a table synthesizing the extracted information.
Although this literature review cannot be seen as exhaustive, yet it is indicative for following reasons: certain issues related to taxonomy generation process and taxonomy quality still exists, regardless of numerous taxonomy related papers, published in general. To the best of our knowledge, there is still a lack of papers dealing with taxonomies related to the defense industry, as well as studies reporting on a broad application of finite state machines to model behavior [21].
Recent disruptive events impacting global operations, have shown that the speed and scope of response to changes in ecosystems vary across industries. Therefore, this dynamic of reacting to disruptions needs to be explored and modeled as a behavioral characteristic of organizations impacting the complexity of operations.
The research gap in the defense domain, the need for developing IS design principles and guidelines for system developers, as well as relying on formal methods for understanding behavioral characteristics, have led to the idea of this research. In that sense, defense organizations can be classified as organizations with time changeable functions, as opposed to classic organizations with one single state of functioning, i.e., one function. Owing to this feature, defense organizations are comparatively more complex, which accounts for the unavailability of an off-the-shelf IT solution for their respective information systems (IS). As a logical consequence, these organizations usually develop their own IT supported IS. In order to develop these systems properly, taking the organizations’ particular nature into consideration, the complexity of their IS should be assessed first. This assessment can be run using the principles of genetic taxonomy, i.e., by situating the planned IS inside the IS genetic taxonomy space, according to characteristics of organizational processes supported by the IS. However, to properly assess the complexity of defense information systems, an extension of the IS genetic taxonomy space is needed to make it sensitive to organizations with time changeable functions and their ISs. This can be done by adding a new dimension to the IS genetic taxonomy space.
Research methodology
Building upon the understanding that defense information systems are specific by their nature and occurrence in relation to its operating environment, their complexity is somewhat challenging to describe using common and more known concepts already well-defined in business operations. Nevertheless, theories and artifacts existing in the business sector apply also in the defense industry. For that reason, the complexity exploration leans on existing frameworks and knowledge, but introduces new perspectives in order to offer additions to the knowledge base.
The methodology applied in this research is inspired by Information Systems Research framework by [1, 16] since Design Science Research is a well-accepted approach in taxonomy-related research [27]. Understanding the environment defense industry operates in, a problem space shapes the research problem of the need to exploring Defense IS complexity through analyzing processes and IS architecture and thereby support selecting appropriate IS development methods. Existing knowledge base offers good foundations in form of existing genetic taxonomy [2] and finite state machines to model behavior. By leaning on formal description of complexity variables and 3D modeling, solid methodologies are provided in order to assess, refine and extend the genetic taxonomy space for assessment of IS complexity. For the evaluation of the applicability in the appropriate environment and the value of the addition to knowledge base, analytical approach, and case study of placing Defense ISs in the extended genetic taxonomy space have been performed. Figure 1 illustrates the methodology approach of this research.

Methodology approach.
The paper structure follows the methodology approach by defining the problem space through an overview of IS Genetic Taxonomy and IS Complexity and by introducing the Defense IS. Next the Defense IS concepts are described in the context of the genetic taxonomy space. The fifth section positions the defense IS complexity within the extended genetic taxonomy space, and the last two sections add to the discussion, further research, and conclusion of this research.
In order to assess the complexity of an IS, one must start with the very nature of the organization that the IS supports. In other words, one can properly and fully explain the reason for the existence of an IS only if understands the real system (organization) in which the IS operates. Defense organizations belong to the most complex systems ever made; they are goal-oriented, dynamic, multi-level hierarchical systems with information feedback and control, acting in an unstable environment, with the learning and self-organizing ability. Systems pertaining to this class are called organizational systems [15]. In this paper, they will be referred as organizations. Each organization’s activity focuses on achieving some specific goals and includes people, business processes and certain technical equipment, whereby organizational drivers are often identified as the most notable in transformation initiatives [14]. In order to achieve the previously defined set of goals, the organization carries out a great number of business processes.
The principles of genetic taxonomy are based on the hypothesis that a specific information subsystem is needed in order to manage business processes in any organization. The mission, predetermined goals, and the way of achieving them, as well as the internal organizational structure, determine the organization’s information subsystem. The information subsystem’s tasks arise from the general model of an organization [2]. However, all levels of an organization do not perform the same type of business processes, and therefore cannot be supported with the same type of IS. Thus, the type of process to be supported by an IS may be selected as the first criterion for the IS taxonomy. Three types of processes can be distinguished in any organization: deterministic processes with an expected sequence (e.g., delivery is always followed by invoicing and both processes are fully determined; military exercise is always followed by the after-action review and both processes are well standardized, etc.), deterministic processes with an unexpected sequence (e.g., new material ordering, material issued into production or writing off the old stock are disjunctive processes, one of which follows, after checking material stock; decision making in combat situations requires a set of well standardized actions, the sequence of which depends on the current situation, etc.) and inventive type processes, which are not determined in advance and have unpredictable occurrence and duration (e.g., replacing some materials in product structure; resolving an unexpected military situation at sea, etc.).
Each business process within the organization can be performed at one of the three functional levels: the decision level, the management level, or the operational level. On each of these levels of the organizational pyramid all three types of processes are performed, but their distribution varies according to the level. It seems that mixing up different types of processes on different levels proved to be one of the obstacles in all the previous IS classifications. Therefore, the level of processes was selected as the second criterion for the IS taxonomy, with the “matrix” relationship established between these two criteria.
The level of computer involvement in the business processes was selected as the third criterion for the taxonomy. It is true that modern IT has broadened the list of computer-supported processes, but there are still some activities using non-computer technologies. Considering this, three technological levels can be distinguished: processes non-supported by computer (classic technologies), e.g., classic military training, processes supported by information technologies, where computers are used for collecting, storing, processing and dispatching data (or computers with data-base technologies), e.g., distribution and control of budgeting in a defense system, and processes in which computers contain the knowledge necessary for performing different processes in an organization (or computers with knowledge-based technologies), e.g., targeting with self-guided missiles.
All these three criteria are shown in Fig. 2. Their values on the orthogonal axis of the three-dimensional Cartesian system form the “genetic taxonomy space” (GTS) of information systems, or a three-dimensional v-r-t space (where v stands for type of process, r for level of process and t for technological level).
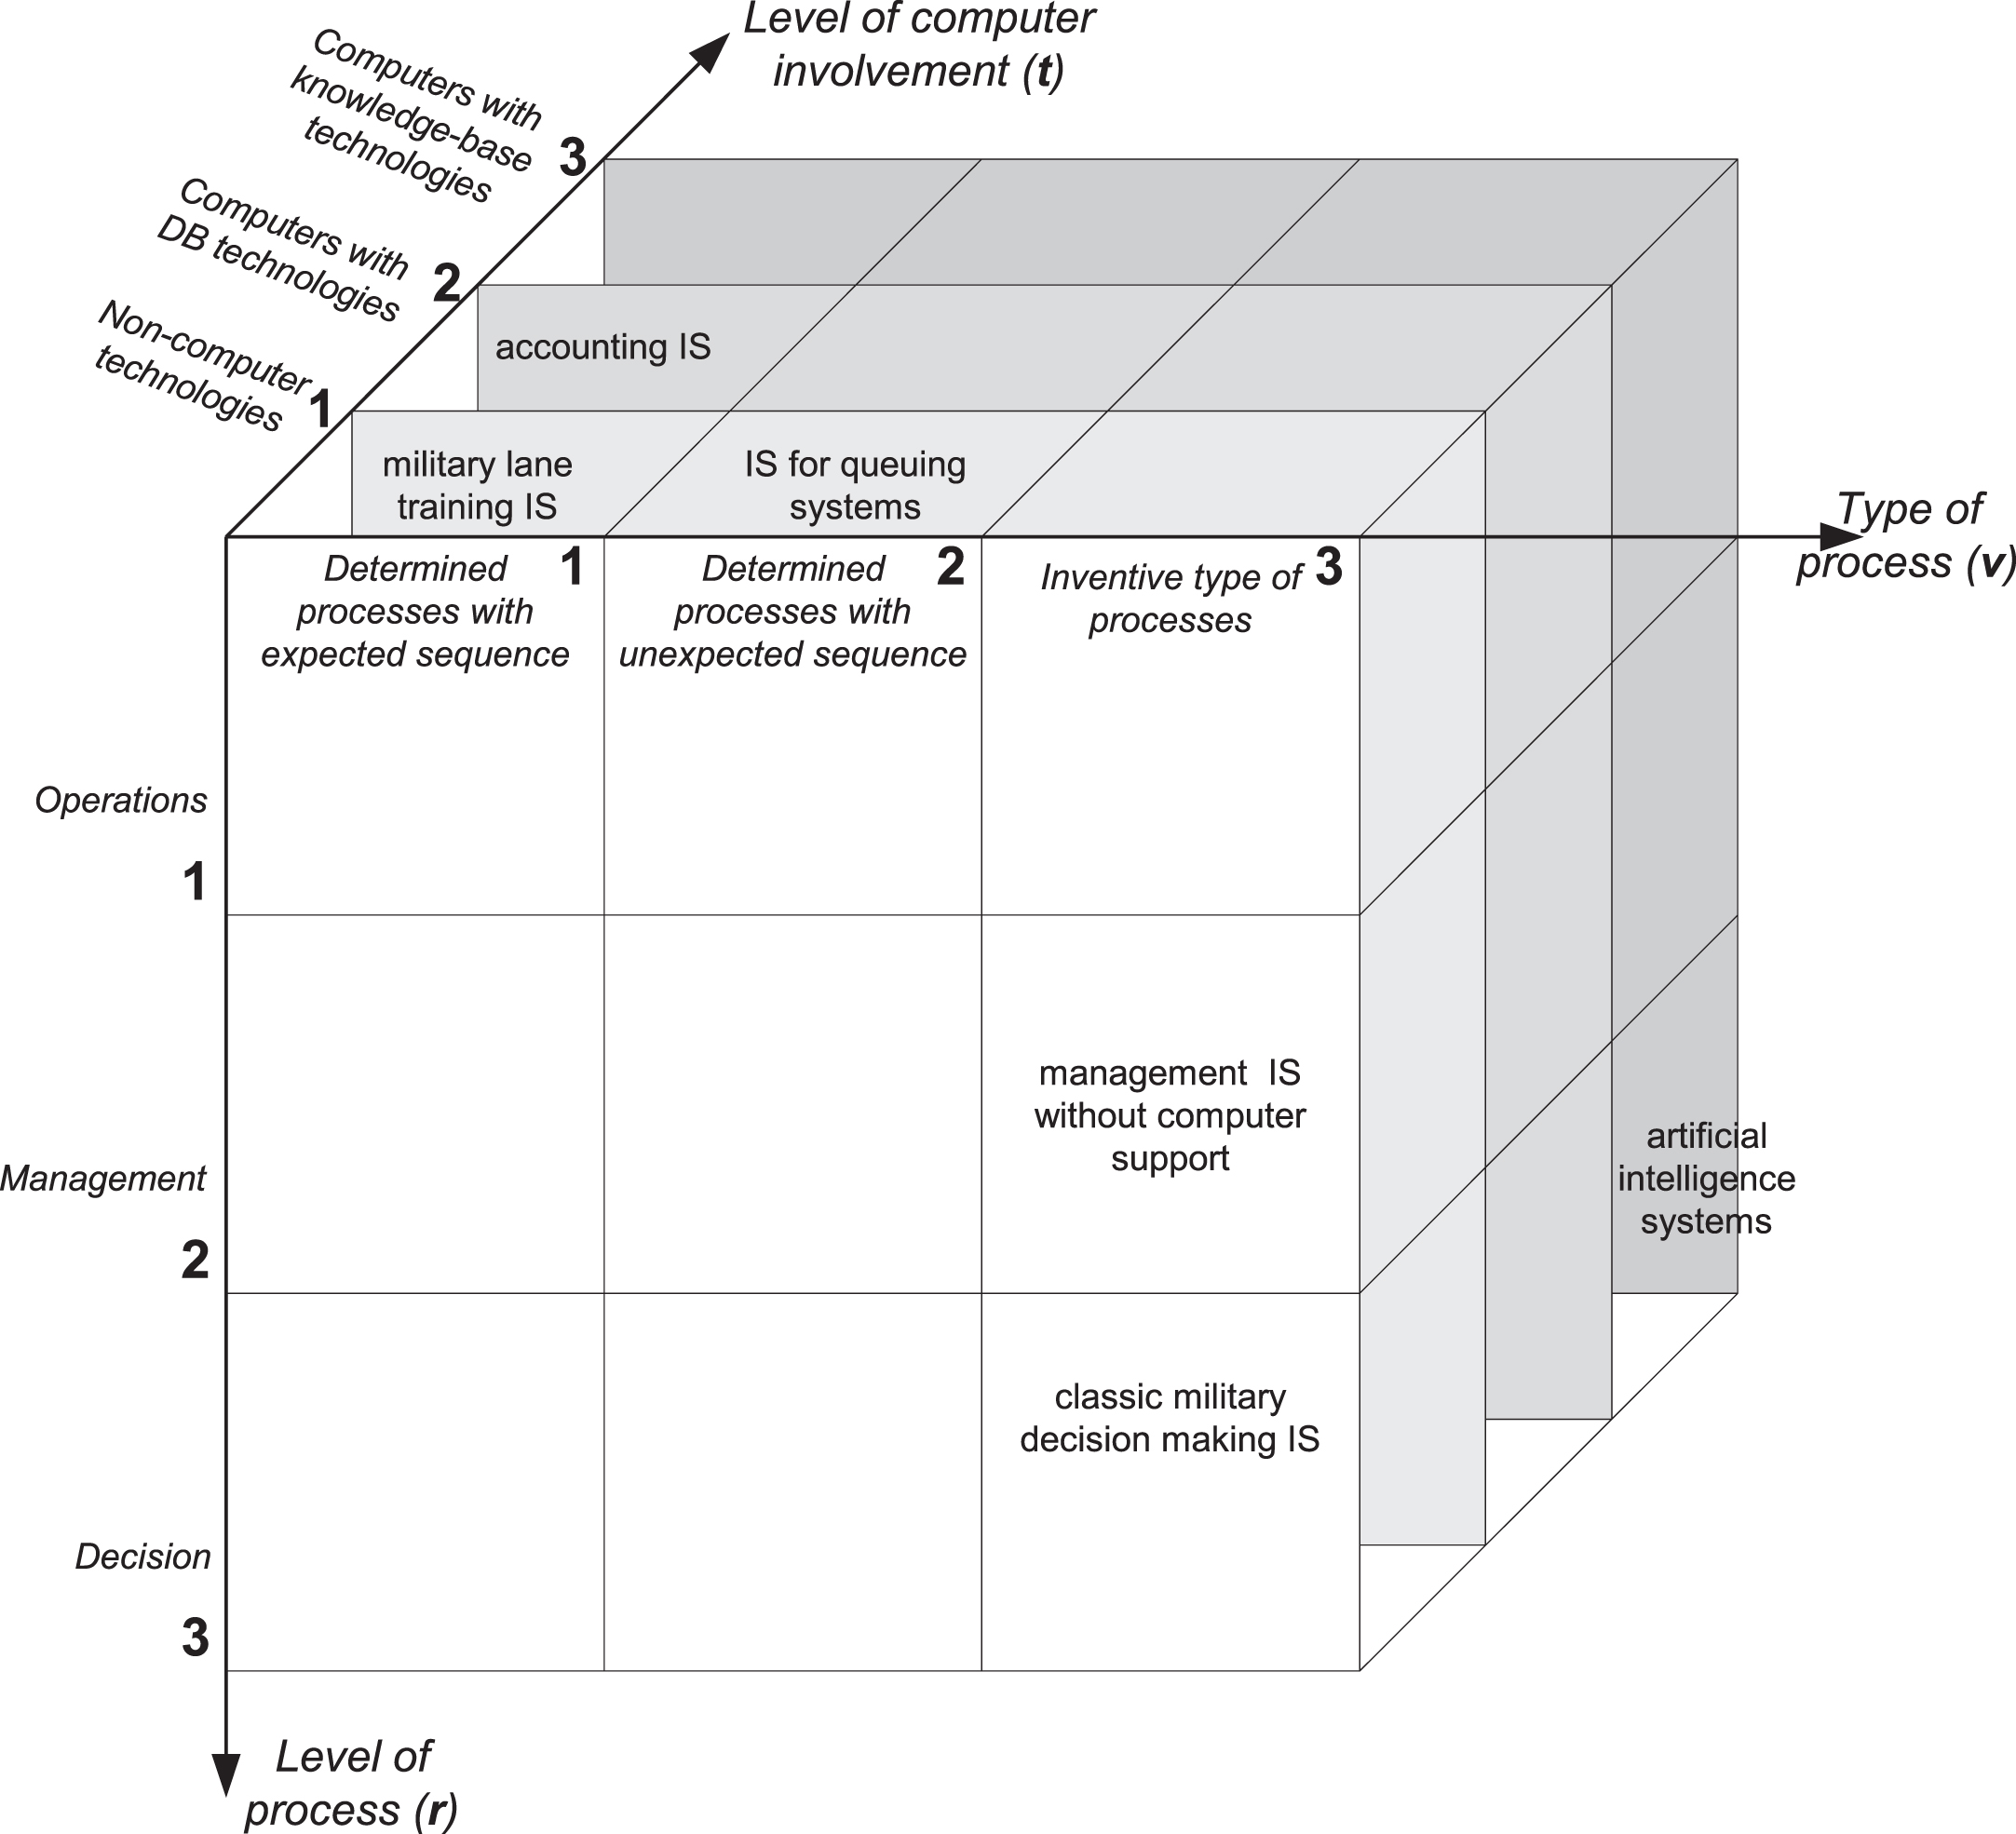
Genetic taxonomy space for information systems.
Each of 27 partial subspaces (cubes) of the GTS represents one group of IS whose attributes differ from ISs in other subspaces. The position of each cube in the genetic taxonomy space, here called the genetic-taxonomical order (GTO) of IS, is unequivocally determined by the value of three coordinates of the genetic taxonomy space. In [27] the genetic-taxonomical order (v,r,t) for some well-known ISs was calculated. Thus a contemporary ERP (Enterprise Resource Planning) system has the value of (v,r,t) = (2,2,2). For a computer-supported accounting information system the value of (v,r,t) = (1,1,2). An expert system for equipment maintenance can have (v,r,t) = (2,2,3), while artificial intelligence systems, based on neural networks, can reach the value (v,r,t) = (3,3,3). In the aforementioned “Strategic Planning and Development of Defense Information Systems” project, the genetic-taxonomical order for some defense systems was determined. An IS for supporting military lane training has (v,r,t) = (1,1,1); IS for queuing systems, like military equipment maintenance systems, have (v,r,t) = (1,2,2). Systems with more complex processes, like military decision-making processes, have (v,r,t) = (3,3,1).
The basic metrics for GTS were chosen in such a way that the increase in the value of each classification parameter (criterion) is proportional to the increase in the complexity of the planned or analyzed IS. When observing a single process, discrete values (1, 2 or 3) can be assigned to each classification parameter. On the other hand, if analyzing a set of processes simultaneously, or organization-as-a-whole, it is justified to surmise that classification parameters for the set of processes could be assigned any value from the interval [1, 3], not just the integer ones. For example, a new IS may be planned for supporting the processes on the operational level and partially those on the management level. In that case, the classification parameter for the level of processes can be assigned the value of r = 1.25. In general, each classification parameter may be considered as a vector lying in the direction of the corresponding coordinate axis, and whose absolute value expresses the contribution to the overall IS complexity. If we suppose that the complexity of development, design, and implementation of a new IS depends on the value of each classification parameter and on their interaction, then the overall complexity S of a planned IS may be expressed as a scalar triple product of vectors that represent the corresponding classification parameters.
Therefore, we have [2]:
In Equation (1) capital letters V, R, T stand for vectors which describe classification parameters of IS-as-a-whole, and which lie in the direction of the v, r, t axes of the GTS. As the GTS is a right-handed system (Fig. 2), the complexity S has a positive value and represents the volume of a parallelepiped determined by the absolute values of vectors V, R, T. If all three parameters are supposed to be equally relevant in terms of their contribution to IS complexity, then we can conclude: the greater the volume, the more complex the IS.
The entire IS supports a great number of processes, which are not of the same complexity and can have different values of parameters v, r, t. Therefore, instead of having vectors V, R, T in Equation (1), it would be more accurate to have the average values of vector sums of the corresponding parameter vectors for all processes supported by the IS. Thus, we come to the following equation:
Equation (2) has two ultimate values. If all m processes that we analyze within an organization have the maximum value of 3 for all three parameters, then complexity S has the maximum value of 27. On the other hand, if all m processes have the minimum value of 1 for all three parameters, complexity S has the minimum value of 1. In practice there is no organization with these ultimate values for IS complexity. In fact, the value of complexity lies somewhere within the continuum of the interval (1, 27), with the values near 1 determining the least complex IS and the values near 27 the most complex IS.
Unlike organizations with well-known and well-analyzed systems like ERP, MRP (Material Requirements Planning), MRPII (Manufacturing Resources Planning) or AI (artificial intelligence) based IT solutions, defense organizations (DO) have so far neither been described or analyzed in literature, nor their GTO has been determined. Consequently, the complexity of their ISs has not been assessed. Although we can assess the complexity of some defense processes and find the place for the ISs supporting them within the GTS (Fig. 2), determining the complexity of the IS supporting the DO as-a-whole is a different endeavor. In order to better understand DOs, find the place for theirs IS within the GTS and assess the IS complexity using genetic taxonomy principles, we should consider their formal definition. The main characteristic distinguishing a DO from other organizations is the predictable changeability of its processes. If we define the organizational business technology from the functional (process model) and data (data model, object model) point of view, then modeling these two views a “frozen” picture of business technology at the moment of IS development can be obtained. For most organizations, future changes in their business technology are not predictable at the modeling (analysis) stage. However, organizations with time changeable functions, like DOs, are able of predicting the way they change their business technology, by predicting the change of their state. While analyzing these organizations some of their characteristics point to the application of formal methods [37], based upon mathematical topics like propositional calculus, predicate calculus, set theory, automata theory, and probability theory. These characteristics are as follows: Organizations have more than one (but finite number) state of functioning. Each state can be analyzed and modeled as a distinct business technology, having its own process model and data model. Transitions from one state to another are caused by some known events. It is not known when the event that causes the transition will happen, but when it happens, the organization will certainly change its state of functioning.
By taking into account these characteristics and consequently applying formal methods, a definition of organizations with time changeable functions was developed [10]. This definition will help us in finding the proper place for a DO within the GTS.
Based upon aforementioned characteristics, DO can be formally described as finite automaton.
The finite automaton M is an ordered five (A, S, T, q0, f), where: A . . . final set of input symbols (events) S . . . final set of system’s states T . . . set of final states (T ⊂ S) q0 . . . initial state (q0 ∈ S) f . . . next-state function, f: S x A ⟶ S.
Set A has two features –it is finite, and its elements are events. An event is a concept that has no time duration and by its occurrence causes a change in the state of the system. The set S is also finite, and its elements are possible states of the system. The set T is a subset of the set S and contains those states in which the system will surely find itself after a certain time interval. The time that the system spends in non-final states is negligibly small compared to the time the system spends in final states. The state q0 is the initial condition and from this state the system begins to function. The function f maps ordered pair (qi, d), which consists of the current state of the system qi and the event d that occurred in the state qi, to the next state qi +1. Thus, f (qi, d) = qi +1.
We will apply the finite automaton method in a case of the Ministry of Defense (MoD), as DO. The MoD is, in this case, a defense organization having two states of functioning, at strategic level: regular state and state of war. What translates the MoD from a regular state to a state of war and vice versa are events. By making a decision to declare a war, the MoD transits from a regular to a state of war, and by making a decision to end the war, the MoD goes from a state of war to a regular state. We can now define the elements of a finite automaton. Let the events be as follows: a . . . decision was made to declare a war b . . . decision was made to end a war.
Next-state function
Next-state function
The set of events is A={a, b}. There are two states of the system: Q0 . . . regular state Q1 . . . state of war.
The state set is S={Q0, Q1}. Q0 is also the final state, because the MoD in state Q1 spends little time in relation to state Q0. Thus, T={Q0}. Q0 is also the initial state. The next-state function that describes MoD state changes is as follows:
A graphical representation of this automaton, realized via state and transition diagram, is shown in Fig. 3.
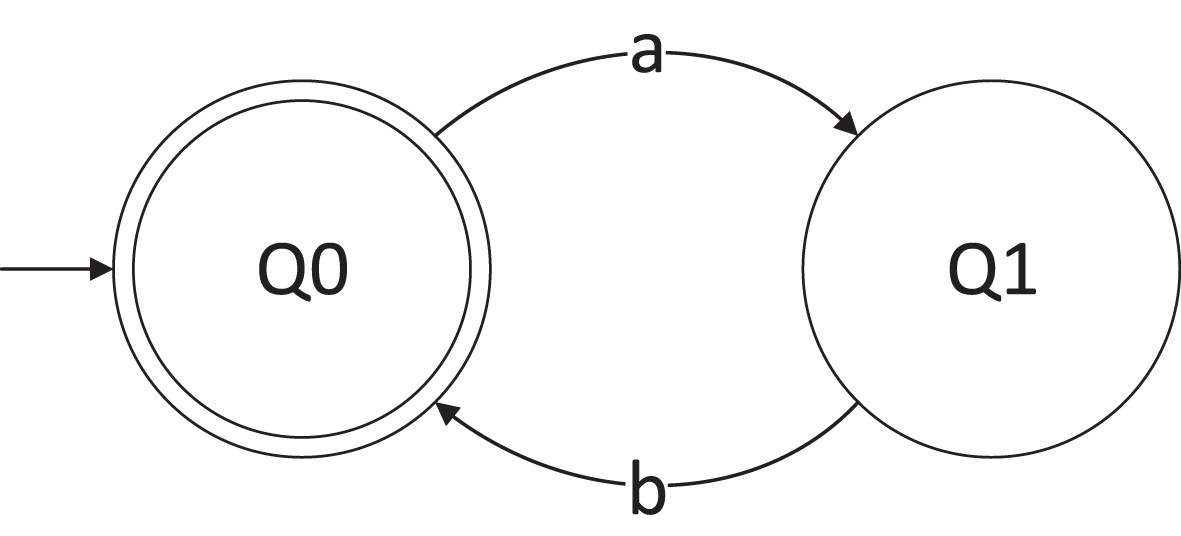
MoD states and transitions diagram.
State Q0 is the initial (double circled, input arrow state), and final state, because the time the MoD spends in the non-final state (Q1) is negligible compared to the time it spends in the final state. In other words, after a war (event a) is declared, the MoD moves from a regular to a state of war, in which a strategic process known as “command and control” takes place. As the time spent in a state of war is limited (based upon historical data), after responding to war and recovering from a war, the MoD returns to a regular state (event b).
In general, there are three preconditions an organization is to fulfill if it is to qualify as an organization with time changeable functions. Without using a formal apparatus, these preconditions are: The states of the organization are mutually excluded. At every moment within the observed time interval, the organization must be in exactly one of its states, which is more restrictive than the above precondition. The probability of a simultaneous occurrence of the event that causes the transition from one state to another and the transition itself is equivalent to the probability of the occurrence of the event.
The last precondition is the most important one. It means that well-structured and standardized organizations like DOs, which use standard operating procedures as business rules and have skilled employees, can act almost like the finite automaton. Consequently, when an event occurs, the organization will certainly transit from one state to another. The states in which DOs can function, as well as the events that cause transitions among states, are predictable at the IS development stage. Therefore, ISs for this type of organizations should incorporate the knowledge about all the states and events. As this knowledge about the organization’s dynamics can be formally described, it is possible to implement it as a part of the organization’s IS. Depending on the extent to which the organization’s dynamics knowledge is implemented into IS, three categories of DOs can be distinguished. The first category comprises DOs which, for example, predominantly use self-guided missile systems. The main part of the IS that supports this type of DOs has technologically implemented knowledge, so the GTS parameter Level of computer involvement equals 3 (computers with knowledge-based technologies). Thus, we narrowed the value of the GTO for this category of DOs, so it can be expressed as:
Consequently, ISs that support DOs in this category can be positioned in any among nine GTS subspaces, wherein the identification of the exact subspace will depend on the values of parameters v and r for the processes performed in the observed DO.
The second category includes DOs whose mission depends on human-machine interaction. Such DOs are: navy ships, air force escadrille, classic air defense systems, etc. The knowledge about machines and their behavior, which are part of these organizations, is usually incorporated into ISs that support this type of DOs. On the other hand, the knowledge about standard operating procedures and processes performed by humans is barely incorporated into the IS as-a-whole. Therefore, the parameter Level of computer involvement may equal any value within the interval [2, 3]. The exact value depends on the amount of knowledge about business dynamics in different states that is considered as relevant for the IS support.
The third category includes completely administrative DOs, like the ministry of defense, the general staff, command areas etc. Although these organizations act as classic business organizations in the private or public sector, they belong to the group of organizations with changeable functions, for they have at least two states: the peacetime state and the wartime state. Depending on the extent theirs IS has been developed to, the parameter Level of computer involvement may equal any value from within the interval [1, 2].
Regardless of the category that the DO belongs to, the other two GTS parameters may equal any value from within the interval [1, 3]. From this point on, ISs that support DOs will be referred to as Defense Information Systems (DIS).
In order to determine the place of a DIS within the GTS more exactly, besides the parameters v, r, t, we should consider another aspect of the complexity of a DO with time changeable functions. Determining the values of parameters v, r, t, for the organization as a whole [2–4, 6], or their average values for the observed set of processes [5], is a sufficient condition for positioning the IS in a certain subspace of the GTS and determining its complexity. At the same time, it is a necessary, although not sufficient condition for determining the complexity of ISs that support organizations with time changeable functions, like DOs. Namely, the complexity of a DIS does not depend solely on the values of parameters v, r, t, but on the number of states that a DO can be found in. As a DO may have two or more states of functioning, it is even intuitively intelligible that a DIS supporting a DO with 2 states is less complex than a DIS supporting a DO with 10 states, although the values of parameters v, r, and t, may be correspondingly the same for both DOs. Hence, two different DOs with the same values of parameters v, r, and t and a different number of states would be positioned at the same point of the GTS, and their complexity according to (1) and (2) would consequently be the same, which is not the case. At this point it is therefore necessary to establish a functional dependency between the DIS’ complexity and the number of states of the DO it pertains to. This dependency can be observed through the process of designing the IS. If the design methodology is determined, and if a DIS is designed for each state, then the IS design process for a DO with 10 states will not be five times as complex as that for a DO with 2 states. On the contrary, the design process is the same and does not depend on the number of states. However, as mentioned before, a DIS as-a-whole, is more complex for a DO with 10 states than for a DO with 2 states. This increase in complexity arises from a greater number of events that cause transitions from one state of the DO to another, rather than a more complex design methodology. The more states a DO may function in, the more events that make a DO transition from one state to another may occur and, consequently, the more complex the finite automaton that describes the DO dynamics is [10]. Therefore, the complexity of a DIS increases as the number of states does. This increase is less than directly proportional, i.e., a DO with 10 states is less than 5 times more complex than a DO with 2 states.
Generally, complexity S of a DIS that supports a certain DO can be expressed as:
or
n . . . number of states;
M . . . finite positive number that k tends to ras n tends to infinity.
For a DO with time unchangeable functions (n = 1) rthe value of k equals 1 rand so expressions (4) and (5) become (1) and (2) rrespectively.
The value of M is assessed by the IS designer rand the greater the value of M is rthe greater the influence of coefficient k upon the IS complexity (4) and (5) rin terms of its increase.
If rfor example rM = 2 rfunction k can be expressed as:
For a different number of states (n) the corresponding values of k, (and rconsequently the increase in complexity S) are as follows (14):
It is evident that, for instance, the complexity of a DIS for a DO with 10 states is 1.27 (1.9/1.5) times as large as that of a DIS for a DO with 2 states, with equal values of parameters v, r, and t in both DOs.
Certain features of DIS complexity as the function of the number of states for different values of M can be seen in the graph in Fig. 4.
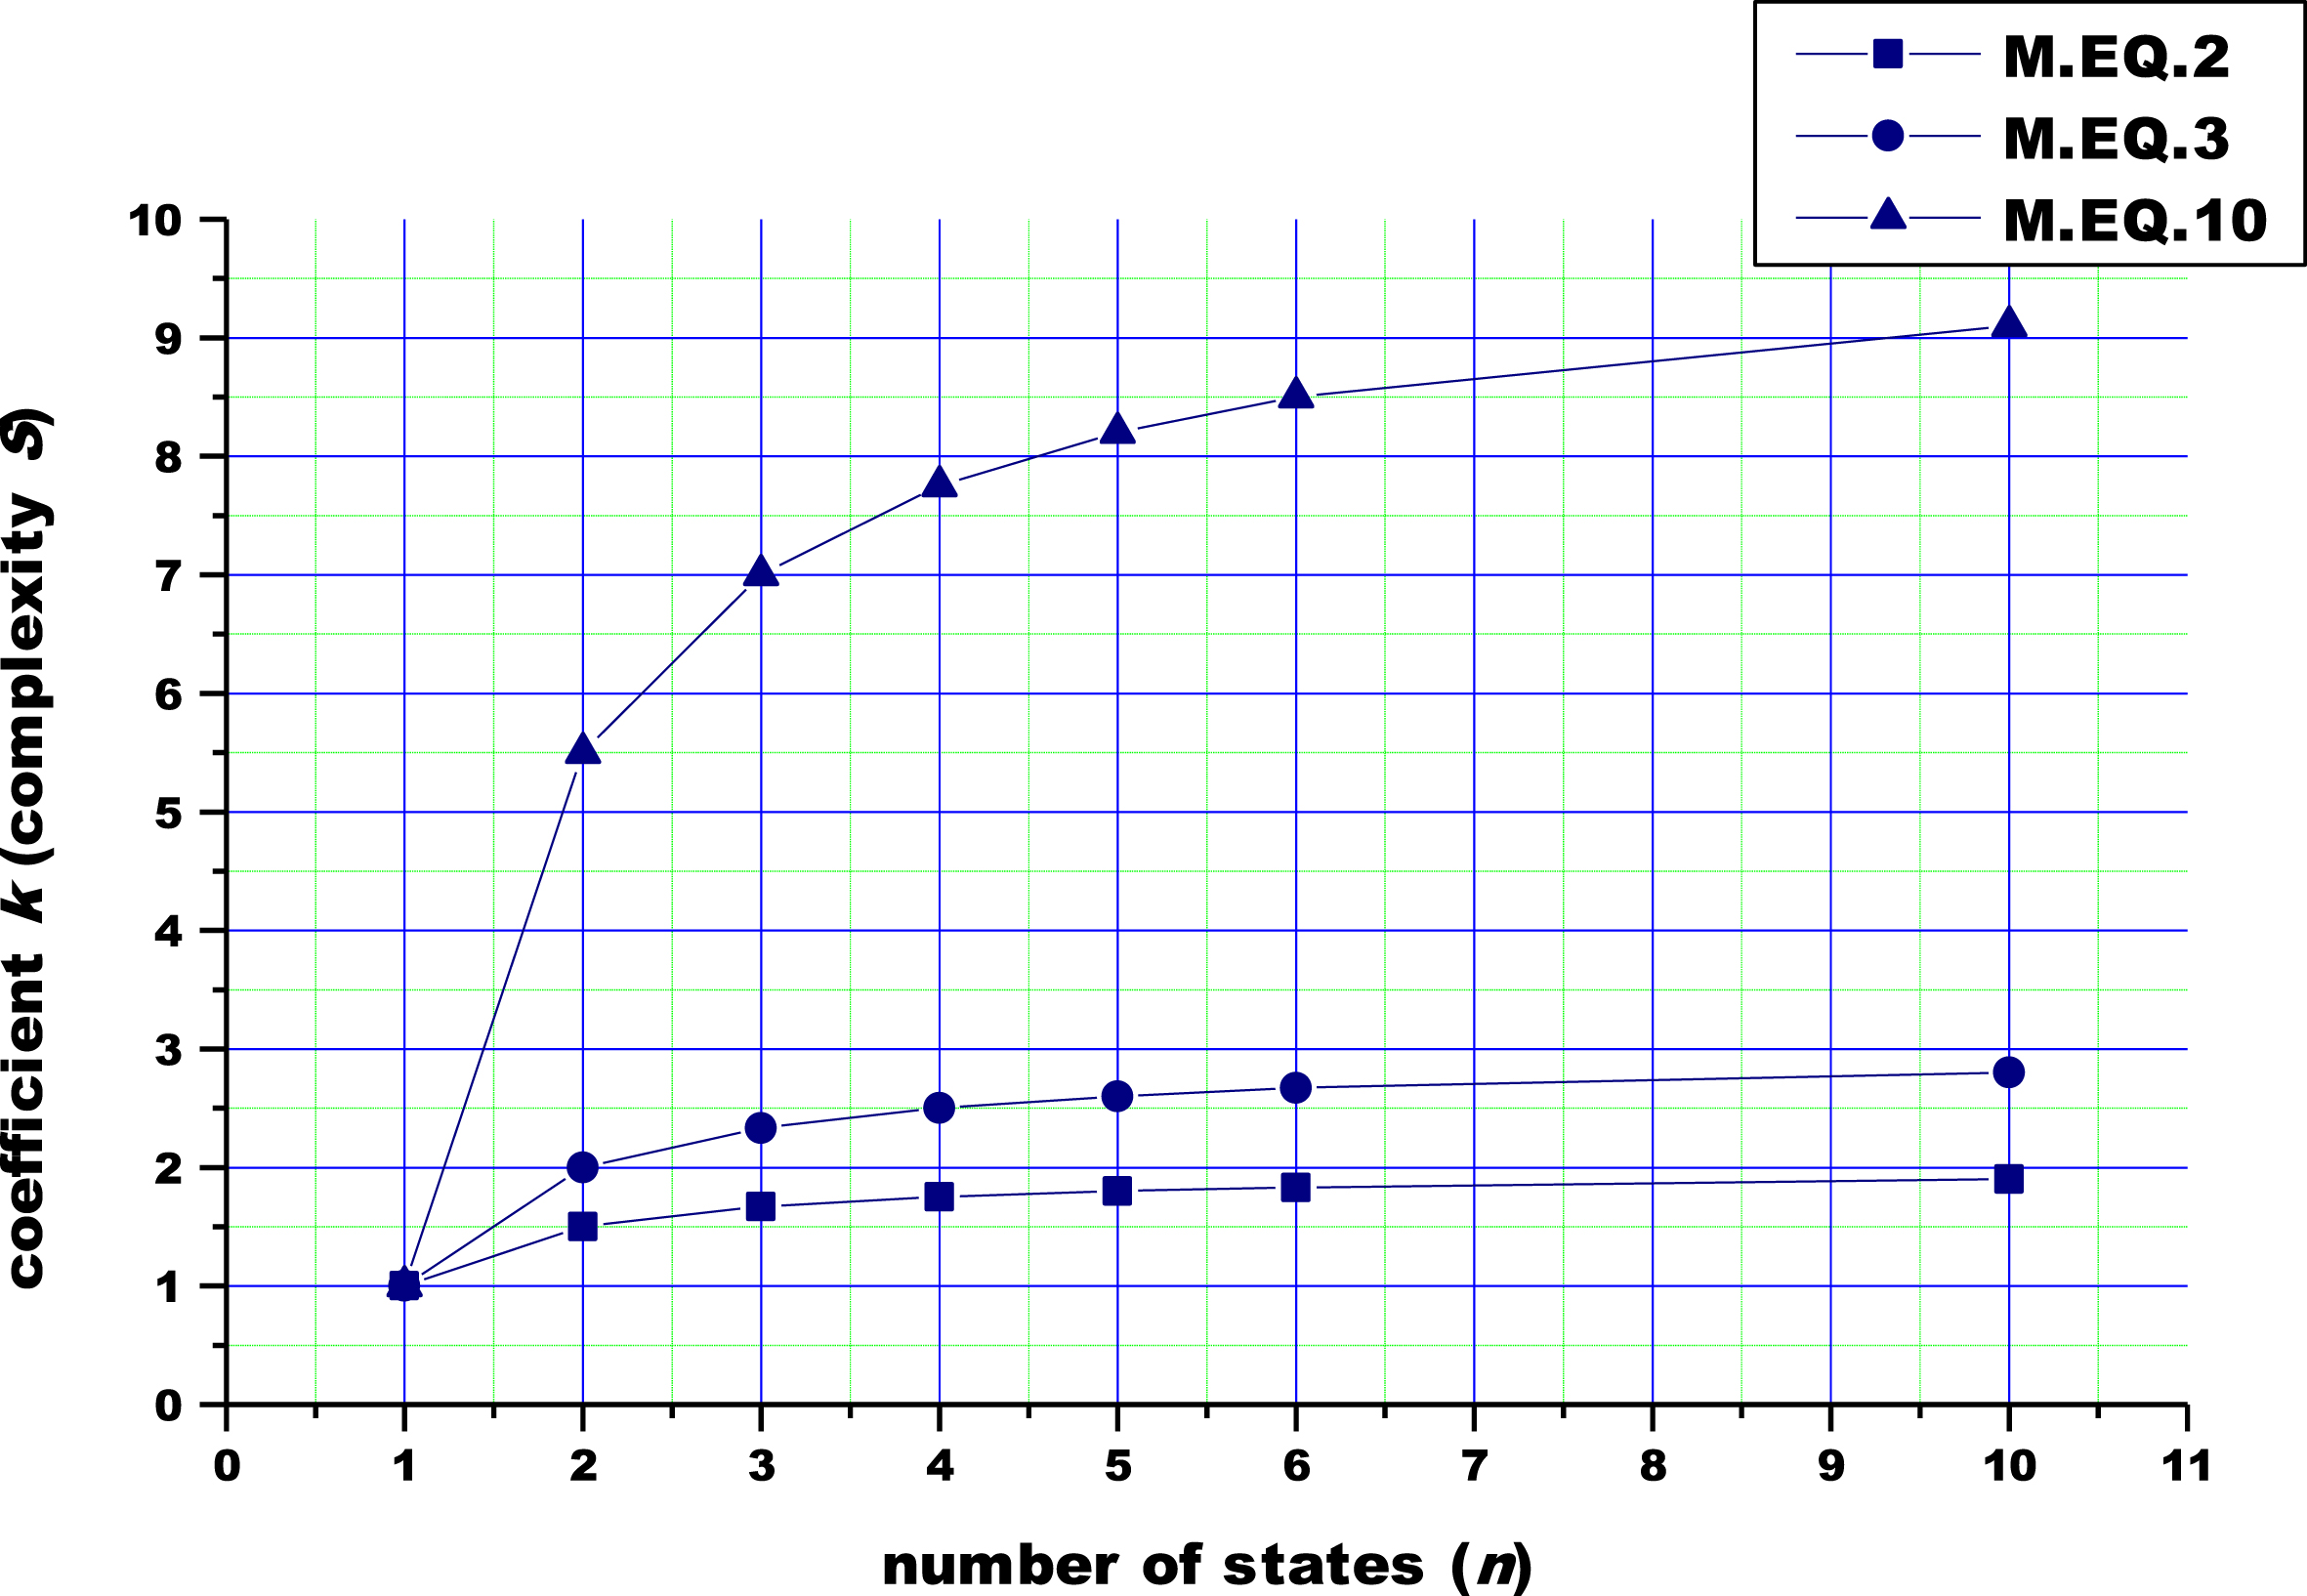
Dependency of DIS complexity on the number of states of DO for various values of M.
As mentioned before, the value of M is assessed by the IS designer, and although each assessment is experientially based, some generally applicable regularities can be identified (Fig. 4): The greater the value of M, the higher the coefficient of complexity and, consequently, the DIS complexity for a DO with the same number of states. For a DO with a lesser number of states, it is intuitively intelligible that there will be a greater dependency between complexity and the number of states. Namely, as the number of states increases, the differences between particular states tend to decrease, since process and data models for particular states are increasingly less distinguishable. This can be accounted for by the fact that the number of processes in a process model and the number of entities in a data model are finite for any DO, so by increasing the number of states, possible variations in the set of processes and entities are exhausted, which eventually results in mutual resemblance among states. Furthermore, the greater the resemblance among states, the simpler the semantics of events that make a DO transition from one state to another becomes. Therefore, as the number of states increases, the DIS complexity tends to become gradually less significant (the difference in the complexity between DISs pertaining to DOs with one or two states is significantly greater than those pertaining to DOs with, for example, 10 and 11 states). In case of a DO with a small number of states that are mutually different to a great extent (e.g. command area) and interlinked with its environment by means of numerous relationships (e.g. subordinate units of the command area), a designer will assign a greater value to M. Namely, the change of state in such a DO will result in numerous changes in the environment, so the semantics of events that cause transitions among states is more complex. The complexity of the corresponding DIS is consequently greater as well.
We will analyze the influence of function k on GTS. If the observed organization does not have a changeable function (n = 1), it’s IS will be placed within the GTS by determining the GTO as described in [2–4, 6], while IS complexity is calculated according to expression (1). A DIS supporting a DO (an OS with time changeable functions, n > 1) is placed within the GTS is the same way, i.e., by determining the values of variables v, r, t, that is, the corresponding GTO. DIS complexity is calculated according to expressions (4) or (5), with function k defined.
If an OS has one state of functioning (n = 1), its complexity is visually determined by the very place of its IS within the GTS (the greater the volume of the v-r-t parallelepiped, the more complex the IS). However, this does not apply to DOs (n > 1) and their corresponding DISs. Namely, two DISs belonging to DOs that have a different number of states and equal values of v, r, t variables will have the same GTO and will therefore occupy the same place within the GTS. The volumes of their corresponding parallelepipeds will be equal, which may visually imply equal complexity of the observed DISs. However, owing to a different number of states, the complexity of the observed DISs, according to expressions (4) and (5) is different, and depends on the value of function k. Nevertheless, due to the need of building awareness for taxonomy visualizations according to [28], to make it possible to visually distinguish DISs with a different number of states and equal values of v, r, t variables within the GTS, we can apply different colors or different shades of the same color to respective parallelepipeds. If we define the intensity of a shade of gray as indicating DIS complexity depending on the number of states, then a transparent parallelepiped (intensity of gray = 0%) can be assigned the value n = 1, which applies to organizations with unchangeable functions. On the other hand, a black parallelepiped (intensity of gray = 100%) can be assigned the value n =∞, which in practice applies to organizations with a relatively large number of states. Accordingly, a darker shade of gray, with equal values of v, r, t variables, will visually imply a greater complexity of the observed DIS. Thus, we shall be able to also represent the number of states of the OS within the GTS as a fourth dimension of complexity of the corresponding IS. The following step would be determining the functional relationship between the number of states of the DO and the corresponding intensity of the shade of gray that the parallelepiped determined by v, r, t variables, i.e., the GTO, is to be colored with.
Let us mark with Sh the function denoting the value of the intensity of the shade of gray for the parallelepiped to be colored. If a DO has one state of functioning (n = 1), then, as stated above, the parallelepiped will be transparent, and the value of function Sh equals 0%. In case when the number of states of a DO is large and tends to infinity (n⟶∞), the value of function Sh needs to tend to 100%, as the color gray is turned into black. Between these utmost values, the value of function Sh increases with the increase of the number of states of the OS. In order to determine the functional relationship between the number of states and the intensity of the shade of gray of the corresponding parallelepiped, function k can be used. If we use expression (6) for function k, then we can assume its value in interval [1 M). As the number of states increases rso does the value of function k. For n = 1 rthe value of function k equals 1 rand if n⟶∞ rfunction k⟶M. Consequently rfunction Sh rfor a defined M rcan be expressed as follows:
Let us assume that three IS design teams are engaged in designing DISs for three different DOs. Let us assume that one DO belongs to the unchangeable functions class (n = 1), and the other two to the time changeable functions class (n > 1). Let us define, as described in [10], that one of the DOs with time changeable functions has 2 states of functioning (n = 2), and the other 10 states of functioning (n = 10). By analyzing processes in all the three DOs it has been determined that v’, r’ and t’ are mean values of variables v, r and t, respectively, in all the three cases. The GTO for their corresponding DISs, which in this case is equal for all the three DISs, has thus been determined. Each DIS analyzed will occupy the same place within the GTS, with equal volumes of the parallelepipeds determined by values of v’, r’ and t’ (Fig. 5). Although the mixed product (v’x r’) · t’ is equal for all the three DISs, their complexity, owing to a different number of states, is not the same.

Representation of the complexity of a DIS supporting a DO with a different number of states.
Let us assume that the design teams use expression (5) and function k as defined in (6) for determining the complexity of the observed DISs. Let us assume that the experientially determined value of parameter M = 4, in all three cases, which leads us to the following expression of function k:
By comparing the place of the analyzed DISs within the GTS, as well as their complexity, the following points have been established, as represented in Fig. 5: All the three DISs occupy the same place within the GTS, determined by their GTO, which equals Rv,r, t = (v’,r’,t’). In other words, the volume of the parallelepipeds determined by variables v, r, t within the GTS is equal. The estimated coefficient M is equal in all the three cases and its value equals 4. Function k, according to expression (9), has different values for the observed DISs –for DOs with 1, 2 and 10 states, it equals 1, 2.5 and 3.7, respectively. Different values of function k also determine the varying complexity S of the observed ISs, according to (4) or (5). In accordance with the varying complexity of the observed ISs, the value of function Sh (10), for DOs with 1, 2 and 10 states, equals 0%, 62.5% and 92.5%, respectively (cases a), b) and c)). Consequently, the observed parallelepipeds are assigned different shades of gray depending on the number of states, i.e., the value of function Sh. The transparent parallelepiped a) refers to the least complex DIS (n = 1), whereas the darkest parallelepiped c) refers to the most complex DIS (n = 10).
We have thus managed to represent a fourth variable –the number of states (n) of the observed DO –in the three-dimensional GTS, as an addition to its variables v, r and t. In this way the GTS resolution has been enhanced, making it sensitive to DOs with time changeable functions, which allows for a more realistic assessment of the complexity of their corresponding DISs. Furthermore, the described approach enables visual distinguishment the complexity of a DIS supporting a DO with a different number of states.
The benefits of understanding the complexity of DIS are manifold. Firstly, by using this extended genetic taxonomy framework, it is possible to assess the complexity of DIS more accurately. Secondly, by expressing the complexity of DIS with regard to different number of states, it provides more clear demands on IS design and development methodology selection and process. Thirdly, the ability to assess how complexity grows with the number of states an organization can operate in, makes it more transparent what amount of effort is needed to transform to another stage of digital maturity. Fourthly, this extension allows the comparison of semantically similar ISs within organizations with similar crisis management function (namely police organizations, organizations aimed at preventing the consequences of natural disasters, crisis management organizations etc.) operating with similar number of states. ISs which have the same level of complexity may be similar enough to have overlapping composite process units (paths) and data sets that can be reused when the new IS procedures need to be introduced. This makes it possible to automate IS design and development to some degree and perform upgrades with less effort by reusing existing IS procedures and applications. The similarity exploration could be the research objective for further exploitation of this framework.
Recent disruptive events show that uncertainty is a factor that most organizations have to deal with, increasingly. The transition from one state of readiness to another must be organized quickly, efficiently, and effectively, in order to achieve the desired level of resilience. As information systems are an indispensable tool in coping with these challenges, system developers need support in the design and development of appropriate information subsystems. Just as [35] in the gaming industry seek to reuse not all, but only selected concepts and elements, so in the case of concepts and elements of defense information systems need to identify key patterns and transitions from one state to another suitable for reuse.
Conclusion
It is our belief that this research adds to the body of knowledge by structuring and complementing the set of dimensions used by other researchers to classify existing systems operating in dynamic ecosystems. This paper extends the previous research by providing a dimension of modeling behavior as a characteristic of defense systems, helpful to researchers in describing dynamic properties of investigated systems. For IT systems designers, as practitioners, reducing complexity in this type of organizations due to better understanding of similarities and uniqueness among various states organizations can find themselves in, can be valuable for dealing with practical problems and design challenges in the contexts of designing and developing IS projects.
The assessment of IS complexity is essential for estimating the amount of work needed for software application development as well as for selecting the appropriate IS development methods. Genetic IS taxonomy does not only enable IS classification according to characteristics of organizational processes supported by the observed IS, but it also provides grounding for the assessment of IS complexity according to characteristics of processes performed within the organization. What distinguishes defense organizations (DO) from most other organizations is the fact that they belong to the class of organizational systems with time changeable functions, i.e., organizations having more than one state of functioning. For the principles of genetic taxonomy to be optimally exploited in assessing the complexity of defense information systems (DIS), a fourth dimension needs to be added to the three-dimensional IS genetic taxonomy space –the number of states a DO can be found in. This additional dimension can be graphically represented by applying a particular shade of gray to the parallelepiped determined by the values of three existing parameters (dimensions) of the genetic taxonomy space. The intensity of the shade of gray is proportional to the number of states a particular DO can be found in. In this way an apparatus has been developed enabling to visually distinguish DISs occupying the same place within the genetic taxonomy space, but featuring a different number of states and, consequently, different complexity. Guidelines for possible future research, in the area of DIS complexity assessment are as follows: If the design methodology has been determined and the design documentation of the existing DISs is available, a possible correlation between the calculated complexity S of the existing DISs and the complexity of the very process of designing them can be investigated. Starting from the hypothesis that more complex ISs are more expensive to develop, it is possible to attempt establishing a functional relationship between the position of a particular IS in the genetic taxonomy space and their development costs. Such research may be complemented by an attempt to determine a functional relationship between DIS complexity and their development costs. By analyzing the process models in particular DO states, it is possible to establish a corresponding expression of function (k) suitable for describing the dependency of DO complexity on the number of its states, which in turn makes it possible to assess the complexity of their corresponding DIS more accurately.