
Abstract
Because the traditional methods do not select the best feature collection in feature analysis, the accuracy and effectiveness of user feature clustering are not high, and the accuracy of user feature classification is not high. Therefore, this paper proposes a customer feature analysis method based on power consumption feature selection and behavior portrait of different people. The optimal feature set is obtained according to the maximum correlation and minimum redundancy criterion, and the user portrait task is described. The spatial feature domain classification method is used to classify the user portrait information, and the user label database is constructed according to the classification results. The AP clustering algorithm is used to cluster the power user portrait information and complete the customer feature analysis. Experimental results show that this method effectively improves the accuracy and effectiveness of user feature clustering, and the accuracy of user feature classification is high, indicating that the application effect is good.
Keywords
Introduction
With the deepening application of power informatization, power information data presents an explosive growth trend, and the era of big data in the power industry has come [1]. The traditional method has certain guiding value for statistical analysis of customers’ power consumption behavior under the condition of small-scale data, but the application effect is not very ideal under the condition of massive data [2]. As power distribution is the nerve terminal of smart grid, it is directly oriented to users. The network architecture is complex and there are many business types. Businesses need to be refined and distinguished according to different clustering methods, so it is difficult to analyze user behavior [3]. With the rise of big data analysis technology, it is possible to deeply analyze user behavior and extract users’ potential power consumption habits and power consumption trends [4]. Under this background, relevant researchers and scholars have put forward some customer feature analysis methods.
In reference [5], aiming at the classification of intelligent users’ power consumption behavior under the background of big data, a user power consumption behavior classification method based on limit learning machine (ELM) algorithm is proposed. Firstly, based on the feature optimization strategy of user behavior in the early stage, the feature optimization strategy is used to extract the best feature set of load curve and classify and analyze the user power consumption data. Then, taking the feature optimization set as the input, by comparing the accuracy of training set and test set under different hidden layer activation functions and the number of hidden layer nodes, the input parameters of elm algorithm suitable for user power consumption behavior analysis are optimized. Finally, the user’s power consumption behavior is classified. However, this method does not extract features, resulting in low accuracy. Reference [6] puts forward a characteristic analysis method of differentiated power consumption behavior based on the segmentation of power consumption customer groups. Through the segmentation management of differentiated power consumption behavior of power consumption customer groups, a segmentation structure model is established to improve the service quality of power supply enterprises. Based on power big data, a model structure to meet the segmentation of power customer groups is established through data mining technology. Firstly, according to the actual operation of power customers, a model evaluation index based on customer power supply reliability requirements, customer behavior and customer value is established. Then, for a large data group, K-means clustering algorithm is used for data cleaning and preprocessing to obtain refined detailed data. Finally, the differentiated evaluation and management of power customers will be realized. However, this method takes a long time in data preprocessing, resulting in its low effectiveness. Reference [7] proposes an AP clustering analysis method of user power consumption behavior based on optimized SAX and weighted load characteristic index. Firstly, SAX algorithm is used to reduce the dimension of load curve and extract features, and simulated annealing particle swarm optimization algorithm is used to determine the reasonable number of characters and states. Then combined with the load characteristic index, the improved AP clustering algorithm is used to cluster the load curve. In the clustering process, the entropy weight method is used to objectively weight the load characteristic index to avoid the subjectivity of index setting. Finally, based on the clustering results, the power consumption behavior and demand response potential of various users are analyzed. However, the accuracy of this method in user classification is low, which leads to its poor applicability. Therefore, this paper proposes a customer feature analysis method based on different groups’ power consumption feature selection and behavior images. Compared with the traditional analysis of customers’ electricity consumption behavior, this method pays more attention to the mining of customers’ electricity consumption value, and can realize the quantitative analysis of a large number of customers’ electricity consumption. Determine the best feature set based on the maximum correlation and minimum redundancy criteria, describe the user portrait task, and classify and process the described information. Finally, the AP clustering algorithm is used to cluster the portrait information of power users and complete the customer feature analysis. After using this method, the classification accuracy of user characteristics is up to 0.95, which indicates that the accuracy and effectiveness of this method are high, and it can serve customers more effectively, improve customer satisfaction, reduce operational risk and provide decision-making reference.
Customer characteristics analysis method
Determination of the optimal feature set based on the maximum correlation and minimum redundancy criterion
The maximum correlation and minimum redundancy criterion is a filtering feature selection method. Its core idea is to maximize the correlation between features and categorical variables and minimize the redundancy between features and features. This paper applies it to the selection of users’ electricity consumption characteristics, and obtains the feature set with the strongest correlation and lowest redundancy, which is used to characterize the electricity consumption characteristics of users. The correlation between feature and classification variable takes the mutual information value between feature and classification variable as the measurement index, which represents the reduction degree of category uncertainty when the feature is known. In the process of solving, in order to make each characteristic variable more statistically significant, it is necessary to discretize each variable, that is, convert the numerical sequence of each variable into a probability distribution interval. In this paper, the features are normalized, and then the variable interval is evenly dispersed to obtain the probability distribution of each feature variable, and then the mutual information between each feature quantity and user category is calculated.
In information theory [8], entropy is used as a measure of information uncertainty. The greater the entropy, the higher the degree of information uncertainty. The formula for calculating the entropy of K is:
In the formula, d represents the number of intervals of feature g i ; b represents the number of samples in which feature g i falls in a certain interval; a represents the total number of samples.
The information entropy of user category l is:
In the formula, F (X (l)) represents the total number of categories of users; F′ (X (l)) represents the number of samples in which users belong to a category.
The joint information entropy of the i-th feature g
i
and the user category l is:
In the formula, n represents the number of samples where g
i
falls in a certain interval and the user category is l. Then the mutual information between the i-th feature g
i
and the user category l is defined as:
According to formula (5), the mutual information between each feature and user category can be obtained separately.
Based on the obtained mutual information, the maximum correlation index between the optimal feature set and category l is defined as S′ (l), and the calculation formula is:
In the formula, σ i and σ j respectively represent the i and j features in the optimal feature set; σ l represents the correlation between the feature i and the user category in the optimal feature set; N represents the features contained in the optimal feature set The number of features.
The redundancy of information between two features can be measured by indicators such as information gain, Gini coefficient, and correlation coefficient. This article uses correlation coefficient to measure, and its calculation formula is as follows:
In the formula, cov (σ i , σ j ) represents the covariance of the two features; θ i and θ j represent the standard deviations of features σ i and σ j , respectively; φσ i ,σ j represents the correlation coefficient of the two features, the value range is [-1,1], the closer the absolute value is to 1, the greater the correlation, the closer the absolute value is to 0, the smaller the correlation.
The minimum redundancy index is S [C (t)], and its calculation formula is:
In the formula, t represents the correlation between features and categorical variables; t s represents the redundancy between features and features.
Combining the two indicators in formula (7) and formula (8) to obtain the maximum correlation and minimum redundancy criterion, the corresponding formula is as follows:
In the formula, it represents the maximum correlation and minimum redundancy index. Solving the feature set that satisfies the maximum correlation and minimum redundancy criterion is the optimal feature set.
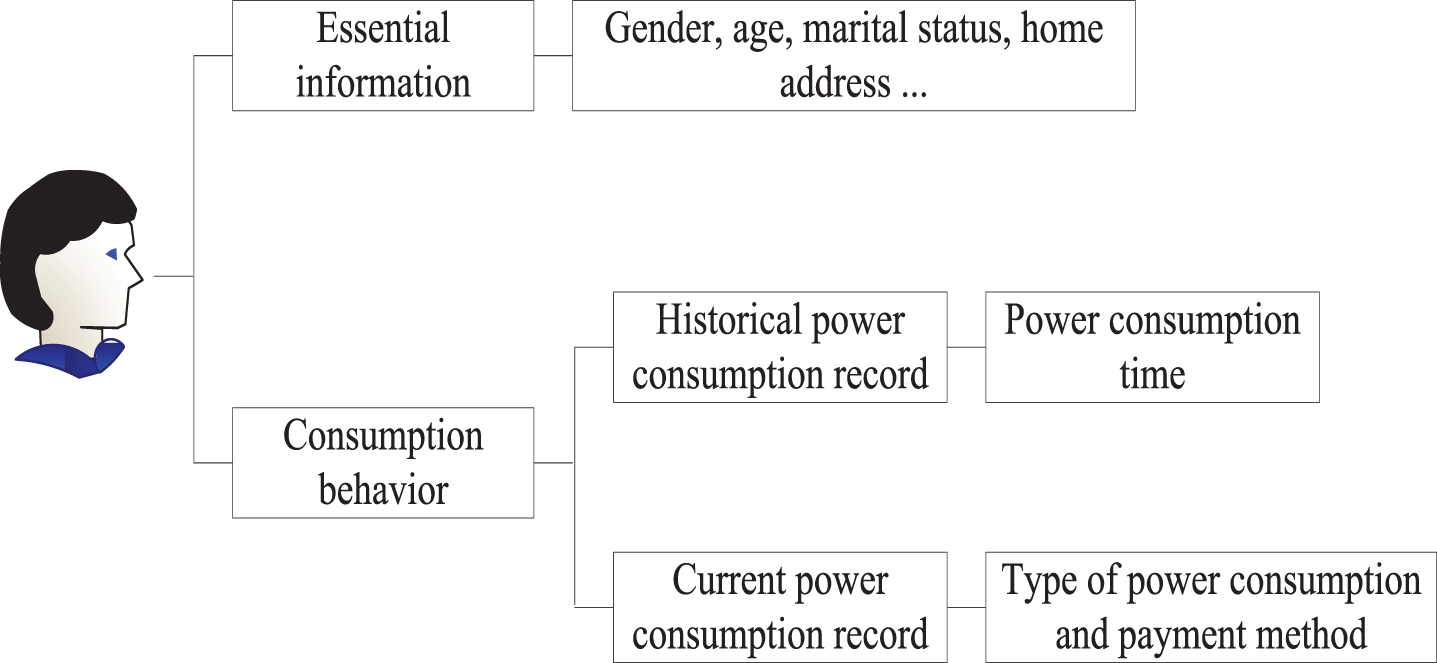
User portrait generally has three steps. The first step is to clarify the target of the user portrait, that is, determine the actual situation of the user portrait, and analyze the main data composition of the user portrait. The second step is to collect relevant data about user portraits, and the third and most important step is to build a user tag library. User tags can not only make people clear, but also help computer processing tasks such as calculations.
A tag is a symbolic identification of user characteristics. The tag has two obvious characteristics. One is that it has a certain population and can sample the characteristics of abstract transactions to a certain extent. The second is that a certain type of characteristic of the user can be identified by a symbol. The symbol can be English, Chinese, or a number or a symbol that gives a special meaning. The tag library is a centralized management of tags, and is ultimately used to mark user behaviors and attributes. The main task of the user portrait is to label the user based on the user information, that is, to build the user’s label library. Through the tag library, the meaning of each tag can be clearly understood, and the user’s portrait can be given practical meaning. The definition of the user portrait description tag of the user tag library is shown in the following table:
The above table is mainly about the establishment of a tag library for tags such as employment, population, house type, house occupancy rate, cooking type, presence or absence of children, etc. On this basis, users can be better marked.
User portrait description label definition table
User portrait description label definition table
According to the above analysis, referring to the general research process framework of data mining, this paper uses a two-stage method to conduct user portraits on customer characteristic behavior log data. The overall framework is shown in Fig. 1. The user profile framework in this paper mainly includes three key stages: feature engineering, classification engineering and clustering engineering. Figure 1 mainly introduces feature engineering, classification engineering and clustering engineering.
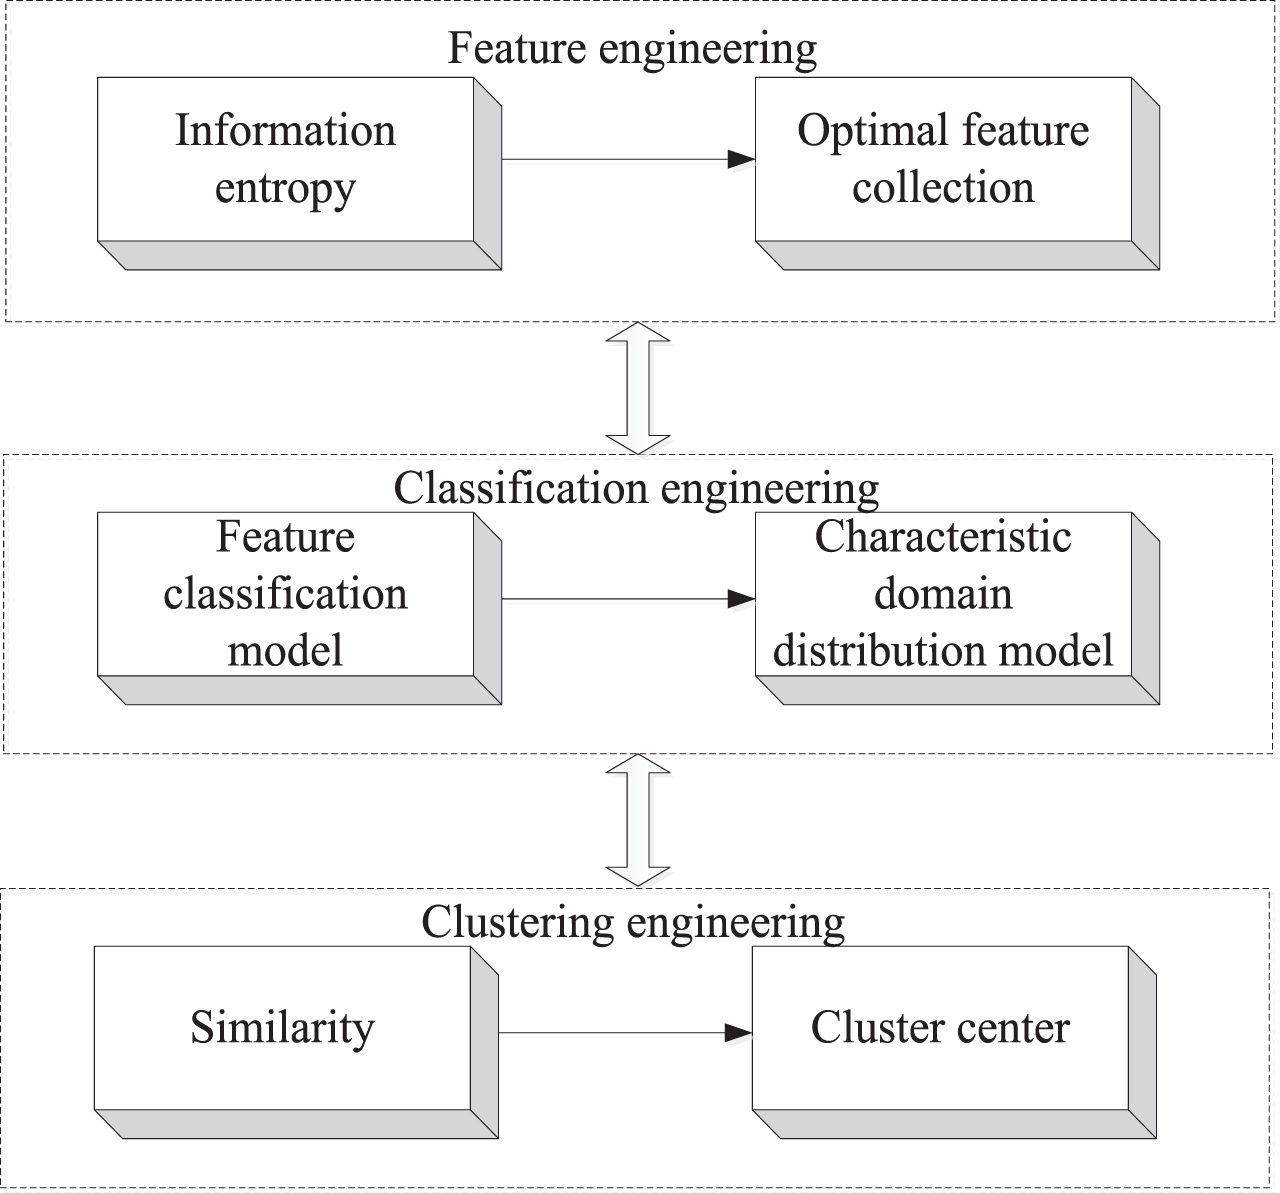
Overall framework of user portrait.
Feature engineering is to obtain the information features (information entropy) after eliminating redundancy from the original data for subsequent algorithms and models; Classification engineering is to classify features according to feature classification model; Clustering engineering consists of multiple classes according to the similarity of each object.
Different types of single features are combined in pairs to obtain binary features, and then the feature selection method of multi-index fusion is used to select features with larger correlation coefficients for subsequent model training. The spatial feature domain classification method is used to classify the information of the user portrait, and the multi-scale layer-by-layer analysis method is used to accurately classify the fuzzy power user portrait, and the power consumption category feature quantity of the user portrait is extracted [9]. The user portrait is in a low-dimensional space. The similarity feature of is s (A, B), and the template matching equation is:
In the formula, P (A, B) represents the power consumption information feature component in the power consumption information subset A of the user portrait; R (A, B) represents the statistical feature quantity of the multi-dimensional power consumption category of the user portrait. Assuming that the power consumption information set of the power user portrait is (c, v), take this as the power consumption information center, and use the sharpening template classification method to obtain the feature classification model of the power user portrait as:
In the formula, d (t) represents the power user portrait training sample; E represents the main feature vector space; I′ (t) represents the feature information collection.
According to a set of power user portrait training samples, the main feature vector space is constructed, that is, the feature subspace (feature information collection), and the feature domain distribution model of the user portrait multi-dimensional measurement is established in the local feature domain of the power distribution feature domain, which is described as follows:
In the formula, Wi+1 represents the user portrait feature domain; f i represents the template matching value of the feature domain; α represents the overall multi-dimensional information feature components presented by the user portrait management information; w i represents the statistical feature value of the power user portrait.
The activity category lasso model is established to extract the category features of power user portraits and information classification processing, and the optimized detection model for user portraits is obtained as:
In the feature domain, the user portrait is fused with the feature domain template of the electricity information value to realize the classification of the user portrait information. In order to construct a three-dimensional power user portrait, it is necessary to use the statistical feature decomposition method to calculate the distance between each power consumption information and the clustering center, construct the power consumption histogram of the power user portrait, and construct the information layer by layer analysis result under multi-dimensional dynamic scanning. The accurate positioning of the power user portrait is achieved, and the accurate feature value is extracted based on this to obtain a three-dimensional portrait.
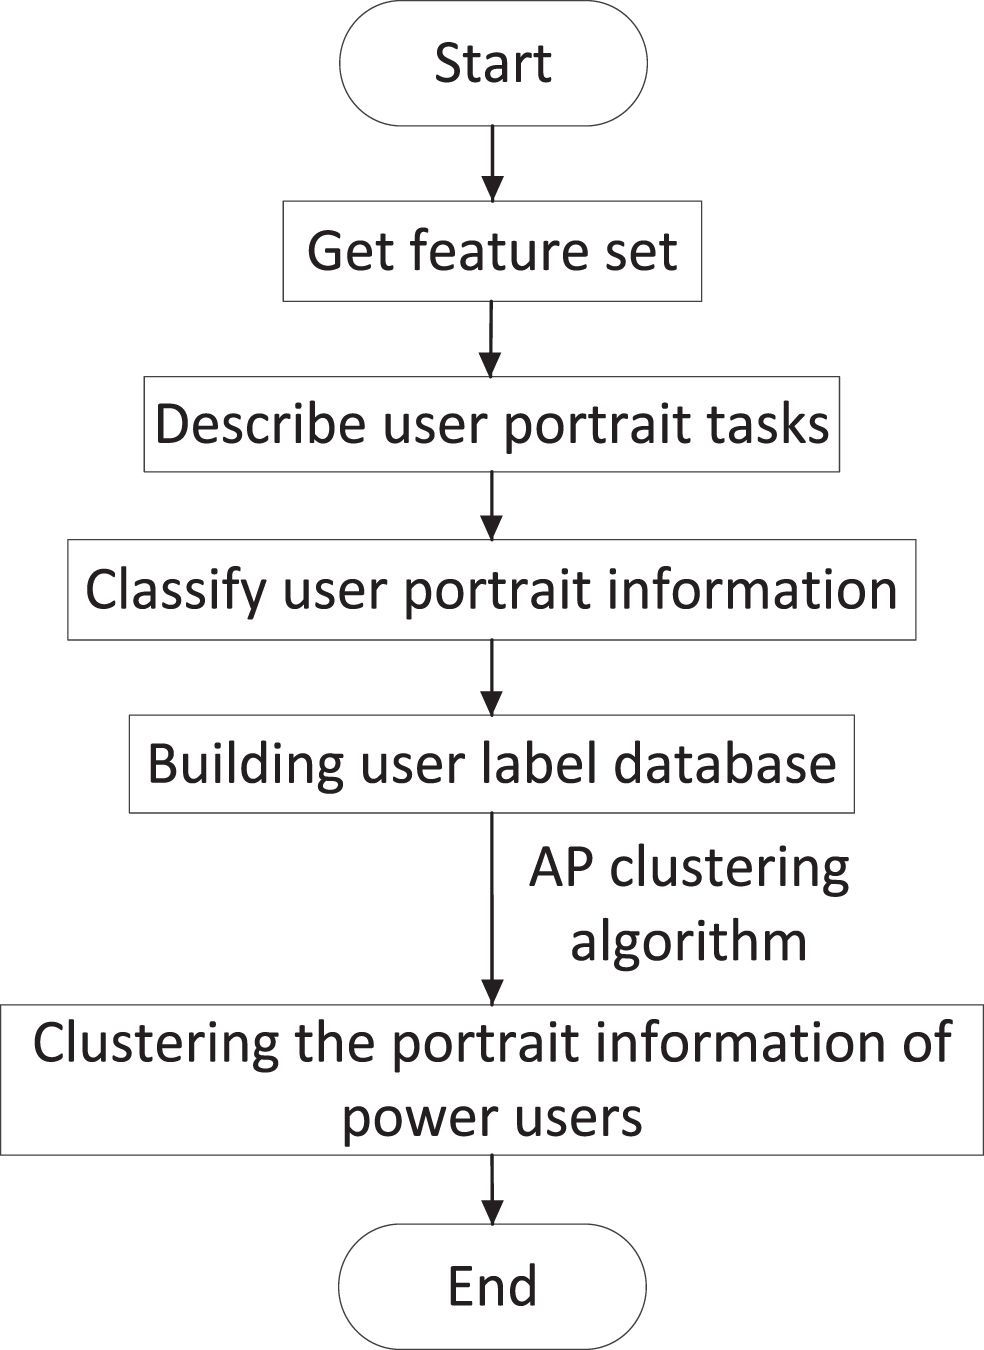
In summary, the process of the classification algorithm for power user profile information proposed in this paper is shown in Fig. 2.
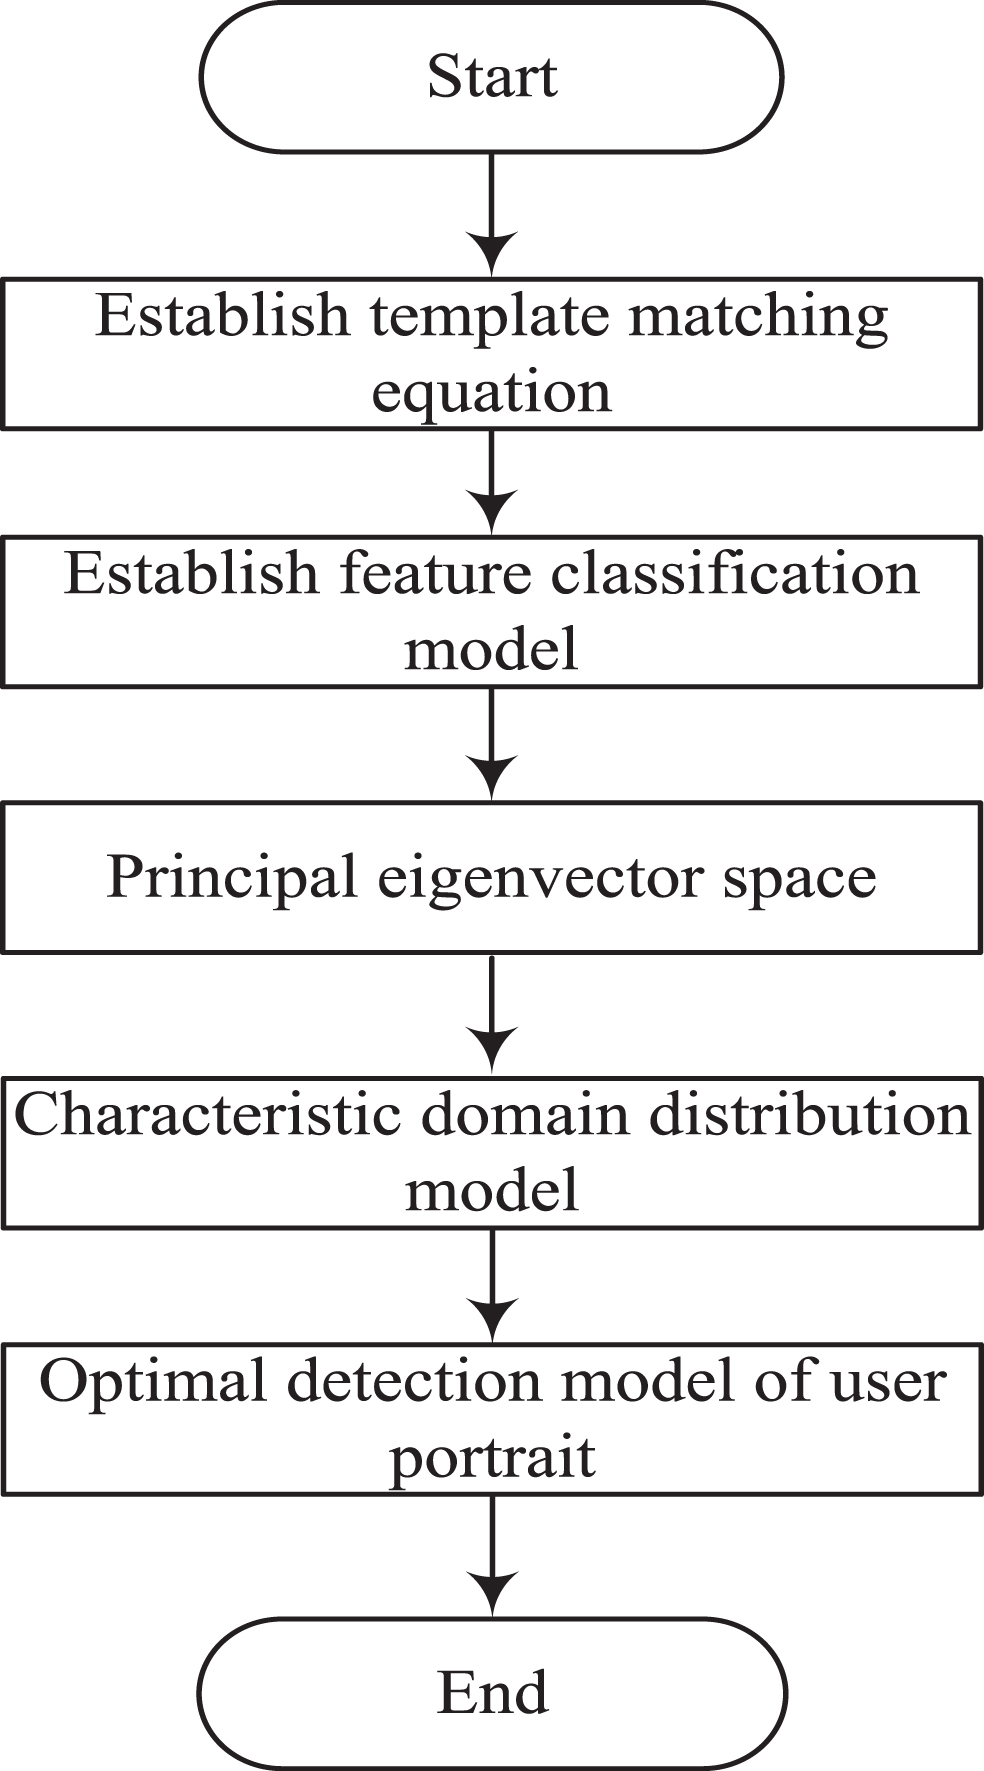
Flow chart of the classification algorithm for power user profile information.
The template matching equation is composed of feature components of power consumption information and statistical feature quantities of multi-dimensional power consumption categories of user portraits; By using the sharpened template classification method, the classification model of power user portrait features is obtained; Constructing a main feature vector space according to a group of portrait training samples of power users; In the local feature domain of the power distribution feature domain, the feature domain distribution model of the multi-dimensional measurement of the user portrait is established; Finally, the class feature of super user portrait is extracted by lasso model and the information is classified to obtain the optimized detection model of user portrait.
According to the above classification results of power user information, the user similarity is measured by Euclidean distance, and based on the measurement results, the power user profile information is clustered by clustering algorithm. Previously, based on the classification algorithm of power user profile information, the highly relevant features were extracted, and the features for constructing the user tag library were formed. In this way, tags that can effectively represent users are found from the original massive network access log data, which provides data support for the construction of user portrait models. In order to achieve further analysis of customer characteristics, it is necessary to cluster the power user profile information. This article mainly uses the AP clustering algorithm [10] to achieve.
Different from traditional clustering algorithms, AP clustering algorithm does not need to specify the number of clustering categories and clustering centers in advance, but iteratively competes for clustering centers through the message mechanism between sample points to achieve the optimization of clustering results. Its advantage is that it has a certain degree of objectivity and good applicability. The main process of the AP clustering algorithm is to iteratively calculate the support B (μ
i
, μ
j
) and fitness D (μ
i
, μ
j
) in the data sample, where B (μ
i
, μ
j
) represents the degree to which sample μ
i
supports μ
j
as its cluster center, and D (μ
i
, μ
j
) represents the degree to which μ
j
is suitable to become the cluster center of sample μ
i
. Define the similarity between any two sample points μ
i
and μ
j
to be measured by the Euclidean distance S (μ
i
, μ
j
) [11], then the iterative formula is:
In the iterative process, each sample point μ i competes to become the cluster center, and the goal is to find t k such that it is the maximum value in S (μ i , μ j ), then t k is the cluster center. Since some sample points of competing cluster centers will be eliminated in each iteration, the remaining cluster center data is the number of cluster categories.
In order to verify the advantages of the AP clustering algorithm, a user in a certain area was selected to perform a case analysis. After the data was standardized with the help of MATLAB software [12], AP clustering was performed. The results are shown in Fig. 3.
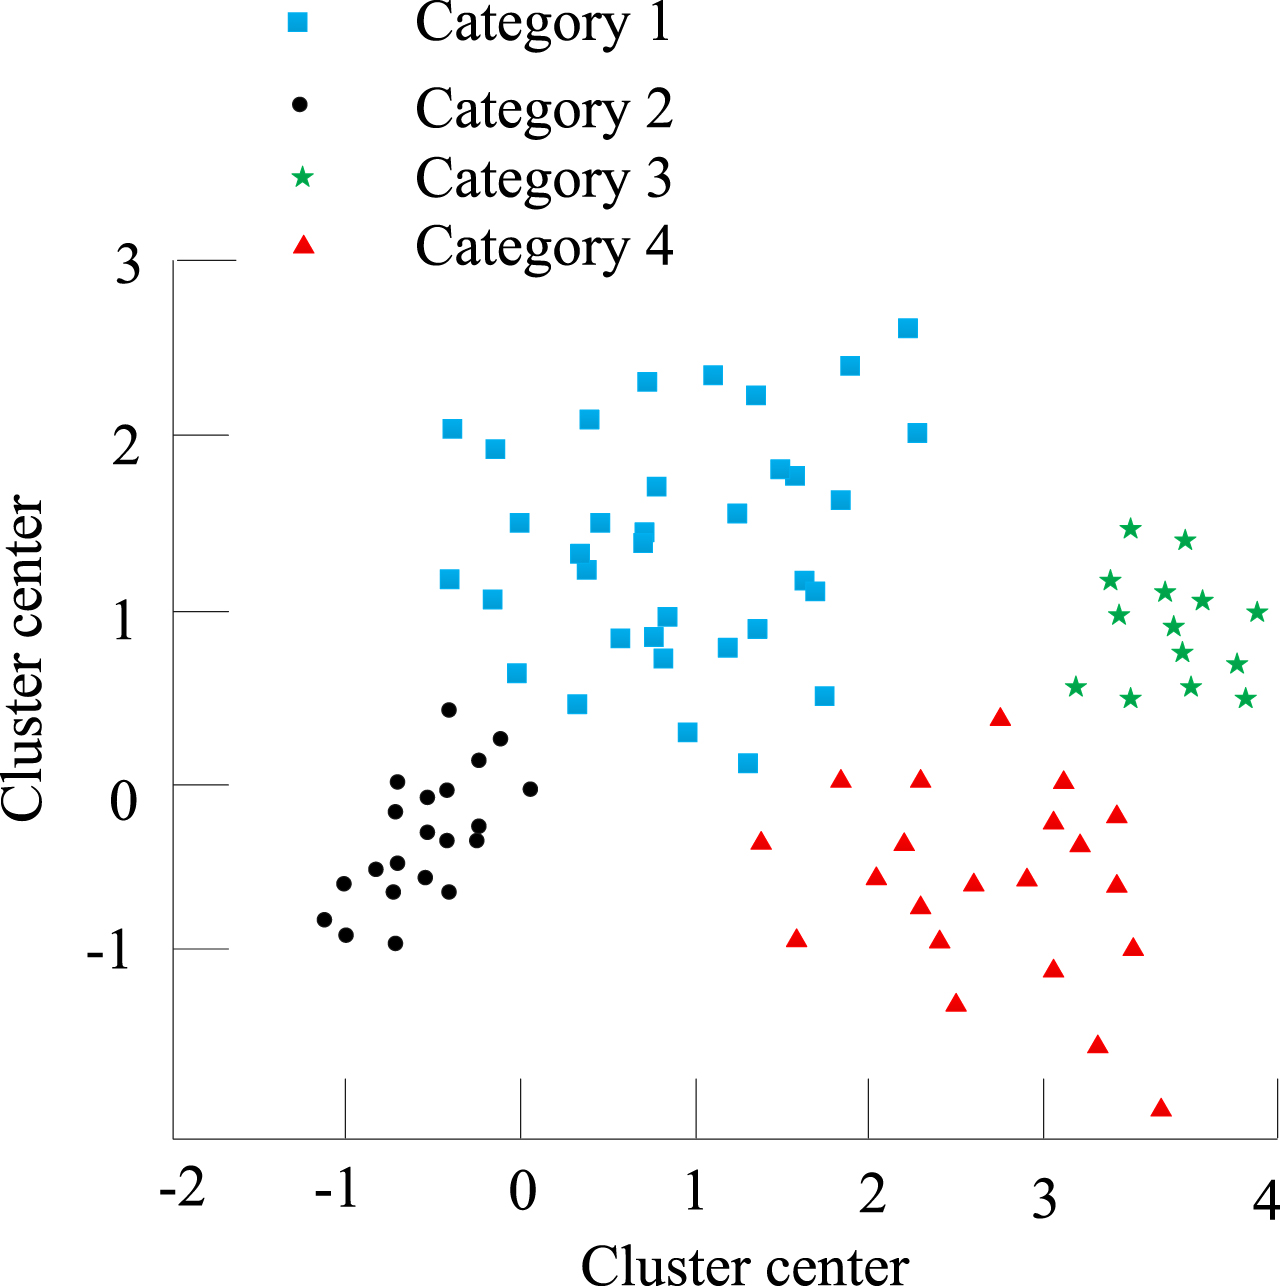
AP clustering effect verification.
It can be seen from Fig. 3 that the users in the calculation example are automatically divided into 4 categories. Categories 1, 2, 3, 4 indicate that the power user profile information clustering process of the AP clustering algorithm is better, and it can achieve accurate division of the same or similar types of user profile information.
Based on the above-mentioned construction of the user portrait information processing model, a user portrait construction method based on multi-dimensional category feature recognition and corner identification is proposed, and the multi-dimensional feature distribution feature domain of power user portraits is constructed in the smart electricity management system. The statistical feature decomposition method is used to calculate the distance between each power consumption information and the cluster center, construct the power consumption histogram of the power user portrait, and scan the power user portrait with multi-dimensional scanning technology. It is obtained that the feature quantity of the power user portrait center is H ={ h1, h2, . . . , h
n
}, the power user portrait classification line is marked as H
x
= - jϑ
x
|g
i
| and H
y
= - jϑ
y
|g
i
|, and the power consumption information value output of the user portrait management information map meets the following requirements:
In the formula, T = 1, 2, . . . , M, i < j. By calculating the displacement vector F
i
(i = 1, 2, . . . , M) in the gradient direction of the user portrait collection, using the power user portrait distribution power consumption information matching method, two vectors of power demand are obtained, ϖ
i
and ϖ
j
, then the block feature domain classification control parameters of the user portrait ∂
i
is selected as follows:
In the formula, x ij represents the multi-dimensional scale information of the power user portrait; ξ ij represents the overall feature sampling feature distribution sequence of the power user portrait.
The feature extraction result of the electricity demand of the user portrait is:
In the formula, h (t) represents the overall multi-dimensional information feature components presented by the user portrait management information; G represents the iconic sequence of the power user portrait; σ2 represents the power consumption weight value; γ i represents the power consumption information intensity.
The feature matching method by feature domain is used to detect the block fusion of the two-dimensional user portrait and the feature block matching, and the output of the subset of power consumption information of the user portrait is as follows:
In the formula, e (t) max and e (t) min represent the maximum attribute value and the minimum attribute value of the power user portrait feature. The layer-by-layer analysis results of building information under multi-dimensional dynamic scanning are described as:
Based on the above analysis, a precise positioning model of power user portraits is constructed to achieve precise positioning of power user portraits.
According to the above parameter setting, the power customer stereo portrait is constructed, and the power customer stereo portrait database is obtained, as shown in Fig. 4.
Portraits of power users.
Analyzing Fig. 4, it can be seen that the method in this paper can effectively realize the multi-dimensional construction and feature point calibration of the power customer’s three-dimensional portrait. Based on the selection of electricity consumption characteristics of different groups of people and the construction of behavior portraits, the analysis of users’ electricity consumption behavior is realized by clustering optimization, which mainly includes the feature selection of user electricity load curve and the cluster optimization of user electricity consumption behavior. Due to the large amount of calculation using load curve clustering data, it is not suitable for the use of large amounts of data. This paper adopts the feature optimization strategy to extract the optimal feature set of the load curve. After optimizing the characteristics of the data, this paper takes the four characteristics of daily average load, valley power coefficient, power consumption percentage of flat section, and peak-hour power consumption rate as the preferred features of user power consumption data.
According to the optimized feature set, the power consumption characteristics of all user power load curves are extracted [13], and these characteristics are used for cluster analysis. By changing the number of clusters, compare the accuracy and effectiveness under different cluster numbers, stop clustering when the set threshold is reached, and finally select the best cluster number according to the clustering optimization strategy [14] proposed in this paper. The clustering optimization strategy adopted in this paper can effectively make up for the deficiency of dynamic clustering algorithm in power consumption behavior analysis and realize the effective analysis of user power consumption behavior [15].The following is the overall idea of this article:
First, the best feature set is obtained according to the maximum correlation and minimum redundancy criteria, and the user portrait task is described. The spatial feature domain classification method is used to classify the user portrait information, and the user label database is constructed according to the classification results. AP clustering algorithm is used to cluster the portrait information of power users and complete the analysis of customer characteristics.
In order to verify the effectiveness of the customer feature analysis method based on power consumption feature selection and behavior portrait of different people, an example is analyzed. In the analysis process, the differential power consumption behavior analysis method based on power consumption customer segmentation proposed in document [6] and the AP clustering user power consumption behavior analysis method based on optimized sax and weighted load characteristic index proposed in document [7] are selected as comparison methods, and compared with the methods proposed in this paper to verify their effectiveness.
Experimental data
This paper uses the load data of a power company’s main network and all power customers from January 1 to December 31, 2019. The sampling interval is 30 minutes, and each daily load curve has 48 sampling points. First, perform cluster analysis on the daily load curve data of the main network of the power company, and divide the daily load data of the main network into three categories according to the clustering results.
Analysis of experimental results
Effectiveness of user feature classification
Analyze the data of 1,000 residential users under the selected power company. By clustering the typical and sub-typical power consumption curves of users, comparing the clustering results to judge the accuracy of the clustering, the calculation formula is (21), and calculate the validity by formula (22).
Define the accuracy of user feature clustering as C
τ
:
In the formula, τ represents the number of clusters; n i represents the number of within-class load curves of type i features.
Define the effectiveness of user feature clustering as E
τ
:
C τ and E τ are used to measure the clustering effect of user characteristics. The larger the value, the better the clustering effect. On the contrary, the clustering effect is not good.
The change trend of accuracy and validity obtained by the above calculation formula is shown in Fig. 6.
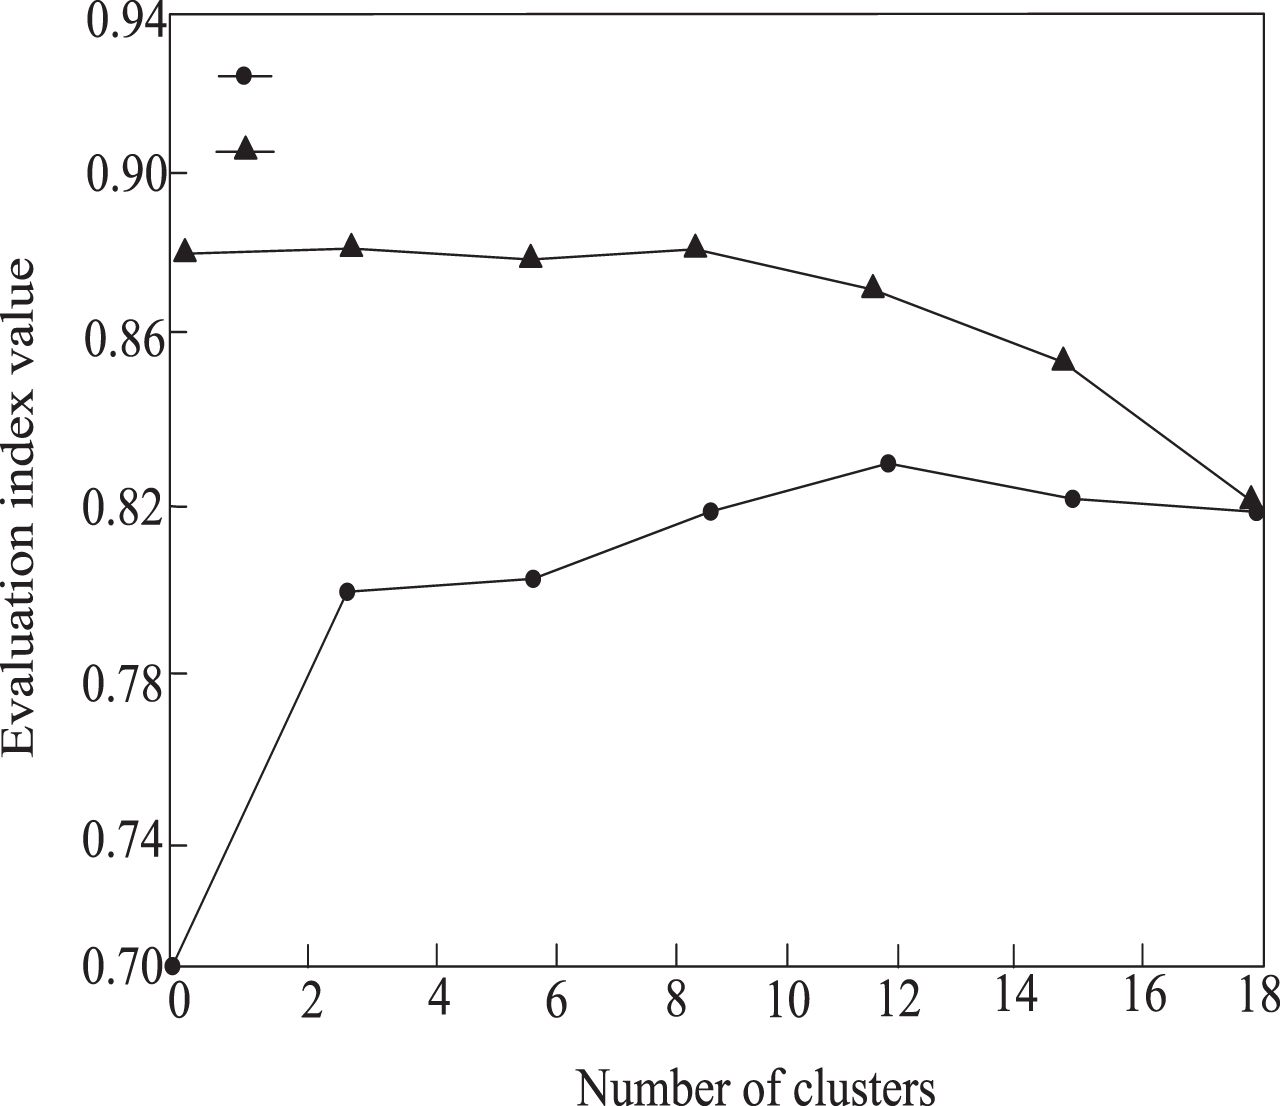
Changes in accuracy and validity of user feature clustering.
Overall thinking.
It can be seen from the accuracy curve that before the number of clusters reaches 10, the accuracy fluctuates steadily around 88%. When the number of clusters exceeds 10, the accuracy begins to decrease significantly. At the same time, it can be seen from the validity curve in the figure. Before the number of clusters reaches 10, the effectiveness continues to rise, and then its effectiveness tends to fluctuate steadily. It can be seen that choosing the optimal number of clusters to be 9 or 10 is more reasonable.
The accuracy and validity data obtained by the above calculation formula are shown in Table 2.
Numerical results of accuracy and validity of user feature clustering
Analyzing the data Table 2 shows that the clustering results are consistent with the trend of user characteristic clustering accuracy and validity, indicating that the clustering results of the proposed method have a certain degree of reliability.
According to the data of 1000 residential users selected above, the validity of user feature classification is verified by randomly sampling user samples. The specific calculation process is as follows:
N samples were randomly selected. For the results of the classifier test, K samples were judged wrong. K is a random variable and P(K) obeys binomial distribution.
Where, K represents the true error rate and P(e) represents the likelihood function.
If the sample number N is larger, the confidence interval is smaller, and P(e) is closer to the true error.
In order to verify the effectiveness of the method, the accuracy of user feature classification is used as the experimental index, and the proposed method is compared with the method of literature [6] and literature [7]. The comparison results are shown in Table 3.
Comparison results of user characteristic classification accuracy
Comparison results of user characteristic classification accuracy
From the comparison in Table 3, it can be seen that with the increase of the number of iterations, the user feature classification accuracy of this paper is up to 0.95, the user feature classification accuracy of the literature [6] method is the highest 0.88, and the user feature classification accuracy of the literature [7] method is the highest Feature classification accuracy is the highest at 0.87. In contrast, the user feature classification accuracy of our method is significantly better than other comparison methods. Since the original feature set contains all the features, it will lead to the increase of redundancy, and the increase of redundant information will interfere with the classification results, resulting in a decrease in classification accuracy. This method effectively solves this problem. It can be seen that it is necessary to select appropriate feature sets for different sample sets, and the feature sets optimized by the proposed method can better adapt to the user feature analysis in this paper.
In order to verify the validity of this paper, this paper takes the error rate of user feature classification as the experimental index, and adopts the proposed method, the method of literature [6], and the method of literature [7] to conduct experimental tests. The comparison results are shown in Table 4.
User feature classification error rate comparison table
User feature classification error rate comparison table
From the comparison in Table 4, it can be seen that the highest user feature classification error rate of this paper is 0.05. The user feature classification error rate of the literature [6] method is the highest 0.18, and the user feature classification error rate of the literature [7] method is the highest 0.19. It shows that the error rate of the method in this paper is significantly lower than that of the traditional method. It can be seen that the feature set optimized by the proposed method can better adapt to the user feature classification in this paper.
In order to verify the validity of this paper, this paper takes the time of user feature classification as the experimental index, and adopts the proposed method, the method of literature [6], and the method of literature [7] to conduct experimental tests. The test results are shown in Table 5.
Comparison of user characteristics classification time
Comparison of user characteristics classification time
From the comparison in Table 5, it can be seen that with the increase of the number of experiments, the user feature classification time in this paper is up to 0.99 s, the time used by the method in Reference [6] is up to 1.49 s, and the time used by the method in Reference [7] is up to 1.57 s s, indicating that the efficiency of this method is significantly higher than that of the traditional method. The above descriptions prove that the method in this paper is efficient, accurate and effective. The technical level and application value of the method proposed in this paper are proved to be high.
In order to solve the problems of low accuracy and effectiveness of user feature clustering and low accuracy of user feature classification in traditional methods, this paper proposes a customer feature analysis method based on the power consumption characteristics and behavior portrait selection of different people. The experimental results show that compared with the traditional user power consumption behavior analysis method, this method has higher accuracy and effectiveness of user feature clustering and higher accuracy of user feature classification. Therefore, it can be seen that the customer feature analysis effect of this method is better than that of the traditional method, but this method still has some shortcomings, such as the complexity of the algorithm process, which leads to a long operation time and makes the user feature classification time unable to achieve the expected effect. Therefore, in the next research. The algorithm will be improved to reduce the operation time and improve the classification efficiency.This technology can be applied to industrial, medical and other application scenarios, and it is hoped that it can be more applied in actual scenarios in the future, and can provide more effective help for customer service and improve customer satisfaction.