
Abstract
With the acceleration of technological change and globalization, companies face increasing environmental uncertainty and complexity. The COVID-19 pandemic has severely damaged the global supply chain and aggravated the operational risks of supply chains. Industry and academia have conducted studies on the construction of resilient and integrated supply chains, and to date a bulk of empirical literature has already been accumulated. A notable feature of existing literature is the heterogeneity in the characterization of the relationship between supply chain resilience, supply chain integration, and supply chain performance. In this study meta-analysis and structural equation modeling (MASEM) methods are integrated to construct a theoretical framework of supply chain resilience, supply chain integration, and supply chain performance. 45 empirical studies (73 effect size data, 2092 samples) are selected from 10,623 papers published over the years 2013 to 2021 to explore the transmission mechanisms, the role of mediator variable, and boundary conditions of the relationship between supply chain resilience and supply chain performance. The results show that supply chain resilience can promote supply chain performance. Moreover, supply chain integration (supplier integration, internal integration, and customer integration) plays a partial mediating role for the impact of supply chain resilience on supply chain performance. Situations and measurement factors such as industry type, national culture (power distance), sampling area, and logistics performance have a certain impact on the relationship, and the usage of different indicators may lead to marked differences in conclusions regarding the relationship. By extracting the conclusions of existing empirical studies, this study proposes new insights into the mechanism of action of supply chain resilience, supply chain integration, and supply chain performance and provides specific suggestions for future supply chain management.
Keywords
Introduction
The COVID-19 pandemic continues to shake the world, not least by severely damaging global supply chains. Many companies’ manufacturing operations, logistics, and even the ability to contact customers are suddenly interrupted, and problems such as instability, uncertainty, complexity, and lack of transparency in the supply chain are collectively exposed. In the face of competition risks and interruption crises, academics and business managers continue to explore the factors that stabilize and improve the performance of the supply chain. In previous studies, supply chain integration is a key variable to improve supply chain performance.
Scholars usually carry out analyses from varying dimensions and with different points of view. In terms of supplier integration, Droge et al. [1] argue that supplier integration can improve supply chain performance, while Swink et al. [2] find that there is no direct link between supplier integration and supply chain performance. In terms of internal integration, Liu and Lee [3] find that internal integration of third-party logistics has no direct impact on its service performance, but through the complete intermediary of customer integration, service performance can be improved. Riley et al. [4] stress that through internal process integration, the company can enhance its early warning and recovery and ultimately improve organizational performance. In terms of customer integration, Danese and Romano [5] regard it as important to promote enterprise performance, while Wong et al. [6] outline that green customer integration is conducive to generating green product and process innovations significantly depend on green internal integration. This brief look into related literature makes it clear that the understanding among scholars of the mechanism of supply chain integration is not uniform. The empirical research on the antecedents of supply chain integration is insufficient to derive clear-cut policy conclusions [7].
According to Gartner’s 2021 global supply chain TOP25 rankings, supply chain resilience in the face of COVID-19 is the key to survival for the covered companies. Similarly, in June 2021, the U.S. Departments of Commerce, Energy, Defense, and of Health and Human Services jointly released the report “Building Resilient Supply Chains, Revitalizing American Manufacturing, and Fostering Broad-based Growth.” Resilience has become an urgent demand for the security of the global industrial and supply chain. In 2017, Professor Sheffi of the MIT Center for Logistics and Transportation published a book entitled “The Power of Resilience”, which has far-reaching impacts on the study of supply chain resilience. His book, compiled from interviews with dozens of large companies, guides how to deal with supply chain crises. The book is praised by entrepreneurs today for its relevance in face of the COVID-19 pandemic.
Siagian et al. [8] stress that to cope with COVID-19 induced disruptions firms should improve corporate performance through resilient and flexible supply chains. Yu et al. [9] demonstrates the impact of supply chain resilience on financial performance. The empirical study of Mandal et al. [10] concludes that supply chain resilience has a significant positive impact on supply chain performance. However, Wieland and Wallenburg [11] find that a significant relationship between supply chain integration and supply chain resilience is absent. Thus, again, existing literature does not reach at a consistent conclusion on the direction and strength of the correlation between supply chain resilience, supply chain integration, and supply chain performance.
Based on industry practice and on the findings of previous studies, we add supply chain resilience as an important antecedent variable to explore the mechanism of supply chain integration. Therefore, the first research question raised in this study is: (How) does supply chain resilience affect supply chain performance through supply chain integration?
Furthermore, from previous empirical studies, the findings regarding the direction and strength of the correlation between variables are inconclusive. It is conceivable that moderating variables are to blame for the heterogeneity in empirical findings. This study focusses on two possible groups of moderators: a) situational factors (industry type and national culture) and b) measurement factors (sampling area, logistics performance). This leads to the second research question: (How) do situational and measurement-related moderator variables impact on the relationship between supply chain resilience, supply chain integration and supply chain performance?
To answer the above questions, this study uses a theoretical meta-analysis framework of supply chain resilience, supply chain integration, and supply chain performance (SCR-SCI-SCP) and integrates meta-analysis and structural equation modeling.
Review of the literature and research hypothesis
Supply chain resilience and supply chain performance
The disruption of the supply chain caused by the mass protests a sharp oil price rise in Great Britain in September 2000 is an early case of supply chain resilience. Since then, the occurrence of earthquakes, tsunamis, violent terror, and other events have aroused the attention of researchers on supply chain resilience. Scholars have gradually deepened their understanding of the concept of supply chain resilience. In the beginning, scholars recognized that supply chain resilience is a kind of ability of the supply chain to deal with interruption risk. For example, Rice and Caniato [12] propose that supply chain resilience is the ability of enterprises to cope with supply chain interruption caused by natural disasters, political events, terrorist attacks, and other incidents. Subsequently, based on the ability to deal with interruptions, scholars focus on the recovery function and recovery speed of resilience. Martin Christopher defines supply chain resilience with reference to the ability of the supply chain system to recover to the original state or a better state after a disruptive event [13]. On this basis, Ralston and Blackhurst [14] argue that, in some cases, supply chain resilience can be understood as the ability of a company to recover from destructive events within an acceptable time period. Park et al. [15] add the ability to withstand and re-cover from interruptions. At present, many scholars accept that resilience reflects a company’s ability to bounce back to normal operation and sometimes to a more ideal state in the case of interruption [16] because coping with and recovering from an interruption requires restructuring, adjustment, or reconfiguration of the supply chain network [17, 18].
To maintain the stability of operation objectives, the supply chain needs to deal with and respond to the impact of a negative disturbance at a certain moment. Therefore, supply chain resilience not only means recovery from disasters but includes also an active structural exploration of the ability of the supply chain to resist and overcome unforeseen events. Supply chain resilience is a catalyst that can move the core business and the overall supply chain business forward when competition stagnates. Enterprise practice has shown that increasing flexibility, creating redundancy, and improving supply chain agility can enhance supply chain performance [19]. As an important content of supply chain management, supply chain performance not only includes product performance such as quality, cost, service, and reliability but al-so the ability to respond to demand changes and unforeseen disruptive events, which is the overall operational efficiency of the supply chain [20]. Consequently, the following hypothesis is proposed in this study:
Mediating variable
Supply chain integration has been widely regarded as one of the key practices in the field of improving the performance of supply chain management. The core idea of logistics lies in process optimization and resource integration, while supply chain management is equivalent to extending the idea of integration to upstream suppliers and downstream customers. Thus, supply chain integration naturally becomes a key variable to measure the level of supply chain operation. However, different scholars have different understandings of what supply chain integration implies. From the perspective of flow theory, supply chain integration is an efficient sharing behavior of logistics, information flow, and capital flow [21, 22]. From the perspective of relationship networks, it is found that these flows form an interactive network between core enterprises and member enterprises and become the key to organizational coordination and high-level coordination [23]. Therefore, we believe that supply chain integration is a state or strategic measure for core enterprises to collaborate with up-stream and downstream firms at a strategic level based on internal process integration. Through cross-organizational process management to achieve effective and low-cost flow of products, services, funds, information, and decision-making to add value for itself and customers.
Previous literature investigates the relationship between supply chain resilience and supply chain integration and finds that supply chain resilience has a positive impact on supply chain integration. Fayezi et al. [24] find that the integration of internal and external (customers and suppliers) benefits from the establishment of resilience in the enterprise supply chain. Supply chain resilience is marked as a strategic capability that enables enterprises to quickly respond to and deal with internal and external uncertainties through effective supply chain integration, that quickly turns challenges and changes into opportunities, and that creates sustainable success for enterprises [25]. Moreover, supply chain resilience is also an indicator of supply chain responsiveness as it determines the speed at which an organization responds to external activities, rather than the capability and performance of the supply chain itself, which is often driven by internal factors [26, 27]. As the economy changes and trade dependence increases, the partner network formed by companies with resilient supply chains becomes more agile [24] to respond to market contingencies and disruptive risks. Companies can assess external changes and their environment, form mutually beneficial alliances with stakeholders, customers, and suppliers, and respond to change faster than their competitors to gain a competitive advantage in the new environment. Flynn et al. [28] divide supply chain integration into three dimensions: supplier integration, internal integration, and customer integration. Supplier integration refers to the effective collaborative operation between key suppliers and enterprises in strategic decision-making, activity planning, program execution, and other aspects [29]. Internal integration refers to the integration of sup-ply chain activities within an organization [30], which is the logical extension of the thought of logistics integration and the logical starting point of supplier and customer integration [31]. Customer integration refers to an accurate assessment of customer needs by sharing information with key customers to optimize customer services. Consequently, the following hypotheses are proposed in this study:
Several practices have shown that supply chain integration can greatly reduce the “bullwhip effect”, reduce inventory, and improve operational performance. As mentioned above, supply chain integration has multiple dimensions and different impacts on supply chain performance. First, in terms of supplier integration, although some studies find that supplier integration has no significant impact on enterprise financial performance and operational performance, most studies shows that supplier integration can improve information resource sharing between enterprises and sup-pliers, improve the enterprise production process, reduce production cost, and im-prove the flexibility of enterprise production [32, 33]. Second, some scholars point out that although customer integration focuses on the interaction between enterprises and customers, it has no significant impact on enterprises’ operational performance such as production cost and inventory turnover [22]. Based on the review of the existing literature, this study argues that from the perspective of a larger sample across space and time, the integration of supply chain dimensions appears to be more conducive to im-proving supply chain performance. Based on this, the following hypotheses are proposed:
Potential moderating variable
With the help of a meta-analysis method, this study explores the relationship be-tween supply chain resilience, supply chain integration, and supply chain performance based on a large sample across space and time. The study further discusses potential moderating effects of relevant variables, including situational factors (industry type, national culture) and measurement factors (sampling area, logistics performance), respectively.
Industry type
Enterprises in different industries have different types and quantities of resources. Manufacturing enterprises have rich resources, and it is easier to obtain various capabilities required by resource integration to promote supply chain integration. The COMAC C919, for example, has major components from AVIC, engines from CFM (a joint venture between GE and Safran), communications and navigation systems from Rockwell Collins, a wheel brake system from Honeywell, landing gear system from Liebherr, aluminum fuselage from Arconic and flight data recording system from General Electric. Apart from these, there are more than a million differ73ent parts that require huge and precise resource integration capabilities. Compared with other industries such as the service industry, the supply chain with manufacturing enterprises at the core has higher requirements on flexibility and higher requirements for fast and effective risk management.
National culture
The culture of the country where the core enterprise of the supply chain is located may exert an influence. In different cultural contexts the impacts of the resilience of the enterprise supply chain and the integration of the supply chain on the performance of the supply chain can vary, resulting in diverging findings about their relationships across studies. The power distance index (PDI) is an important evaluation index in Hofstede’s definition of national culture. Power distance refers to the degree to which members of institutions and organizations with less power expect and accept unequal power distribution in a country [34]. Hofstede points out that companies in countries with higher power distance attach more importance to coordination and cooperation. Therefore, enterprises from countries with a higher power distance may have a stronger effect on implementing supply chain integration, and such a willingness will urge enterprises to actively acquire the capabilities required by supply chain integration. Moreover, the higher the power distance is, the better the organizational relationship between enterprises can be established with mutual trust, thus reducing the coordination cost in the process of supply chain integration, and improving the overall performance of the supply chain [29]. This study distinguishes between countries with low- and high-level power distance using the median value of PDI as the demarcation line [35].
Sample area
Companies in countries or regions with different levels of economic development have different kinds of governance of the supply chain [36]. Some scholars point out that enterprises in developing countries benefit more from supply chain integration by comparing enterprises in developed and developing countries [37]. A possible reason is that the supply chain system of developed countries is relatively complete and supply chain resilience and supply chain integration demand are the icing on the cake for them, while the supply chain of developing countries is not sound enough and market efficiency generally is low, so it is beneficial to these companies to be a latecomer. Which gives rise to the advantage of supply chain backwardness due to the broad space.
Logistics performance
The Logistics Performance Index (LPI), published by the World Bank, evaluates the level of logistics development in various countries. The index is first published in 2007 and has been published every two years since 2010. The latest available issue is for the year 2018. Measured by a 5-point system, the higher the score, the higher the logistics performance level [38]. We adopt the average value of the total logistics performance index in 2018 as the standard and countries with higher than the average value are defined as countries with a high logistics performance index. Countries with lower logistics performance tend to have incomplete infrastructure and imperfect market mechanisms, and the impact of supply chain resilience on supply chain performance may be amplified.
Against this background, the following hypothesis is derived:
To sum up, the conceptual model of this study is shown in Fig. 1.
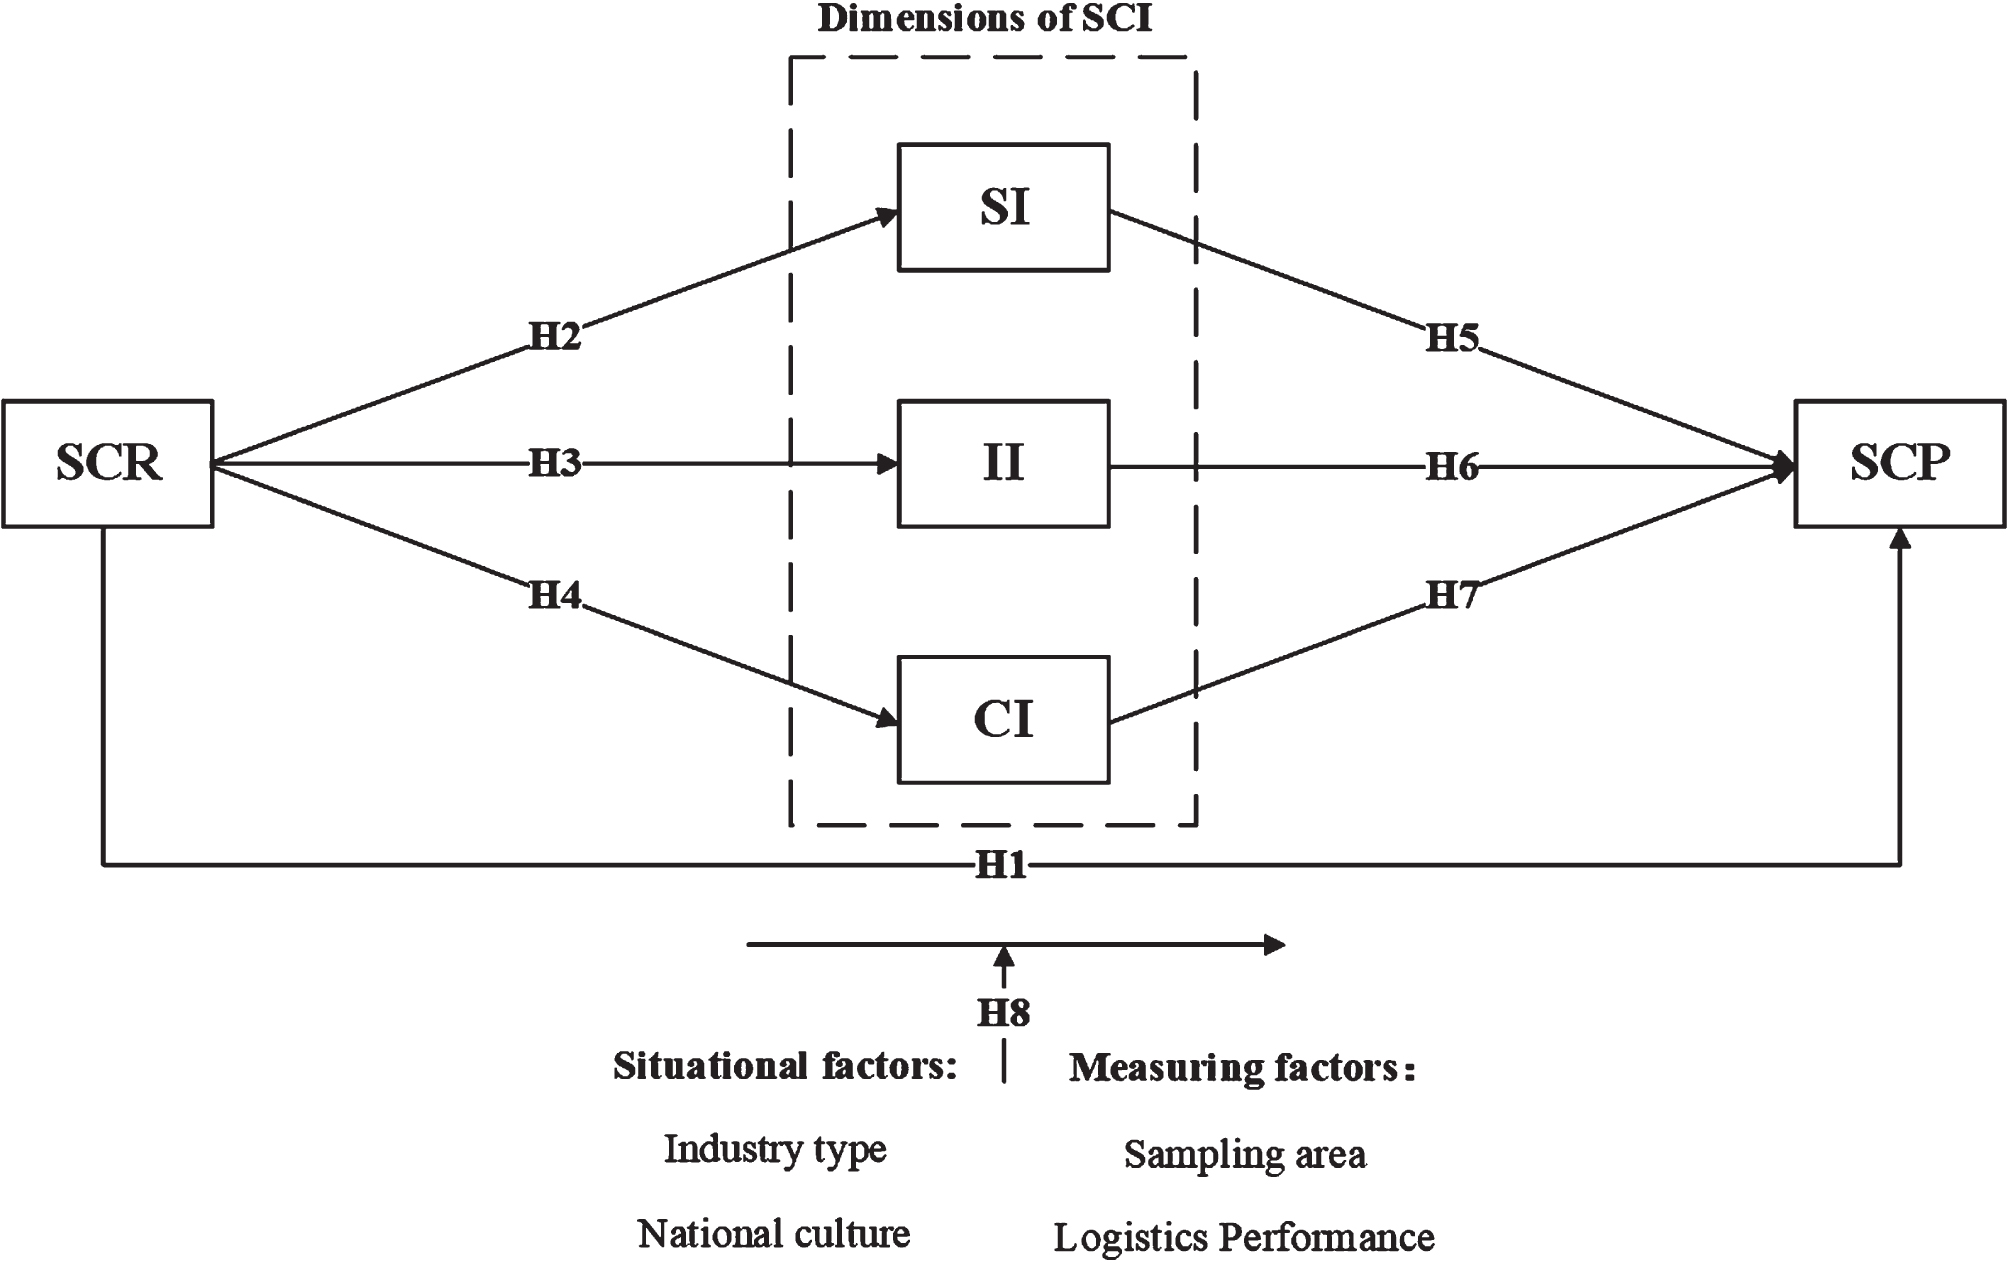
Research conceptual model. Notes: SCR = supply chain resilience; SCP = supply chain performance; SCI = supply chain integration; SI = supplier integration; II = internal integration; CI = customer integration.
Research method
The MASEM method is used in this study mainly considering the complementary advantages of meta-analysis and the structural equation model. First, the existing related studies are included in the meta-analysis to overcome the sampling limitation and measurement error of a single empirical study and improve the robustness of the study [39], which avoids the shortcoming of the SEM study lacking repeated verification due to the one-time data analysis. Secondly, meta-analysis can only study the relationship between two variables, but not multivariable research, while SEM can study the relationship between complex multivariate models. The MASEM method combines the advantages of META repeated validation and of SEM multivariate analysis. MASEM calculates the average sample weighted correlation matrix based to estimate the average correlation of the overall model, it uses previous studies for meta-analysis, and it subjects the results to multivariate analysis [40], and, therefore, establishes a more complex model. In addition, the model is controlled (model fitting degree is provided), which to a large extent overcomes the difficulty of merging studies in different fields and avoids the lack of external validity of research conclusions due to the limitations of research design and research scenarios.
Sample collection and variable coding
According to Yu et al. [41], the searching process was done through a three-stage process. Figure 2 sketches the process of literature selection.
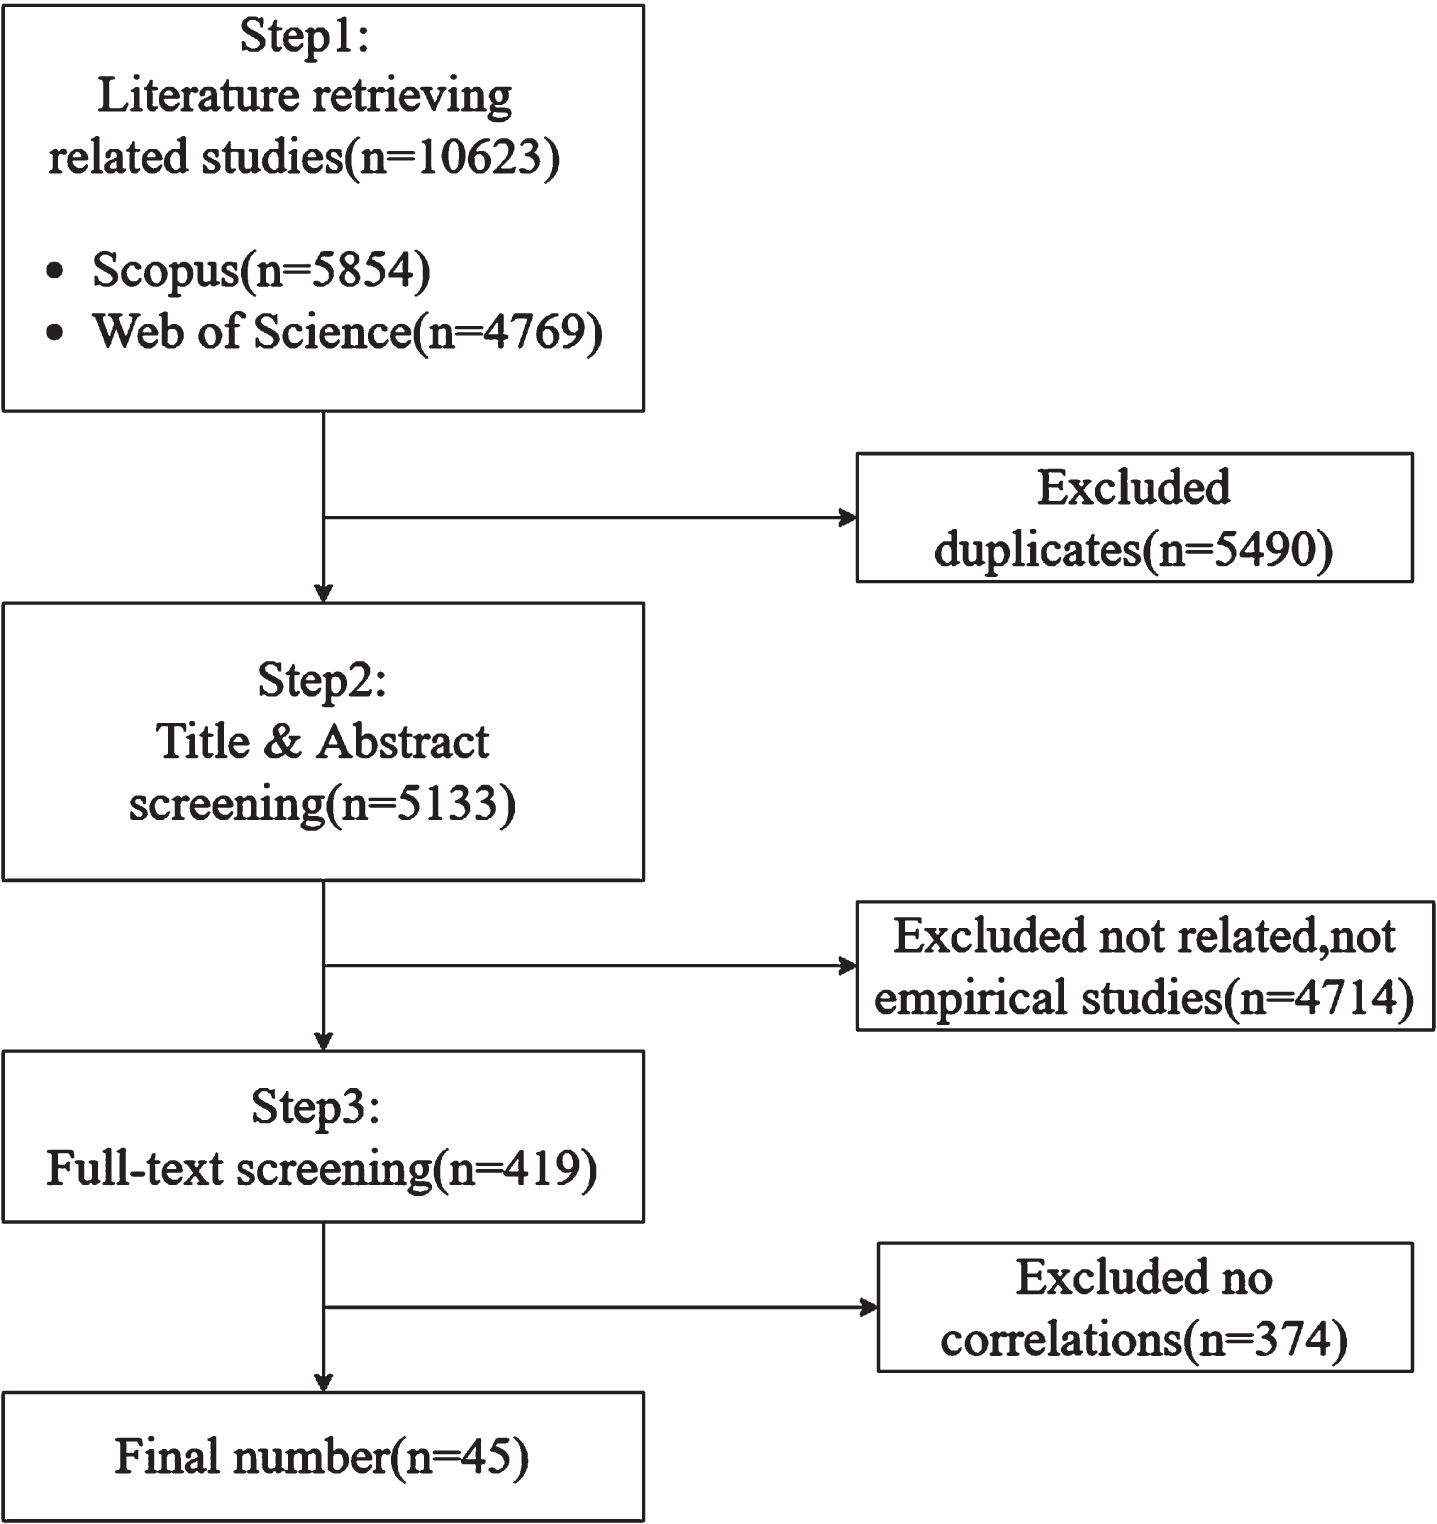
Literature screening process.
The first step was to conduct a literature search. In this study, the Web of Science and the SCOPUS database were searched with supply chain resilience, supply chain performance, supply chain integration, supplier integration, internal integration, and customer integration retrieved as keywords. At the same time, these terms were grouped for retrieval using Boolean logic. To avoid omission, as many relevant studies as possible were covered and references to reviews and related articles manually searched. The literature retrieval of this study was completed on 31st of May 2021.
In the retrieval process of articles, the literature is first screened to check whether the title and abstract meet the specific requirements. The criteria for inclusion in the MASEM study are (1) empirical papers using survey data or secondary data; (2) the study reports the correlation of at least one of SCR, SCI (including all dimensions), SCP and other variables or other indicators that could be converted into effect size; (3) the samples between studies are independent. If two studies have duplicate samples, the more detailed study is selected; (4) the object of the research is an enterprise; (5) the article informs about the sample size; (6) the article is published in English in a peer-reviewed academic journal. In the first step, 10623 papers were retrieved and 5490 duplicates excluded.
The second step was title and abstract screening(n = 5133), where two researchers excluded nonempirical studies. In the last step, by browsing the full texts of the screened articles(n = 419), authors eliminated the articles of pure theories, reviews, and the articles without related data (no first order correlation coefficient r) or with data that could not be converted to r. Thus, a total of 45 articles were included in the meta-analysis. The journal of these articles can be found in Appendix A. In the selected articles, 78% are distributed in the SCI Q1/Q2 journals, and the average journal impact factor is 6.579.
To improve accuracy and to reduce coding errors, the first author of this paper first compiled the coding manual. Authors of this study agreed on the definition of each dimension/variable before coding the literature. Then, two other researchers did the back-to-back coding. Each separate empirical study was considered as a coding unit. If the multiple effect values in the same article were from different sample populations, they were coded multiple times. Authors coded independently and discussed and solved the ambiguity generated in the process of coding. Specifically, the documents included in the meta-analysis are coded as follows: Literature information (author name and literature publication time), sample size, output results, correlation statistics (correlation coefficient r between variables or other statistics that can be converted into correlation coefficient and Cronbach’s alpha), industry type, national culture, sampling region, logistics performance, data source, etc. The correlation coefficient r of the effect size in the literature is coded as an effect size value for each article as an independent sample. Considering that in many studies, a latent variable often contains multiple measurement sub-dimensions, the mean value method is used to determine a latent variable.
Effect quantity calculation
In this study, the professional software Comprehensive Meta-Analysis (CMA) 3.0 is used for the meta-analysis. The effect size used in this study is the Pearson correlation coefficient.
Model selection and heterogeneity test
In normal meta-analysis, a fixed-effects model or random-effects model are mainly used. Because the samples of selected articles come from different populations, there are great differences among them, and the random-effects model considers that the difference between the effect sizes of initial studies is caused by sampling error and systematic error, so this study chooses the random-effects model for the analysis. Heterogeneity tests are applied to further verify the validity of the random-effects assumption, mainly the Q test, I2 test, and the H test. If there is heterogeneity in the study, a moderating effect should be analyzed. By analyzing and observing coded data, moderating effects of industry type, country culture, sampling region, and logistics performance at different levels are examined.
Publication bias
There may be publication bias when conducting meta-analyses; i.e., in general, papers with significant research results are more likely to be published. Therefore, the existence of publication bias means that the published literature cannot systematically and comprehensively represent the overall situation of completed research in the field [42]. Publication bias can greatly reduce the reliability of meta-analysis results. Increasing the sample size can effectively reduce the influence of publication bias. The publication bias test is conducted during the meta-analysis. In this study, two methods, funnel plot and the fail-safe N test [43] are used for further testing.
Analysis of structural equation models
After meta-analysis, the joint correlation coefficient matrix between variables is obtained and IBM AMOS 24 is used to test the research hypotheses. Considering the different sample sizes of various studies, the sample harmonic mean is chosen as the input sample size [44]. Compared to the arithmetic mean, the harmonic mean endows a large sample with less weight, making parameter estimation more conservative [45]. The harmonic mean of the sample in this study is 2092. The given model is tested by comparing all assumed path relationships, and the mechanism of supply chain integration as a mediator variable on supply chain resilience and supply chain performance is explored and the inconsistencies in the previous literature are reconciled.
Results
Main effects
Data are analyzed according to the above process and the main effect is tested first. The results are shown in Table 1, which reports the number of effect size values, cumulative total sample size, mean effect size, 95% confidence interval, and Failsafe N of the relationship between supply chain resilience, supply chain integration dimensions, and supply chain performance.
Main effect research results
Main effect research results
Note: SCR = supply chain resilience; SCP = supply chain performance; SCI = supply chain integration; SI = supplier integration; II = internal integration; CI = customer integration; K = number of effect size; N = total sample size; r = corrected weighted mean effect size; 95 % CI, LL-UL=the lower and upper limits for the 95% confidence interval ***p<0.001; **p<0.05; *p<0.1.
First, the lower limit of the 95% confidence interval of the corresponding test results of each relational variable is greater than 0, indicating that these effect size values have good reliability. Second, the correlation between supply chain resilience and supply chain performance is investigated. The effect size value equals r = 0.417***, which indicates a significant positive correlation between supply chain resilience and supply chain performance, lending support to hypothesis H1. Third, the relationship between supply chain resilience and various dimensions of supply chain integration is explored in the main effect test, and the mean effect size values isolated are 0.530***, 0.455***, and 0.306**, respectively, indicating that supply chain resilience is significantly positively correlated with all dimensions of supply chain integration. These results are consistent with the validity of hypotheses H2, H3, and H4. The Pearson correlations regarding the relationship between each dimension of supply chain integration and supply chain performance are 0.533***, 0.509***, 0.524***, which indicate that each dimension of supply chain integration is significantly positively correlated with supply chain performance. Hence, hypotheses H5, H6, and H7 receive empirical support. The results show that the correlation between supply chain resilience and supplier integration is the highest (r = 0.530***), while that between supply chain resilience and customer integration is the lowest (r = 0.306**), indicating that the correlations between supply chain resilience and different dimensions of supply chain integration are different. Similarly, the correlation coefficient between supplier integration and supply chain performance is the highest (r = 0.533***), while the correlation coefficient between internal integration and supply chain performance is the lowest (r = 0.509***), which also indicates that the correlations between different dimensions of supply chain integration and supply chain performance are different.
First, funnel plot is used to test the publication bias of the meta-analysis, as shown in Fig. 3. The literature is distributed on both sides of the total effect size which indicates that there is no serious publication bias in the results. To exclude subjective factors, Failsafe N is used for the tests, and the results are shown in Table 1. When the Failsafe N value is greater than 5K+10 (K represents the number of independent samples, that is, the number of effect size values), the larger the value, the more stable the analysis results are and the less likely the research conclusions are to be overturned. When the coefficient of the Fail-Safe N is less than 5K+10, it indicates the existence of publication bias [46]. The results in Table 1 show that the Failsafe N of supply chain resilience and customer integration is the smallest, with a value of 76, which is greater than the corresponding critical value of 25 (i.e., 5*3 + 10), which means that in the case of a significance level of α=0.05, an additional 76 research papers are needed to deny the significant relationship between supply chain resilience and customer integration. The remaining Failsafe N values are also much larger than the corresponding critical values. Therefore, there is no publication bias in this study.

Funnel plot. Note: the x-axis means Fisher’s z value and the y-axis means Standard Error.
As shown in Table 2, the Q test of effect size values of each relational variable is significant (p < 0.05), indicating that all effect size values in the meta-analysis are heterogeneous. I2 ranges between 74.43% to 96.26%, which means that the true variation of the effect size should account for 74.43% to 96.26% of the total variation, which is larger than the value suggested by Higgins [47], who define high heterogeneity with a value > 75%.
Results of the heterogeneity test
Results of the heterogeneity test
Note: SCR = supply chain resilience; SCP = supply chain performance; SCI = supply chain integration; SI = supplier integration; II = internal integration; CI = customer integration; K = number of effect size; Q = test for estimating the heterogeneity; df(Q)=Q statistics degree of freedom; p = Q statistics p-value; I2 = percentage of variation in the effect sizes.
The results of the heterogeneity test indicate that the effect size values of all studies have high heterogeneity. This study further tests the moderating effects of the industry type, national culture, sampling region, and logistics performance on the relationship between variables. Results are shown in Table 3. Notably, to ensure the representativeness of the meta-analysis results, after grouping the moderating effects of the variable relationships, if the number of any group of effect size values K < 2, the moderating effects of the variable relationship will not be analyzed.
Results of moderator analysis
Results of moderator analysis
Note: SCR = supply chain resilience; SCP = supply chain performance; SCI = supply chain integration; SI = supplier integration; II = internal integration; CI = customer integration; K = number of effect size; r = corrected weighted mean effect size; 95 % CI, LL-UL=the lower and upper limits for the 95% confidence interval; Q-value=between group test of homogeneity; p = p value of the Q statistics. ***p<0.001; **p<0.05; *p<0.1.
Table 3 implies (1) that there are significant differences in the effect size relationship between different types of industries (Q = 6.462, p = 0.011). There is a significant positive correlation between internal integration and supply chain performance in the manufacturing industry (r = 0.431, P = 0.000), but the correlation coefficient is higher in the non-manufacturing industry (r = 0.616, P = 0.000); (2) From supply chain resilience to supply chain performance and internal integration (Q = 3.736, P = 0.154; Q = 0.098, P = 0.755), supplier integration and customer integration on supply chain performance (Q = 0.818, P = 0.366; Q = 0.006, P = 0.938), different types of industry do not have a significant moderating effect on the relationship between the two pairs of variables.
Furthermore, with regard to the moderating effect of national culture (high power distance index vs. low power distance index) on the relationship between supply chain integration and its causation and consequence Table 3 shows: (1) From the perspective of the effects of supply chain resilience, supplier integration, and internal integration on supply chain performance, different types of national cultural context do not have a significant moderating effect on their relationship (Q = 0.087, P = 0.768; Q = 0.275, p = 0.600; Q = 0.252, P = 0.616); (2) From the perspective of the effect of customer integration on supply chain performance, there are significant differences in the relationship between customer integration and supply chain performance in different types of national cultural situations (Q = 15.238, P = 0.000). In the low power distance context (r = 0.632, P = 0.000), the relationship was stronger than in the high-power distance context (r = 0.335, P = 0.000).
Third, with regard to the moderating effect of the sampling region (developed country vs. developing country) on the relationship between supply chain integration and its causation and consequence Table 3 shows: (1) From the perspective of the effects of supply chain resilience on supply chain performance, at 1% significant level, different sampling area have a significant moderating effect on this relationship (Q = 2.945, P = 0.086), suggesting there is a significant positive correlation between supply chain resilience and supply chain performance in the developing country (r = 0.457, P = 0.000), but the correlation is higher in the developed country (r = 0.242, P = 0.060). (2) From the relationship of supply chain resilience and supplier integration (Q = 0.000, P = 0.995), and the relationship between supplier integration, internal integration and customer integration and supply chain performance (Q = 0.027, P = 0.869; Q = 0.001, P = 0.978; Q = 0.392, P = 0.531), the sampling region at different levels does not have a significant moderating effect on the relationship between the two pairs of variables that can be analyzed.
Forth, with regard to the moderating effect of the logistic performance (high LPI vs. low LPI) on the relationship between supply chain integration and its causation and consequence Table 3 shows: (1) From the effect of supply chain resilience and internal integration, at 5% significant level there are significant differences in the effect size relationship between different logistic performance (Q = 9.567, p = 0.002), suggesting there is a significant positive correlation between supply chain resilience and internal integration in the high LPI (r = 0.304, P = 000), but the correlation coefficient is higher in the low LPI (r = 0.583, P = 0.000). (2) From the moderating effect of customer integration on supply chain performance (Q = 11.350, P = 0.001). Low logistic performance (r = 0.696, P = 0.000) had a stronger effect than high logistic performance (r = 0.406, P = 0.000). (3) From the relationship of supply chain resilience on supply chain performance (Q = 1.232, P = 0.267), and the relationship between supplier integration, internal integration on supply chain performance (Q = 1.822, P = 0.177; Q = 0.050, P = 0.823), the sampling region at different levels does not have a significant moderating effect on the relationship between the two pairs of variables that can be analyzed.
This paper also tests the hypothesis of the path relationship between supply chain resilience –supply chain integration –supply chain performance (SCR –SCI –SCP). To obtain robust test results, a structural equation model is used to test the hypotheses simultaneously. Considering that the sample size of the meta-analysis model is large and the chi-square difference value would swell due to data violation of multivariate normal, leading to poor model fitting, the Bollen-Stine p-value correction (1993) is adopted for verification. Based on a bootstrap with 5000 repetitions the Chi-square value estimated by the Bollen-Stine p-value drops to 2.045 (chi-square difference value of the original model is 3694.564), and the degree of fit of the model met the basic requirement which are: chi2 / df = 1.023 (<3), RMSEA = 0.003 (<0.08), RFI = 0.997 (>0.95), NFI = 0.999 (0.95)>, CFI = 0.999 (0.95)>, Hoelter (0.05) N = 2216.276 (>200). All hypotheses pass the test, as shown in Table 4.
Analysis of the mediating effect of three factors
Analysis of the mediating effect of three factors
Note: SCR = supply chain resilience; SCP = supply chain performance; SCI = supply chain integration; SI = supplier integration; II = internal integration; CI = customer integration; SE = standard error; z-value=z statistics; 95 % CI, LL-UL=the lower and upper limits for the 95% confidence interval.
According to the research hypotheses, the three-factor non-causal mediation model (Fig. 4) is verified, as shown in Table 4. Internal integration II, supplier integration SI, and customer integration CI all have specific indirect effects, with point estimates of 0.096, 0.106, and 0.08, respectively, and total indirect effects of 0.282. The bootstrap method is used 5000 times (Monte Carlo simulation is performed due to the lack of original sample data in meta-analysis). B-C method and the percentile method are used to test significance within 95% confidence interval, respectively. The upper and lower intervals are found to not include 0, indicating a significant indirect effect. The direct effect point estimate value is 0.135 and its confidence interval does not include 0, indicating that the direct effect is significant. Therefore, from SCR to SCP, there is a partial mediating effect of the three factors of SCI. By further pair-comparing the mediating effect differences of internal integration, supplier integration, and customer integration (II-SI, II-CI, and SI-CI), it is found that the confidence intervals all include 0, which implies that there is no significant difference between the three factors.
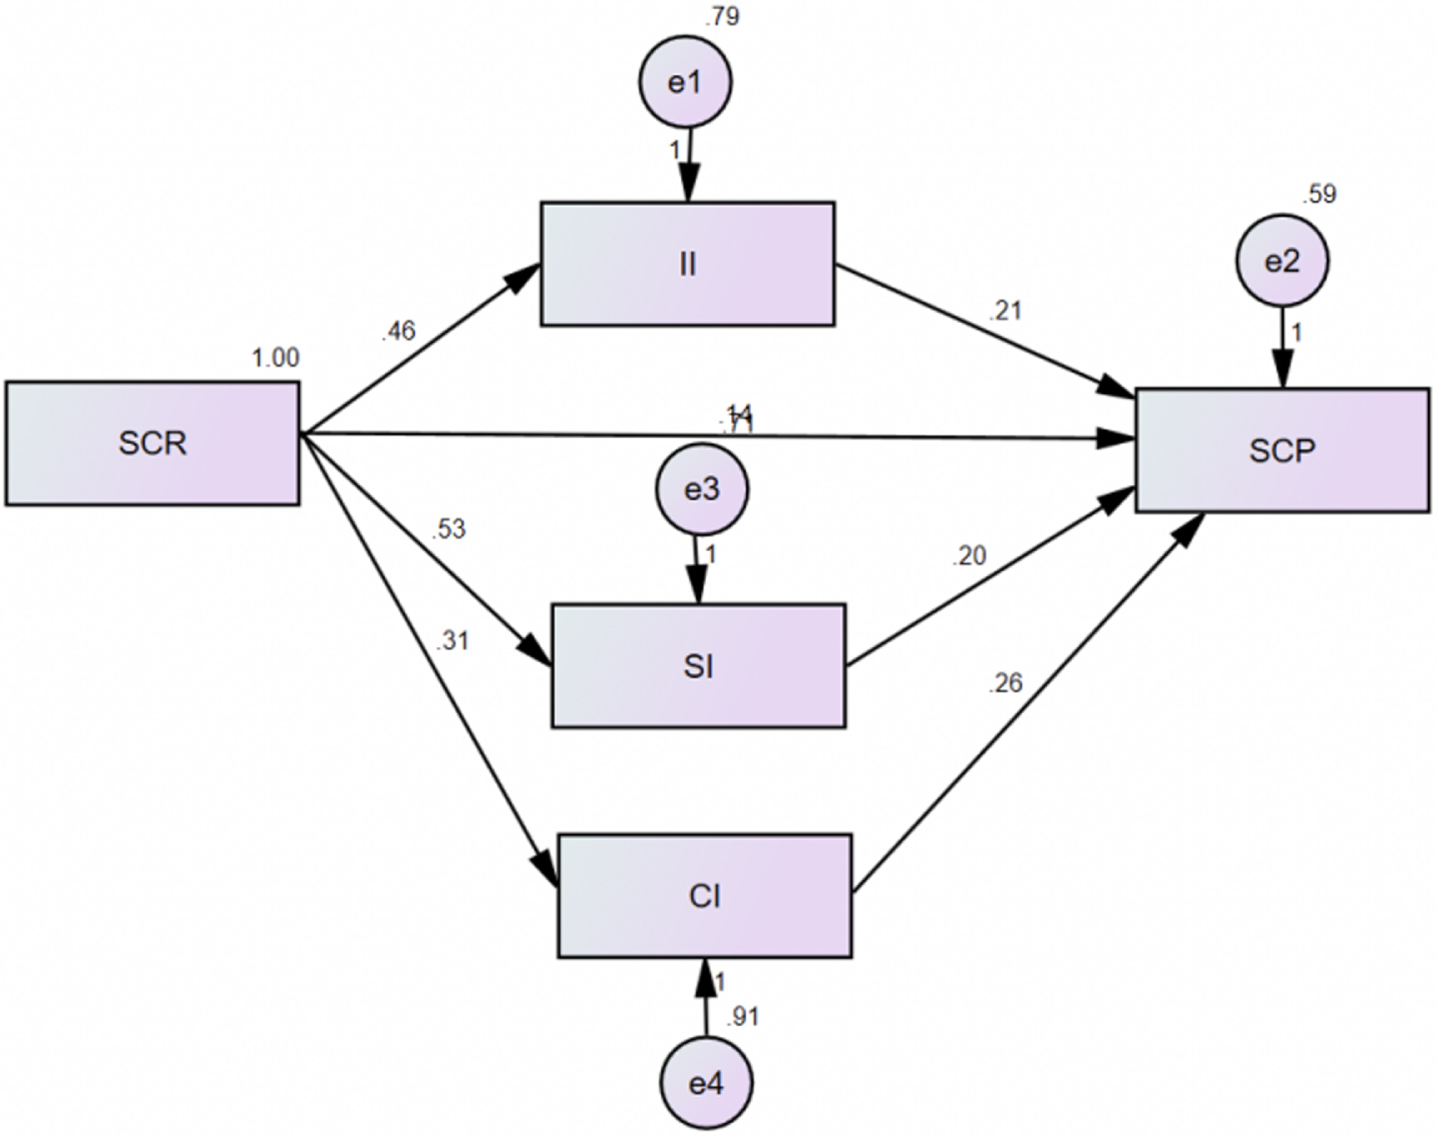
SCI three-factor non-causal mediation model. Note: SCR = supply chain resilience; SCP = supply chain performance; SCI = supply chain integration; SI = supplier integration; II = internal integration; CI = customer integration.
Summary of findings
In this study, meta-analysis and structural equation model are used to comprehensively analyze the existing empirical research on supply chain resilience, supply chain integration, and supply chain performance, which is not only a useful summary of previous literature but should also promote further research on supply chain resilience, supply chain integration and supply chain performance. The aim of this study is to expand the existing understanding of the relationship between supply chain resilience, supply chain integration, and supply chain performance, and to examine the correlation between each dimension. To the best of our knowledge, very few prior attempts have been undertaken to statistically aggregate current findings despite the substantial quantity of empirical evidence in the supply chain resilience field. To enhance present theory in the supply chain resilience area, a new theoretical framework for resilience is proposed. In total, 45 empirical studies (73 effect size data, 2092 samples) are selected from 10,623 papers published over the years 2013 to 2021 to explore the transmission mechanisms, the role of mediator variable, and boundary conditions of the relationship between supply chain resilience and supply chain performance. Firstly, we examined meta-analytical the relationship between supply chain resilience, supply chain integration, and supply chain performance to have a better understanding of the impact resilience can have on supply chain integration, and supply chain performance. Secondly, we also investigated different moderating effects of: industry type, national culture, sampling area, and logistics performance to explain some of the observed variability in results. Finally, the mediating effect of the dimensions of supply chain integration on supply chain resilience and supply chain performance is further explored.
First, supply chain resilience is significantly positively correlated with supply chain performance. We thus respond to the calls by Siagian et al. [8], Mandal et al. [10], Belhadi et al. [48], and Gu et al. [49] to empirically validate the relationship between supply chain resilience and supply chain performance. By increasing trust, cooperation, and commitment, enterprises can increase adaptability of their supply chains, reduce environmental uncertainty, and enhance resilience, which, in turn, improves supply chain performance. For example, when a company can respond to any changes in customer needs, such as new product varieties, volume fluctuations, and time constraints, customers may pay a premium and become loyal customers. As noted above, the current COVID-19 pandemic has created great uncertainty in all areas of business. Enterprises must respond to sudden changes in customer needs, quickly solve production problems, and improve customer satisfaction. A resilient supply chain to cope with any uncertainty is key to enterprise survival.
Second, supply chain resilience has a significant positive relationship with all dimensions of supply chain integration. When a company shares complete product information and production plans with internal cross-functional and external partners, it increases the flexibility of the company, while supply chain integration improves supply chain resilience by easily responding to unexpected changes. This finding is in line with previous studies validating the relationship between supply chain resilience and supply chain integration [50, 51]. Integration with partners enables companies to coordinate and share information as market needs change. When information systems are integrated both internally and externally, it enables all parties to respond to changes in production schedules and material requirements as well as order execution. Information sharing and coordination among all parties enable the supply chain to respond quickly to changes in demand. As Oh et al. point out if the supply chain has successfully accomplished internal integration on information exchange and collaboration amongst external integration, the organization can access real-time information about supply chain operations upstream and downstream. Participants cannot notice demand changes induced by contingencies downstream without exchanging supply chain information, which may result in a whip effect resulting in duplicate inventory and excessive expenditures.
Besides, there is also a significant positive correlation between the dimensions of supply chain integration and the performance of the supply chain. External integration appears more effective than internal integration for improving supply chain performance, which is consistent with Jajja et al.’ study [52]. We advocate for further research on the influence of external integration on performance, recognizing that businesses are increasingly reliant on resources situated outside their own borders. From the perspective of external integration, supplier integration can reduce the coordination cost and improve its flexibility in the process of enterprise production and operation and allows to establish a scientific and reasonable production plan to maximize economic profits. At the same time, customer integration can promote the close relationship between partners, improve the accuracy of enterprises to obtain market information and produce more accurate products in line with customer needs. Especially in the social environment of increasingly stringent customer demands and increasing competitive pressure, enterprises should pay more attention to the communication and interaction with external market entities in practice, and timely track and grasp the changes in market supply and demand. However, from the perspective of internal integration, the internal integration of the enterprise is the prerequisite for the implementation of external integration. By optimizing internal core business processes through mergers and reorganization, enterprises can quickly locate key suppliers and dealers, which will have a positive effect on the implementation of external integration and operational performance of enterprises [53].
Third, the results are heterogeneous due to different situational and measurement factors: industry type, national culture, sampling area, and logistics performance. There are significant differences among manufacturing and non-manufacturing industry regarding the relationship between supply chain internal integration and supply chain performance. Compared with the manufacturing industry, non-manufacturing enterprises can achieve more significant performance improvement through supply chain internal integration which is consistent with Iftikhar et al.’s study [54]. This shows that the implementation of supply chain internal integration in non-manufacturing enterprises is more maneuverable. Take, for example, services, which are now dominant in most advanced economies and are a growing share in China. The rapid development of the Internet economy makes the implementation of supply chain integration more efficient. There are significant differences among national culture regarding the relationship between supply chain customer integration and supply chain performance. Compared with high power distance countries, supply chain resilience in low power distance countries has a more significant impact on customer integration on supply chain performance. Resilience requires a more flexible supply chain and an improved ability to respond quickly to disruptions, but the supply chain integration process can hinder this ability. For example, when an enterprise needs to establish connections with new suppliers to cope with a crisis, a high degree of supplier integration will hinder the enterprise’s ability to cooperate with new suppliers. According to the risk normality theory of Perrow [55], the integration will lead to the increase of enterprise dependence. The higher the integration capability of the supply chain, the more risks in one link will affect other links in the chain. This means that the integrated supply chain itself may have higher exposure. Integration can tie up capital and reduce the flexibility of supply chains to respond to change. Therefore, integration may also reduce supply chain performance in a certain period and scope. There are significant differences among developed and developing countries regarding the relationship between supply chain resilience and supply chain performance. Compared to developed countries, supply chain resilience in developing countries improves supply chain performance more clearly. This may be because factors such as low logistic level and backward infrastructure in developing countries are not only disadvantages but also stimulate the enthusiasm of companies to implement supply chain flexibility. As Piprani et al. [56] argued that resilience capability is especially crucial for enterprises in emerging economies. It enables businesses to successfully handle disruptions while continuing to supply clients with the expected services and goods. Natural disasters, product counterfeiting, political instability, including dissension from many factions, corruption, transportation infrastructure, and other unethical commercial practices are common in this region of the world [57]. There are significant differences between high and low LPI in terms of the relationship between supply chain resilience and internal integration as well as customer integration and supply chain performance. Companies in countries with low logistics performance can improve their performance more clearly through supplier integration and customer integration. Although the logistics level is low, these enterprises have obvious advantages of being a latecomer. Furthermore, the government will also provide relevant policy support to encourage companies to actively implement supply chain integration. Enterprises in countries with high logistics performance already have rich theoretical and practical experience, so it is highly possible to achieve the effect of high logistics performance in countries with low learning costs.
Finally, our study also find that supply chain integration plays a partial mediating effect role in the relationship between supply chain resilience and supply chain performance, and there is no significant difference between the three factors of supplier integration, internal integration, and customer integration. Our argument, congruent with the literature, suggests that supply chain performance can be enhanced by supply chain resilience [11, 13] and intra- and interorganizational integrative and collaborative practices are means to build such supply chains [50]. Our study finds that firms improving supply chain resilience to achieve supply chain performance objectives through enhanced integration with key suppliers and customers. Therefore, the appropriate degree of integration and collaboration is a core catalyst for better performance in the supply chain context.
Practical implications
This research findings convey the following practical implications:
Enterprises should actively improve supply chain flexibility, and at the same time through internal and external supply chain integration, improve supply chain performance.
Firstly, managers need to harness the suitable integrated technologies to meet rising expectations for supply chain resilience, without sacrificing efficiency. IoT, Blockchain, and AI, for example, can be combined to help supply chain operators track exactly where products are, predict where and when various goods will be needed, and tack smoothly to unexpected shifts. Harnessing the value of quality data and executing across the supply chain with digital precision are fundamental to succeed in today’s world and to truly leverage supply chain as a competitive differentiator. The journey down this path must be a shared journey between customer and supply partners.
Secondly, supply chain operators can localize inventory and employ last-mile providers to integrate internal and external forces. Those with a significant infrastructure of brick-and-mortar stores and distribution centers will explore shifting inventory forward to local delivery hubs, while using gig economy providers such as Door Dash, Roadie, Shipt, or Walmart GoLocal for last-mile delivery. Such a strategy can help build supply chain resilience and reduce overall costs. The supply chain disruptions of the past several years have left companies more willing than ever to outsource management of their logistics, which they deem a drag on their primary operations.
Thirdly, a control-tower solution that covers the entire supply chain (plan, source, make, deliver, service) is essential to enhance the supply chain resilience and performance. The big thing that companies are smart in getting right about control towers is taking the time to understand their market segmentation and identify the right partners. The expansion of logistics management capability into end-to-end supply chain visibility and control will remain strong, which is manifested by the recent E2open acquisition of BluJay Solutions. The combination is expected to create an independent SaaS-based supply chain integrated platform spanning supply chain planning and execution, enhancing supply chain resilience and performance.
Limitations
First, when retrieving relevant academic literature at home and abroad, only literature reporting relevant effect sizes can be included in the analysis. Hence the number of studies included in the analysis is limited. Second, although as much relevant literature as possible is collected in the retrieval process, there may still be omissions. Third, due to the limitations of the number of studies and meta-analysis techniques, this study only explains the differences in existing research results from four aspects: industry type, national culture, sampling area, and logistics performance. There may still be other moderating variables that have an impact, which are worth to study further.
Footnotes
Appendix
The journal of publications distribution Note: The impact factors in the table are the latest data for 2020.
Journal
N
Proportion(%)
IF
JCR
International Journal of Production Economics
11
24.44
7.885
Q1
Annals of Operations Research
2
4.44
4.854
Q1
Management Decision
2
4.44
4.957
Q2
Journal of Cleaner Production
2
4.44
9.297
Q1
Journal of Enterprise Information Management
2
4.44
5.396
Q1
International Journal of Production Research
2
4.44
8.568
Q1
Transportation Research Part A
2
4.44
5.594
Q1
Supply Chain Management: An International Journal
2
4.44
9.012
Q1
Technological Forecasting &Social Change
2
4.44
8.593
Q1
Production Planning &Control
1
2.22
7.044
Q1
International Journal of Information Systems and Supply Chain Management
1
2.22
NA
NA
sustainability
1
2.22
3.251
Q2
Industrial Marketing Management
1
2.22
6.960
Q1
Applied Sciences
1
2.22
2.679
Q3
Business Process Management Journal
1
2.22
3.464
Q3
Benchmarking: An International Journal
1
2.22
NA
NA
Management of Environmental Quality: An International Journal
1
2.22
NA
NA
Total Quality Management &Business Excellence
1
2.22
3.824
Q3
Journal of Purchasing and Supply Management
1
2.22
5.500
Q2
Technovation
1
2.22
6.606
Q1
International Journal of Emerging Markets
1
2.22
2.488
Q3
Australasian Journal of Information Systems
1
2.22
NA
NA
European Journal of Operational Research
1
2.22
5.334
Q1
Cogent Business &Management
1
2.22
NA
NA
Industrial Management &Data Systems
1
2.22
4.224
Q2
Modern Supply Chain Research and Applications
1
2.22
NA
NA
International Business Review
1
2.22
5.915
Q2