
Abstract
The issue of how to fully utilize natural daylighting of public buildings is one of the greatest practical objectives for lighting savings. The rapid and accurate prediction of the daylighting coefficient at the early design stage can provide a quantitative basis for energy-saving optimization. However, it is not comprehensive to determine the design parameters according to experience. The key problem that is still facing designers is the interoperability between building modeling and energy simulation tools. In this paper, an integrated approach using a dataset created by building information modeling and artificial neural network technology is developed for the fast optimal daylight factor prediction of large public spaces at the early design stage. According to this approach, the value of daylight factors is calculated for different windowsill heights, window heights and widths by Autodesk® Revit and Ecotect Analysis to form a dataset. With this dataset, an artificial neural network model is established using the backpropagation algorithm to predict the relevant design parameters. With their large interior spaces, the reading areas of the aboveground five floors in Chengdu University of Technology Library are selected to carry out the daylight factor experiment and rapid prediction. A total of 495 groups of experimental data are randomly divided into training and testing sets. The root mean squared errors are below 0.1, which indicates a high regression model fitting. A total of 225,369 groups of prepared data are used in the prediction model to obtain the optimal windowsill height (1.0 m), window height (2.4 m) and window width (2.1 m) for five floors in the case of the maximum daylighting coefficient. Finally, a smartphone app is designed to facilitate daylight factor prediction without any experience in modeling and simulation tools, which is simple and available to realize prediction visualization and historical result analysis.
Keywords
Introduction
Energy construction and operations accounted for 35% of global total final energy consumption and 38% of energy-related CO2 emissions in 2019 [1] and have maintained a stable level since 2018 [2]. The average building energy consumption for 2011–2018 in China was nearly 40% of the national total energy consumption [3]. The role of building energy savings and efficiency improvement in achieving ambitious carbon neutrality goals by 2050 has attracted great attention [4]. It is a common phenomenon that public buildings have high energy consumption and low energy efficiency. Many countries have taken action, including the United Kingdom with its public sector and social housing decarbonization schemes and France with its support of public housing and public buildings.
Compared with residential buildings, the energy consumption found in public buildings is more than twice that of the unit construction area [5]. After a decade of development, public buildings are still responsible for nearly 40% of national building energy consumption in China [6]. Moreover, from the life cycle perspective, construction and operation are responsible for almost all of this energy consumption. For instance, the proportions from 2000 and 2018 in China were 42.77% and 53.20% respectively [3]. Thus, considering the energy savings and emission reduction of public buildings at the early design stage is of great significance to controlling energy consumption during construction and operation.
However, the recommended values of the design parameters are in a wide range, and designers often use the empirical optimum. Even though many models have been conducted in simulations, the key problem of the interoperability between building modeling and energy simulation tools still faces designers at the early design stage. To fully utilize natural daylighting in public building spaces, the current authors attempt to provide a novel rapid prediction approach that offers designers a reference for optimizing the lighting performance of public buildings at the early design stage.
In the current literature, the incorporation of daylighting with architectural and building designs to save building energy consumption has been gaining attention [7]. Natural lighting integrated with artificial lighting control has been recognized as an important and useful strategy in energy-efficient building designs [8]. The proper use of natural lighting can not only reduce energy consumption effectively but also improve indoor visual comfort [7]. In school buildings, natural light provides considerable physiological benefits and improves energy efficiency while reducing the operational energy consumption of buildings. Omar et al. indicated that maximizing the amount of natural lighting and improving its quality is vital [9]. Platon found that appropriate lighting is a key factor for the success of library design as its main functional area is the reading room [10].
The rapid development of building information modeling (BIM) technology has a great influence on architectural design [11], which could help reduce the impact of design alteration for analysis and calculation [12]. As the mainstream software in architectural design, Autodesk® Revit provides designers with higher creation control ability, accuracy and flexibility, through which the complete design process, from the concept model to the construction document, is completed in an intuitive environment. Autodesk® Ecotect is an environment analysis tool that enables designers to directly simulate building performance in the conceptual stage. It includes a variety of detailed analysis functions and has a highly visual and interactive display, which can display the analysis results directly in the context of the building model. Consequently, complex concepts and a wide range of datasets can be communicated in a surprisingly intuitive and effective manner [13].
Revit can interactively import real and effective building data and valuable construction information into Ecotect as DXF, gbXML, and FBX files, as well as other formats. The combination of the two softwares could obtain analysis models of the thermal environment, light environment, acoustic environment, wind environment, and sunlight through visual simulation analysis and calculation, and subsequently calculate the related factors quantitatively [14].
Currently, the coefficient of lighting represents the most widely used metric for the evaluation of natural lighting [15]. Based on local climate data, Sherd et al. used Ecotect to analyze and calculate the sunlight factor and energy demand of a building and compared its lighting environment with and without an atrium to evaluate the overall energy-saving effect of the building [16]. Omar et al. used Ecotect to simulate lighting in the reading area of the library of the Arab Institute of Architecture and Engineering in Beirut [9]. Platon et al. studied the influence of architectural elements that affected the light environment, such as the location and size of windows, to reduce the dependence on artificial lighting and subsequently reduce energy consumption in order to improve the lighting factor [10]. Liu et al. used Ecotect to model the standard floor of a teaching building in a university, where the standard layer light environment was analyzed from the perspective of natural lighting. According to the simulation analysis results, the natural lighting area was increased by increasing the window-to-land ratio (independent variable) in layers [17]. Dabe et al. compared and analyzed daylight illuminance, sunlight autonomy, thermal comfort time, and carpet area window ratio in Ecotect to predict sunlight and thermal comfort [8]. However, overall, the previous work on lighting design requires a lengthy computation time. Most of this research has been realized using building simulation software, which focuses on calculating the daylight factor, observing the variation in the lighting factor, and analyzing the trend of the light environment. These time-consuming studies suffer from this limitation prior to obtaining reliable results.
According to the previous literature, machine learning algorithms have been extensively established for predicting building energy consumption and evaluating building performance [18–20]. Artificial neural networks (ANNs) are the most suitable and promising approaches emerging from the rapid development of deep learning [21–23]. Ahmad et al. proposed an RNN-based EDP model for a one-year large building modeling and simulation in the integrated environment solutions virtual environment with better performance than support vector machine (SVM) and linear regression models [24]. A new combined method based on the clonal selection algorithm (CSA) and ANN was presented for short-term load forecasting (STLF), resulting in an improved forecasting accuracy over other popular techniques [25].
In regard to energy consumption simulation, ANN also has good performance. A robust ANN using a multilayer perceptron model (MLP) was created, trained, and tested for the energy consumption simulation in a building, which showed that the optimization system could mitigate energy consumption by approximately 35% [26]. Li et al. used ANN to propose a universal method for the rapid prediction of the energy consumption of complex building forms at the early design stage and verified its accuracy [16]. In terms of lighting, Katsanou et al. presented a novel ANN-based model for the prediction of internal illuminance and user actions in a working environment. The model could predict user actions under lighting conditions and the corresponding energy consumption [27].
ANNs have the advantages of high accuracy, fast speed, and the ability to deal with complex nonlinear relations among variables. However, ready-made datasets are not available for designers at the early design stage, and the application of machine learning algorithms is greatly limited. Currently, the combination of BIM technology and ANN is crucial. In this paper, the authors proposed a natural lighting analysis method based on BIM and ANN to predict the daylight factor. Relevant data can be calculated quantitatively through BIM software simulation analysis and used as a dataset for ANN prediction models.
One purpose of this study is to discuss the feasibility of the combination of BIM technology and machine learning algorithms in architectural design. The other is to investigate the relationship between the design parameters and the coefficient of natural lighting. Among public buildings, large interior spaces, such as libraries in universities, are more likely than hospitals to rely on natural lighting optimization to save illumination consumption. Therefore, using the reading area in the Chengdu University of Technology Library as an example, a detailed case study is conducted using windowsill heights (WSH), window heights (WH), and window widths (WW) as design parameters. Interestingly, a smartphone app is ultimately designed to facilitate daylight factor prediction without any experience in modeling and simulation tools; the app is simple and available to realize prediction visualization and the historical result analysis. The approach presented in this paper is of great significance for rapid and accurate prediction of daylight factors in public buildings, as well as the improvement of the architectural design scheme at the design stage.
Methodology
The framework of the new approach for the numerical prediction of the daylight factor consists of three modules, namely, the establishment of environmental modeling and calculation of the coefficient of natural lighting, the deep learning for predictive analysis in the ANN model, and the app development, as shown in Fig. 1.

Research framework.
The first module aims to obtain the raw data including the design parameters and the value of daylight factors, through the established environmental simulation model in Ecotect by importing its gbXML file from the Revit model. A simplified daylight model is built in the following three steps.
Selection of indoor design parameters
Previous studies have shown that the natural lighting in a building depends on both internal and external factors [28, 29]. The indoor environment includes the size and position of the windows, the depth and shape of the rooms, and the colors of the internal surfaces [30]. The position of the window can be measured using the windowsill height.
The standard for the daylighting design of buildings (GB 50033–2013) considers the average value of the lighting factor as the key evaluation index of lighting design [31]. These experience formulas are generally obtained by fitting based on a large amount of empirical data. The crucial variables of the natural lighting coefficient can be chosen according to Eqs. (1)-(4).
According to the above formula, ρ j is obtained by taking the weighted average of the interior surface reflection ratios of the ceiling, wall, ground, and glass window (ρ i ). The value of A c is related to the size of the window and decides A z . It can be inferred that the size of the window and the reflection ratios of the ceiling, wall, ground, and glass window are critical factors that affect flank daylighting. The dimension of the window can be further inferred to the height and width of the window. Therefore, seven architectural design parameters that have an impact on indoor lighting are selected, namely, windowsill height, window height, window width, and the reflection ratios of the ceiling, wall, floor, and glass window. The range of standard reflection ratios of the ceiling, the wall, the floor, the glass window, the windowsill height, and the ratio of window to the floor are listed in Table 1 [31–33].
Relevant standards
Different public buildings have different shapes but have large spaces in common. A schematic model is needed to simplify the process of daylighting simulation in Ecotect, as shown in Fig. 2. The shape of the building could be simplified to a cuboid in the model to manifest seven parameters in the design of buildings. Where H represents the windowsill height, WW represents the window width, and WH represents the window height. In the case of grid setting, the height of the working face of the simulated analysis grid was 750 mm, and a computational grid was set every meter on the analysis grid. The exact number of grids depended on the length and width of the building. All calculation points formed a calculation grid. The average value of each analysis surface is used as the result of each output feature.
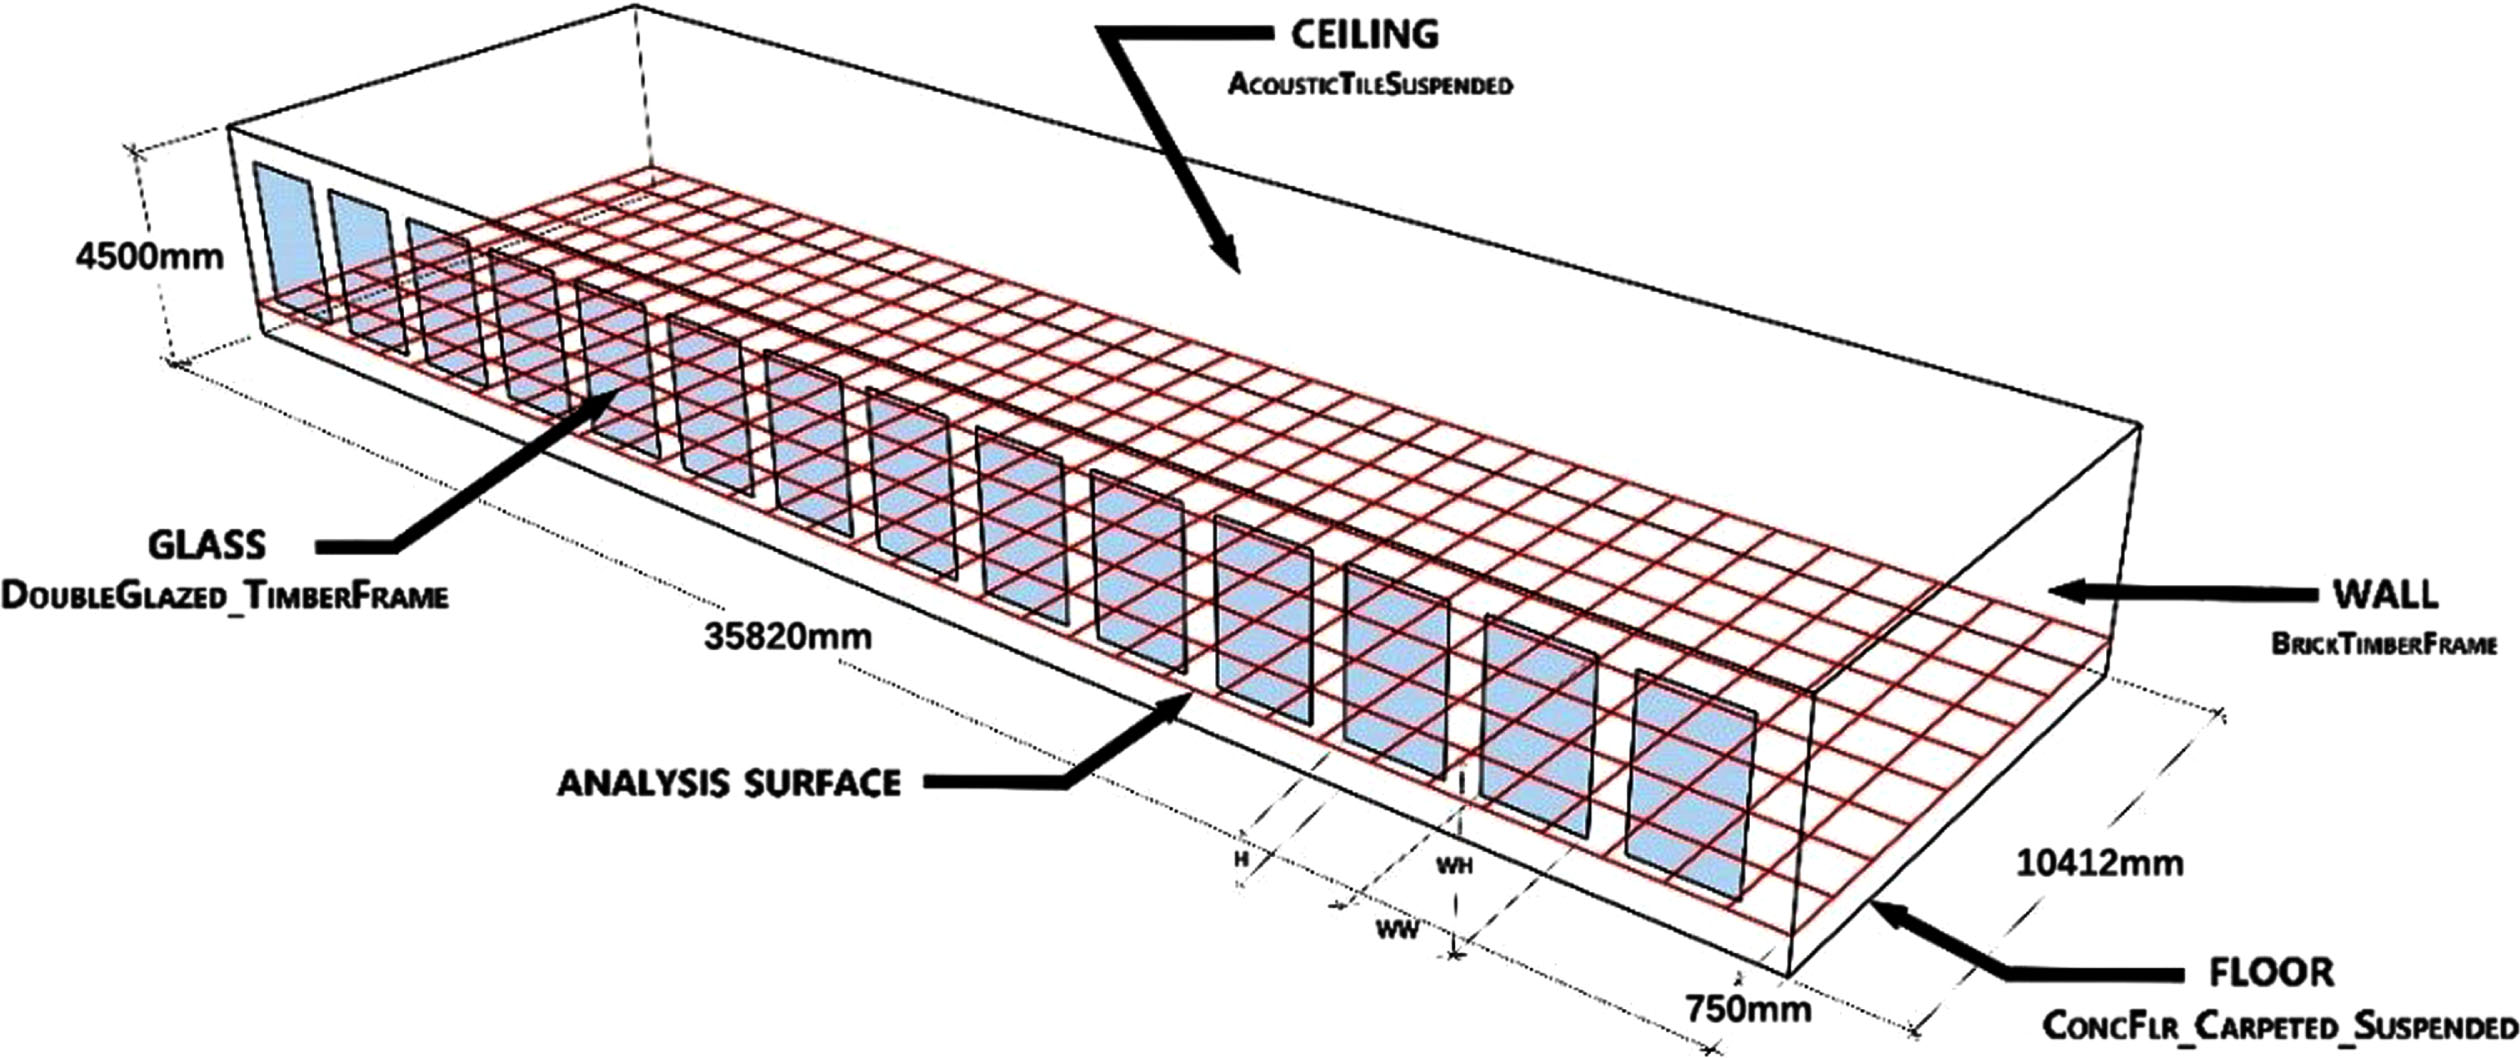
Simplified simulation model.
In the second step, the raw data are prepared to be trained and tested using the multilayer perceptron (MLP), a feedforward ANN model that typically consists of an input layer, one or more hidden layers, and an output layer. The data only flow from the input node, through the hidden layer node, to the output node without circulation. In Eq. (5), the input layer is X = (x1, x2, … x
i
, … x
m
), the hidden layer is Z = (z1, z2, … z
i
, … z
m
), and the output layer is Y = (y1, y2, … y
k
, … y
p
).
Here, w
ij
and w
ik
are weights, wherein the weight between the i
th
neuron in the input layer and the j
th
neuron in the hidden layer is represented by w
ij
, and the weight between the j
th
neuron in the hidden layer and the k
th
neuron in the output layer is expressed as w
ik
. b
j
and b
k
are biases. f is the activation function, which is defined as Eq. (6).
The ANN model includes several weights and biases that must be adjusted using algorithms. In this paper, the backpropagation (BP) algorithm is used to train the neural network. This algorithm consists of the forward propagation of the signal and the backpropagation of the error. The final output value and the loss value between the output value and the actual value are calculated according to input vector X, weight vector W, and bias vector B in the forward propagation.
BP is performed when the loss value is not within the specified range; otherwise, the updates W and B will be stopped. The output value is transmitted back to the input layer through the hidden layer, and the error is distributed to all units of each layer. Thus, the error signal of each layer unit is obtained, which forms the basis for modifying the weight of each unit. The process of adjusting weights and biases is the same as those in the learning and training process of network training. The weights and biases are adjusted continuously in the processes of signal forward propagation and error back propagation. The termination condition can be the network convergence to the minimum error value, a training time standard, or the maximum number of iterations.
Last, an app called BIM-ANN-based daylight factor prediction is developed for designers at the early design stage, which adopts the client/server architecture and the HTTP transport protocol. The server side includes data persistence, business logic and the data interface, while the app’s front end has the user interface and operation logic response.
Case study
Problem statement
The new library of CDUT is located in Chengdu, China, and has a total building area of 41,407.29 m2. The total height of the library is 24.9 m, including the frame structure with one floor underground and five floors above the ground. The underground portion houses the library and equipment room, and the five floors above the ground contain the library, reading room, leisure space, and office room. Chengdu has a hot summer and cold winter, and belongs to the subtropical monsoon humid climate. The location of the library is 30°67’ north latitude and 30°46’ east longitude. According to the five types of light climate zones classified in the standard for daylighting design of buildings (GB/T50033), Chengdu belongs to the category V light climate zone.
As one of the functional areas with the highest lighting requirements, the reading area of the library is selected as the main objective. To obtain the light intensity required by readers in the reading area, reasonable material selection, space division, and window-to-wall ratio are needed. According to the building standards [31, 32], all the connectivity of a library building can be obtained as required at the early design stage. The lighting of reading areas is at the third level, and the coefficient of lighting standard is higher than 3%. The natural light standard is not less than 450 lux, and the ratio of the window to the wall on the facade wall is no less than 1/5.
Before this research, a preliminary study on the coefficient of lighting of the library in CDUT was conducted [34]. Through the prediction of the neural network model, the variation range of window height, glass transmittance, and light reflectance of wall materials under the optimal lighting coefficient were proposed. However, the height of the window cannot provide the window size, which is crucial to the daylight factor. In this paper, a more detailed investigation of the window size parameters that affect the natural daylighting coefficient was carried out based on the literature.
Building daylighting simulation and dataset acquisition based on BIM technologies
Model establishment
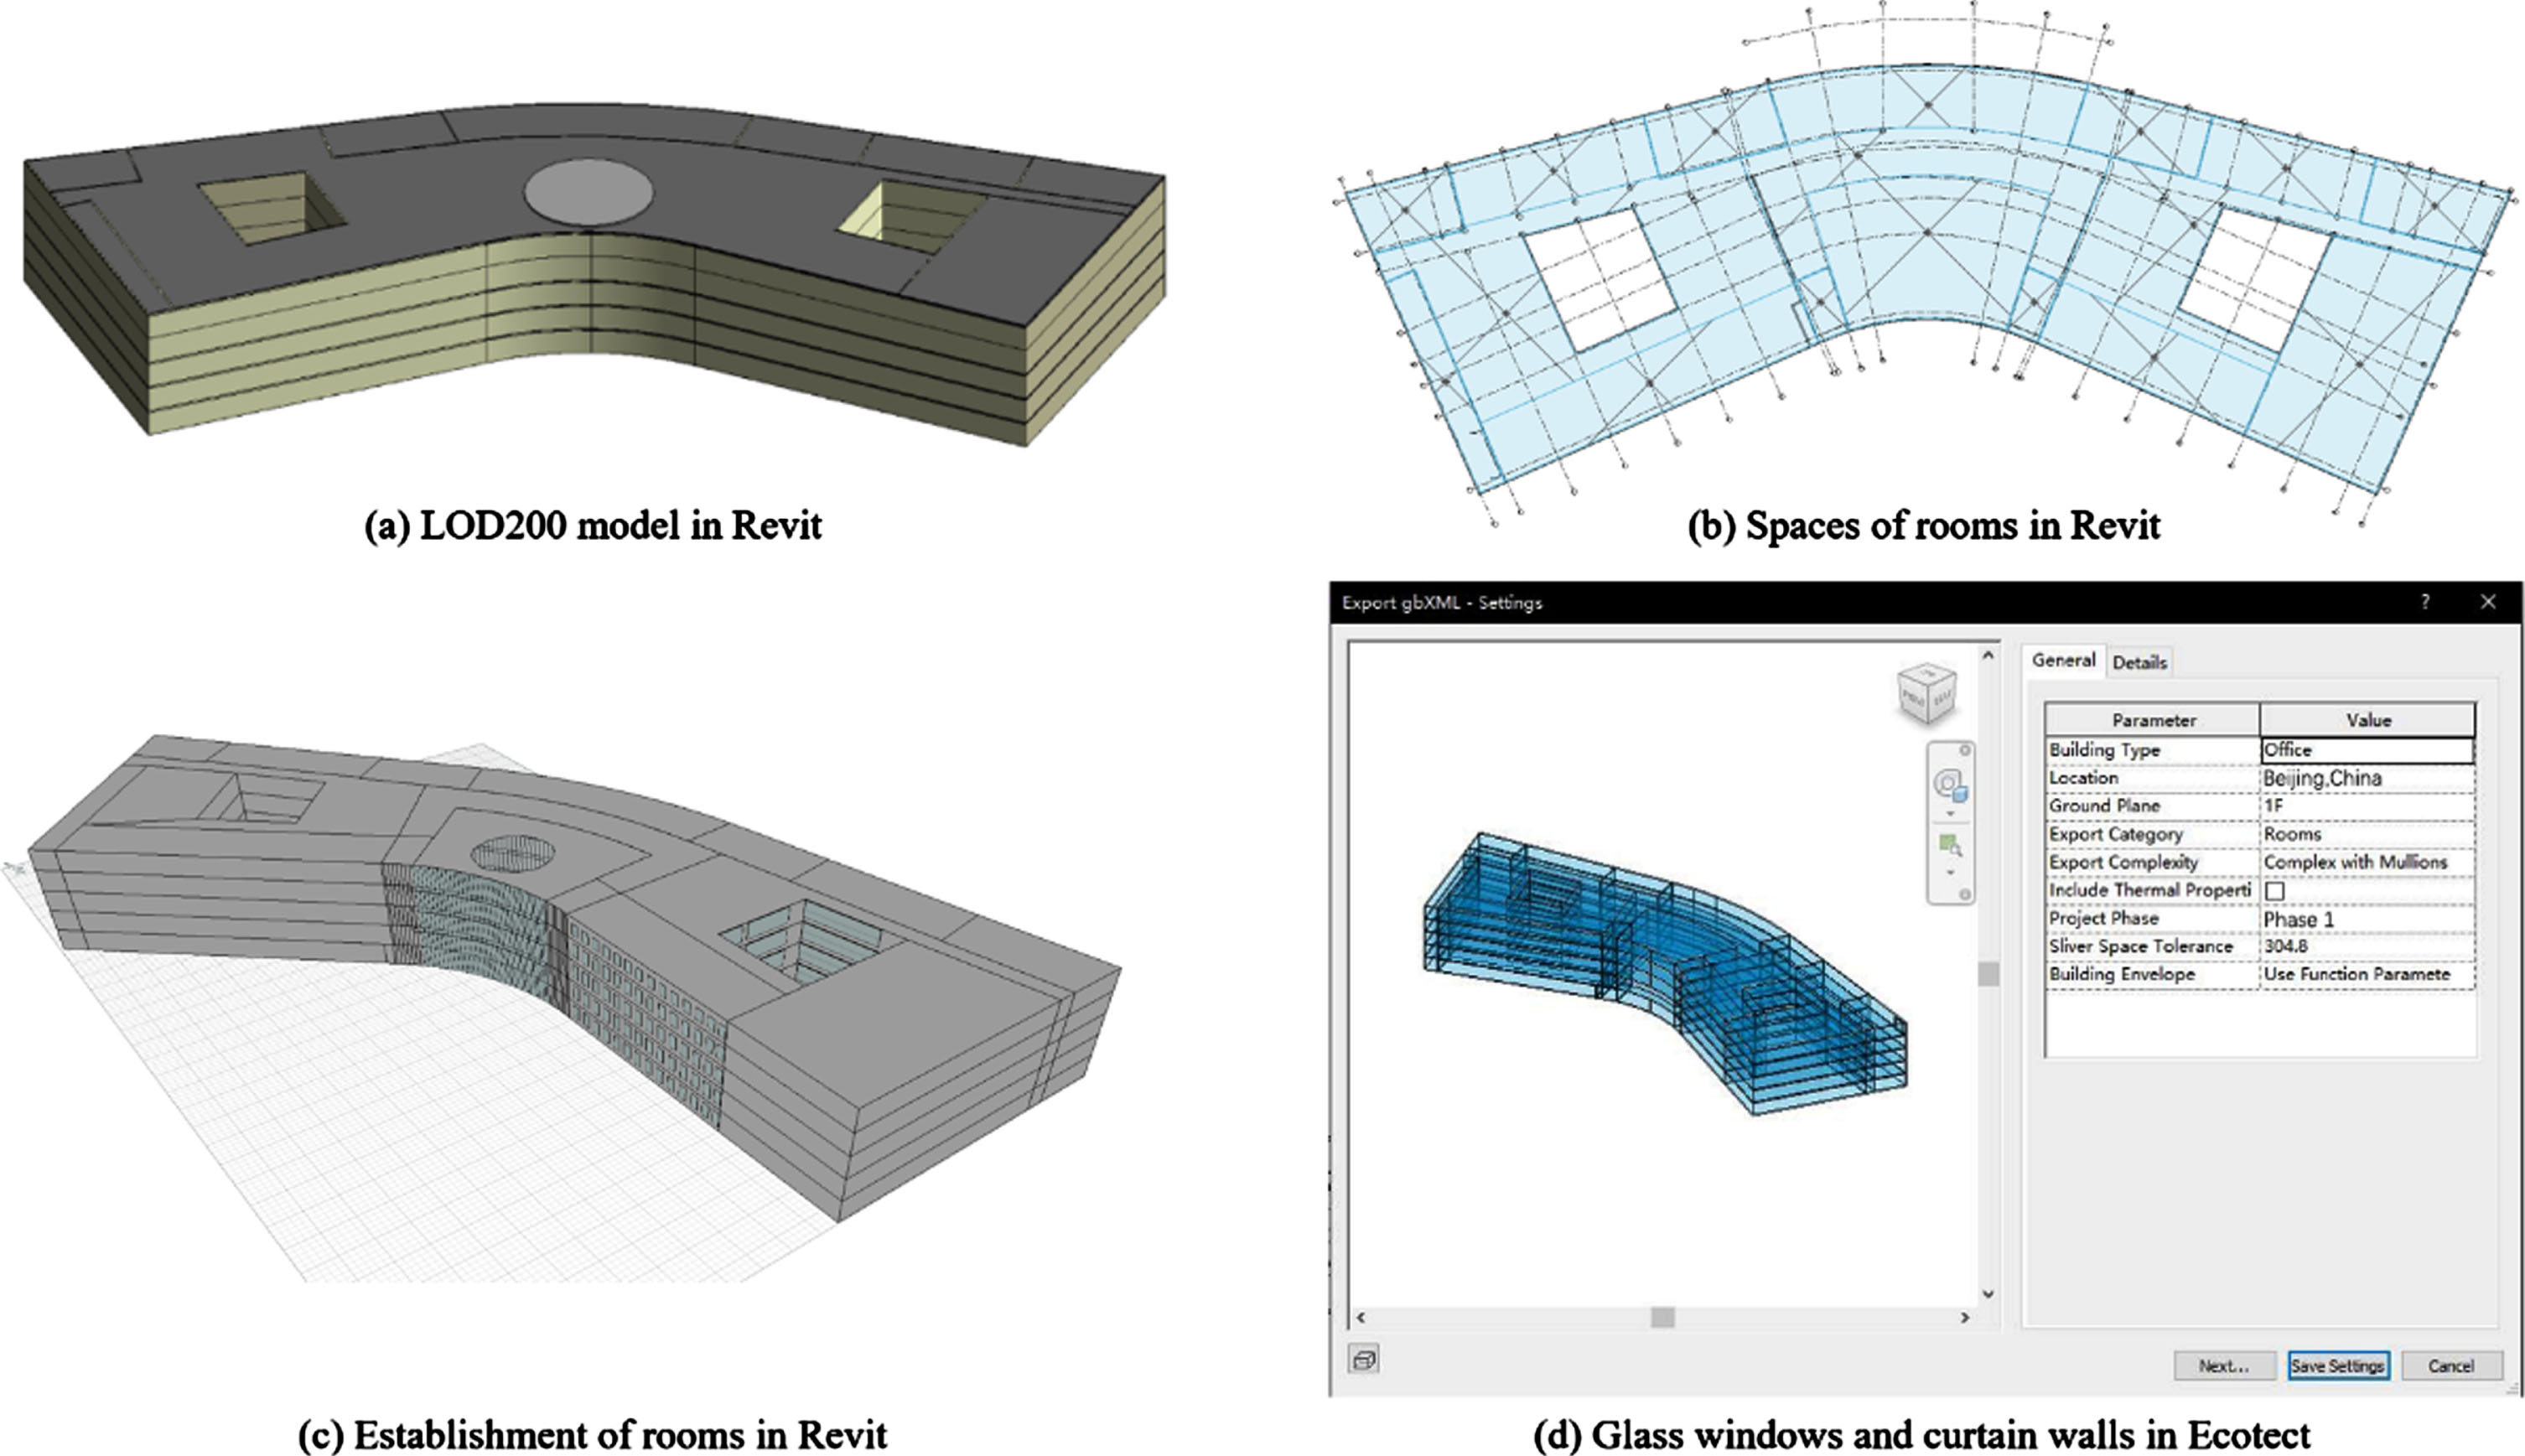
According to the Revit modeling method, five layers of the exterior wall, the interior wall, each layer of the floor, and five layers of the top skylight were drawn. Some details of building a library model need to be emphasized. When drawing the walls, attention should be given to the connection between the two walls, and the height of the wall should be attached to the floor. Moreover, while processing the atrium part, the command of the shaft opening should be used to cut floors 1–5, according to the shape of the atrium part in the CAD plan to form the hollow atrium. Last, when processing the hollow part of the library hall, the command of the shaft opening should be used to cut floor slabs 1–5 according to the size and shape of the CAD plan hall. The model was established with a level of development (LOD) of 200, as shown in Fig. 3(a).
Then, the gbXML file format was used to exchange data between Revit and Ecotect. Hence, the adaptability of the model in Revit and Ecotect should be considered. Since the model in gbXML format was identified by rooms in Revit, the rooms were separated by creating room separation lines. Additionally, the horizontal and vertical spaces of the room were adjusted according to the size and space of the actual model to fill the space with the complete model. Subsequently, the same Revit model was exported as shown in Fig. 3(b).
Modeling flowchart.
After completing the model processing, the export-gbXML command was used in Revit. The 3D viewer is shown on the left side. On the right side, certain basic building information and settings can be entered, as shown in Fig. 3(c).
The windows, curtain walls, and locations were created according to the CAD drawings of the library as the glass material windows and curtain walls of the model in the gbXML format could not be identified accurately in Ecotect, as shown in Fig. 3(d).
Chengdu belongs to the category V light climate zone, where the outdoor natural light critical illumination value is 4500 lux and the corresponding light climate coefficient is 1.20. The CIE all-overcast day model was adopted for the daylighting simulation, and 9 : 00 am on December 22, the winter solstice, was considered as the simulation time. The height of the working face of the simulated analysis grid was 0.750 m, and a computational grid was set every 1.0 m on the analysis grid. The number of grids was 35×9, which included 35 calculation points in the opening direction and 9 calculation points in the depth direction.
All the calculation points formed a calculation grid. The distribution of the coefficient of lighting with the variation in WSH, WH, and WW in reading area B of the library under different working conditions was simulated and calculated. In addition, the average values of the coefficient of lighting of all calculation grids in the analysis grid were considered as the resultant value under this working condition. Finally, the values of daylight factors were processed and compared.
Determination of indoor parameter range
According to Formulas (1)–(4), ρ j increases as ρ i increases, which results in an increase in the coefficient of daylighting (C av ). Thus, in the study, the maximum reflection ratios of the ceiling, wall, floor, and glass windows were chosen. According to the authors’ previous research, to maximize the coefficient of lighting, the light reflectivity of wall materials and the reflection ratio of glass windows should be maximized. Considering the limited ranges in Ecotect, the reflection ratios of the ceiling, wall, floor, and glass windows were set at 0.8, 0.8, 0.5, and 0.6, respectively.
The windowsill height, window height, and window width were required for determining the influence of the coefficient of lighting. According to the established library model, the floor area of reading area B on each floor with 14 windows was 372.958 m2. According to the standard, the ratio of the window to the floor is no less than 1/5. Thus, the area of each window was 5.328 m2. Moreover, the window area was unchanged, while the window height and window size were varied. The first variable was set as the windowsill height, the second variable as the window height, and the third variable as the window width. The reflection ratios of the ceiling, wall, floor, and glass windows were set as fixed values. All variables are listed in Table 2.
Settings of indoor design parameters
Settings of indoor design parameters
The coefficient of lighting was considered the dependent variable. To study the influence of the three variables on the lighting of the reading area of the library, 11×9 = 99 sets of variables were set for a single layer, and the values of the coefficient of daylighting were calculated under each working condition. According to the five reading areas on each floor, the analysis grid height of each 99-set group was set in five working conditions: 0.750 m, 5.250 m, 9.750 m, 14.250 m, and 18.750 m. A total of 495 groups of data were obtained. The calculation performance of the third floor under two working conditions is shown as an example in Fig. 4.

Calculation results of the third floor in two working conditions.
The obtained 495 values of the daylight factor were sorted into a table in preparation for importing the algorithm model. Partial data were selected as shown in Table 3.
The partial data for the daylight factor
The partial data for the daylight factor
Dataset distribution
During the simulation process of daylight factor calculation for the reading area B of the library, it is assumed that the reflection ratios of the ceiling, walls, floor covering materials and ordinary glass windows take the maximum value. The 5 × 99 daylight factor values were obtained by changing three relevant design parameters of WSH, WH, and WW within a certain range. Then, 495 groups of experiments were carried out with the above three independent variables and one dependent variable.
The ANN models were trained by applying the BP algorithm [35]. The training and testing datasets were randomly separated close to a ratio of 9 : 1 for the Ecotect results. Each of the five floors had 99 groups of data. To allow the model to learn much data as possible, for each floor, 89 sets were used for training and 10 sets were used for testing. Waikato Environment for Knowledge Analysis (WEKA) was used to implement the BP algorithm, as it could directly normalize the data. Therefore, the original figures, including examples listed in Table 4, could be used directly as the input training data.
The part of training data of the first floor
The part of training data of the first floor
In the ANN model, the input layer was composed of three nodes (WSH, WH and WW), and the output layer had one node of the daylight factor. The neural network topology for the first floor is shown in Fig. 5. During the training process, the values of the parameters, including the number of hidden layers, the number of nodes, the learning rate, and the momentum, require multiple attempts to be determined and optimized.
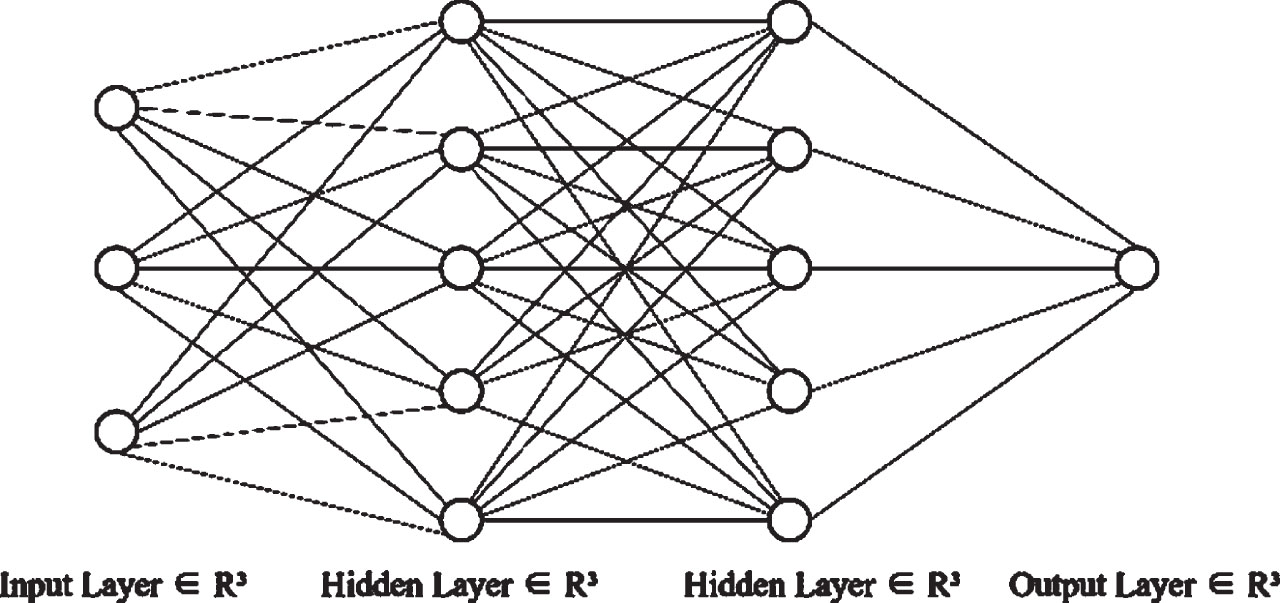
The topology of the ANN model for the first floor.
The usual criteria for these parameter optimization are a root mean squared error (RMSE) below 0.10 or being trained to a certain total number of cycles. The optimized training parameters for each floor are listed in Table 5, with 10,000 training sessions. The RMSEs of the training results on the five floors are 0.0285, 0.0200, 0.0199, 0.0178, and 0.0256, which are much less than 0.1.
Training parameter
Ten sets of data were used in each layer for testing. The results showed that the error between the actual and predicted values was small, as shown in Table 6. Furthermore, the root mean square error of each floor was calculated as 0.0264, 0.0402, 0.0461, 0.0500, and 0.0487 from the first to the fifth floor, respectively. Hence, the trained ANN model was assumed to have passed the test. Figure 6 shows the actual and predicted values of each layer.
Test results (1–5 layers)
Test results (1–5 layers)

Test results (1–5 layers).
The purpose of the ANN model is to determine an optimal daylight factor and provide the ranges of WSH, WH, and WW values. The increments of the three variables are listed according to the ranges given in Table 7. First, the height of the windowsill increases from 0.800 m to 1.300 m with an increment of 0.01 m, which generates 51 groups. Second, the window height starts to increase from 2.400 m to 3.200 m with an increment of 0.1 m, for a total of 9 groups. Third, the window width starts to increase from 1.677 m to 2.167 m with an increment of 0.001 m, which creates 491 groups. Finally, a total of 51 × 9 ×491 = 225, 369 groups of data were available to be imported into the established ANN model for each floor.
The prediction results are listed in Table 8. As seen from the predicted data, in the case of the maximum daylighting coefficient, the height of the window was fixed, while the height of the windowsill and the width of the window were varied. Synthesizing the data and the actual situation of the five floors, to fully utilize natural daylighting in the Chengdu University of Technology Library, the height of the windowsill is 1.0 m, the height of the window is 2.4 m, and the width of the window is 2.1 m.
Increment range of 3 variables
Increment range of 3 variables
The results of the prediction
Using the dataset simulated by BIM technologies and the established ANN model, an app on smartphones [37], called BIM-ANN-based daylight factor prediction was developed to facilitate the designers without any experience in modeling and simulation tools, which is simple and available to realize prediction visualization and historical result analysis.
Users can predict the lighting coefficient of the library building by setting different parameters (such as the number of floors, the height of the windowsill, the height of the window, and the width of the window). The software communicates with the server through the HTTP transport protocol. After the user sets the parameters and clicks the prediction, the data are transmitted to the server through HTTP. Then, the server invokes the algorithm to calculate the daylighting coefficient and returns it to the client, which displays on the user’s mobile phone screen and supports the corresponding chart display.
The research focusing on daylighting prediction is limited. Thus, the current authors have discussed the performance and limitations of the proposed approach and compared it with several studies that use the wide scope of ANN models or the same purposes at the early design stage.
When combining the Ecotect simulation and the ANN models using the BP algorithm, the proposed approach has a strong prediction ability using a small amount of data for learning and training. In addition, the error is extremely small, and the prediction results are the same as the real results, which can be used as a reference for the designers at the early stage. Furthermore, compared with energy simulation tools, the predicted lighting coefficients of 225,369 datasets can be calculated in a relatively short period of time, but the Ecotect software needs 6–8 minutes for the daylight factor calculation of each group of data. It has the same time-saving feature as the research of using ANN models to predict the energy consumption and cost of cross-laminated timber office buildings [37]. The developed app can be adopted to adjust the values of the windowsill height, the window height and the window width to obtain an optimal daylighting coefficient at the early design stage.
RMSE is used to evaluate and validate the trained models of the five-floors, which are within the usual criteria of below 0.1. This implies that the BP algorithm can be used along with simulations as accelerated tools in the early design stage to rapidly predict building performances, which can achieve the same goal using metaheuristic optimization [38]. Elbeltagi and Wefki used the sigmoid axon as the transfer function which produces the minimum mean absolute percentage error (MAPE 5.58%) and R2 (0.98) [39].
However, the current research has limitations. The training and testing datasets were randomly separated close to the ratio of 9 : 1 for the Ecotect results, which is an allowed split strategy. However, the different proportions have different performances in one ANN model. Vrigazova indicated that using a different structure of the test set (7 : 3 or 8 : 2) can further optimize the performance of the bootstrap when applied to the logistic regression and the decision tree [40]. In addition, the validation datasets are also considered using the split strategy of 7 : 1.5 : 1.5 for the training, validation, and testing datasets [37, 41]. In addition, the adopted windowsill height, window height and window width are the same for the five floors, which considers the construction convenience in reality. Therefore, the differences between the trained models for the five floors have not been investigated.
Conclusions
When considering the energy savings and emission reduction of public buildings at the early design stage, designers depend on their empirical optimum and face interoperability between building modeling and energy simulation tools, which is tedious and time-consuming. An integrated approach based on BIM technologies and ANN models was proposed for the fast optimal daylight factor prediction of large public spaces at the early design stage in this paper. Using the Chengdu University of Technology Library as an example, the daylight factors of the reading areas on five floors were experimented with and predicted using the new method, and a smartphone app on smartphones was developed to provide users with a simple and available visualization prediction.
(1) A simplified daylight simulation model was built with a length of 35.820 m, a width of 10.412 m, and a height of 4.500 m. A total of 495 groups experimental data, including WSH, WH, WW and daylight factors, were obtained after setting the reflection ratios of the ceiling, wall, floor, and glass windows as 0.8, 0.8, 0.5, and 0.6, respectively.
(2) The RMSEs of the training results on the five floors are 0.0285, 0.0200, 0.0199, 0.0178, and 0.0256, which are within the usual criteria of 0.1. The RMSEs of the testing results are 0.0264, 0.0402, 0.0461, 0.0500, and 0.0487 from the first floor to the fifth floor, respectively, indicating that the trained ANN models have passed the test.
(3) Based on 225,369 groups of predicted results, the windowsill height, window height and window width should be 1.0 m, 2.4 m, and 2.1 m respectively, which are larger than the actual values of 0.9 m, 2.7 m and 1.4 m. The optimal daylighting factor is 19.958%.
(4) Compared with using energy simulation tools, the integrated approach combined with BIM technologies and ANN models could greatly reduce the calculation time and obtain more accurate prediction values of daylight factors. Using the BIM-ANN-based daylight factor prediction app, users could have a rapid prediction of the daylight factor by adjusting the WSH, WH, and WW values.
An integrated approach for rapid daylight factor prediction of public buildings has been proposed. In the existing daylighting prediction research combining building information modeling with ANN, there are few studies for the early design stage. The introduction of the BP algorithm could greatly reduce the simulation time and improve the prediction of the daylight factor for public buildings. Prediction visualization could be achieved in the developed app.
In future research, the authors plan to carry out three aspects of the work. First, the split strategy of datasets in machine learning will be compared, as well as different algorithms. Second, the differences between the trained models of five floors will be investigated. Third, the amount of energy savings using the predicted optimal daylight factor in public buildings will be compared with the actual design parameters.
Footnotes
Acknowledgments
This work was supported by the National Natural Science Foundation of China (Grant No. 71702167, 72171028), and the China Scholarship Council (202108510094).