
Abstract
The Pile movement is one of the most crucial matters in designing piles and foundations that need to be estimated for any project failure. Over the variables used in forecasting Pile Settlement, many methods have been introduced to appraise it. However, existing a wide range of theoretical strategies to investigate the pile subsidence, the soil-pile interactions are still ambiguous for academic researchers. Most studies have tried to work out the subsidence rate in piles after loading passing time by artificial intelligence methods. Generally, the Artificial Neural Network (ANN) has drawn attention to show the actual views of pile settlement over the loading phase vertically. This research aims to present the Hybrid Radial Basis Function neural network integrated with the Novel Arithmetic Optimization Algorithm and Biogeography-Based Optimization to calculate the optimal number of neurons embedded in hidden layers. The transportation network of Klang Valley, Mass Rapid Transit in Kuala Lumpur, Malaysia, was chosen to analyze the piles’ settlement and earth features using HRBF-AOA and HRBF-BBO scenarios. Over the prediction process, the R-values of HRBF-AOA and HRBF-BBO were obtained at 0.9825 and 0.9724, respectively. The MAE also shows a similar trend as 0.2837 and 0.323, respectively.
Keywords
Introduction
The foundation design of structures such as bridges demands proper analysis of soil and beneath, so A broad spectrum of geotechnical investigations should be considered to deal with uncertainties related to any failure in operating piers for any purpose. They contain both empirical studies and field measurements; nevertheless, other respective data can also be used and interpreted for the limit state under consideration. It is essential to gain a high level of knowledge and geotechnical certainty to allow safe designing of the bridge foundation to ensure proper displacement, rotation, and stability of foundations in most unfavorable conditions [1]. The load transfer mechanism is based on the provided pile resistances in the pile shaft and toe. The behavior of piles under load is complicated; that is why knowing the interaction between the pile and supporting soil is hard to understand. Whereas there have been many strategies to define the load-carrying capacity of piles, mainly related to the geotechnical and geometrical properties. The bearing capacity of piles can be determined based on ordinary semi-empirical equations [2].
Artificial neural networks (ANN) applied by the previous researchers such as Liu et al. [3], Lee and Lee [4], Che et al. [5], Hanna et al. [6], and Shanbeh et al. [7] to foresee some parts of the most complicated problems of pile engineering among estimation of pile-bearing capacity, pile settlement as well as pile skin friction, and end-bearing capacities. Various investigators set up training data collections to offer a forecast model for inspecting the pile skin friction and pile end-bearing power. The training data group used in their network training was gathered from a series of dynamic field investigations. The results verified a better prediction process than the previous pile-driving formula-trained procedures. Goh [8] utilized neural network-based solutions in formulating the results of load-settlement behavior of driven piles. The training data set was collected from actual pile-driving records. The proposed networks could estimate the output more reliable and consistent than traditional pile-driving formulas. Teh et al. [9] applied neural network models to approximate pile-bearing capacity.
The settlement in the foundation in the loading condition should coincide with the structure usage, without any soil and collapse of the foundation of the constructional piece. Therefore, the projection of movement is the main phase of designing foundations with viable and logical aspects. However, Magalhaes [6] mentions with the study some classes for methods evaluating the movement of a pillar as a settlement: procedure of transfer load, solutions related to elasticity, and methods in numerical forms. The principal hardships for utilizing mentioned ways are direct to discrepancy among the hypotheses opted, and the conditions for boundary status minded, further for the hardship of acquiring the variables over geotechnical terms demanded the usages. For the current ways, those proposed that are from hypotheses and contents of the theory related to elasticity, seem consistently used in Engineering of the Foundations. Methods that in the research Poulos and Davis [10] and Randolph and Wroth [11] used, analytical formulations have been devised by the hypothesis related to the behavior of linear elastic in the base made out of the soil. Methods’ constraints and obstacles for obtaining needed variables were discovered within various researches about the main goal trait in which the fore-seeing of subsidence in the basement, that were found complicated, nonlinear problem and multivariate.
This research aims to design, develop, and evaluate a hybrid model of radial basis function neural network (RBFNN) accompanied by two powerful optimizers: Biogeography-Based Optimization (BBO) and Arithmetic Optimization Algorithm (AOA). The strategy called the radial basis function (RBF) neural network was successfully used for many complicated issues due to the simple structure, meticulous approximations, and fast appraisal. Mentioned both techniques are well-known as the way machine learning got confirmed as valuable in numerous research areas, for instance, the studies in the process of image, biology, and making the model for energy conventions. [12–14]. These strategies for geotechnical engineering have been roughly utilized [15, 16]. The Artificial Intelligence (AI) model operated by RBFNN would be able to find the optimal number of neurons acting within hidden layers using the mentioned optimization algorithms. The mentioned strategy could be used for pile movement estimation over the consistent bored, steel, flight auger, and pillars. The proposed advanced model feeds information from a Standard Penetration test and tests for static load through observed in-situ measurements. Accordingly, the parameter of UCS for rock sorts, the ratio of length for a pile-to-pile diameter, loads over the pile, the ratio of length in a pile in the soil to rock, and NSPT are necessary entering variables to estimate the settlement of rock socketed piles into the earth [17].
Concerning the purpose of this research, it is worth noting the usage of two optimized neural networks of radial basis function with optimization algorithms to create the applicability of chosen methods in this study. Several studies have been declared successful in utilizing the RBFNN in the diverse engineering fields, such as precipitation prediction by optimized integrated RBFNN accompanied by BBO and AOA [18, 19]. Modeling overhead crane systems using RBF neural networks with cuckoo search algorithm [20], modeling for short-term solar power generation forecasting using competitive swarm optimized RBF neural network [21], sonar target classification by RBFNN optimized with a sine-cosine algorithm [22], and many other examples could be fund to show the ability of this powerful technique to be used in various academic fields of specialization.
Golafshani et al. [23] did research to enhance a trustable predictive model for the pile settlement of HPC concrete, including various variables. In their study, two ANFIS and ANN created frameworks were integrated by the GWO optimization algorithm. Anyaoha et al. [24] examined the predictive performance of compressive strength for concrete ingredients and proportions. With variations in sample performances because of complexities in concrete composites, ten great models are created and divided into three sets from which several analytic techniques are employed to predict concretes at 28 days for high-performance. The results showed that it boosted dominance in predicting accuracy over the other ways with minimum errors and a better fit to experimental laboratory results. Kaloop et al. [25] investigated the multivariate adaptive regression splines model (MARS) as a feature extraction way to exclude the optimal variables used for designing concrete piles.
Additionally, the extracted characteristics are fed to a gradient tree boosting machine (GBM) learning method for predicting the samples. Moreover, a comparative study has been done using different framework models (Gaussian process regression and Kernel ridge regression) to realize the strength of the models. A total of 1030 data sets of eight input variables, i.e., cement, blast furnace slags, water, superplasticizers, fine aggregates, concrete age, etc., are utilized as input for estimating the pile settlement of samples. The result of the analyses showed that each parameter’s weight was an important matter during the processing of GBM; however, correlation coefficient and mean absolute error were obtained at 0.96 and 0.039 MPa, alternatively.
For the research case, the pile length embedded in soil to length beneath the rock subsurface ratio, the capacity of final bearing as an input factor, and pile settlement (PS) as yield are considered. Uniaxial compressive strength, whole length to diameter, standard penetration test, and the indices of RMSE, MAE, OBJ, and R2 were used to evaluate the planned models’ correctness.
The novelty of this research is the specified algorithms foreseeing the PS in rock. The tests report for pile driving analysis and ground properties had been measured for the Transport network project of Klang Valley Mass Rapid (KVMRT) transportation network operating in the country of Kuala Lumpur, the city of Malaysia to use the abovementioned algorithms.
Methodology
Preparing the primitive dataset
The transport project of Klang Valley (KVMRT) in the country of Kuala Lumpur, the city of Malaysia, to decline traffic congestion was assigned as a study area of this research. The dataset was gathered from a published paper on KVMRT [26]. These projects have displayed that many socketed pillars are essential for supporting the bases to prevent failure and examine the implementation of primitive piles of data gathered. The project place as the study area is demonstrated in Fig. 1, in which a great number of piles are seated on various rock stations such as limestone kind or phyllite and granite. The characteristics of 96 piles formed by granite rock-based have been assumed in this research. The San Trias type of granite rock seemed in the area. The dominating geological properties mainly cover data beneath the ground materials at the pile site. The layers of soil beneath are made up of remaining pieces of rocks, as observed in the results. Accordingly, in the data earned, the bedrock depth is estimated to be 70 cm to more than the threshold of 1400 m below. Besides, the sampling and information of socketed pillars have been brought in the following lines: Undermost and top rates of UCS according to the ISRM parameter, respectively, at the level of 25 and 68 Mega Paskal (MP), [27]. A large region under the surface depth range between 7.5 and 27.0 meters, underground context with a rate further than 50 deep per 300 mm. The mass of observed rocks among moderately to extremely weathered ones. Log data of bore in the 16.5 meters, extremely weathered soil, and the dominant sort of soil is made up of mostly mud including sand plus a minimum and maximum 4 and 167 of lower per 300 mm, respectively.
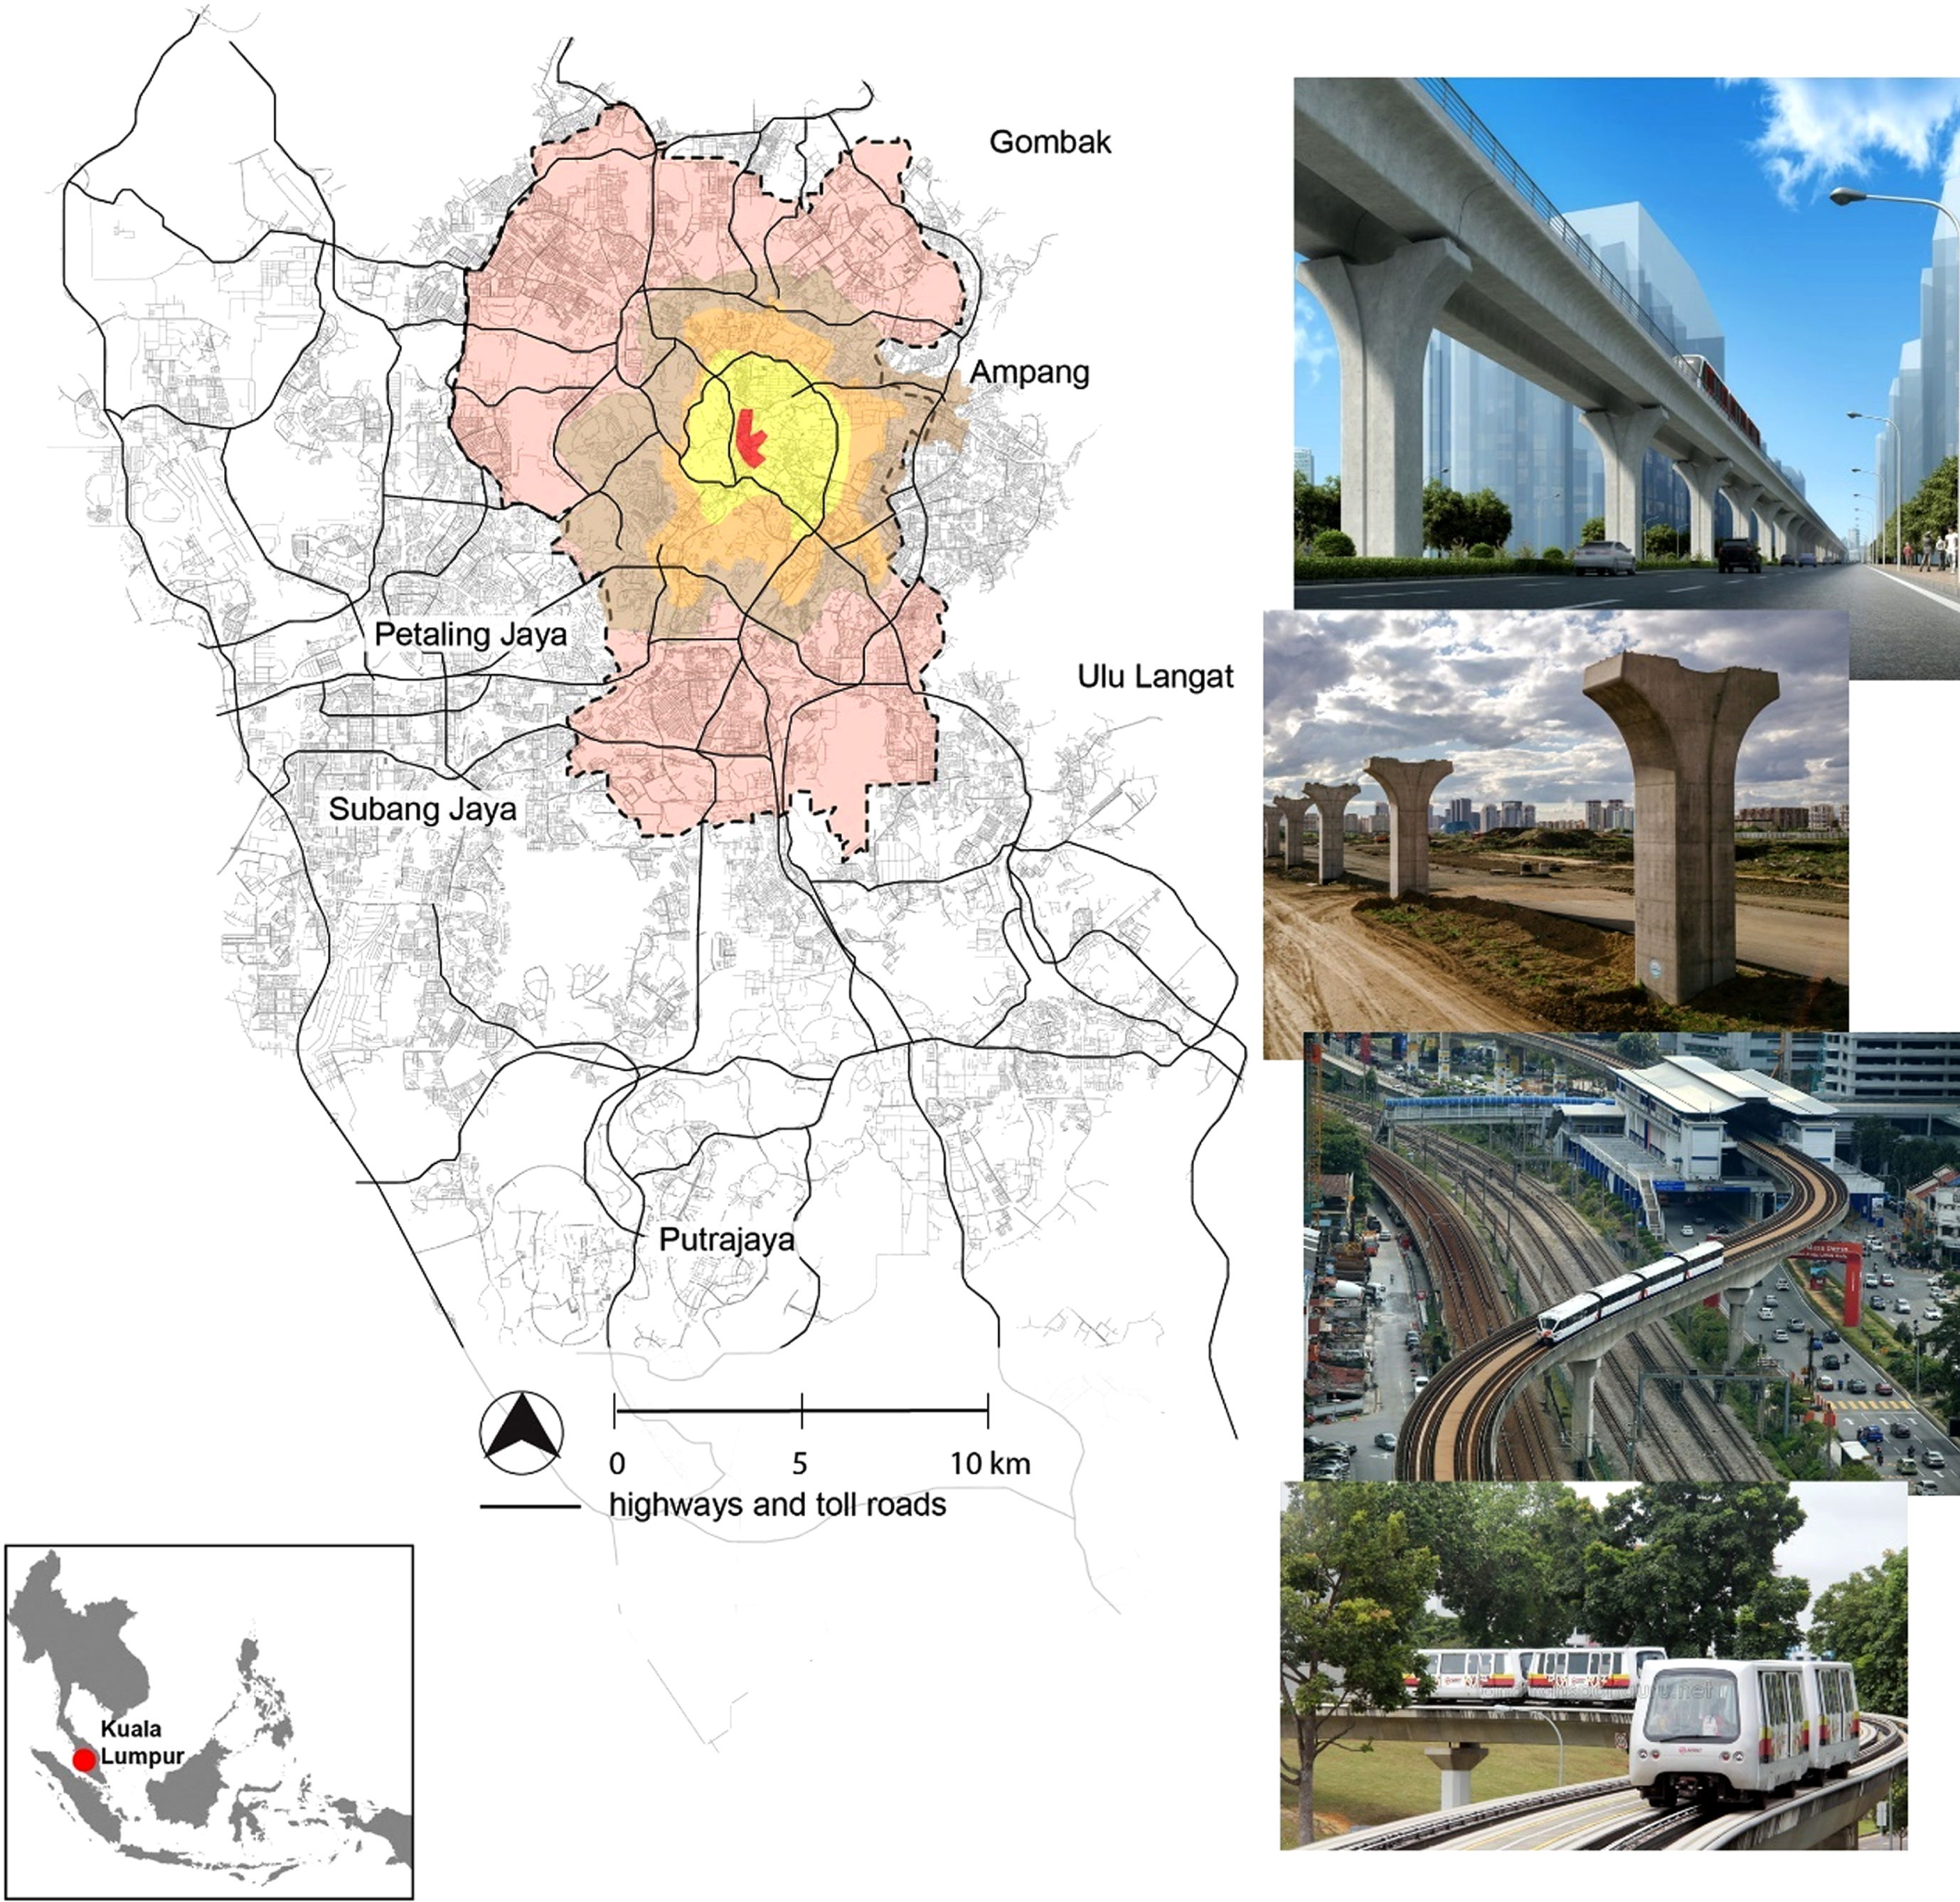
The project of the KVMRT transportation network in the Kuala Lumpur.
Organizing primary information by entering inputs seems the elementary phase for estimating the outcomes. Determining the factors impacting the model output is mandatory to the presented framework.
The practical investigations abovementioned were done by Dynamic of Pile, Inc, laying a pile analysis. It was also previously stated that length of pile and cross-section pile diameter are the variables for estimating pile subsidence portion in the pile movement. Therefore, both variants called the length of the pile below the soil to the length of the pile under the rock proportion (Ls/Lr), and the total length of pile-to-pile diameter (Lp/D) were used to analyze the geometrical situation of the pile over settlement process. The magnitude of NSPT was similarly enrolled as entering input to demonstrate the state of the soil. Further, the parameter of UCS was considered as input of the model for estimating pillar movement. Also, the load over the pile has a straight effect on the pile movement. Therefore, the pile’s last bearing capacity (Qu) was identified in entering data. Variables got selected for appraising pile settlement (PS). The entering data and outcomes from the model, which align with revealed ranges, have been displayed in Table 1. The graphs of entering data and target (PS) have also been carried through Fig. 2.
The statistical values of the input and output variables
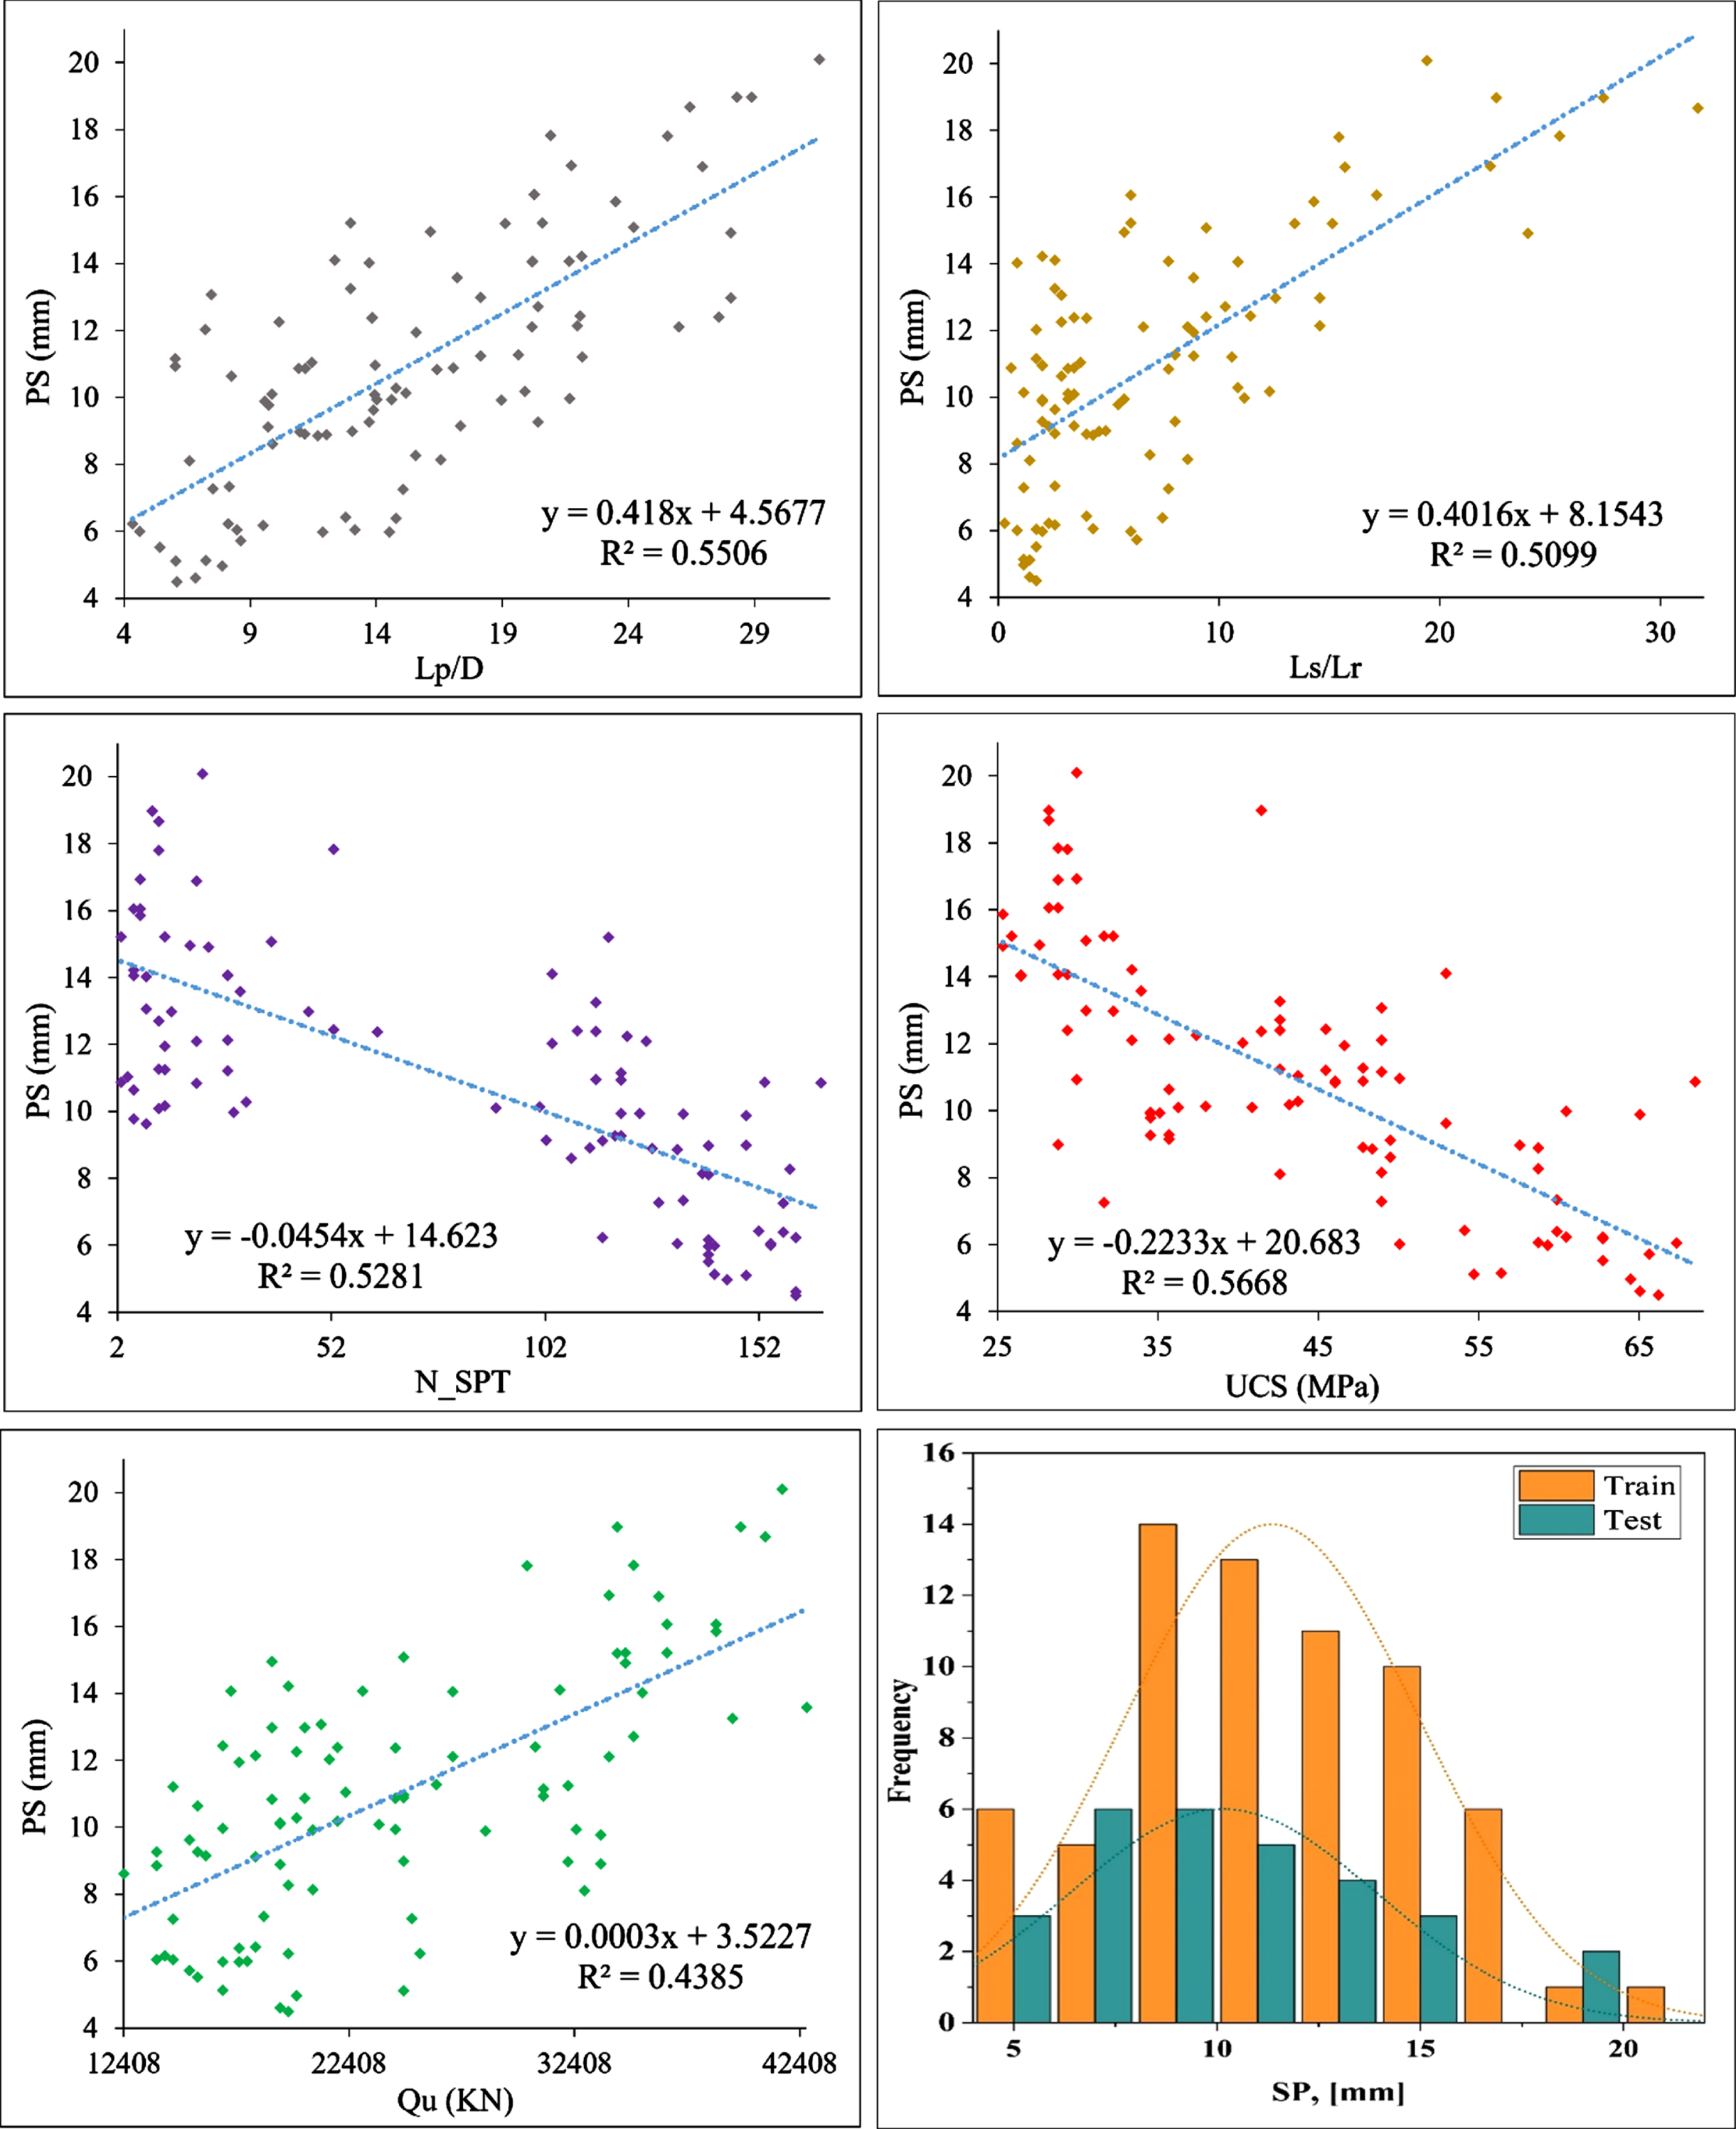
The initial dataset for the modeling.
As shown in Fig. 2, these scatter plots have tried to show the relationship of each effective independent parameter and indicate each range in which Lp/D, Ls/Lr, and Qu are recognized to increase pile settlement, enhancing them. However, the variables of N_SPT and UCS have an inverse relationship with PS.
An artificial neural network (ANN) is an outstanding successor processor spread and composed of typical units that own inherent capability to store the experimental knowledge and use it easily [28]. From the calculus viewpoint, an ANN is realized as a collection of perceptron, and nodes, organized in prospective layers harmonically to the network as mighty like the human mind. Based on Haykin [28], the neurons are the essential parts of data processing within the neural networks. A Signal received from a neuron k (yk) can be obtained by the following expressions:
The neural network of RBF, opposite to the neural network type of back-propagation, gains from simple architecture, accurate estimation of features, and fast computation scenarios [14]. The introduced RBF neural network is composed of three layers: the layer named Input, the layer called Hidden, and the last one named output. The neurons quantity within the hidden layer seems to be what this research tries to find at the optimum level to optimize the network’s cost and complexity and increase the model’s accuracy. The magnitude of the RBF corresponds to the separation from the center point, which is usually defined based on the Euclidean rule. A collection of basic functions has shifted the inputs’ vectors to output. The formula known as the Gaussian one opted as the primary operation in a large number of practices for the infinite, plus discernibility of smoothness. For the Gaussian formula that is working as the main function, the network outcome is introduced as:
In those equations the parameter of X shows the i th layer of the input vector, the variable of X i denotes the X center, the variable of y k denotes the layer of output, σ shows the parameter relating to the smoothing; || . . . || also shows the norm of Euclidean; Φ shows the basic function. It is noteworthy that the (σ) as showing the smoothing parameter is the only variable that demands to be modified in the RBF neural network.
AOA is a candidate-based algorithm with an algebraic paradigm that involves arithmetic operators to check and strengthen the new state of the population without considering their derivatives [29]. Arithmetic, as the main part of present mathematics, seems to be one of the number theory-based algorithm procedures that commence with initializing the candidate solutions, which are made randomly. Equation (7) shows the initial candidates matrix.
The algorithm encompasses two main sections exploration and exploitation [29]. After creating the initial candidate, the exploration or exploitation finding area should be defined and conducted by the math optimizer accelerator function (MOA) Equation (8).
Where Min and Max denotes the minimum and maximum MOA values. The iter is the current iteration and Max iter denotes the maximum iteration number.
The exploration search stage is performed by high distributed values using multiplication (M) and division (D) arithmetic operators for the exploration search action. Operators M and D create a high dispersion that cannot help reach the target. However, applying subtraction (S) and addition (A) operators in the exploitation stage results in getting the best target [29].
If the r1 > MOA is true, the exploration stage of the algorithm is in process. The state in the exploration stage is upgraded using Equation (9), the benefits from M and D operators.
Where appropriate (c
j
) is the global best position, ub, and lb shows the upper and lower bound of the search area. The parameter ɛ shows a little value, and μ is the adjusting control parameter of the search procedure set to 0.499 in this research. The MOP is determined as a math optimization probability calculated as Equation (10).
In this equation, the variable of α represents the sensitivity parameter of exploitation accuracy throughout the iterations equals 5.
Also, if r1 < MOA the exploitation stage happens in this stage, S and A arithmetic operators are applied for a deep search of the dense area. This deep searching is modeled as follows [29].
The BBO metaheuristic algorithm is inspired by geographical distribution and immigration within the ecosystem [30]. In the optimization algorithm, the ecosystem assumed should include a confined residential number. The diverse parameters as suitability index variables influence each residential quality for species, containing food, water resources, climate condition, etc. Another criterion is the habitat suitability index (HSI) to represent the quality of each habitat. If a habitat is filled or has an enormous HSI, the species tend to immigrate from the habitat and immigrate to the small HSI value. Each living location supplies a feasible solution, and its suitability index is the decision variable (DVs). Over the optimization process, the solutions with lower values for the objective have a larger magnitude of HSIs. Two operators called “migration” and “mutation” are used in the mentioned algorithm. The migration operator is applied to find the proximity of the existing responses, and the mutation one is used to explore the new answers and help with the exploration.
In the light of habitat with the size of habitat suitability, the habitats are listed from their cost function values. The suitability of the i
th
habitat (HSI
i
) in the sorted generation is specified as Equation (12).
Figure 3 shows the migration process of the BBO. Here, the most considerable value of emigration and immigration speed is assumed to be one. Migration from the j
th
decision variable of r
th
habitat to the decision variable of i
th
habitat is computed through Equation (15).
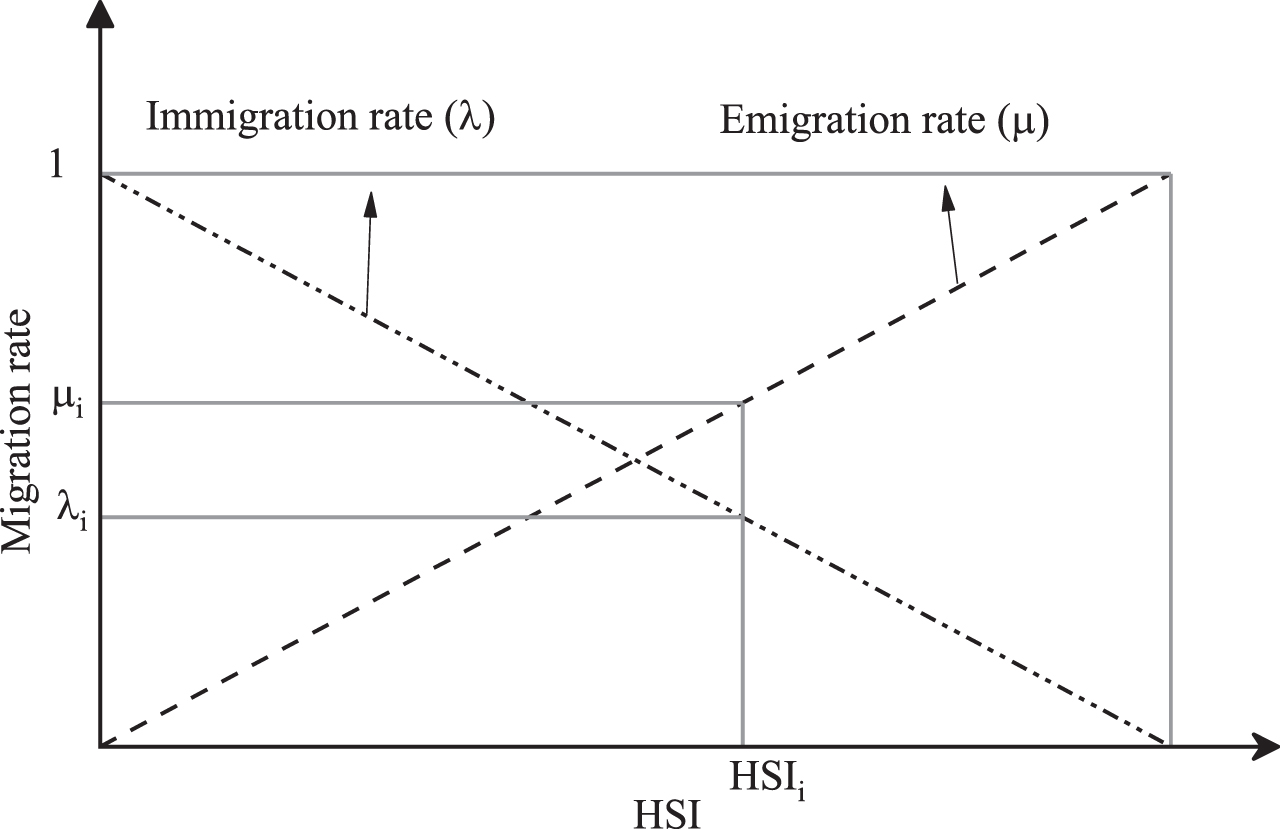
Migration curve of the BBO.
A Radial Basis Function (RBF) neural network is well-known as a feed-forward network including an input layer, a hidden layer, and finally output layer. Therefore, the speed related to the convergence rate for the RBF would be at a high level [31]. The input layer nodes enter the parameters to the hidden layer, in which a Gaussian Activation Function (GAF) makes the hidden layer neurons. This neural network reflexes to the input signals adjacent to the center point in the primary function. The outputs of the result from the hidden layer are transcended to the output layer, wherein essentially operates a simple linear function [32].
Figure 7 represents the composition of RBF, where t1, t2, …, t5 denote the network inputs and φ1, φ2, …, φ
q
are the center of the base function in the hidden layer. Further, w0, w1, …, w
q
shows the weights in which w0 is the weight of output layer. The Gaussian function (φ) utilized in this research seems as Equation (16):
c i Prototype center of i th Gaussian function
σ Spread rate parameter
t - c i Distance between input t and c i
The output of an RBF has been presented through Equation (17):
The RBF as a modifiable strategy for dedicating the spread rate and the neuron number of hidden layers determines parameters in the efficiency by defining the best combination of neuron numbers and spread rate. The complex RBF-BBO and RBF-AOA frameworks are used to devise the high-efficient ANN in the present study. The AOA and BBO algorithms assign the number of neurons embedded in the hidden layer and the spread value to set the RBFNN structure. Therefore, RBF-BBO and RBF-AOA try to build a fabulous model with appropriate magnitudes for the variables abovementioned. Figure 4 shows the advanced RBF model structure coupled with BBO and AOA optimization algorithms and the pseudo-code of RBF coupling with optimizers.
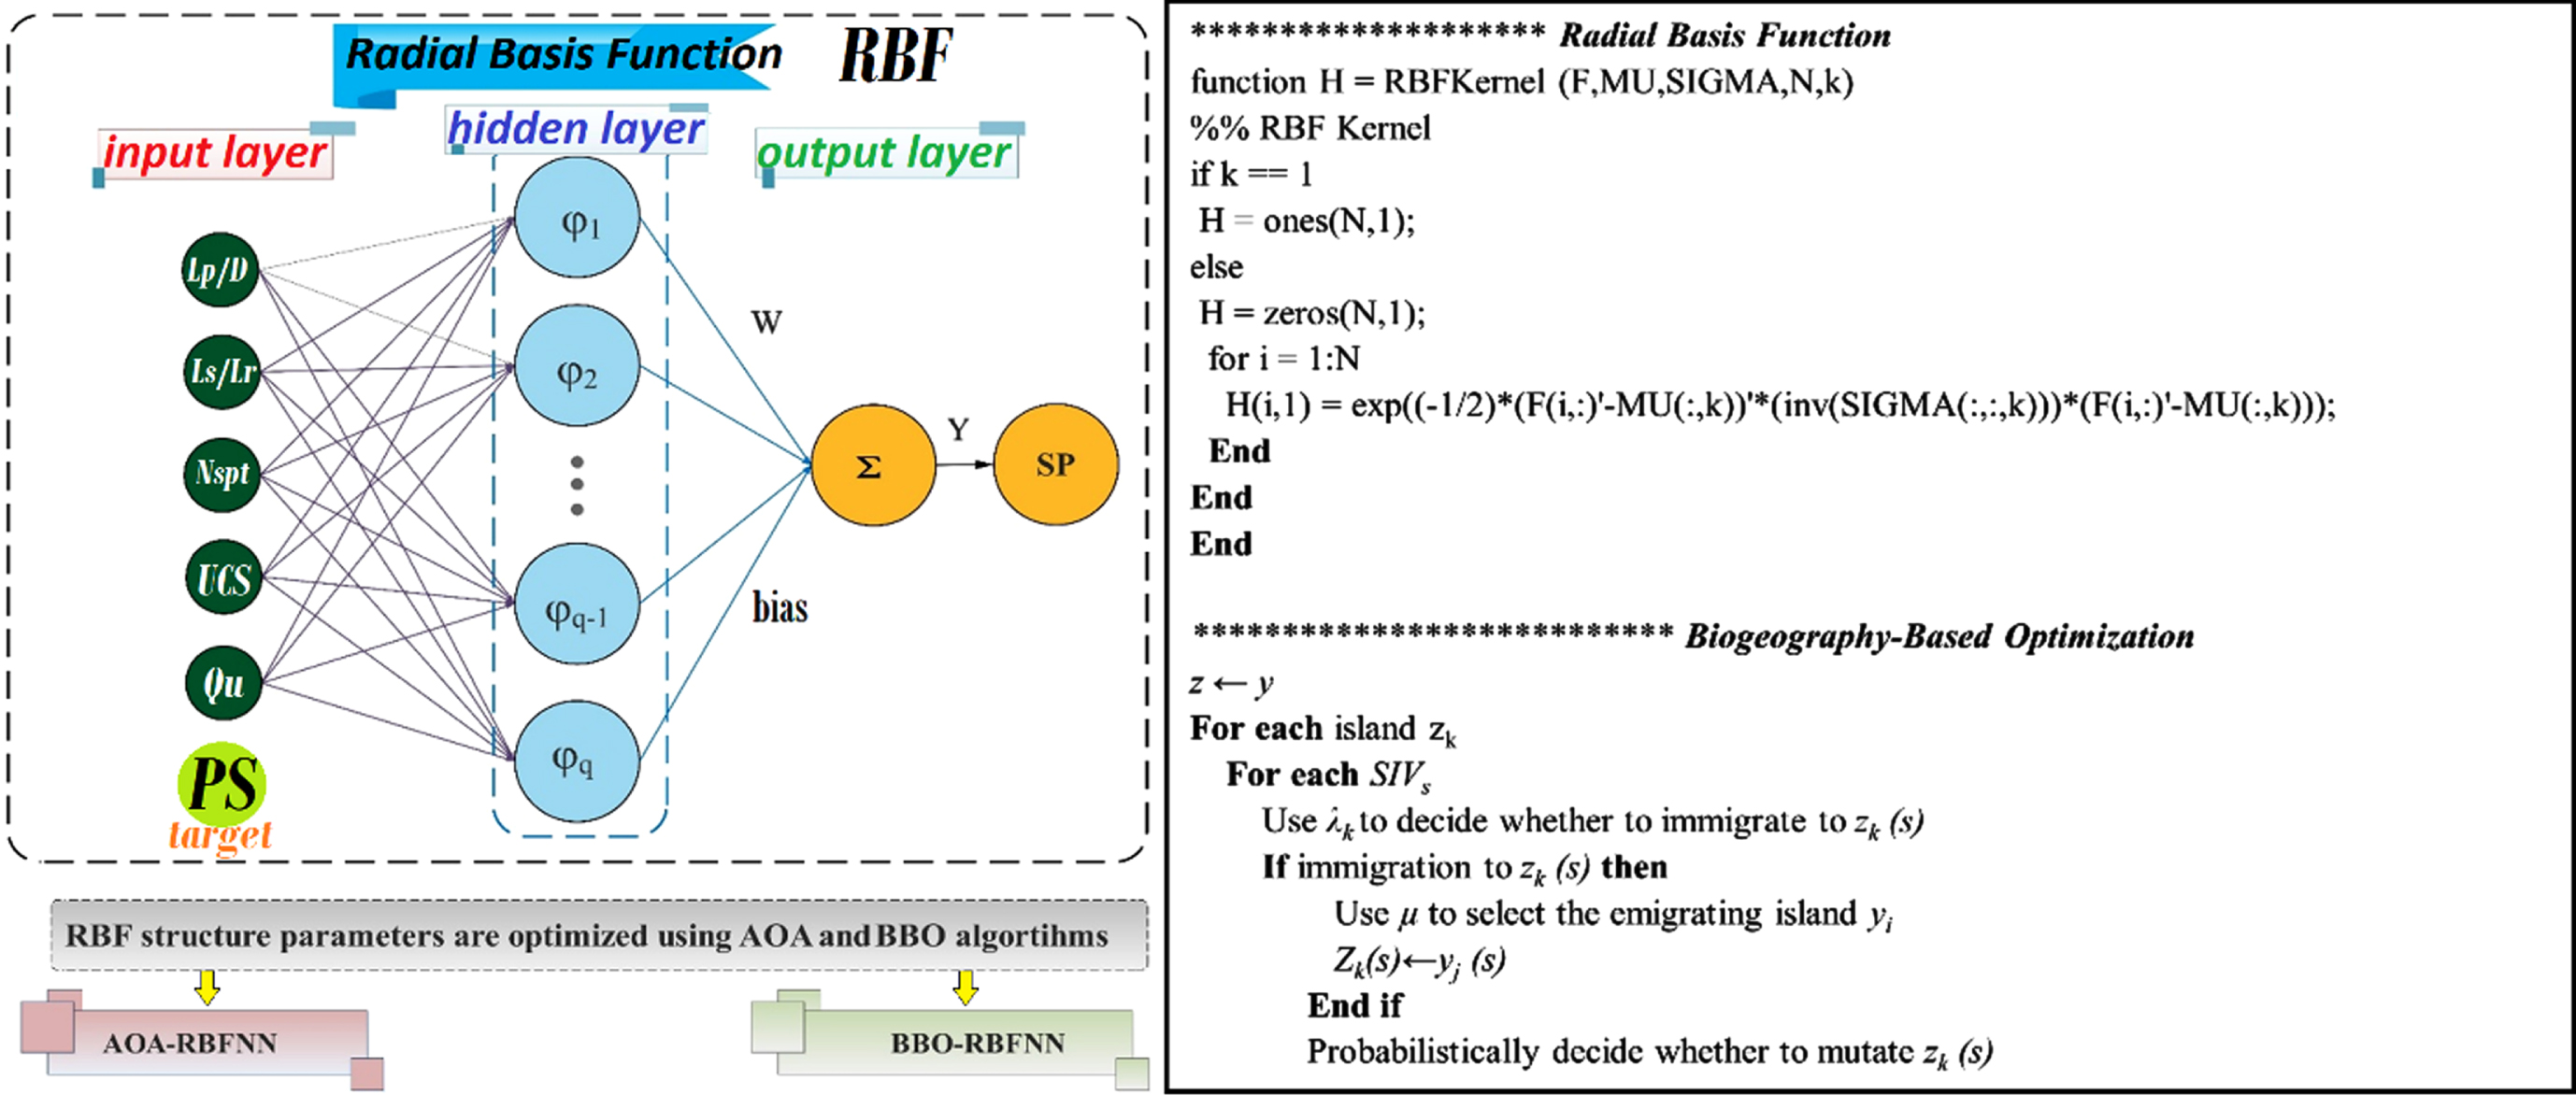
Proposed RBFNN model structure.
With developing models, 96 pile samples with different measured features (independent variables) fed RBF-AOA and RBF-BBO as the training stage. Later, the validating phase starts, and the PS model will be tested. In the three mentioned phases, 70 percent of the data set will be employed for the training phase, 30 percent of the data will be used at similar rates for validation and test phases and 15 percent for each stage. Piles data comprises two independent parameters, e.g., pile diameter and dependent parameter of pile settlement as a target. That is affected by diverse values of independent parameters.
By preparing data for 96 piles, the training phase attempts to feed 70 % of pile information to calibrate RBF-AOA and RBF-BBO hybrid frameworks based on measured data. By training them with other 15 % of data, both dependent and independent parameters, at the same time, the models will be validated according to the targets (PS) to reduce the error rates by modifying the weight and bias of RBF. In fact, by producing PSs, they will be compared with measured PSs. Subsequently, the final fifteen percent of data (samples) will be investigated in the next stage, named the test phase. However, in the mentioned stage, the targets of PS are not considered, and only independent parameters will be used to produce PS value. In addition, Fig. 5 shows the flowchart of the current research.

The flowchart of current research.

The performance of modeling data, (a) Scatter plot of measured and predicted the pile settlement, (b) the normal distribution of errors in each model.
The performance criteria for evaluating the developed platform are introduced in Table 2:
The evaluation indicators of performance
The evaluation indicators of performance
where,
The results of the advanced integrated RBF models (i.e., RBF-BBO and RBF-AOA) to estimate the pile settlement are indicated in this sector. The optimal number of neurons for the hidden layer for both proposed models has acquired 70. In this condition, the costs and complexity of the network would be efficient to get the accurate simulation running through MATLAB. Figure 5 proposes the plots showing the correlation trend between observed and estimated pile settlement for both developed models and their error in the testing stage. One hidden layer in modeling each model has been considered in the displayed results in Fig. 5. As seen from the figure, the execution of the AOA algorithm in optimizing the neuron process seems more precise than BBO. Using the evaluation criteria explained in the previous part, the R-value for RBF-AOA modeling shows a level of 97.4 percent compared to RBF-BBO with an R-value of 97 percent. Identically, the RBF-AOA showed better performance in modeling via considering the RMSE index by the magnitude of 0.59; in contrast, the activity of RBF-BBO showed the high-error modeling in comparison with another one by reaching 0.64. The graph of normal distribution of error (b), however, indicates the better result of the BBO-owned framework that has aggregated the modeling error close to the zero areas of the figure. However, the RBF-AOA error distribution diagram seems flat beside the other one. It is notable that by seeing graph (a) it is acceptable that the piles with higher numbers have been modeled well with minimum errors. In contrast, the pile settlement modeling process with lower numbers has been with error. Because 67 and 29 amounts of data are used for the training and testing phase, the RBF-AOA testing phase has an R of 0.9825, and the RBF-BBO with 0.9724 shows a better performance in the testing stage rather than the training stage with 0.9693 and 0.9685 for RBF-AOA and RBF-BBO, respectively.
Using the only correlation plots does not cover all sides of the performance models have demonstrated. For this reason, further evaluators for statistical performance should be utilized to compare the efficiency of models applied, where MAE, R, RMSE, OBJ, and VAF are operated in the research. In this regard, Table 3 depicts the modeling error in each model. RBF-BBO has weaker performance than the RBF-AOA model in all statistical indices except MAE in the training phase. The RBF-BBO with the value of 0.3277 has appeared high-accurate model; however, the final outputs of RBF-AOA are acceptable, with R, RMSE, MAE, and VAF at 0.9693, 0.6339, 0.3318, and 96.85, respectively. For the testing phase, the most appropriate performance similarly is belonged to the RBF-AOA model with the indicators of R, RMSE, MAE, and VAF at 0.9825, 0.4925, 0.2837, 98.19, respectively. The index of OBJ, including R, RMSE, and MAE, also implies the RBF model with AOA optimizer as the accurate model. Hu [33] did a study on modeling pile settlement by the algorithm of GOA for assisting the primary estimator model; consequently, the correlation rates of modeling and PS modeled rates were about 93 percent. Hu used MLP to estimate PS values and obtained an R2 index of 0.93; such difference is derived from the MLP model for prediction, having a sigmoid function form, and Radial Basis Function with a circular-shaped function. Gao and Jun-Wei studied pile settlement through AI via Radial Basis Function and reached a correlation of 0.92 rates in train and test stages [34].
Obtained values of performance evaluators for developed models
Obtained values of performance evaluators for developed models
Note: better performance has shown through green background cell.
To better understand the correctness of modeling in each simulation of HRBF, Figs. 6 to 8 try to show the accuracy of modeling for each pile by showing the phase of train and test in separate parts. Concerning Fig. 6, the simulating operation in both training and testing stages has a valid result. In this figure, the measurements have been shown with red lines that existing gaps mention the errors as the difference between modeling and existing observed pile settlement rates.
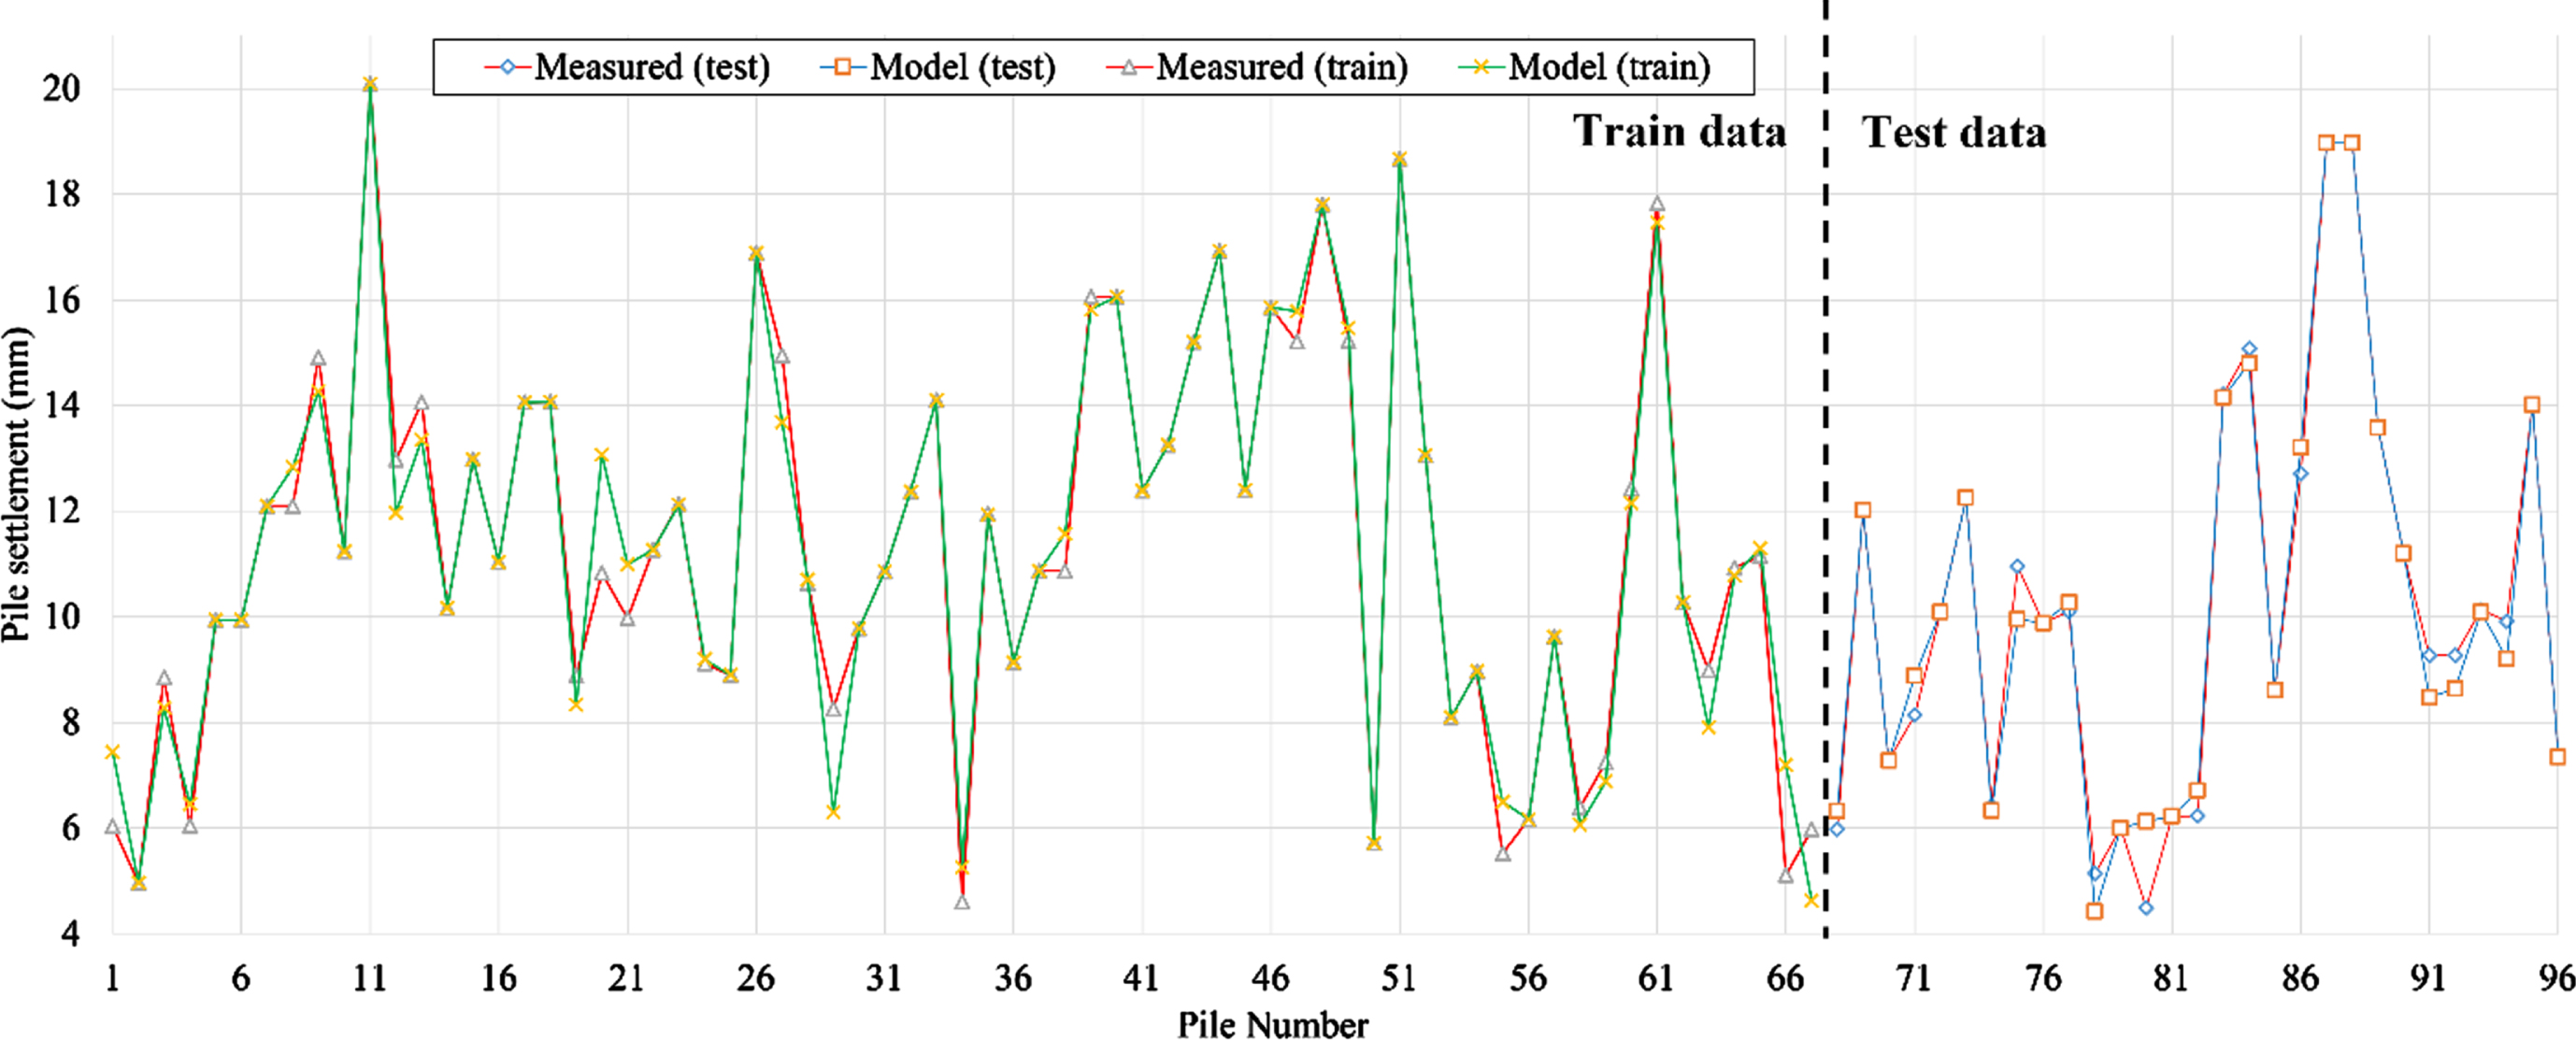
PS modeled in RBF-AOA comparing with in-situ measurements.
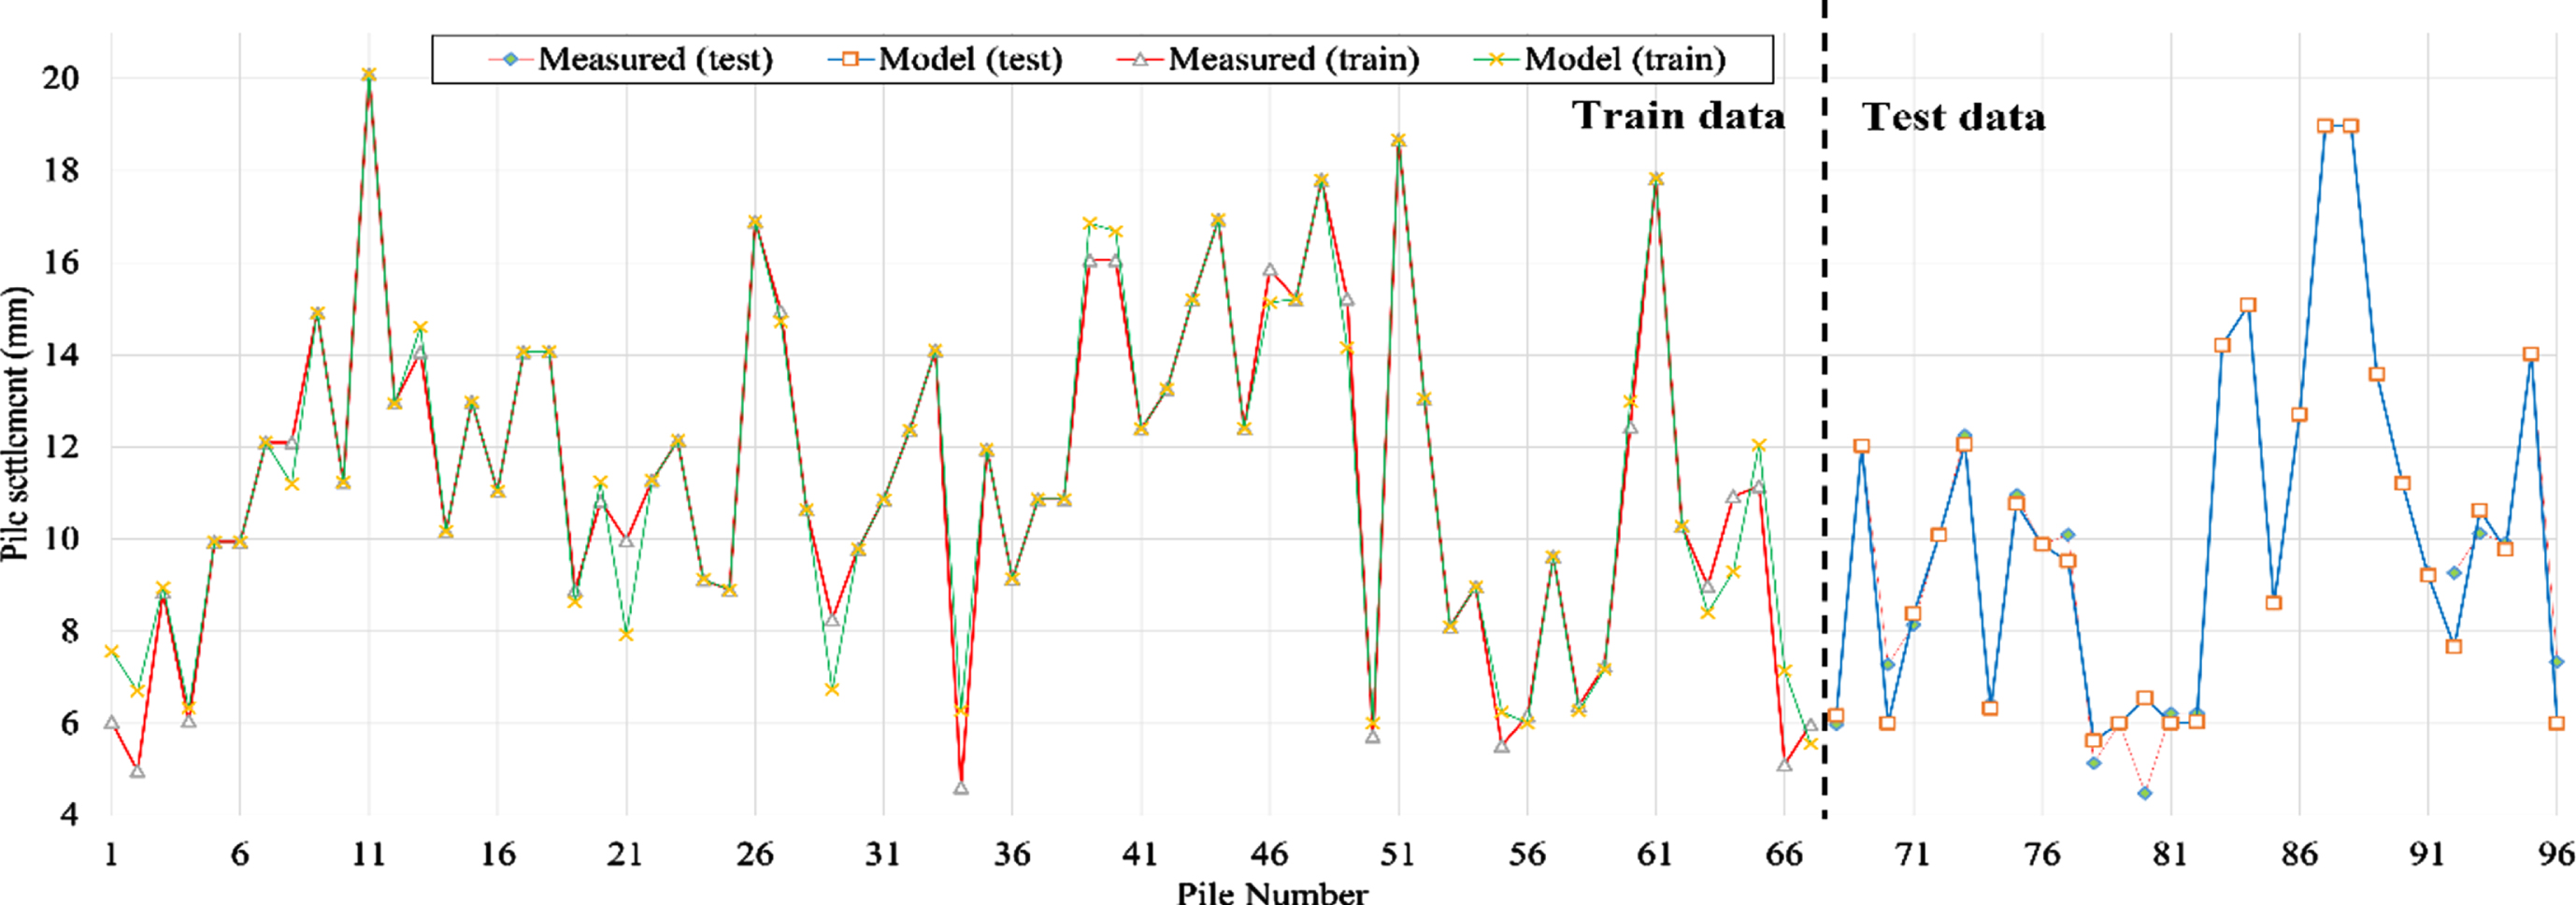
PS modeled in RBF-BBO comparing with in-situ measurements.
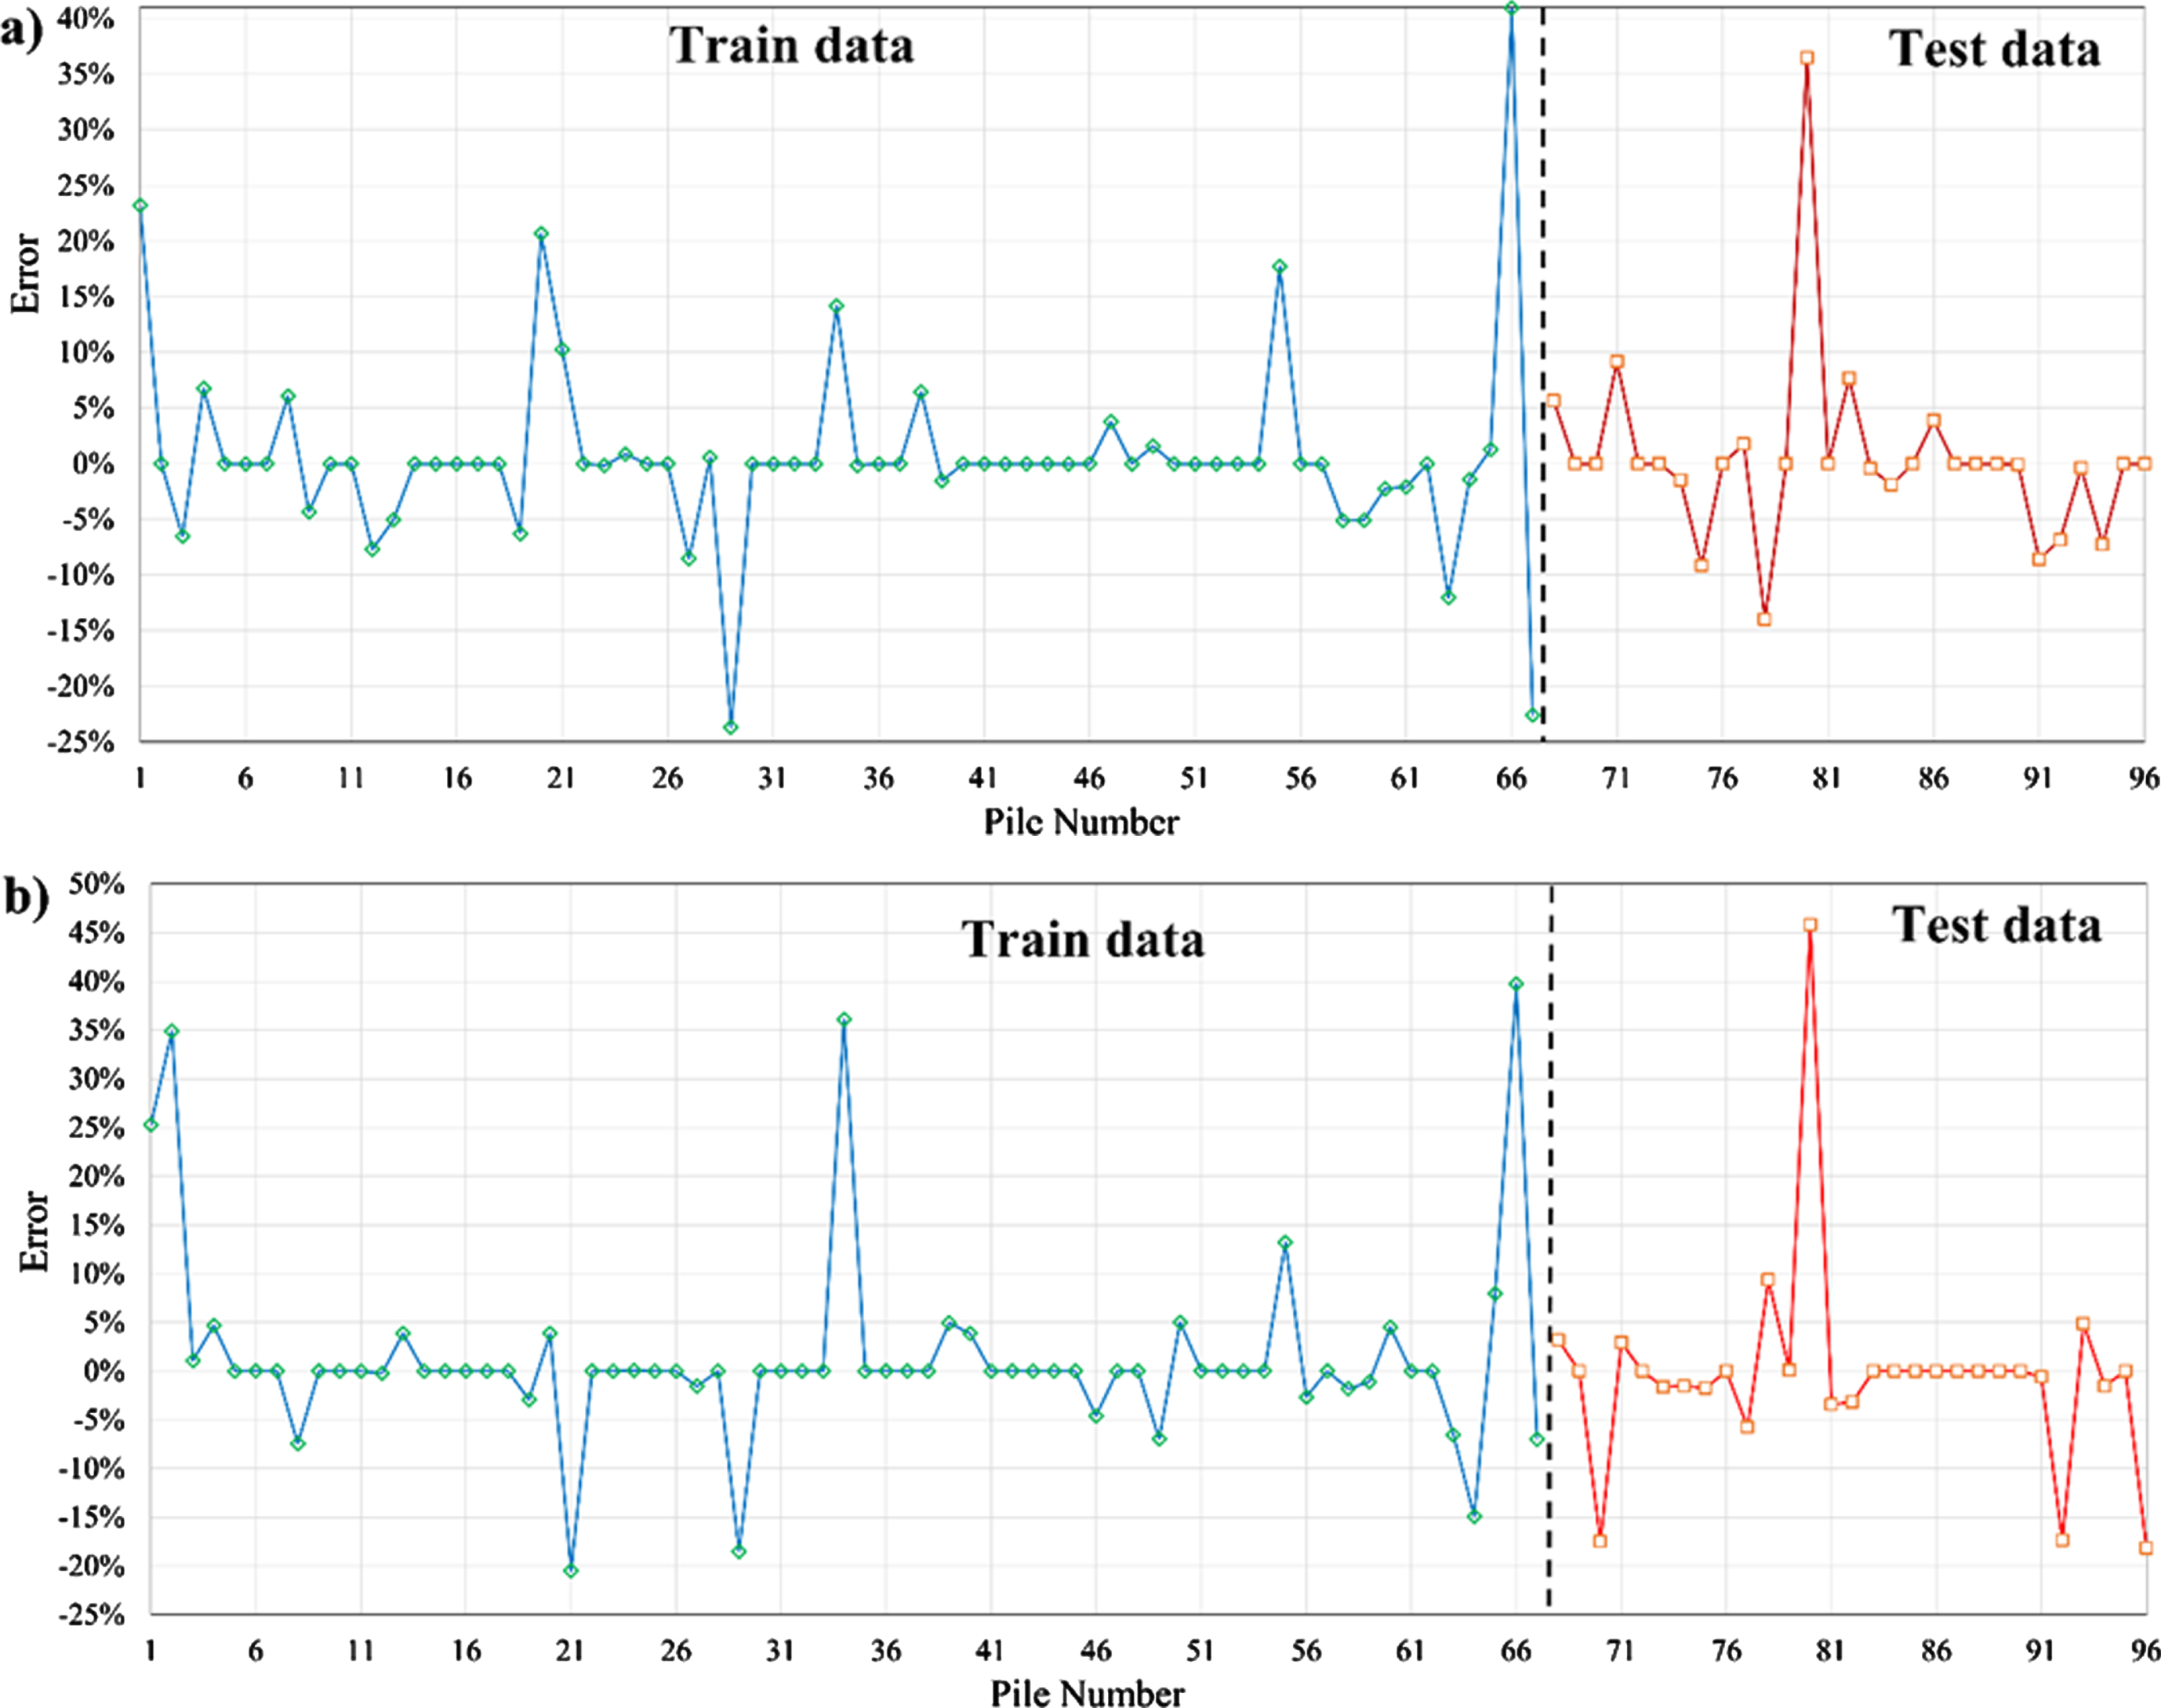
Error percent in modeling for a) RBF-AOA and b) RBF-BBO frameworks.
Figure 7, moreover, shows the simulation results of RBF-BBO with better performance in the piles of number 82, which coincides with the measured ones. However, the training phase can show appropriate modeling.
The gaps in the figure also show lacking accuracy in each pile settlement simulation. Figures 8 have bolded these gaps to make it clear how much error has happened for each pillar.
Figure 8, composed of the RBF-AOA (graph a) and RBF-BBO (graph b), shows the error range of pile settlement for each hybrid model. The first one is mainly computing the PS magnitudes well for the piles with a low number in the training phase. In comparison, RBF-BBO has stable results, which is why the evaluation indices presented the AOA-owned framework as a high-accurate model. Both models have had a maximum error rate of 46 percent for the testing phase.
By using 70 perceptron, the complexity and cost of the neural network will be increased at an optimum rate with the highest correct results. This complexity can create some errors in modeling.
The scale of pile settlements is confined to millimeters, and the errors shown in Fig. 8 refer to the low amount in under or over estimation. In real conditions, it can be negligible.
Also, Fig. 9 indicates the convergence of models in processing operations that were done in 20 iterations. As seen from Fig. 9, the AOA has reached the ideal answer in its first iteration, although the BBO could attain its best RMSE in the seventh iteration at a 9.986 mm RMSE rate. Regarding this matter, the speed of AOA in getting better convergence was more than BBO.

The Convergence rates of models in iterations.
Piled foundations are typically operated beneath heavy structures such as tall buildings because of their massive load transfer mechanism that enables the superstructures to be carried through the piles. The accurate use of the pile and foundation designing system is because the location, length, and diameter of the piles can be strategically controlled to optimize the foundation design; so that maximum and differential settlements are minimized, and load-carrying (bearing) capacity is improved without the high cost. For this reason, the main goal of the present research is to get the accurate application of the optimized Radial Basis Function (RBF) neural network to estimate the rate of pile settlement socketed in rock. In this research, Biogeography-Based Optimization (BBO) and Arithmetic Optimization Algorithm (AOA) were integrated with Radial Basis Function (RBF), named RBF-BBO and RBF-AOA to assign the optimal number of neurons embedded in the hidden layer. For using mentioned algorithms, the outputs of pile tests and properties of the ground were observed and considered for the transportation network of Klang Valley Mass Rapid Transit (KVMRT) established and used in the city of Kuala Lumpur, Malaysia. The main obtained results are as follows: Both RBFNN models would have a remarkable capacity to estimate the Pile Settlement (PS), in which the value R for the stage of training has been got 0.9689 and 0.9774 for the testing phase. Comparing the distribution of sample data close to the line of best fit for little values of PS, the RBF-BBO and RBF-AOA performed identically to each other based on the performance evaluation indicators. In all statistical indices, RBF-BBO had a lower execution than the RBF-AOA framework; while the outcomes are acceptable, the BBO-owned model got the indicators values for R, RMSE, MAE, and VAF at 0.9685, 0.6447, 0.3277, and 96.66 in the training phase. That compared to RBF-AOA has a reduction of 0.08%, 1.68%, 1.25%, and 0.20%, respectively, for the mentioned indices. The performance of RBF-AOA also shows the suitable value for R, RMSE, MAE, and VAF at 0.9825, 0.4925, 0.2837, 0.4306, and 98.186, respectively that in comparison with RBF-BBO has had got better performance. The OBJ value of the evaluation index that encompasses the R, RMSE, and MAE indicators indicates that RBF-AOA and RBF-BBO have reached the values of 0.430 and 0.467 with a 7.8 percent difference, respectively.
To sum up, using neural networks coupled with optimization algorithms would be a new way to improve science in accurately promoting prediction research. Concerning the present paper, using other methods of predictions such as genetic programming, support vector machine, and other AI approaches simultaneously would be promising research to create a comprehensive view of these procedures. In addition, using AI methods in fields with high costs and risks would be a great opportunity to prevent a crisis.