
Abstract
Advanced Persistent Threat (APT) attack detection and monitoring has attracted a lot of attention recently when this type of cyber-attacks is growing in both number and dangerous levels. In this paper, a new APT attack model, which is the combination of three different neural network layers including: Multi-layer Perceptron (MLP), Inference (I), and Graph Convolutional Networks (GCN) is proposed. The new model is named MIG for short. In this model, the MLP layer is in charge of aggregating and extracting properties of the IPs based on flow network in Network traffic, while the Inference layer is responsible for building IP information profiles by grouping and concatenating flow networks generated from the same IP. Finally, the GCN layer is used for analyzing and reconstructing IP features based on the behavior extraction process from IP information records. The APT attacks detection method based on network traffic using this MIG model is new, and has yet been proposed and applied anywhere. The novelty and uniqueness of this method is the combination of many different data mining techniques in order to calculate, extract and represent the relationship and the correlation between APT attack behaviors based on Network traffic. In MIG model, many meaningful anomalous properties and behaviors of APT attacks are synthesized and extracted, which help improve the performance of APT attack detection. The experimental results showed that the proposed method is meaningful in both theory and practice since the MIG model not only improves the ability to correctly detect APT attacks in network traffic but also minimizes false alarms.
Introduction
Advanced persistent threat attacks
Recently, advanced persistent threat (APT) attacks are one of the most dangerous types of cyber-attacks in the world and they bring much damage to organizations [1–3]. Researches in [1, 5] detailed the components, processes, and life-cycles of this type of attack. According to statistic in [6], in 2020, there was a sharp increase in the number of APT attack campaigns recorded in the world. Researches in [1, 4] listed a number of approaches, tools, and techniques for APT attack detection. Among those APT attack detection methods, the ones that are using machine learning and deep learning and are based on Network traffic have been shown to be more efficient [7–12]. In most of the APT attack detection approaches based on Network traffic, the Network traffic is analyzed into different components such as: domain, IP, protocols . . . [2, 13–18], then abnormal behaviors of APT are formulated and extracted. However, the research in [14] pointed out that the APT attack features extracted from simulated data may provide a good detection performance, but cannot be that effective in real scenarios since there is a huge different between simulated data and real data. In order to overcome this problem, researches in [1, 14–17] proposed an APT attack detection approach based on behavior mapping. These methods do not utilize traditional behaviors of APT, instead focus on extracting features from the data followed by computational processes to highlight the APT behaviors. The behavior map that is built based on graph theory has a high efficiency due to its ability to formulate and present the relationships among behaviors during attack campaigns. Nevertheless, the main drawback of APT attack detection methods based on behavior maps is the lack of relationships between edges in the maps [18–20]. In previous researches, these relationships are simply represented by the weight averages. However, such way of calculation will often omit a lot of important properties as well as cannot highlight the difference between the edges [21].
It can be seen that, in APT attack detection approaches, the processes to formulate, select, and extract features from behavior maps play an important role in improving the classification performance between normal and abnormal records. Therefore, in this paper, a new approach for synthesis, building and detecting APT attacks based on the combination of three different neural network layers, which are multi-layer perceptron (MLP), Inference, and graph convolutional networks (GCN) is proposed. This new detection system is called MIG model.
The operating process of the MIG model for APT attack detection from network traffic includes three main stages as follows.
From the work flow of the MIG model presented in the three stages above, it can be seen that the combination of MLP, Inference and GCN networks not only be able to analyze, extract, and reconstruct information about anomalous APT IPs, but also can assist in identifying relationships between IPs in the system. This is very helpful for building a complete set of anomalous behaviors of APT IP, thereby improving the ability to accurately detect APT attack behaviors in the system.
Contributions
There are three main theoretical and practical contributions on APT attack detection presented in this paper, as follows. To propose a new MIG associated deep learning model for analyzing and detecting APT attacks in network traffic. Experimental results in section 4.4 show the efficiency of this newly proposed approach compared to some state-of-the-art methods. To introduce the use of MLP and Inference association network for constructing IP information profiles based on flow network. This helps the IP information profiles are fully updated and detailed. To propose a method to construct IP behavior profiles based on IP feature extraction from IP information profiles, which are built based on GCN network. This is a new approach for IP feature formulation and construction based on network traffic. The use of GCN network right after MLP and Inference layers helps extract important IP behaviors by highlighting the edge characteristics in IP relationships. As a result, the anomaly IP behavior classification performance can be improved. To conclude, in this research, important IP features and characteristics are extracted from flow network. Those features are then exploited to classify normal and APT IPs.
The remainder of the paper is organized as follows. Section 2 reviews some previous studies on APT attack detection. Section 3 presents in details the architecture and operating flow of the MIG model. Section 4 includes experimental results and evaluations to highlight the advancement of the MIG model in comparison with other approaches. The paper is concluded in section 5.
Related works
APT detection based on deep learning
In their research [22], Bodström et al. proposed a Deep Learning Stack model for APT Detection. Accordingly, the authors constructed a deep learning model consisting of 5 layers, in which different algorithms are used independently. In their model, different deep learning structures are adopted in layer 4, such as Recurrent Neural Networks (RNN), Long short term memory (LSTM), Growing Hierarchical Self-Organizing Map (GHSOM), Graph-based Neural Network (GNN), and Graph Database (GDB). However, in their paper, experimental results supporting the efficiency of the whole system, in general, as well as each individual deep learning algorithm, in particular, are not presented. Chu et al. [23] used MLP algorithm to detect APT attacks based on NSL-KDD dataset. Experimental results show that MLP network is less effective than Support Vector Machine (SVM). The detection rate of MLP is between 96.72 % and 97.74% corresponding to different parameter setups. Tuor et al. [24] presented an online unsupervised deep learning system for system log data filtering to detect APT attacks using analyst review. Specifically, they combined CERT Insider Threat v6.2 datasets with different deep learning algorithms, i.e. RNN, LSTM, to analyze and detect APT attack behaviors. Experimental results show that, in their system, RNN, LSTM algorithm is better than traditional machine learning models such as Isolation Forest, SVM, and principle component analysis (PCA) in APT attack detection. Yan et al. [25] introduced the use of convolutional neural network (CNN) in their APT attack detection system based on DNS activities. They extracted three main feature groups, i.e. domain name-based features, relationship features between DNS request behaviors and response behaviors, relationship features between DNS request behaviors and response behaviors from a dataset that includes 4,907,147,146 pieces of initial data of 47 days DNS request records of Jilin University Education Network. These features are combined with CNN to detect abnormal APT attack behaviors. In [26], Nkiruka Eke et al. proposed an APT attack detection method based on KDD99 dataset and some different deep learning models such as LSTM, RNN, and Gated Recurrent Unit (GRU). Their experimental results show that deep learning algorithms are better for APT attack detection compared to some traditional algorithm, such as SVM, k-nearest neighbors (KNN), random forest (RF), and classifier logistic regression. Cosimo [27] proposed a cyber-attack detection system based on NSL-KDD dataset and an auto-encoder network. The auto-encoder network is then compared with some other algorithms, such as LSTM, MLP, linear SVM, quadratic SVM, and Discriminant Analysis with linear and quadratic discrimination functions. Experimental results show that the auto-encoder network is better for cyber-attack detection in that system than other methods. Joloudari et al. [28] proposed an APT attack detection method based on network traffic, which adopted C5.0 decision tree algorithm, Bayesian networks, and deep learning. In their research, NSL-KDD dataset is used for APT attack training and testing processes. Experimental results show that six-layer deep learning algorithm has a better detection performance than C5.0 decision tree and Bayesian network. The detection accuracy rates of deep learning, C5.0 decision tree, and Bayesian network are 98.85%, 95.64%, 88.37%, respectively. Although the error rate of the six-layer deep learning network is just 1.13%, the application of this approach in real life is still a big question since NSL-KDD is a normalized dataset in which there is a balance between normal and attack data. Some other well-known algorithm such as random forest may still bring as good performance as deep learning on that dataset. Sai Charan et al. [29] also proposed the use of LSTM for APT attack detection in banking systems based on security information and event management. Specifically, they applied LSTM based on big-data foundation on APT attack detection at different developing stages of the attacks. The performance of their proposed method is evaluated using processing time for attack detection.
APT attack detection using associated deep learning
Pengfei et al. [30] proposed the use of associated deep learning model CNN-LSTM to extract features for anomaly detection based on CICIDS2017 dataset. Their experiments results show that the CNN-LTSM model has better detection performance than some other methods. Similarly, Cho et al. [31] proposed an associated deep learning model CNN-LSTM for APT attack detection based on network traffic using anomalous behavior analysis and assessment. Additionally, Cho et al. [21] also introduced a new deep learning model that combines Bidirectional Long Short-Term Memory (BiLSTM) model and GCN, called BiLSTM-GCN model, and some other network structures such as MLP, GCN to supervise and detect APT attacks based on network traffic. Experimental results show that BiLSTM-GCN model has a better performance than different deep learning structures. In addition, Do et al. [32] conducted optimization of APT attack detection based on combined deep learning models and Attention network. The experimental results show that the model has been more effective than some single or combined deep learning approaches that do not use the Attention networks.
Other approaches
Panahnejad et al. [33] proposed the APT-Dt-KC framework for APT attack detection based on the cyber-kill chain model and fuzzy technique. Specifically, the APT-Dt-KC framework seeks to evaluate the correlation to reduce the dimension of data to be processed. In addition, to classify APT attack and normal, the authors used a combination of the Bayesian algorithm and fuzzy analysis. The experimental results show that the accuracy of the author’s proposed model increased by about 5% compared to existing methods, and the rate of false predictions also decreased from 1.9% to 3.6%. Besides, Hofer [34] proposed some techniques to reduce the feature dimension of the CICIDS2017 dataset to increase the efficiency in accuracy and time of APT attack detection. In the study [35], Fargana used a deep learning model based on the AutoEncoder algorithm to detect APT attacks for cloud data. Accordingly, based on the collected data, the authors used some algorithms and models such as Autoencoder, KNN, SVM, CNN, Simple Neural Network. Experimental results show that the Autoencoder algorithm gave the best APT detection results with a rate of 0.9832. Longkang Shang [36] proposed an approach of using a multi-layer model to detect Command and Control channels in APT attacks. Specifically, some deep learning models such as CNN, LSTM are applied to mine and detect abnormal behaviors of APT attacks. Then, these behaviors are compressed by the PCA algorithm to reduce the data dimension and finally, they are classified by decision tree algorithm, SVM, RF, KNN, etc. Experimental results show that the F1-Score of this model is 0.968. Weijie Han et al. proposed the APTMalInsight model based on the technique of extracting abnormal behaviors of APT malware [37]. Accordingly, the authors sought to extract anomalous behaviors in dynamic system calls and then used decision tree, RF, KNN algorithms for classification. The experimental results show that the model correctly detected APT malware with accuracy from 98.85% to 99.28%. The study [38] used the technique of analyzing the correlation between alarms to detect APT attacks in real-time. In addition, N. Mohamed [39] proposed a model to check abnormal behaviors of APT malware based on the Adversarial Tactics Techniques and Common Knowledge matrix. Accordingly, the model proposed by the research team seeks ways to analyze and investigate abnormal behaviors on CPU and RAM. In the experimental section, the authors believe that their proposed model reduced the analysis and detection time from 9 months to 2.7 minutes.
In researches [53–56], Cho et al. proposed a method to detect proposed a method to detect APT malwares on Endpoint using machine learning and deep learning algorithms. Specifically, in [56], the authors proposed the use of a number of deep learning models such as BiLSTM, LSTM to classify suspicious processes as the basis for detecting APT attacks. With the same idea, in the study [54], they presented a method to detect APT malware based on behavioral profiles and deep learning graph networks. In [55], the authors suggested to combine deep learning graph network and ATTENTION network to improve the performance of detecting APT malwares in the system. In this study, the newly proposed MIG model aims at significantly improving the APT malware detection results as presented in [54].
MIG model for APT attack detection
The model architecture
Figure 1 depicts the architecture of the MIG model for APT attack detection. The components of the model are detailed as follows.
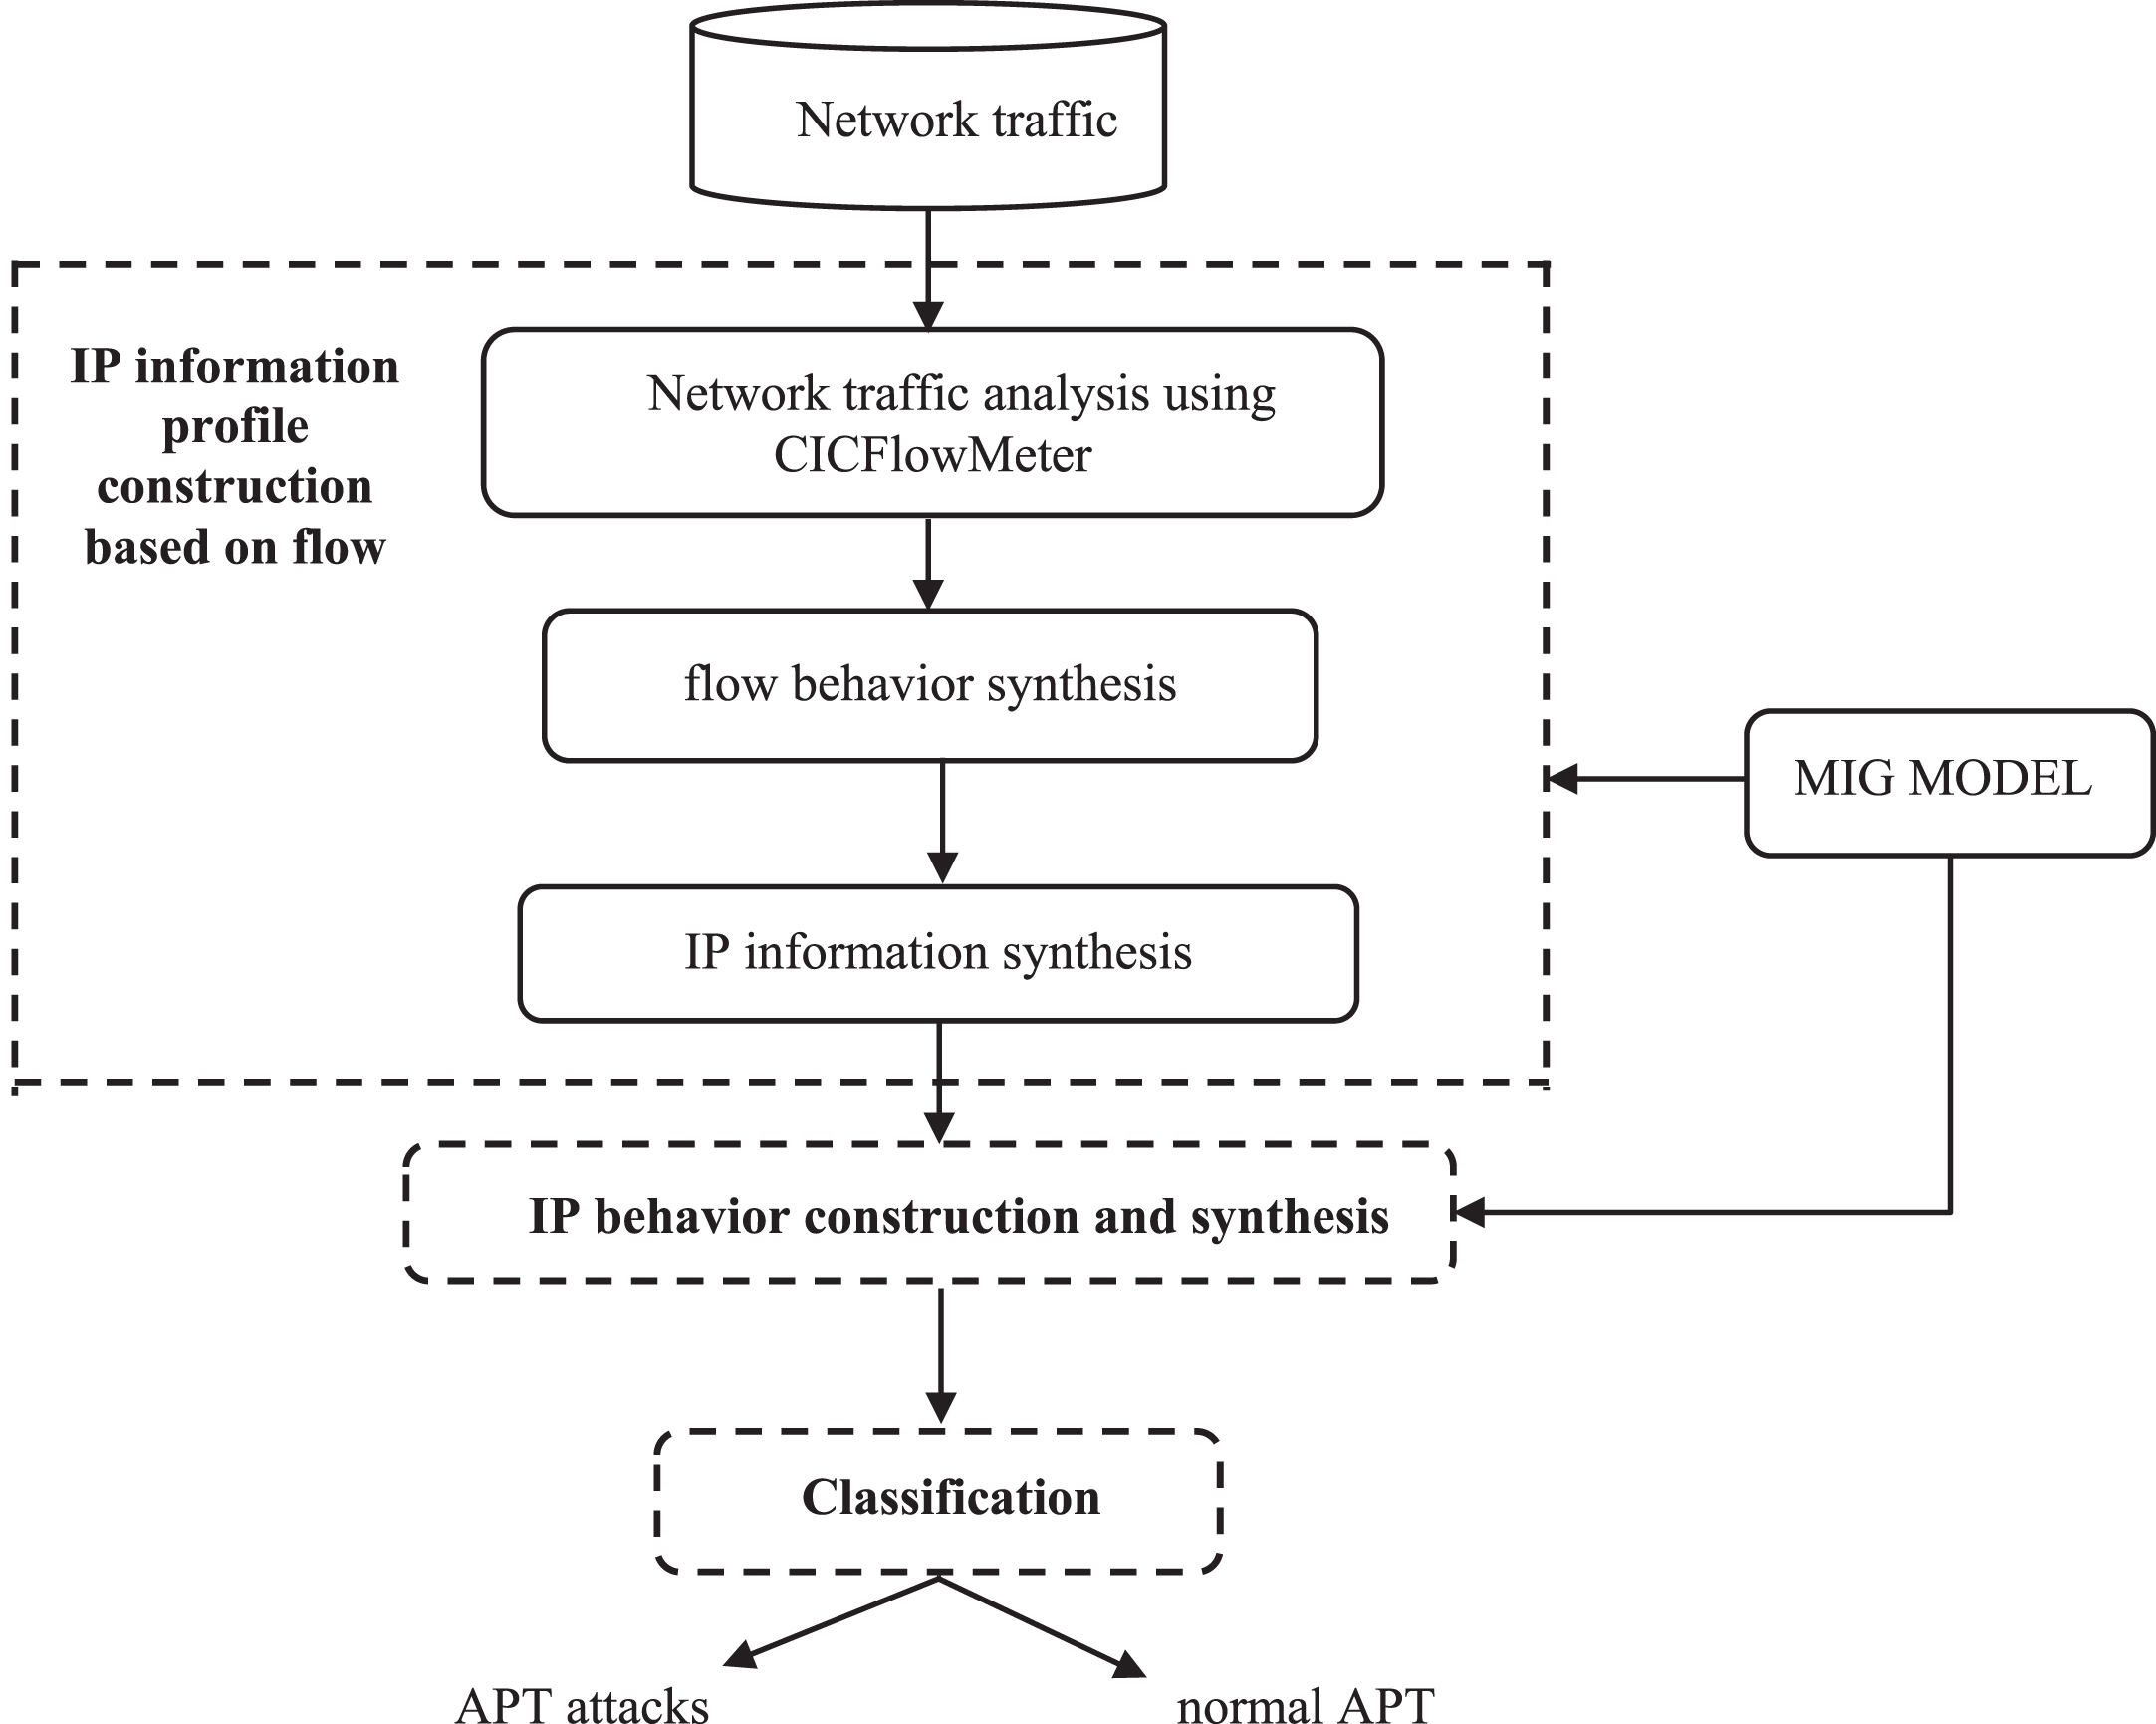
MIG model architecture for APT attack detection.
Based on the model description for MIG presented in section 3.1, the detail workflow of the proposed model is illustrated in Fig. 2.

Workflow of MIG model.
Figure 2, combined with discussion in section 1.2, illustrates that, in order to detect APT attacks based on network traffic, MIG model operates under three main stages: i) to construct IP information profiles based on flow using MLP and Inference networks; ii) to construct IP behavior profiles using GCN network; iii) to classify IP behavior profiles. Details about these stages will be presented in following sections.
In this phase, two deep learning layers, i.e. MLP and inference, are used consecutively. The main advantage of using the associated MLP-inference network as a base network is that the associated deep learning network not only provides the ability to analyze and extract the basic features of the flow, but also calculate and synthesize the important features based on the analysis of the relationship between IPs. More details on the associated deep learning network will be presented later in this paper.
Multi-layer Perceptron (MLP) is a supervised machine learning algorithm, which is a type of Artificial Neural Networks [43]. A general MLP network has n (n≥2) layers (usually, not including the input layer) consisting of one output layer (the nth layer) and n-1 hidden layers. The architecture of a general MLP network is described as follows [43, 44]. Inputs are p-dimensional vectors (x1, x2, . . . , x
p
), output are q-dimensional vectors (y1, y2, . . . , yq). For classification problems, p is the size of the input samples, and q is the number of classes to be classified. Each neuron of one layer is connected to all neurons of the previous layer. The output of each neuron from the previous layer is input to all neurons of the next layer.
The operation process of the MLP network is as follows: at the input layer, neurons receive input signals, process based on the weights and the transfer functions, and then produce the results. The results are transmitted through all neuron layers, from the first hidden layer to the final output layer.
Inference Layer, also known as Walk-base layer, was first introduced in 2018 by Christopoulou et al. [45]. In [46], Christopoulou proposed the use of a walk-base layer to connect the edges in the graph to synthesize the behavior of the edges, that are related to each other, through the vertices in the Relation Extraction problem. In this paper, we propose that the Inference layer can be used right after the MLP network to aggregate and represent the relationships between IPs through the flow network and their behaviors just extracted by the MLP network. The general formula for combining IP edge information is as follows [45]:
The MLP-Inference model builds an IP information profile following the steps as below.
Step 1: Extract flow behavior based on Network Traffic: The purpose of this step is to find a way to aggregate and extract the behaviors and properties of the flows in Network Traffic. Here, the flow features are normalized using the L2-norm method before being input to the MLP model for behavioral synthesis.
Step 2: Synthesize flow behaviors using MLP networks. At this step, 76 features of the flow network extracted from Network traffic will be synthesized by the MLP network to provide new and important features. The flows are first injected into the Normalization layer to normalize the information before being fed into the Fully Connected layer. This process is repeated to obtain the feature vector of flows.
Step 3. Construct an IP information profile based on the flow network using Inference. From the flow characteristics extracted in step 2, each pair of flows coming from the same pair of IP addresses will be synthesized using linear interpolation. This process will be repeated to obtain a vector representing the IP. The result achieved at this step is that each IP will have an information profile that includes all the flows that they generate during the information exchanging process between IPs.
GCN was developed by Thomas Kipf and Max Welling [47], which is a variance of GNN. The characteristic of GCN is to use localized spectral filters on graphs to perform the extraction of subgroups on the graph, thereby to clearly present the graph structure. According to the working principle, the “convolution” method in the GCN layer used to extract features on the neighboring components is similar to the CNN layer [47, 48]. However, since CNN network does not work well on non-Euclidean dataset, in its architecture, GCN network tries to extract attributes on adjacent nodes. Equation (2) below shows the process of propagating the feature representation of a GCN layer in the GCN model.
Where,
A is the adjacent matrix,
X is the feature matrix,
I is the identity matrix having the same size with A,
f is the activation function,
d is the degree matrix of (A + I),
w is the weight matrix, b is the bias matrix,
Z(i) is the output of layer i, Z(0)=X.
At present, GCN is applied in some practice areas such: Node Classification [49], Link Prediction [50], Graph Classification [51], Graph Embedding [47]. In this study, GCN is used to extract features of APT IP based on IP information profile.
In this paper, the GCN network is used to reconstruct the IP behaviors based on IP information profiles. The process is described as follows: IP information profiles are input to the GCN network; the GCN network considers those IP information profiles as vertices of a graph. In this graph, each vertex is one IP while each edge the is relationship between IPs. The GCN network then extracts features of the relationship from the graph between IPs. The output of the GCN layers is a hidden feature representation presenting the connections between the nodes in the graph. Two GCN layers are used in this study. The first GCN layer is responsible for updating the attributes of each node using the information of its neighboring nodes. The second GCN layer has the function of recursively updating the attributes of all the nodes in the graph. In practice, it is possible to use more than 2 layers of GCNs, however, the study in [48] showed that it is possible to use only 2 GCN layers to ensure a balance between efficiency and computational costs. Thus, it can be seen that given an IP information profile graph as the input, the GCN network can extract IP features based on the graph to build a feature vector for each IP. These feature vectors are called IP behavior profiles and they represent the behavior of the all IPs in network traffic. IP behavior profiles show a significant difference between clean IPs and APT IPs in the network traffic.
To classify APT IP behavior profiles from normal IP behavior profiles, two layers, Fully Connected and Softmax Layers, are used. These layers perform the following tasks:
Where, C is the number of classes, z = [z1, z2, …, z C ] is the output vector of GCN network corresponding to the input graph needed to be classified, a i is the probability that the input falls into the ith class calculated by the softmax function.
It should be further noted that the Softmax Regression function is only responsible for calculating the probability of falling into the classes for the input IP, but it does not involve in the feature extraction process. The input IP will be assigned to the class having the highest probability.
Experimental data
The positive-labeled experiment data (attack data) was collected from 29 Network Traffic files in the Malware Capture CTU-13 data-set which contains 6 types of malwares from the APT attacks, including: Andromeda, Colbalt, Cridex, Dridex, Emotet, and Gh0stRAT [42].
The negative-labeled experiment data (normal data) was collected from E-Government server of Soc Trang province [40] according to the scientific research project N° KC.01.05/16-20 of the Ministry of Science and Technology of Vietnam. This dataset was collected on July 30, 2019.
The Table 1 shows the statistic information of experiment data that are collected and used in this paper.
Details of the experimental data
Details of the experimental data
Scenarios for the data
The experimental data-set described in Table 1 is divided into two different subsets, based on which the experiments will be conducted and the accuracy of the proposed models will be evaluated. Specifically, 80% of the data-set is randomly selected into the training subset, and the remaining 20% data is asigned into the testing subset.
Evaluation scenarios
In this paper, three experimental scenarios are conducted to evaluate the efficiency of the proposed APT attack detection model, as follows.
Evaluation metrics
Where: TP - True positive is the number of malicious samples classified correctly. FN - False negative is the number of malicious samples miss-classified as normal. TN - True negative is the number of normal samples classified correctly. FP - False positive is the number of normal samples miss-classified as malicious.
Results for scenario 1
In this scenario, the MIG model is implemented with all layers, i.e. MLP, Inference, and GCN, as designed. The parameters of MLP and GCN networks are fine-tuned, while the aggregated coefficient for Inference layer is set as β=0.7. The coefficient β determines the importance of the flows in the network, i.e. larger β value means that the flows afterward are more informative while small β value implies the flows forward are more important. In this paper, the aggregated coefficient β is empirically set to be 0.7 to obtain the best performance.
The Table 2 below presents the experimental results of MIG model.
APT attack detection results of MIG model
APT attack detection results of MIG model
Table 2 shows that the performance of the MIG model changes when we adjust the number of layers in the MLP and GCN networks. It is noted that the model obtains the most suitable and balanced results when using the MIG model with two MLP layers and two GCN layers. The best performance scores are 99% for Accuracy, 86% for Precision, 84 % for Recall, and 85% for F1 score. Based on the process of changing the structure of the MIG model, it can be seen that: with 1 MLP layer and 1 GCN layer, the model is not deep enough to learn high level features, making the process of constructing IP information profiles as well as extracting IP behaviors cannot be performed effectively, which leads to low APT IP classification results. On the contrary, if three MLP blocks and three GCN are applied, the model becomes more complicated and may lead to overfitting, so the best performance may not be able to obtain. The experimental results also confirm that the use of two GCN layers in the model is good for both classification process and computation complexity as mentioned in [48]. Figure 3 below presents the confusion matrix with the best MIG model setup.
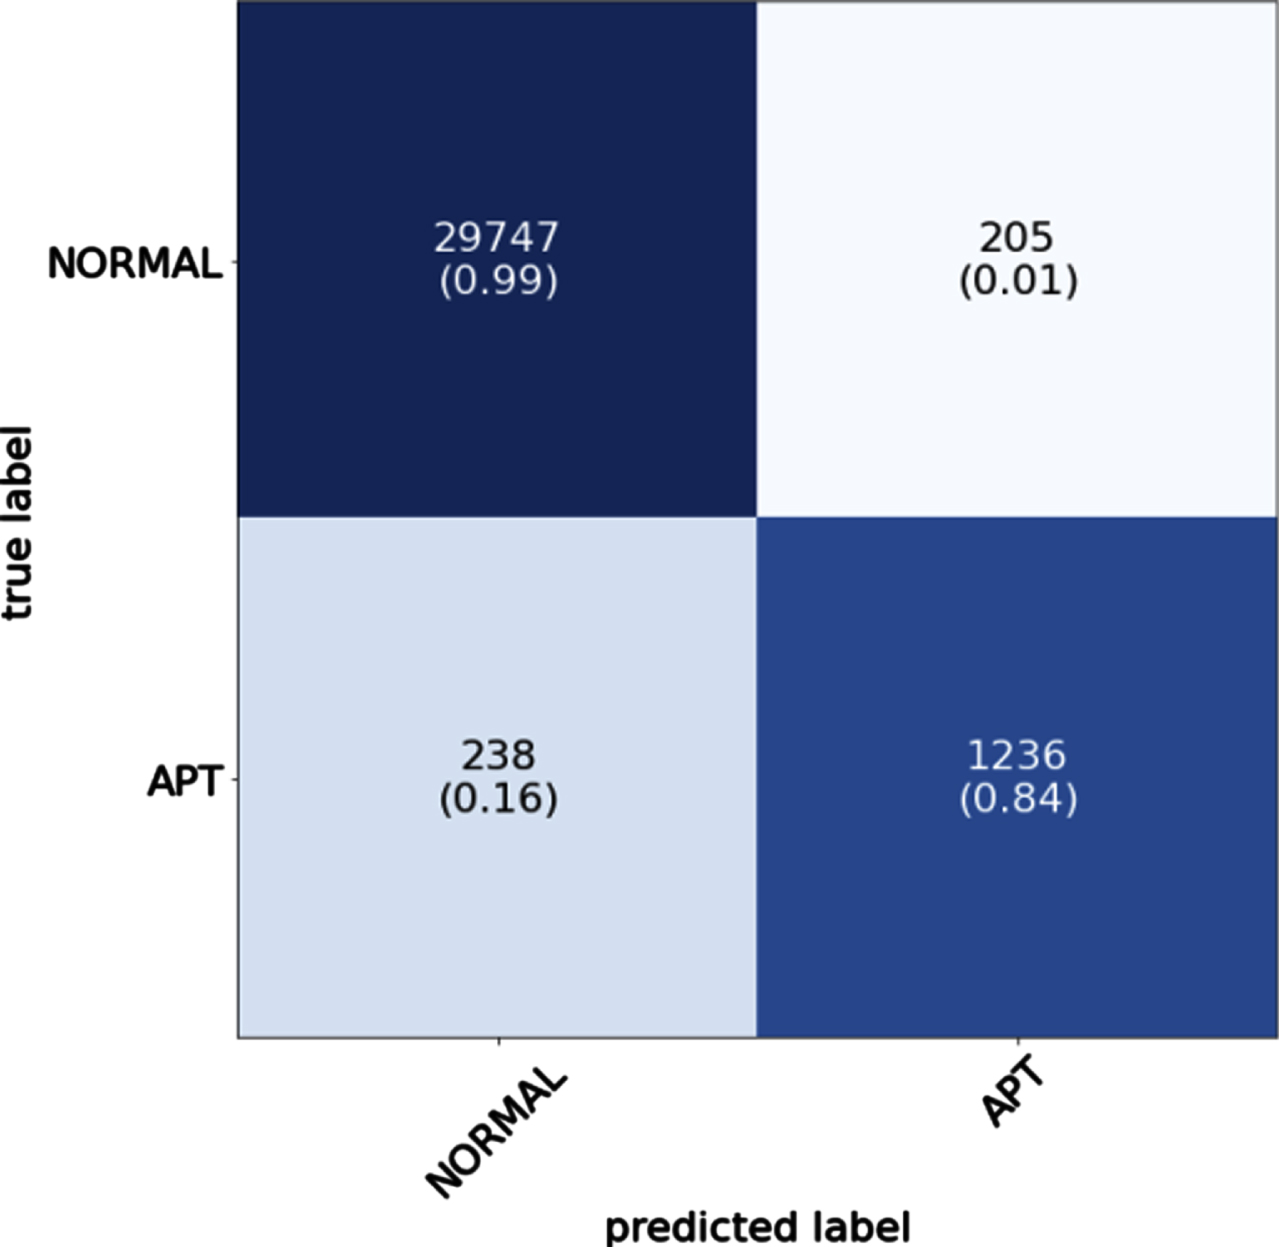
Confusion matrix of MIG model.
Based on the confusion matrix in Fig. 4, the MIG model with the use of the MLP network can synthesize and extract the flow behaviors, thereby improve the accuracy of classification not only for APT IPs but also for normal IPs.
Confusion matrix of the MLP-Mean-GCN model.
In this experiment, the MIG model correctly detected 1236 APT IPs out of a total of 1474 APT IPs, which means it only miss-classified 238 APT IPs. Regarding normal IP prediction performance, the MIG model also achieved very good results when it wrongly detected only 205 IPs out of 29,952 normal IPs. Experimental results presented in Tables 2 3 show that the MIG model obtained a very good efficiency in detecting APT attacks. Although the false detection rates for both APT IPs and normal IPs are not minimized yet, the overall detection performance of the proposed model is still acceptable considering the imbalance of normal and APT data samples in the dataset.
Experimental results of CNN-Inference-GCN model
Table 3 shows some experimental results when replacing MLP network with CNN network. It can be seen that the CNN-Inference-GCN model worked relatively effectively in analyzing and detecting APT attacks since all the model performance evaluation metrics were very high. In addition, different model parameter setups lead to different evaluation results. The best performance scores were obtained with the model architecture having 2 CNNs and 2 GCNs. From the experimental results in Tables 2 3, it can be seen that the CNN-Inference-GCN model had a comparable better performance than the Inference-GCN model. This implies that the CNN network can support the flow feature extraction and synthesis processes very well, which helps bring in a high efficiency to the process of building IP information profiles, thereby helping the GCN network to analyze a lot of important and meaningful information.
Comparing the experimental results from Tables 2 3, it can be seen that the MIG model has a better performance than the CNN-Inference-GCN model. This illustrates that the MLP network is more efficient in synthesizing and extracting the properties of the flow compared to the CNN network. This helps provide a better performance in building IP information profiles, which results in presenting more meaningful and important information to the GCN network for APT detection process.
In recent approaches [21, 31], in order to synthesize information, researchers often applied the methods of averaging using Mean function. In those approaches, the Mean function outputs a value representing many properties while it has the simplest calculation. Mean method helps calculate the value from which the data can be evaluated and the general information can be synthesized. However, at present, with the diverse properties of the data, the calculation using Mean method is not very suitable and effective because it is affected a lot by noises and does not focus on the important features. To overcome this problem, the use of Inference network is recommended. In this experimental scenario, the classification performances are compared and evaluated between the usages of the Inference network and the Mean function during the process of aggregating IP information profiles. The Table 4 below presents the experimental results of the MLP-Mean-GCN model.
Experimental results of MLP-Mean-GCN model for APT attack detection
Experimental results of MLP-Mean-GCN model for APT attack detection
The experimental results in Table 4 show that the MLP-Mean-GCN model is not very effective since the classification evaluation scores for both APT IPs and normal IPs are only about 60% and 70%, respectively. Besides, comparing the best results shown in Tables 2 4, it can be seen that the MIG model has significantly better efficiency compared to the MLP-Mean-GCN model. Specifically, the precision score of the MIG model is higher than that of the MLP-Mean-GCN model by 12%. MIG model also has a higher Recall score than the MLP-Mean-GCN model by 20%. This shows that Mean function is not effective in exploiting important information from flow behaviors. On the contrary, the use of Inference has focused and weighted more on flows with special values as well as on unusual flows since they are very important features to decide whether an IP is an APT attack or not. Assuming an IP has a lot of flows but only one flow is abnormal and is different from the rest, if using Mean to summarize these flows, all the flows are considered as having the same level of importance and contribution, so the irregular flow loses its distinctiveness. This makes it impossible to formulate abnormal IP behavior in the flow networks. When using Inference, the aggregate coefficient β allows for weighting on the importance and the distinctive role of each flow. This helps highlight the characteristics of flows with anomalous information, thereby making the extraction and aggregation of IPs become diverse and complete.
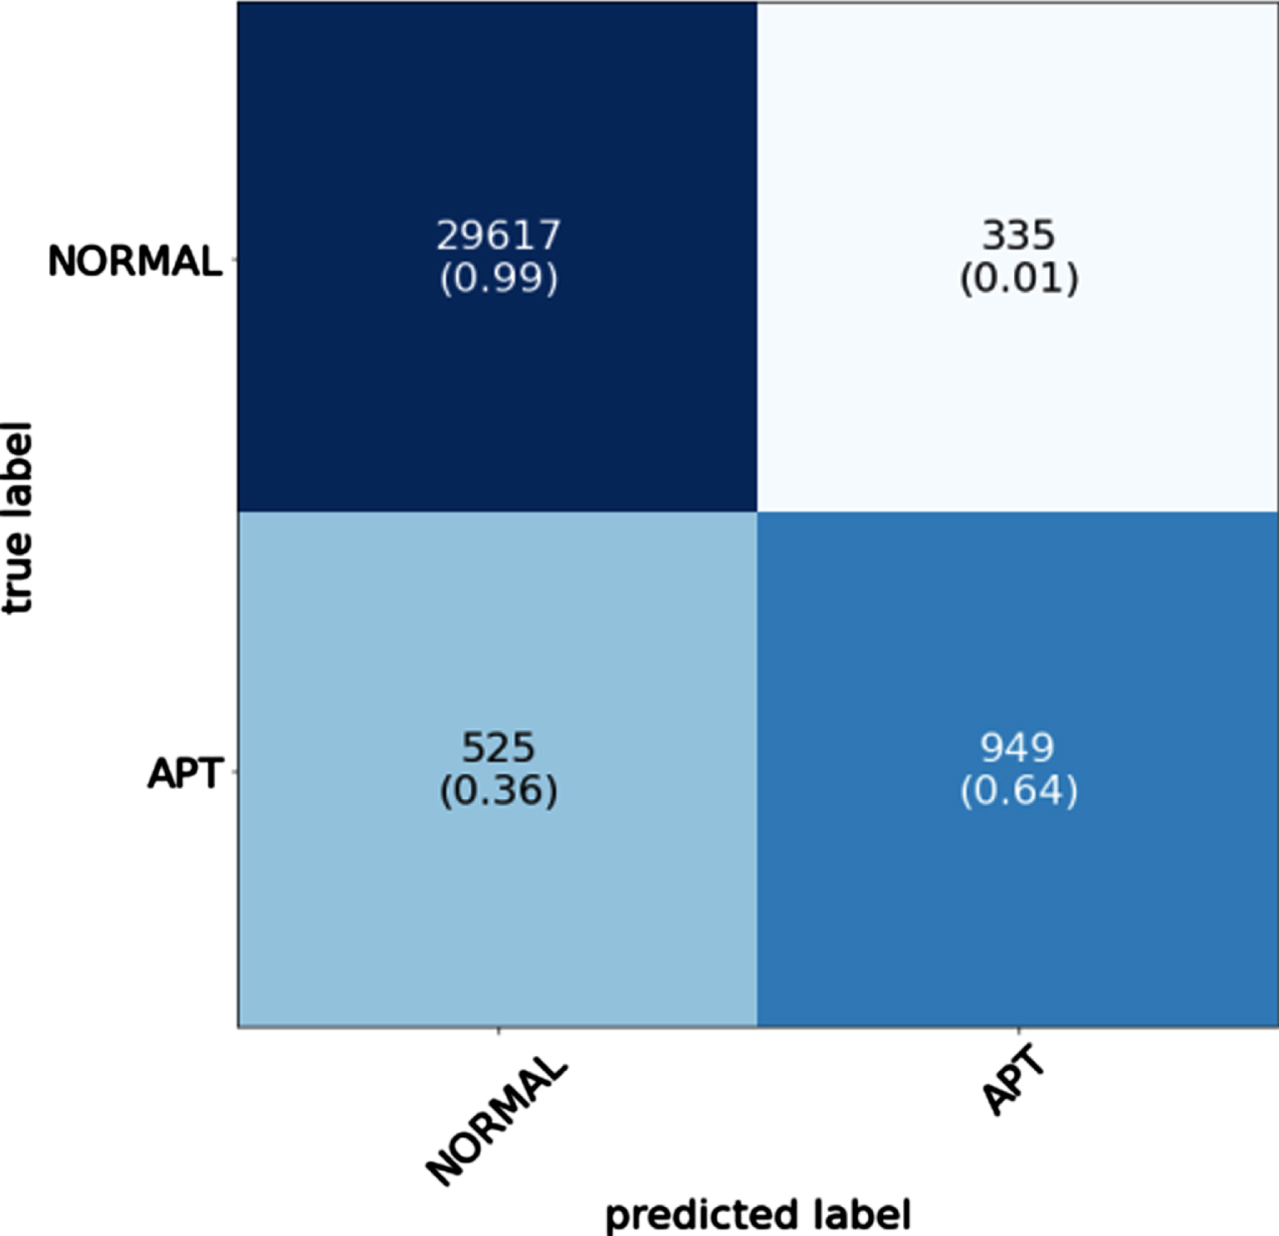
Figure 4 below depicts the confusion matrix of the MLP-Mean-GCN model using mean to formulate the flow behaviors. The confusion matrix of the MLP-Mean-GCN model shows that this model works inefficiently compared to the MIG model on both normal IP and APT IP detection results. Specifically, the misclassification results of the MLP-Mean-GCN model were higher than that of the MIG model by 130 normal IPs (335 normal IPs compared to 205 IPs) and by 287 APT IPs (525 APT IPs compared to 238 APT IPs). The results once again imply that the proposal of using Inference network for synthesizing and highlighting important information about the relationship between edges is correct and scientific.
In this experiment, the GCN layer is replaced by some other networks including Softmax and Fully Connected network. Table 5 below shows the experimental results for these alternative network structures.
APT attack detection performances of different networks replacing GCN
The experimental results in Table 5 show that the Fully Connected network has a slightly better performance than the Softmax function on all evaluation measures.
Comparing the results between Tables 5 and 2, it can be seen that if the GCN layer is replaced by the other networks, the classification results are getting worse. Specifically, the precision measure of the model using GCN is 17% and 15% higher, respectively, than using Softmax or Fully Connected networks. Similarly, the Recall score of the MIG model is also about 21% to 23% higher when GCN layer is applied.
Figure 5 below presents the confusion matrix of the model using fully connected layer.

Confusion matrix of the model using fully connected layer.
The confusion matrix presented in Fig. 5 shows that the correct detection rate of Normal IP is much higher than the correct classification rate of APT IPs (99% for Normal IPs and 63% for APT IPs). This is due to the imbalance nature of the dataset used in the experiments. Specifically, there is a very different number of flows for different IPs, in which some IPs are associated with thousands of flows while some other IPs are associated with only 1 flow. Additionally, smaller number of APT IPs results in less information can be extracted from that type of cyber-attack compared to the out-numbered Normal IPs, which makes it more difficult to classify and identify APT IPs. Overall, the APT IP recall rate of 63% when applying Fully Connected in the model can be seen as an acceptable result.
The result comparison between Figs. 3 and 5 shows that the model using GCN has significantly lower false detection rates. Specifically, GCN can reduce nearly 200 APT IPs and 300 normal IPs falsely classified compared to the model using Fully connected layer. These results demonstrate the advancement of the MIG model and prove that our approach is correct and reasonable.
The experimental results in scenarios 1 and 2 show the superiority of the MIG model compared to some state-of-the-art models for APT attack detection. In this scenario, the MIG model will be evaluated and compared with some approaches proposed in other studies. Specifically, we will compare MIG model with 2 models from 3 other studies, including CNN-LSTM [30, 31] and BiLSTM-GCN [31] models. Table 6 below shows the best results of these two models when conducting the experiments.
Experimental results of APT attack detection for some other approaches
Experimental results of APT attack detection for some other approaches
As shown in Table 6, the best performance for the CNN-LSTM model is obtained with the 3CNN-2LSTM configuration, while for the BiLSTM-GCN model, the best results can be achieved with the 2BiLSTM-2GCN configuration. Additionally, it can be seen that the BiLSTM-GCN model is more effective than the CNN-LSTM model in APT IP classification because its performance scores are all from 1% to 22% higher. Comparing the results of Table 6 with Table 4, it can be seen that the MIG model proposed in this study has the best performance over the other two models. Specifically, compared with the CNN-LSTM model, the MIG model was better on all performance measures by from 3% to 44%. Especially, its recall measure is almost twice as high (about 44%), and the precision score is also about 21% higher. The possible reason for this advancement is that, during the experimental process, the CNN-LSTM model only performed the analysis for each flow, so it cannot utilize the usefulness of the CNN network as well as the LSTM network. Furthermore, for the BiLSTM-GCN model, although there is the support from the GCN network during the IP classification process, since the BiLSTM network cannot synthesize the properties of IP as well as the MLP-Inference model does, it still cannot obtain good classification performance for both normal IPs and APT IPs. In a more detailed comparison on all performance measures, the MIG model is completely better than the BiLSTM-GCN model in all respects. Specifically, the Recall score of BiLSTM–GCN model is 62%, which is smaller than that of MIG model by 22 %. Regarding the ability to correctly detect normal IP, the BiLSTM–GCN model is also not as good as MIG model, where the correction rate difference is 13%. Comparing the experimental results of the 3 experimental scenarios, it can be seen that the MIG model outperforms the two other models in detecting APT attacks based on Network traffic data.
From 3 experiment scenarios with different system settings, MIG model has been shown to be better than some other APT attack detection approaches. The effectiveness of the MIG model comes from two reasons. First, the MLP-Inference combination model has actively supported the task of finding and extracting important information of the flow network, helping the process of building IP information profiles to be complete and accurate. This is a very important task because, based on the data presentation in Table 1, it can be seen that there is a huge difference and unbalance between normal flows and abnormal flows. Specifically, the number of dangerous flows only accounts for a very small percentage, of about 0.22%, of the total flow. Besides, out of a total of more than 7000 IP APTs, the number of toxic flows generated is only about 19 thousand. This shows that IP APTs typically generate very small number of flows. This statement is completely consistent in practice because the purpose of APT is to steal and transfer data out, so they do not generate many activities. With such unbalanced data sets, the construction and synthesis of IP information profiles is decisive for the classification and evaluation of those IPs. Second, GCN model supports the extraction and analysis of IP behaviors to build a behavioral profile of each IP. It is clear that with the huge difference in ratio of normal IP (95.31%) and APT IP (4.69%), which is of more than 20 times, any classification model will have difficulty in dealing with unbalanced dataset. However, GCN network makes it possible to extract important behaviors in the IP information records, thereby not only improving the ability to accurately detect APT IPs, but also ensuring the correct classification of Normal IPs. It is clear that with the correct classification rate of APT IP and normal IP of 84% and 86%, respectively, the experimental results have demonstrated the efficiency of the proposed model. From the experimental results, we believe that the MIG model is fully capable of being applied to APT attack surveillance systems in practice because it meets the two requirements of the surveillance system, which are the capability of performing big data analysis and efficiency for disparate datasets. In addition, based on the change of parameters in the proposed models, we want to provide options for the APT attack monitoring system when it is necessary to trade-off between computation time and efficiency. In other words, it is not necessarily always true that the more layers and complex network architectures used, the better the results can be obtained.
Conclusions
In this paper, with the goal of proposing a new method to improve the efficiency of APT attack monitoring and detection, we have succeeded in combining MLP, Inference, and GCN networks into one complete and unified model. Specifically, the new MIG model has accomplished two main tasks, including: i) synthesizing and constructing IP information profiles; ii) extracting IP behavior profiles. For the problem of synthesizing and building IP information profiles, the MIG model with the support of 2 networks MLP and Inference has successfully extracted and reconstructed IP information based on the flow network. In particular, the proposal of the Inference layer right after the MLP network has been highly effective when it helps highlight the important and unusual information of the flow network, thereby completely synthesizing an information profile of each IP. The IP information profiles built through the MLP-Inference model show the difference between normal IPs and attack IPs, thereby helping to improve the efficiency of the APT IP detection process. This is a breakthrough proposal in the task of reconstructing IP information based on network flow in network traffic because it not only shows the components of IP but also shows the cross correlation. Regarding IP behavior profile construction process based on its information profile, the MIG model with the support of GCN network successfully extracts important IP information based on the relationships between IPs. Successfully building a behavior profile of each IP is very important to help the monitoring system generalize the anomalous behavior of IP, thereby improving the ability to accurately detect the attack. Finally, the experimental results in section 4.4 have shown that our approach is not only meaningful in terms of scientific content but also applicable in real systems when the MIG model has yielded better results than other models on all performance measurements. In addition, our proposed method also opens up new research directions and approaches for other anomalous detection tasks based on network traffic such as malwares, unauthorized intrusion, insider, botnet... In the future, in order to improve the ability to detect APT attacks based on Network traffic, it is suggested to focus on 2 main issues, including: i) methods to construct and synthesize information profiles; ii) methods to analyze information behavior profiles.
Footnotes
Acknowledgment
This work was sponsored by the Posts and Telecommunications Institute of Technology, Vietnam.