
Abstract
Pancreatic tumor is the deadliest disease which needs earlier identification to reduce the mortality rate. With this motivation, this study introduces a Multi-Objective Metaheuristics with Intelligent Deep Learning Model for Pancreatic Tumor Diagnosis (MOM-IDL) model. The proposed MOM-IDL technique encompasses an adaptive Weiner filter based pre-processing technique to enhance the image quality and get rid of the noise. In addition, multi-level thresholding based segmentation using Kapur’s entropy is employed where the threshold values are optimally chosen by the barnacles mating optimizer (BMO). Besides, densely connected network (DenseNet-169) is employed as a feature extractor and fuzzy support vector machine (FSVM) is utilized as a classifier. For improving the classification performance, the BMO technique was implemented for fine-tuning the parameters of the FSVM model. The design of MOBMO algorithm for threshold selection and parameter optimization processes shows the novelty of the work. A wide range of simulations take place on the benchmark dataset and the experimental results highlighted the enhanced performance of the MOM-IDL technique over the recent state of art techniques.
Keywords
Introduction
Pancreatic tumors are considered to be extremely poor prognoses amongst each type of tumor. But, a favourable standard long-term survival rate of 80.4% at five years has been stated in persons with tumors of lesser than one cm in diameter [1]. Computer aided diagnosis (CAD) models are developed to assist radiologists in the detection and diagnostic process of several diseases. The recently developed deep learning (DL) approaches are also found useful to design CAD systems to fulfill healthcare requirements. At the same time, segmentation of pancreatic tumor segmentation using computed tomography (CT) images remains a challenging issue. Hence, the precise detections of tiny tumors are significant to reduce the death rates of pancreatic tumors. Modality has been employed to diagnose imaging of pancreatic tumors include positron emission tomography CT, contrast enhanced abdominal computed tomography (CT), transabdominal ultrasound (US), magnetic resonance imaging (MRI), and endosonography (EUS). Amongst this modality, EUS allows observance of the pancreatic tumor with higher spatial resolutions, and tumour detection rate is stated to be greater compared to contrast-enhanced CT and US [2]. But, the diagnostic performances of EUS depend mainly on the technical abilities and experience of the endosonographer. It has been stated that endosonographers need to undergo a minimal of 150 supervised EUS processes, involving EUS directed fine needle aspiration (EUS-FNA) and pancreaticobiliary EUS, for gaining complete proficiency in each aspect of EUS. Hence, EUS implemented with an endosonographer using inadequate experience might lead to insufficient misdiagnosis/detection of lesion [3]. Although, experts perform EUS, carelessness, and fatigue sometimes lead to the misdetections of tumors. The applications of artificial intelligence (AI) for medical diagnosis has been proposed at the beginning of 1980 s, and recently computer assisted diagnosis (CAD) systems with deep learning (DL) approaches were applied to support physicians for improving the efficiency of the understanding of several medical imaging data’s [4]. The usage of AI in image detection largely performs 2 significant parts: CAD for the representation of lesions and optical biopsies and CAD oflesions.
The AI approach could assist in improving the accuracy of image understanding and create diagnostic proficiency more easily accessible [5, 6]. But, AI techniques for detecting pancreatic tumors aren’t developed well since the tasks are extremely difficult. Initially, the targets are very different in location, shape, and size and occupy only a tiny fraction of the whole CT images. The residual information is from another organ like stomach, liver, image background, and intestines that hardly influence the diagnoses using the AI models. Further, a tumor higher comparison to the nearby tissues additionally decreases accuracy and diagnostic efficacy [7]. Then, the absence of appropriate pancreas image datasets directly affects the development of an AIapproach.
The DL using convolutional neural networks (CNNs) has shown considerable potential in medical image analyses [8]. The structure of neural network (NN) is depending on stacking of neurons made up of activation function and parameters for integrating and extracting features from the image and found a method which takes the difficult relationships among diagnoses and images. CNN is stated to attain a higher accuracy in the imaging diagnoses of several situations involving, diabetic retinopathy, liver masses, and skin tumor [9]. But, the possible advantages of CNN for the diagnosis and detection of pancreatic tumor hasn’t been extensively studied. Mostly pancreatic tumor presents with ill-defined margins and irregular contours on CT and hence are frequently obscure at an earlier phase, pose considerable problems for the highly experiencedradiotherapist [10].
The major contributions of the paper is given as follows. This study introduces a Multi-Objective Metaheuristics with Intelligent Deep Learning Model for Pancreatic Tumor Diagnosis (MOM-IDL) model. The proposed MOM-IDL technique encompasses an adaptive Weiner filter based preprocessing technique for enhancing the image quality and eradicating the noise. Moreover, multi-level thresholding based segmentation using Kapur’s entropy is employed where the threshold values are optimally chosen by the barnacles mating optimizer (BMO). Furthermore, densely connected network (DenseNet-169) is employed as a feature extractor and fuzzy support vector machine (FSVM) is utilized as a classifier. The design of MOBMO algorithm to optimally select the threshold value for multi-level segmentation and parameter tuning of the FSVM model helps to considerably boost the classification performance. For highlighting the betterment of the MOM-IDL technique, an extensive experimental analysis takes place.
The rest of the paper is organized as follows. Section 2 offers the literature review, Section 3 provides the proposed model, Section 4 explains the performance validation, and Section 5 concludes the work.
Related works
Tonozuka et al. [11, 24] proposed an original CAD scheme with DL analyses of EUS images and measured its capacity for detecting PDAC, by means of control images from the persons with NP and CP.Liu et al. [12]. This proposed designed for investigating either the CNN can differentiate individuals with and without pancreatic cancers on CT related radiotherapist analysis. Images are pre-processed to patches, and a CNN has been trained for classifying patches as non-cancerous/cancerous. Individuals are categorized as without/with pancreatic cancers based on the amount of patches detected as cancerous using CNN, with a cut-off defined by the validation and training sets. Further, The CNN was tested using another local test set (101 persons with 88 controls and pancreatic cancer; local test set 2) and US datasets (82 controls and281 pancreatic cancers).
Si et al. [13] applied a training dataset of 143,945 dynamic contrast enhanced CT images of the abdomen from 319 persons. The presented method consists of 4 phases: pancreas location, image screening, pancreatic tumor diagnosis, and pancreas segmentation. Also, they determined a full end to end DL method to diagnose pancreatic tumors and suggesting treatments. These models consider original abdominal CT images with no manual pre-processing.Ma et al. [14] detect pancreatic cancers in CT images manually by making CNN classifiers. They determined 3 datasets from this image based on the image stages, calculated the method regarding binary classifications (viz., with or without cancer) and ternary classifications (viz., without cancer, cancer at body/tail, cancer at neck or head of the pancreas) with tenfold cross validations.
In Muhammad et al. [15, 25], an ANN method was tested, developed, and trained with the healthcare data of 800,114 respondent captures in the PLCO and NHIS datasets, having 898 persons detected with pancreatic cancers. The forecast of pancreatic cancer risks was calculated at a single stage by integrating eighteen features into the NN. Xuan and You [16] introduces a DL method based HCNN algorithm for detecting pancreatic tumors. RNN approaches are given for meeting the issues of spatial discrepancy segmentations through slices of nearby images. The RNN creates CNN results and finetunes its segmentation by enhancing the shape and smoothness.
Hussein et al. [17, 26] presented unsupervised and supervised ML methods for improving tumors classification. The initial method depends on supervised learning where they determine considerable benefits with DL algorithm, mainly with three dimensional CNN and TL methods. Inspired by the radiologist interpretation of the scan, demonstrate an incorporation task based feature representation to CAD systems through a graph regularised sparse multitask learning architecture. Next, examine an unsupervised learning method for addressing the limited accessibility of labelled training data, general problems in medical imaging applications. Stimulated by learning from label proportion approach in CV, proposed for using proportion SVM to characterizetumor.
In Sekaran et al. [18], the DL approach called CNN method is applied for predicting the cancer image of the pancreas, i.e., implanted with approach of Gaussian Mixture method using EM algorithms for predicting the important features from CT scan and predict the percentage of cancer spreads in the pancreas using the threshold parameter takes as a marker.Chang et al. [19] proposed a DeepNC approach with combined histopathology and immunofluorescence image (for labels) and demonstrates its classification predictions power. Such approaches could resolve a present problem on discrepancies among transcriptomic/genomic and pathology based tumors purity estimates by enhancing histological assessment.
The proposed MOM-IDL technique
In this study, a new MOM-IDL technique is derived for detecting and classifying the existence of pancreatic tumors. The workflow of the MOM-IDL technique is illustrated in Fig. 1. The proposed MOM-IDL technique encompasses different levels of operations namely WF based pre-processing, BMO-KE based segmentation, DenseNet 169 based feature extraction, FSVM based classification, and BMO based parameter optimization. The detailed working of these processes is elaborated in the following sections.
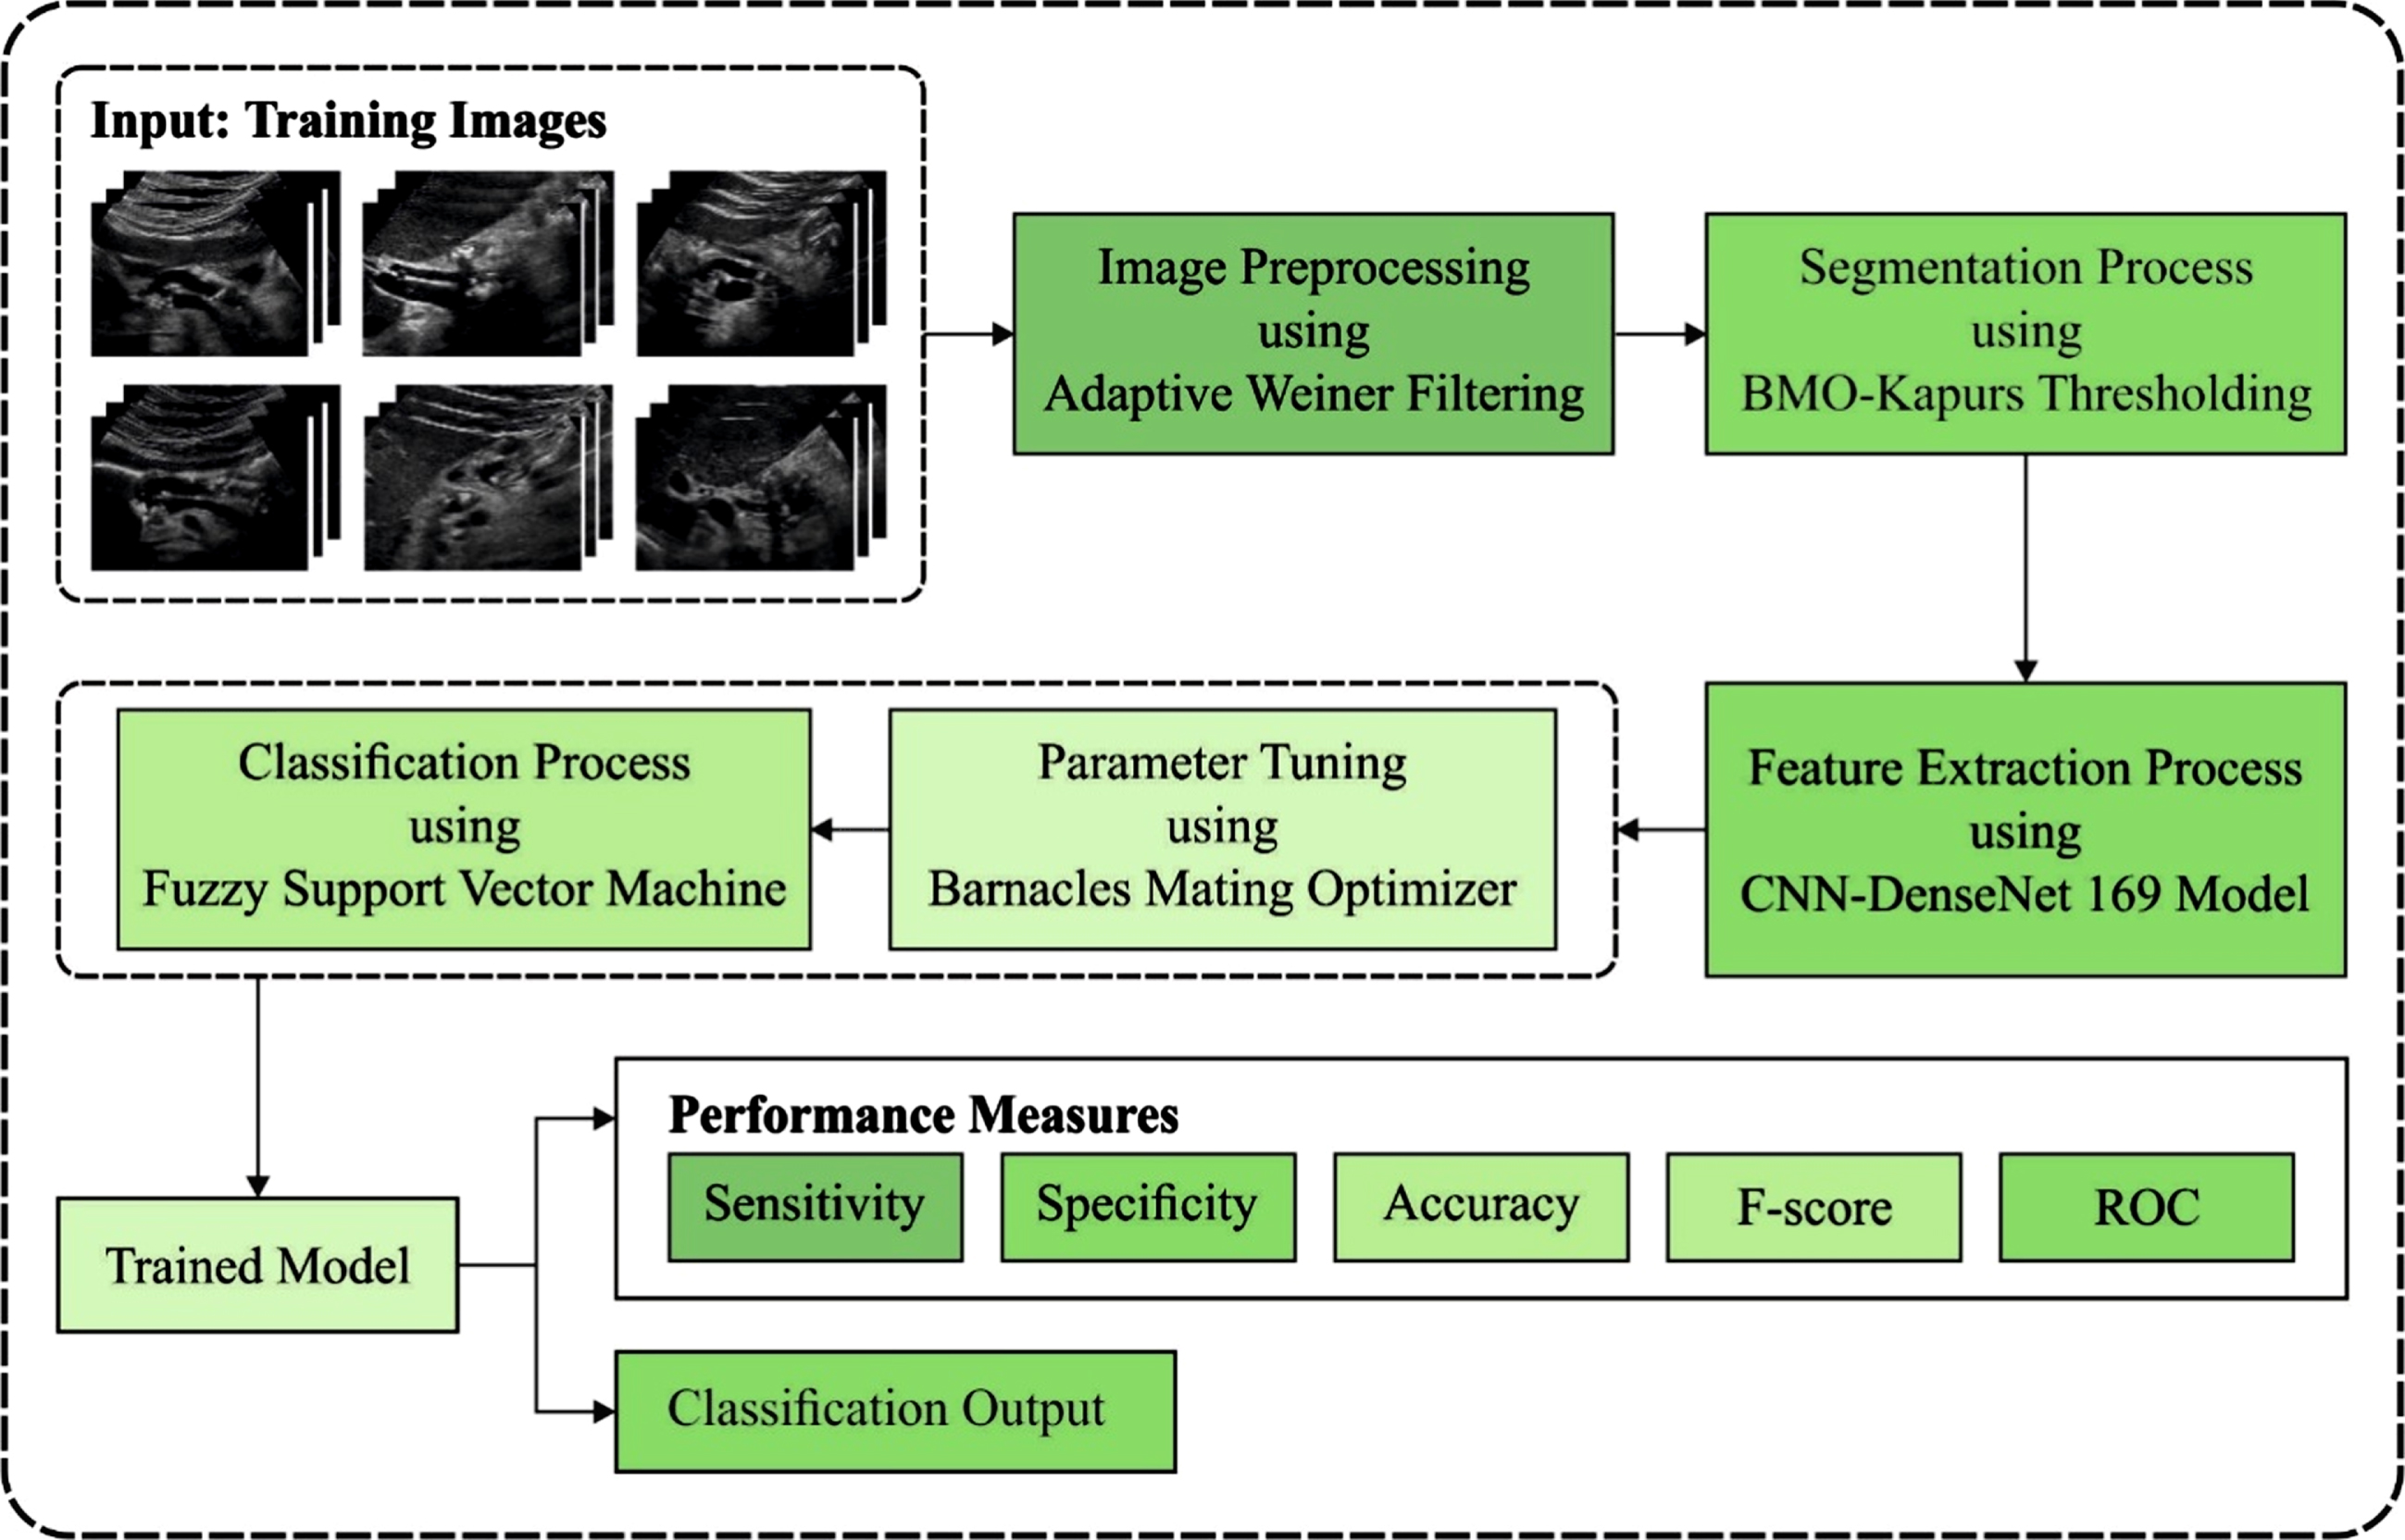
Overall process of MOM-IDL model.
Initially, the Weiner filter (WF) is employed as a pre-processing tool for pancreatic tumor diagnosis. The WF is a new linear filter proposed by Norbert Wiener in 1942. The WF technique is chosen over other methods due to following reasons. It executes an optimum trade-off among inverse filtering and noise smoothening. It will remove the additive noise and overturns the blurring concurrently.
The aim is to minimize the MSE amongst the foreseeable actual output and noise free signals. Hence, it cannot be adopted and executed continuously in frequency domain. Generally, consider f (x, y) represents the input image and g (x, y) denotes the degraded image with few points spread function h (x, y) and additive noise (x, y). Thus, in spatial domain, the blurred image can be expressed by:
Let E be the arithmetical form. In the frequency domain, the optimized solutions are given by:
In which H* (u, v) means the difficult conjugate of H (u, v), S η (u, v) determines the power spectrum of noise and S f (u, v) signifies the power spectrum of original image. While (S η (u, v)/S f (u, v)) is higher, the WF is lower, hence the frequency can be neglected.
Kapur’s image segmentation is first developed in 1985 for segmenting the preprocessed images through the entropy of histogram [20]. A familiar entropy-based thresholding method is the Kapurthresholding method. The criterion to elect an appropriate threshold is maximizing Kapur’s entropies depending upon gray-level histogram. Such approaches find the optimum T that maximizes the entire entropy. Let represents a vector of the image threshold. Subsequently, Kapur’s entropy would be represented as follows.
Commonly, every entropy is calculated individually according to the certain t value. For multilevel thresholding problems, it could be given by;
The barnacles are microorganisms which assign themselves to objects from the water. The long penis is an important feature. Its mating group contains every neighbor as well as competitor in the influence of its penis. The barnacle mating optimizing was simulated as the mating procedure of barnacles. With simulating 3 procedures (for instance, initialization, selection model, and reproduction), the practical optimized issue was resolved. A briefly are explained as follows [21]:
Initially, it can be supposed that the candidate solution has been barnacle, in which the matrix of population is written utilizing in Equation (6). The estimation of population and sorting model is completed for locating the optimum solution until at the top of X. Afterward, the parent that exists mated were elected in Equations (7) and (8).
As there are no detailed formulas for deriving the reproduction procedure of barnacles, the BMO emphasizes the genotype frequency of parents for producing the offspring dependent upon Hardy–Weinberg rule. It can be worth importance that the length of its penises (pl) roles a vital play in determining the exploitation as well as exploration models. Considering pl = 7, it could be realized that barnacle #1 can only mate with most barnacles #2-#7. When the selective of barnacles that exist mated in the range of pl of Dad barnacle, the exploitation model has happened. Equation (9) is presented for producing novel variables of offspring in the barnacle parent.
When barnacle #1 elects barnacle #8, it can be over restrict. Therefore, the normal mating procedure doesn’t happen. Here, the offspring was formed by sperm cast model. In BMO, the sperm cast has been assumed as the exploration method that is written as:

Flowchart of BMO.
Where, rand (X) refers the arbitrary number amongst 0 and 1.
It could be realized in Equation (10) which the novel offspring was created by Mum barnacle as it achieves the sperms which are released as to water by another barnacle away. In the iteration, the place of barnacle was upgraded based on Equation (9) or Equation (10). Lastly, the BMO is determined for approximating the global optimal to optimizedissues.
A dense CNN, also called as DenseNet is used for extraction of the features of the segmented image. All layers affect each other layers in a feed forward way. A DenseNet block includes 5 layers. The initial 4 layer denotes dense layers, and the latter is a transition layer. When the growth rate value is (k) for all the layers, it is four for these dense blocks. In the transition layer, it consists of 2×2 average pool using a 1×1 conv and a stride of two. In the dense layer, it consists of 3×3 and 1×1 conv using astride of 1.
The first layer of DL network captures generic features, whereas last one focuses on task specific features. Following weights from the ImageNet to pre-trained the model, they leverage prior learning of generic feature capture in the first layer and reduces the training data requirement. The architecture employed in these studies employ model parameter better and utilize lesser data to train compared to other frameworks and have a low tendency for overfitting to training the data [22]. DenseNet-169 model is depending upon the DenseNet structure. While the classical convolution network using L layers has L connection - one among every layer and its succeeding layers— DenseNet has L (L + 1)/2 direct connection. For all the layers, the feature map of each preceding layer is applied as an input, make DenseNets highly compact model with higher features reutilize over the network.
In the training procedure, image X from the training datasets is fed to the M model, i.e., determined using its parameter β. The output of the models is related to the training labels which correspond to the input images, the losses are calculated, and the models are upgraded by a novel parameter. In order to initiate the training procedure, models are started with weight pretrained on ImageNet, a huge CV database.
Figure 3 depicts the framework of DenseNet-169 model. In the DenseNet-169 architecture, the last fully connected layer was eliminated, in its defect, a 256 node fully connected layer was created, then a 128 node FLC and at the end a 10 class FLC with softmax activation for the output. All but the final layer used ReLU activation.
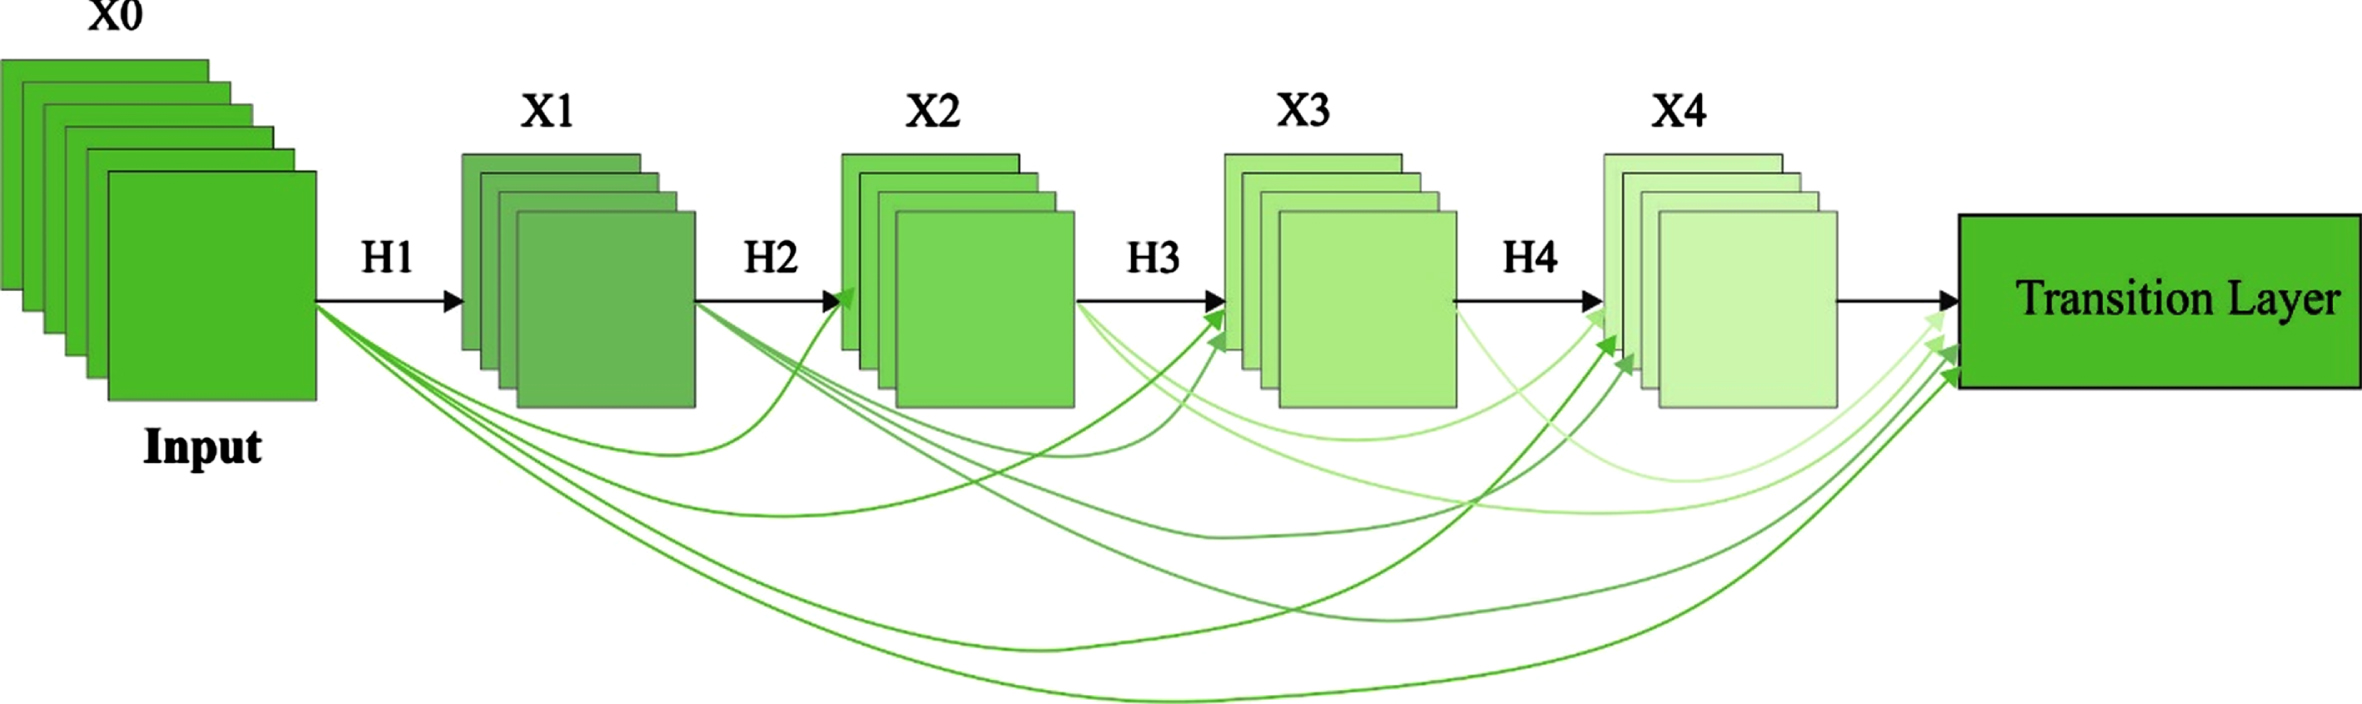
Structure of DenseNet-169 model.
Afterward pretraining, the weights are fine-tuned by the training data. Pretraining and fine-tuning, decrease the time taken for the models to converge. Also, it assists in normalizing the method for reducing overfitting. In the iterative training procedure, a softmax activation function was employed on the estimations beforehand the loss was computed. Cross entropy has been applied as the loss function to be optimized.
The FSVM model receives the feature vectors as input and performs classification process. In standard SVM, every data point is assumed with equivalent significance and allocated the similar penal parameter from their objective functions. But, in several real-world classifier applications, any instance points like the outlier/noise, could not be exactly allocated to one of these 2 classes, and all instance points don’t have a similar meaning to decision surface [23]. The fuzzy membership for all instance points is established such that distinct instance points can generate various influences to the structure of decision surface.
Let the training instances are

Hyperplane of SVM.
For resolving the FSM optimum issue, (12) has been altered as to the following dual issue by presenting Lagrangian multipliers αi:
Related to the typical SVM, the beyond statement only has little variance that is upper bound of the values of α i . With resolving this dual issue from (13) for optimum αi, w and b are improved in a similar manner as in the classic SVM. In order to tune the parameters of the FSVM model, the BMO algorithm is applied and thereby raises the classification performance.
This section assesses the pancreatic tumor diagnostic performance of the MOM-IDL technique. The proposed model is simulated using Python 3.6.5 tool and the images are tested using CT images. Figure 5 demonstrates the sample images.
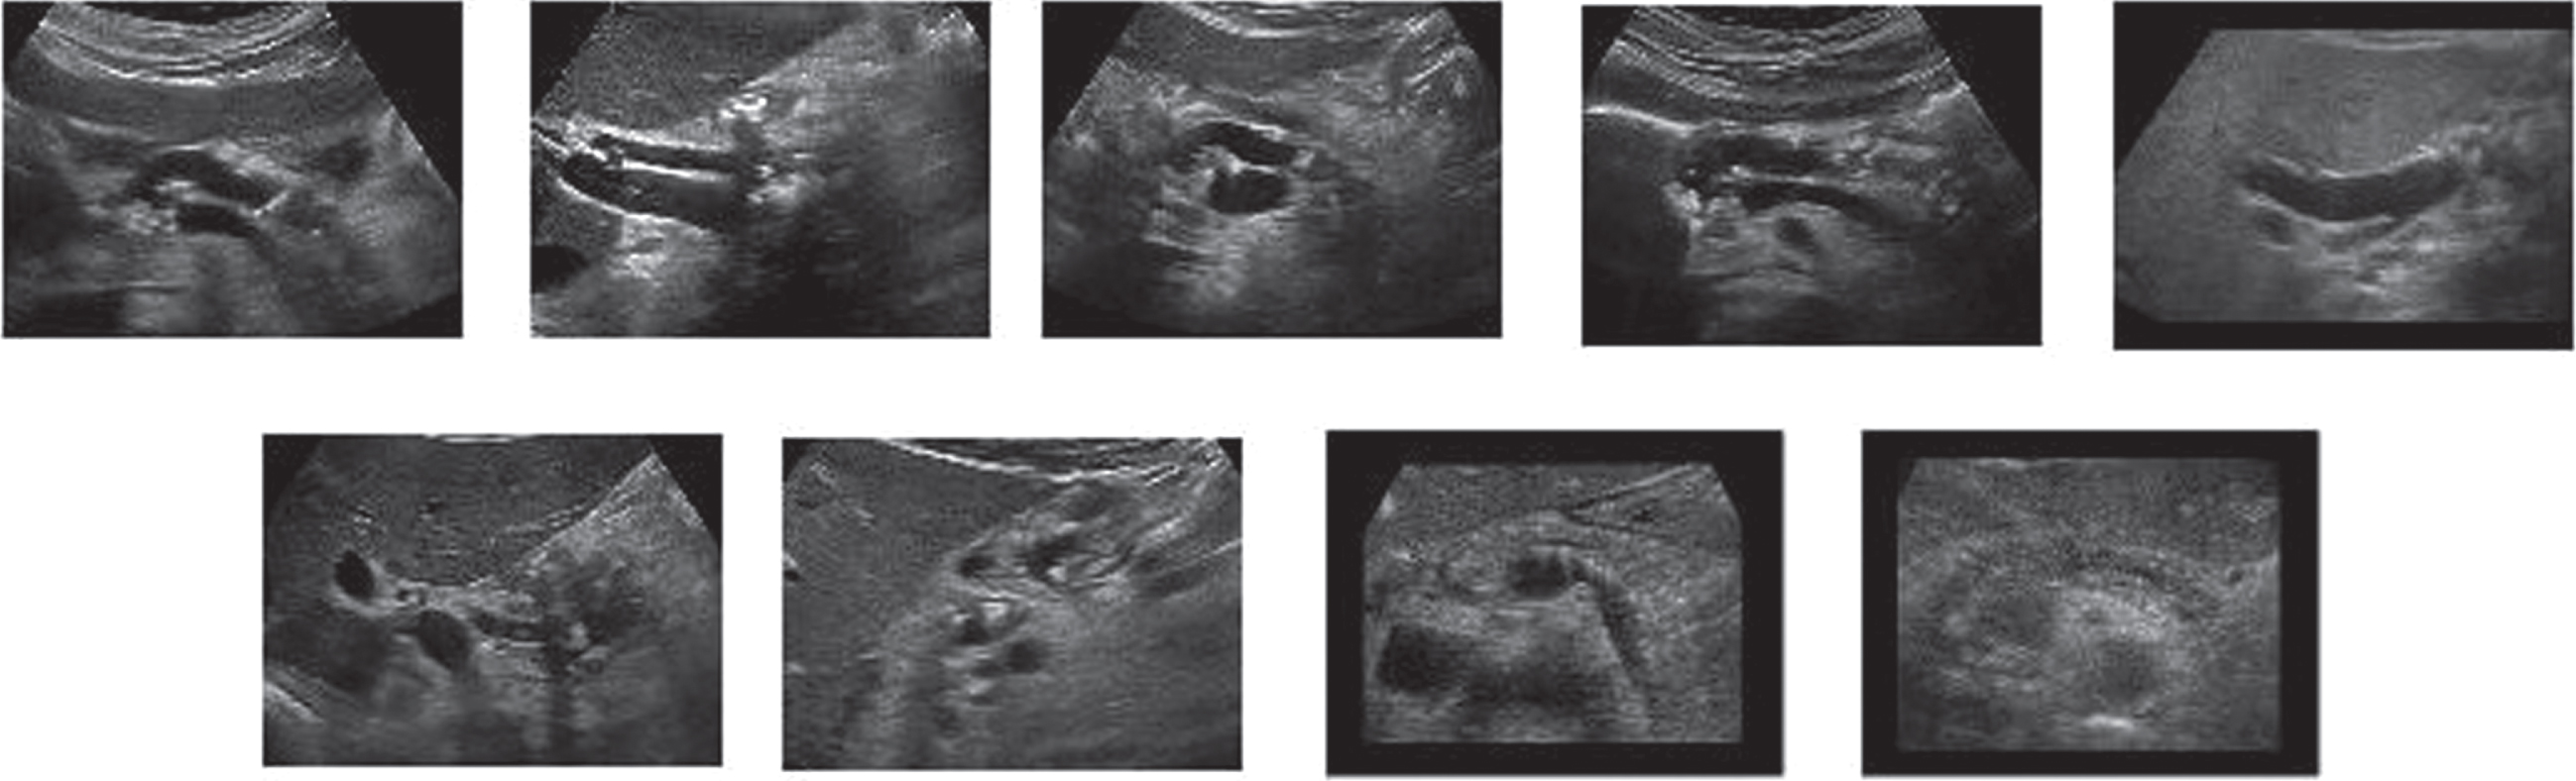
Sample images.
Table 1 and Fig. 6 depict the overall classification results of the MOM-IDL technique under ten distinct runs. The table values demonstrated that the MOM-IDL technique has gained improved diagnostic performance under all the test runs. For instance, with run-1, the MOM-IDL technique has offered a sensitivity of 98.17%, spec. of 98.37%, acc. of 98.27%, and F-score of 99.29%. In addition, with run-2, the MOM-IDL method has obtainable a sensitivity of 98.58%, spec. of 98.14%, acc. of 98.09%, and F-score of 99.09%. Also, with run-3, the MOM-IDL manner has accessible a sensitivity of 99.04%, spec. of 98.37%, acc. of 99.34%, and F-score of 98.28%. Additionally, with run-4, the MOM-IDL algorithm has offered a sensitivity of 98.37%, spec. of 99.33%, acc. of 99.44%, and F-score of 98.59%.
Besides, with run-5, the MOM-IDL technique has existed a sensitivity of 98.19%, spec. of 98.01%, acc. of 99.42%, and F-score of 99.21%. Moreover, with run-6, the MOM-IDL system has presented a sensitivity of 99.18%, spec. of 99.20%, acc. of 98.55%, and F-score of 99.29%. Furthermore, with run-7, the MOM-IDL methodology has accessible a sensitivity of 98.17%, spec. of 98.32%, acc. of 99.27%, and F-score of 98.37%.
Result Analysis of proposed MOM-IDL model in terms of different measures
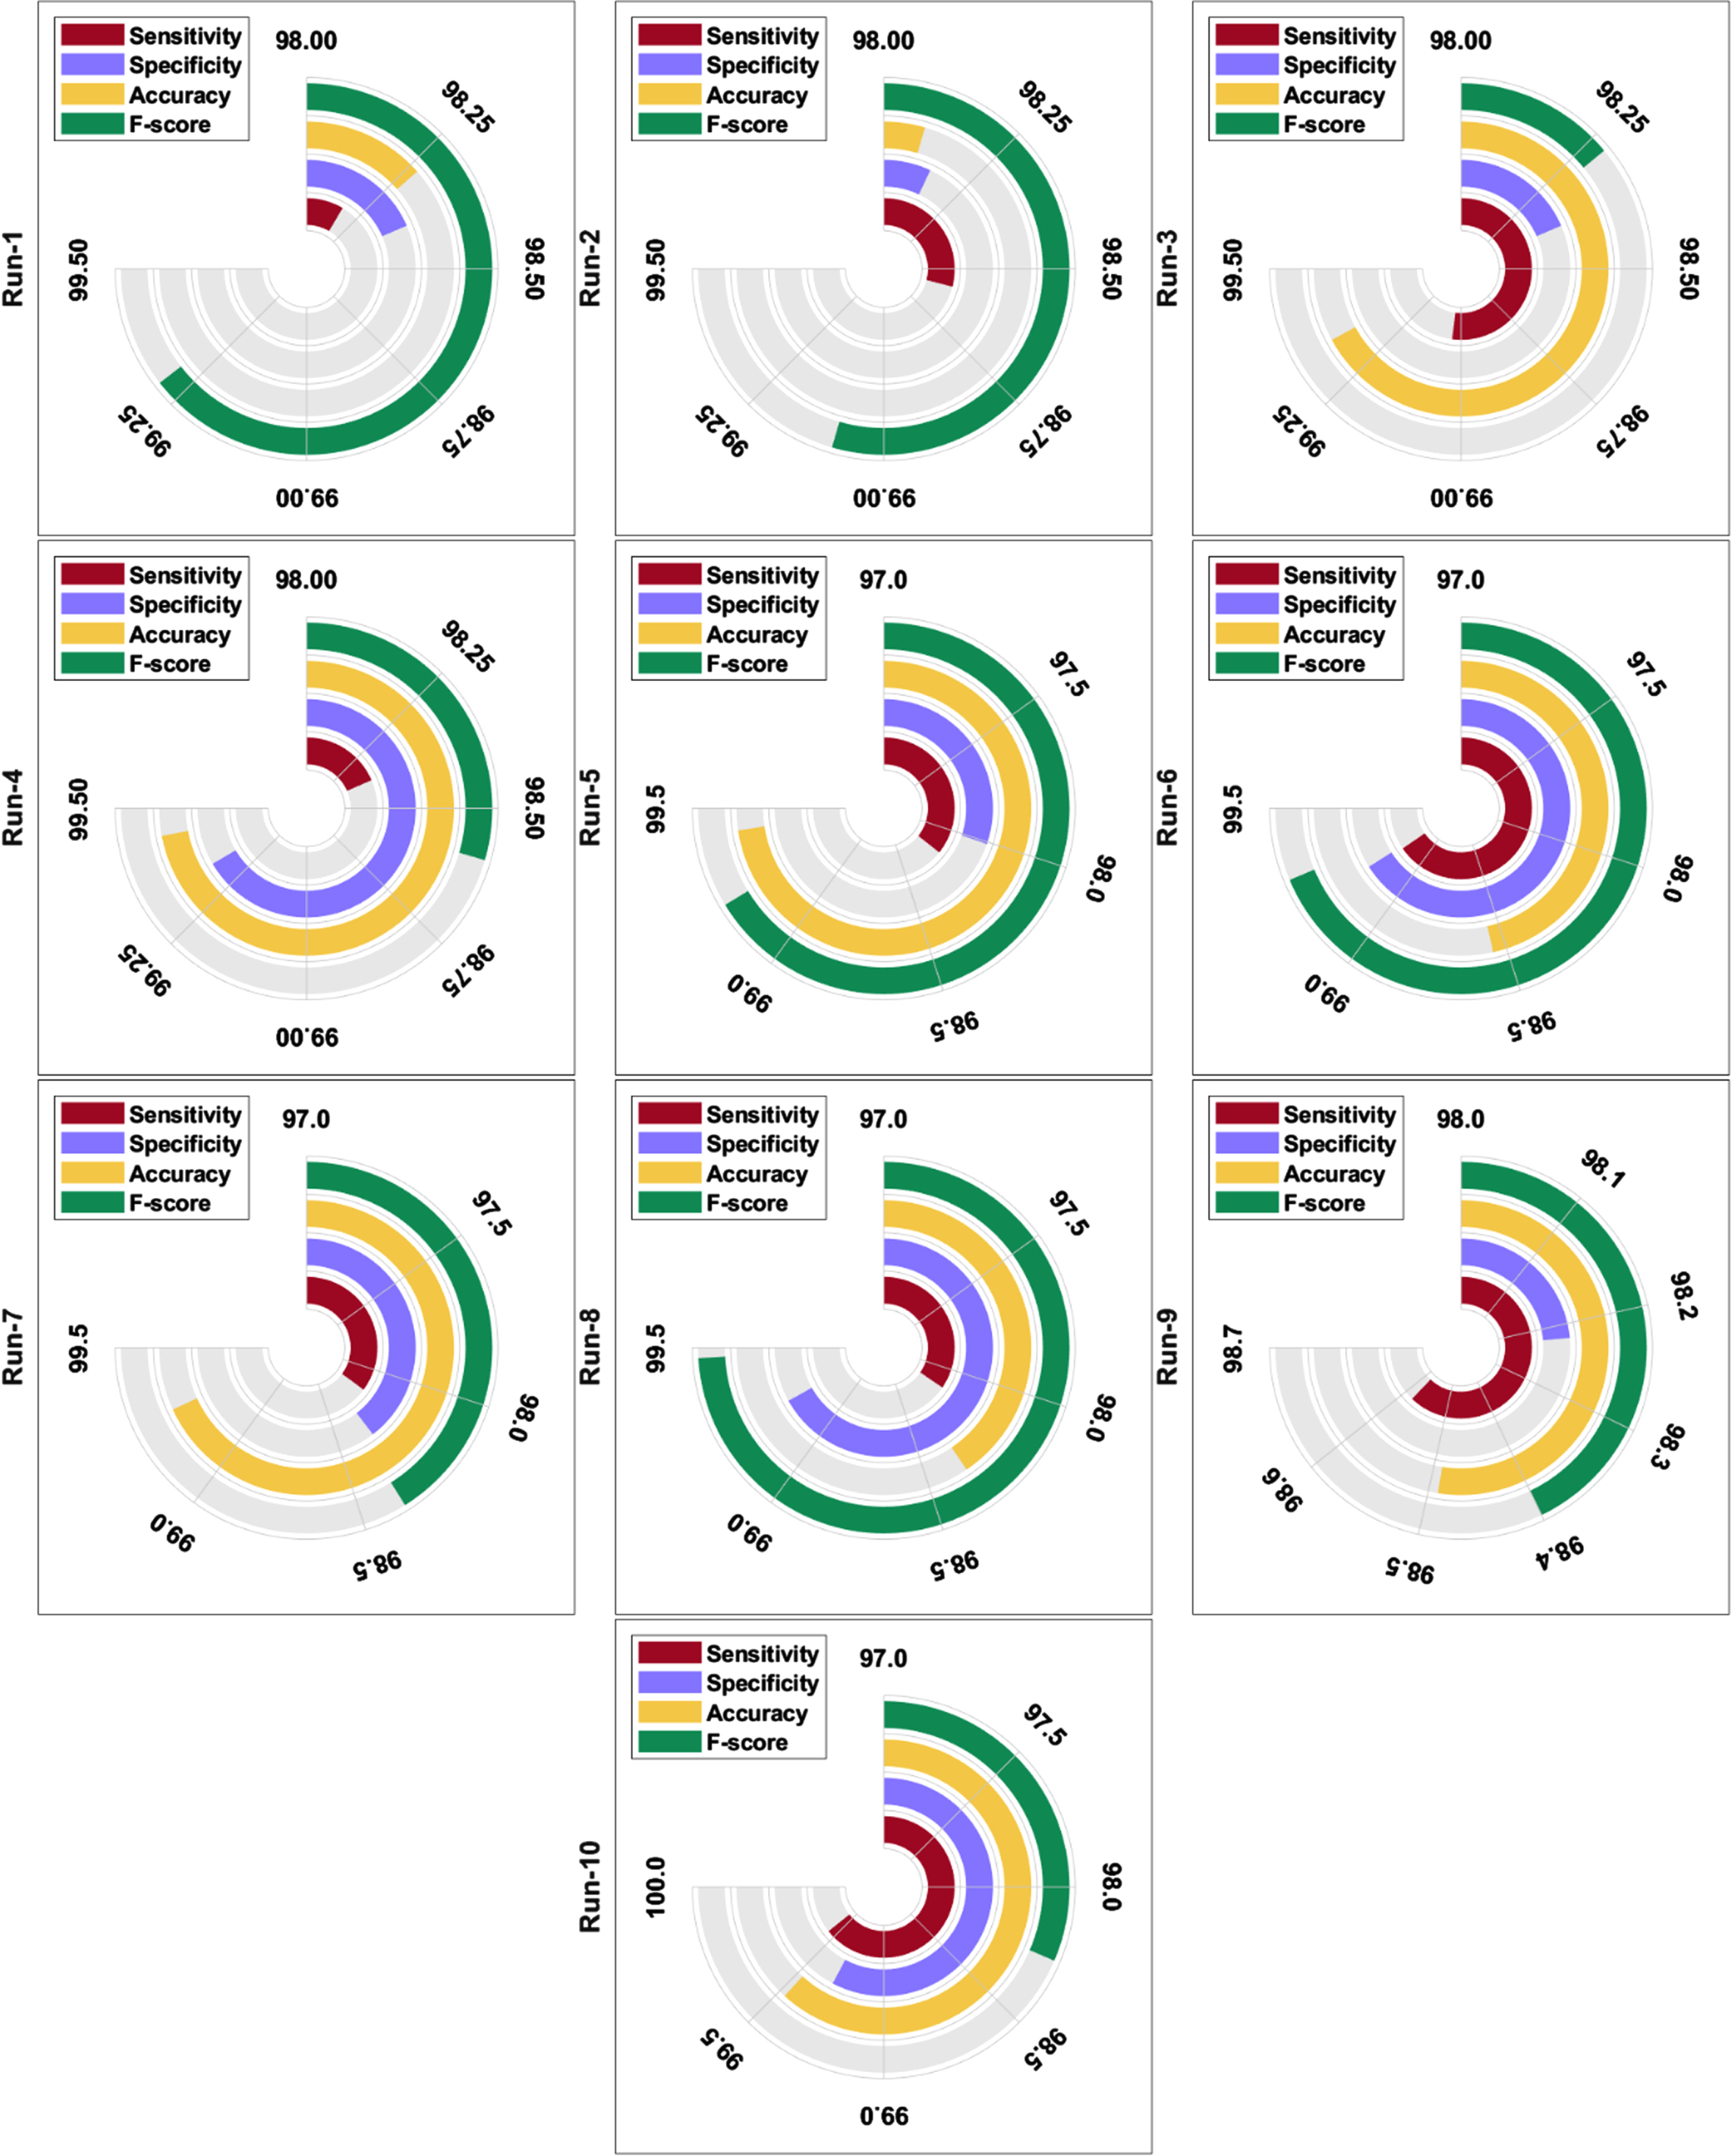
Result analysis of MOM-IDL model with different runs.
In the meantime, with run-8, the MOM-IDL method has offered a sensitivity of 98.15%, spec. of 99.23%, acc. of 98.35%, and F-score of 99.47%. At the same time, with run-9, the MOM-IDL technique has offered a sensitivity of 98.58%, spec. of 98.22%, acc. of 98.49%, and F-score of 98.40%.Eventually, with run-10, the MOM-IDL algorithm has obtainable a sensitivity of 99.57%, spec. of 99.31%, acc. of 99.47%, and F-score of 98.26%. Figure 7 exhibits the set of ROC analyses of the MOM-IDL technique under ten different iterations. The figures ensured that the MOM-IDL technique has accomplished effectual outcomes on the applied test images.
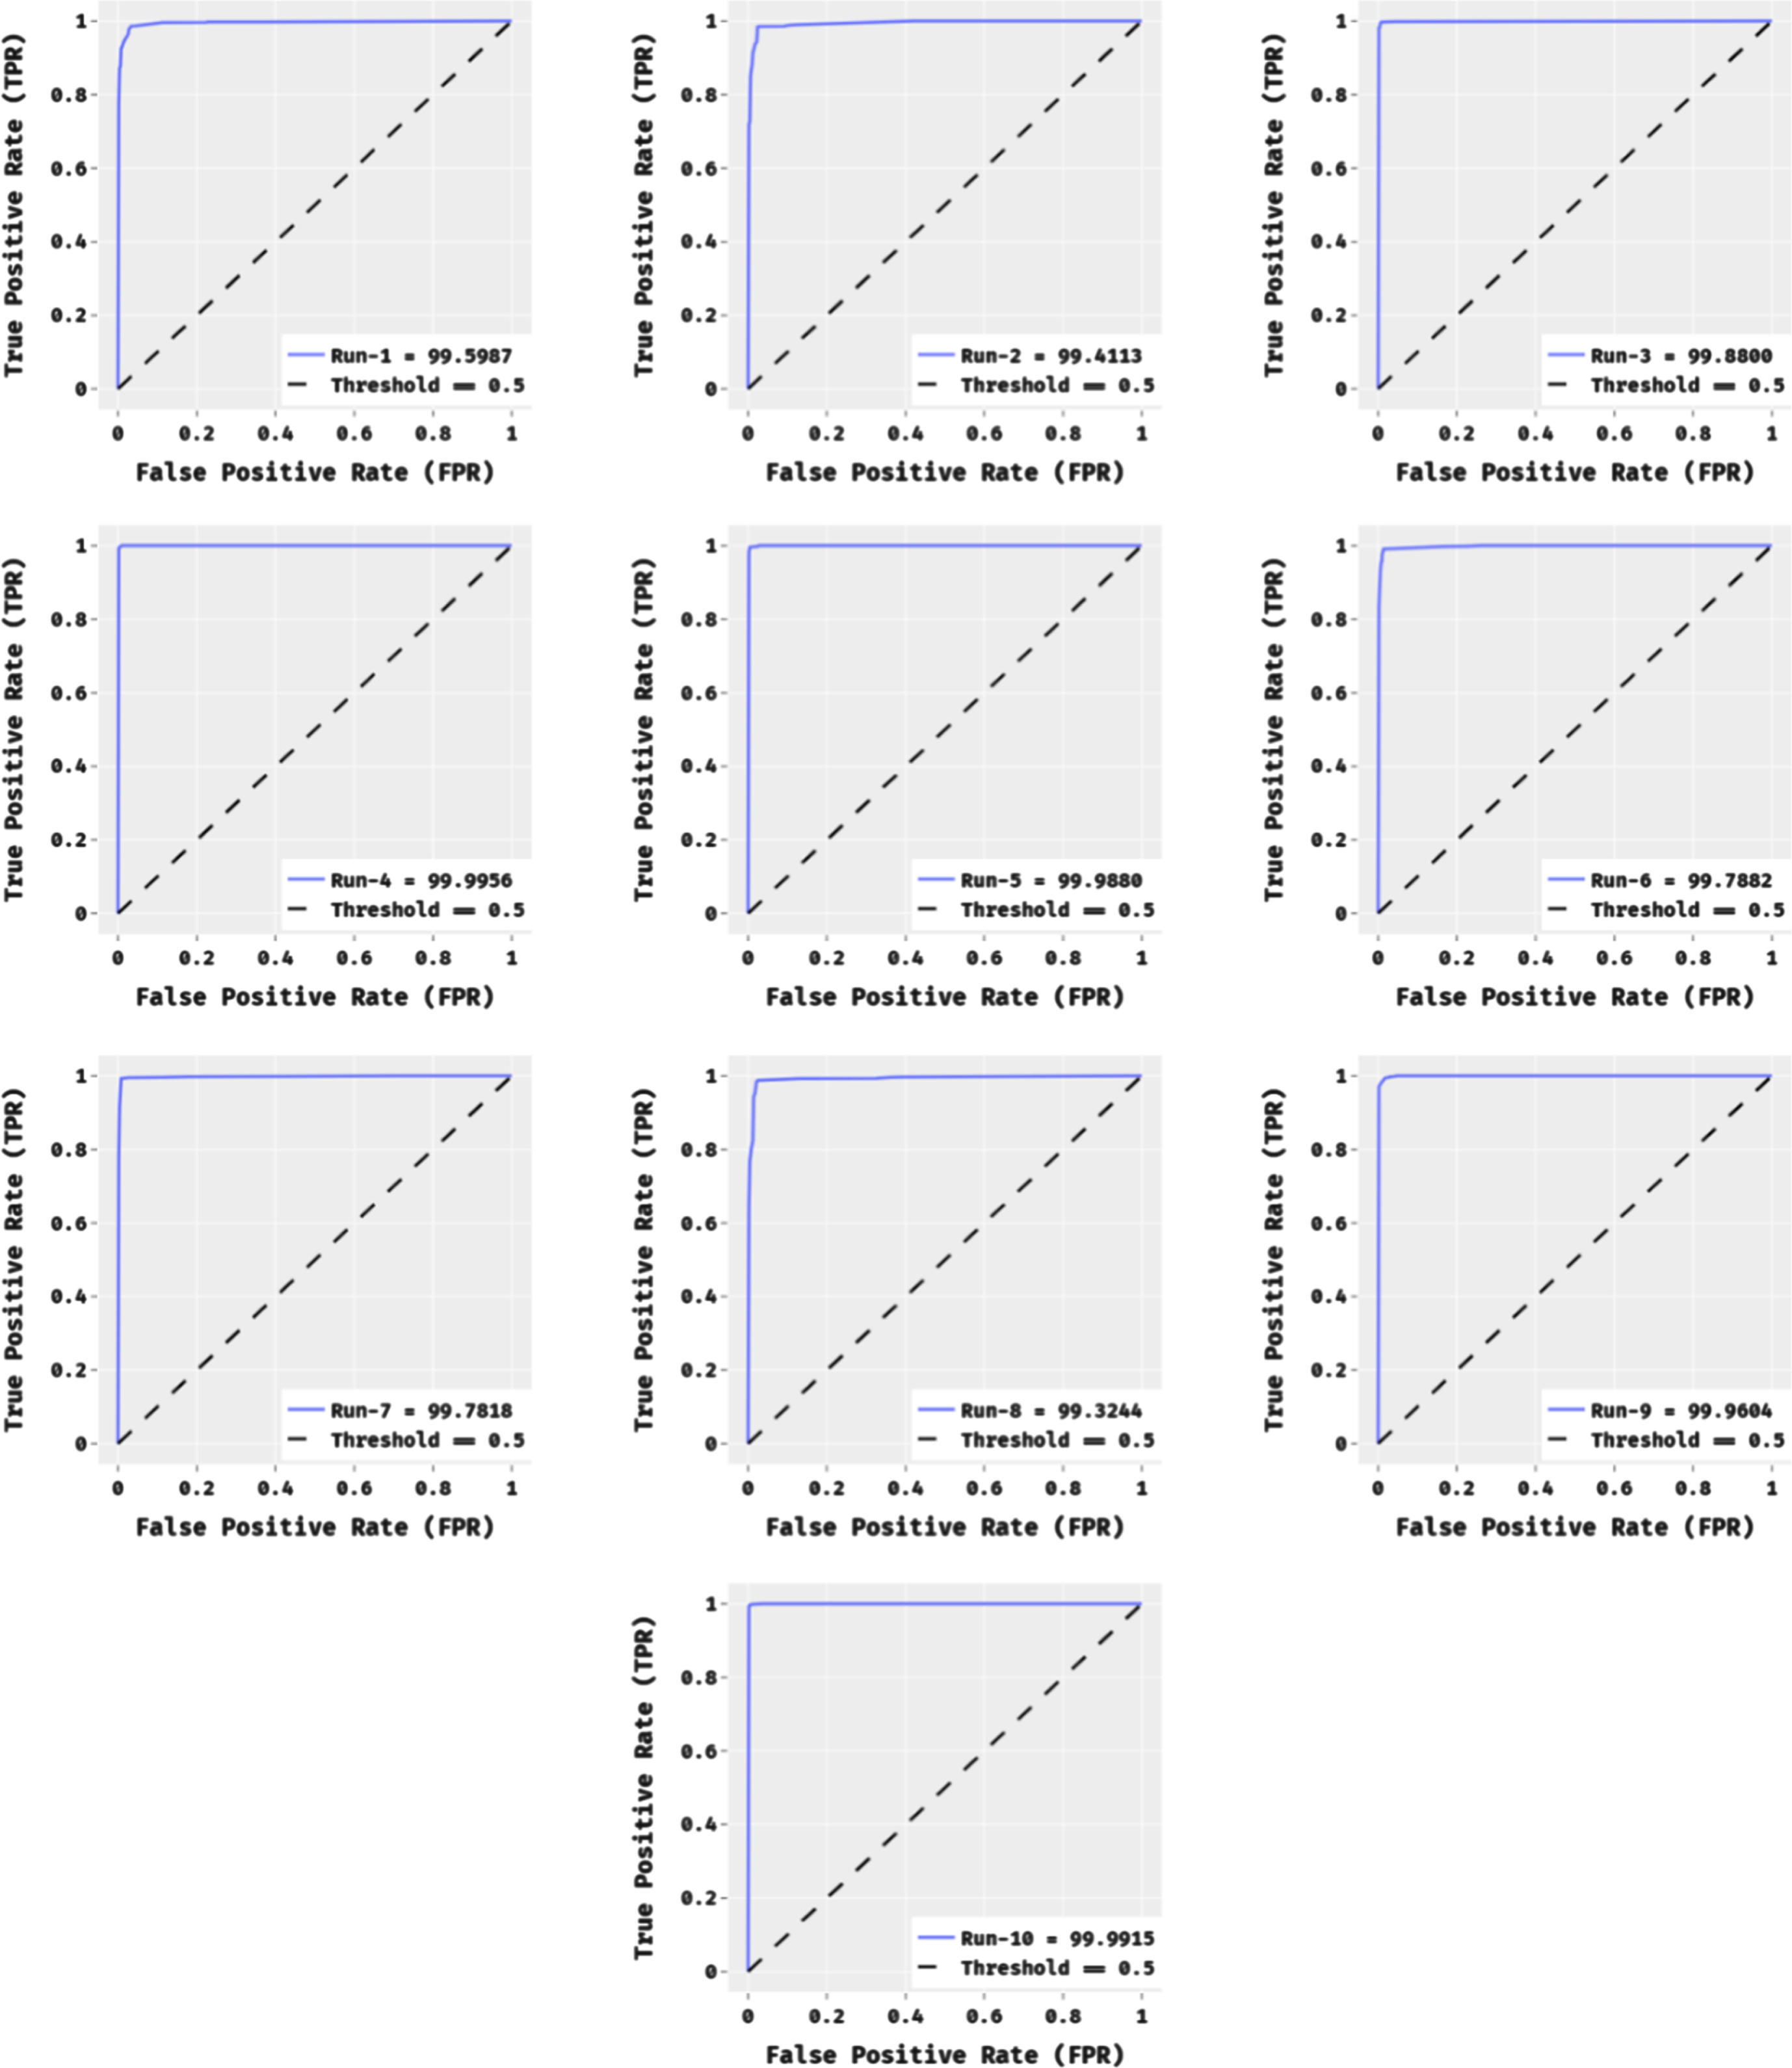
ROC analysis of MOM-IDL model with distinct iterations.
In order to showcase the enhanced classification results of the MOM-IDL technique, a detailed comparison study is made in Table 2. Figure 8 offers the sensitivity analysis of the MOM-IDL with existing techniques. The figure showcased that the EEDL-DPT technique has showcased ineffectual outcomes with a lower sensitivity of 61.95%. Besides, the CNN-10x10 and CNN-50x50 techniques have obtained certainly increased sensitivity of 80.5% and 88.1% respectively. In line with, the CNN-50x50, CNN-70x70, and CNN-CTPCD techniques have resulted in a moderately closer sensibility of 91.5%, 91.5%, and 91.58% respectively. Moreover, the DL-HCNN technique has tried to accomplish near optimal performance with a sensitivity of 97.66%. However, the proposed MOM-IDL technique has resulted in a maximum sensitivity of 98.60%.
Result analysis of existing methods with proposed MOM-IDL methods
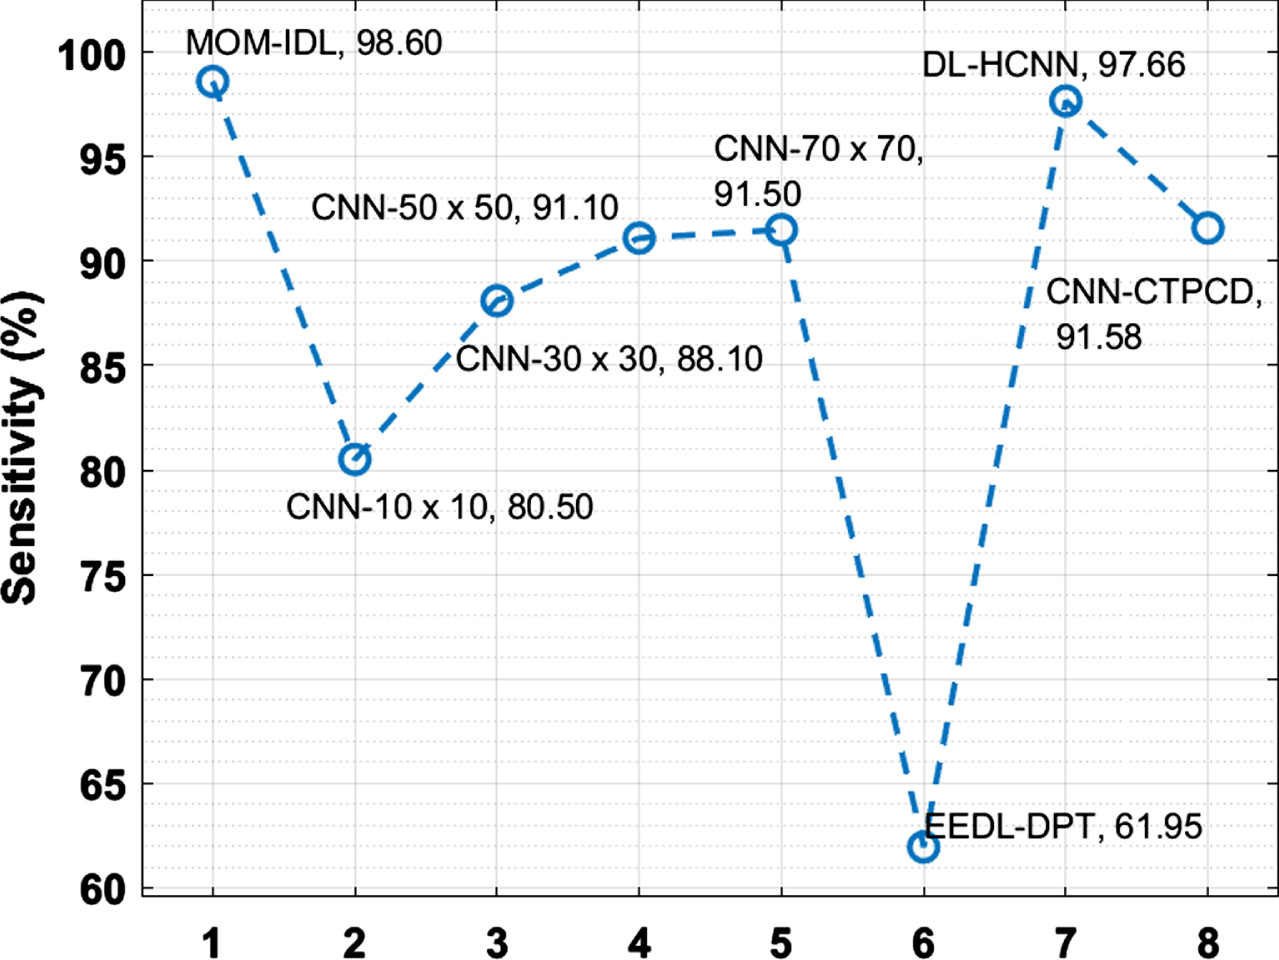
Sensitivity analysis of MOM-IDL model with recent methods.
Figure 9 provides the specificity analysis of the MOM-IDL with state-of-art algorithms. The figure outperformed that the CNN-10 x 10 manner has depicted ineffectual results with the minimum specificity of 81.80%. Similarly, the CNN-30x30 and CNN-50x50 methods have reached certainly superior specificity of 85.4% and 86.5% correspondingly. Followed by, the CNN-70x70, EEDL-DPT, and DL-HCNN methodologies have resulted in a moderately closer sensibility of 86.70%, 90.20%, and 96.12% correspondingly.
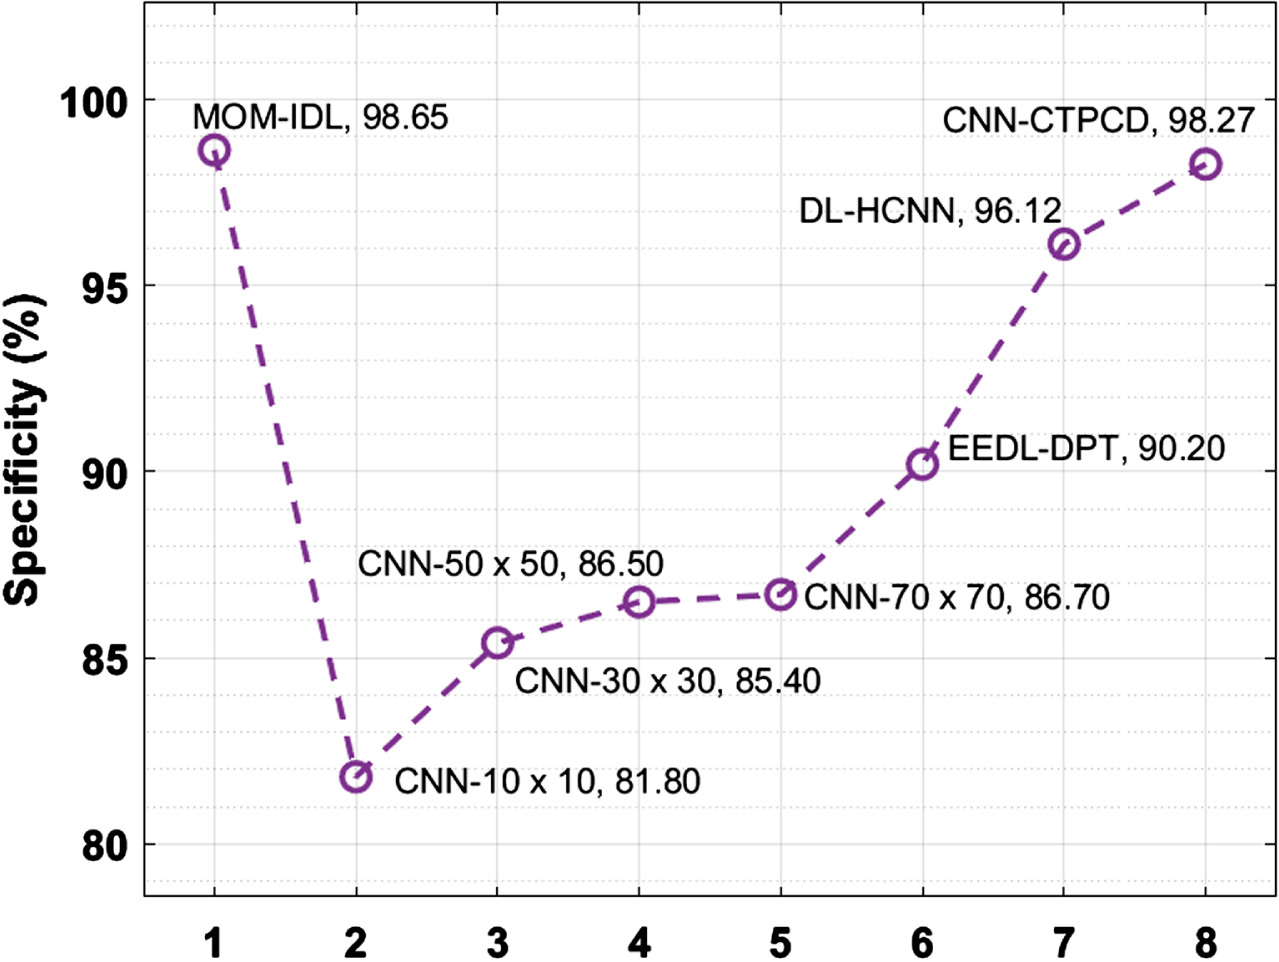
Specificity analysis of MOM-IDL model with recent methods.
In addition, the CNN-CTPCD technique has tried to accomplish near better performance with the specificity of 98.27%. Eventually, the presented MOM-IDL algorithm has resulted in a superior specificity of 98.65%. Figure 10 showcases the accuracy analysis of the MOM-IDL with recent approaches. The figure demonstrated that the CNN-10 x 10 method has illustrated ineffectual results with a lesser accuracy of 81.60%. Likewise, the EEDL-DPT and CNN-30x30 techniques have gained certainly higher accuracy of 82.70% and 85.90% correspondingly. Also, the CNN-50x50, CNN-70x70, and CNN-CTPCD algorithms have resulted in a moderately closer sensibility of 87.30%, 87.40, and 95.47% respectively. At the same time, the DL-HCNN approach has tried to accomplish near optimum performance with an accuracy of 96.89%. But, the projected MOM-IDL manner has resulted in a maximal accuracy of 98.87%.
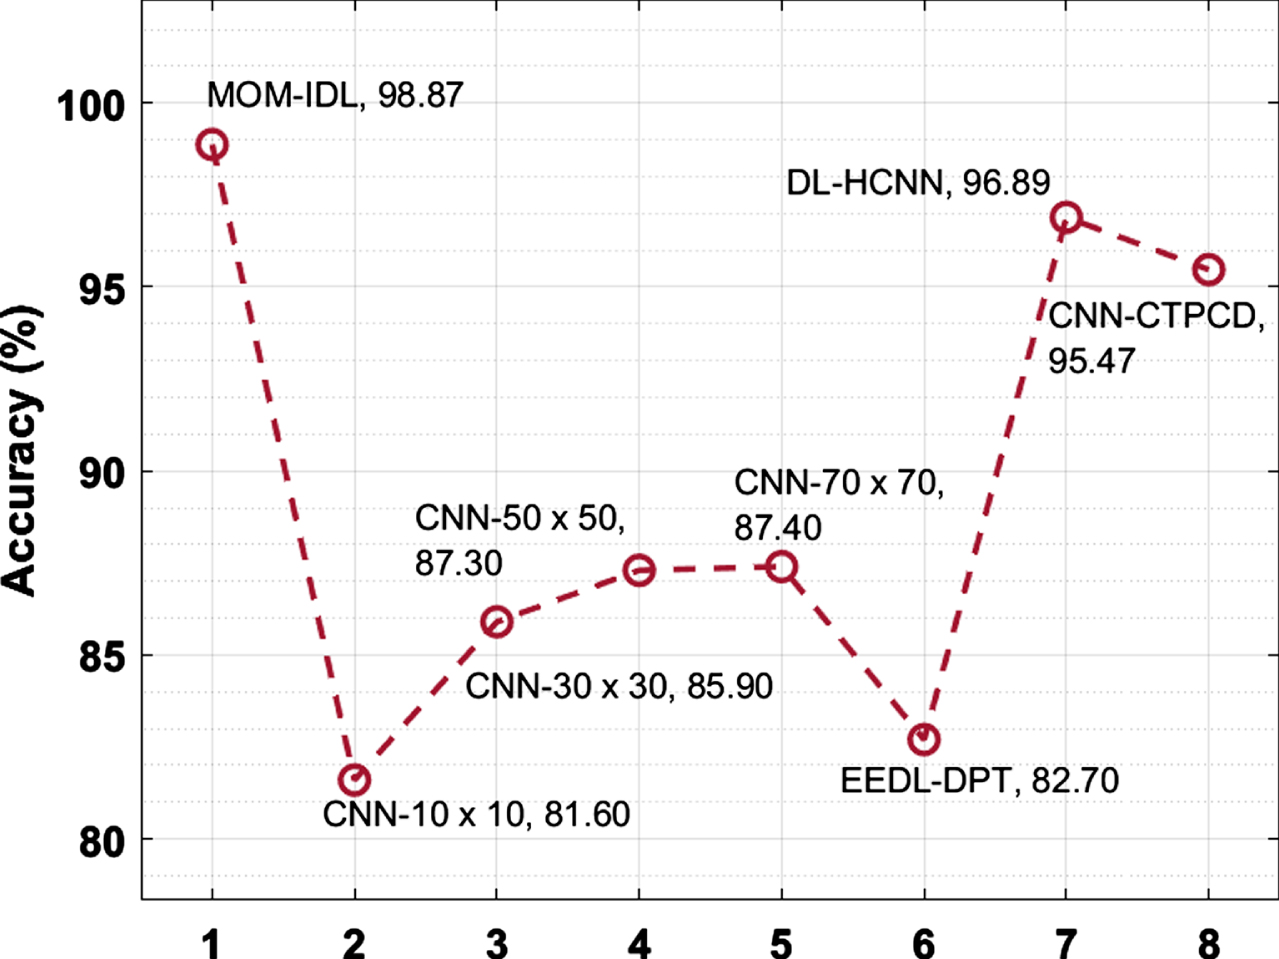
Accuracy analysis of MOM-IDL model with recent methods.
By looking into the above-mentioned detailed result analysis, it is demonstrated that the MOM-IDL technique has been found to be an effective tool for pancreatic tumor diagnosis and classification.
In this study, a new MOM-IDL technique is derived to detect and classify the existence of pancreatic tumors. The design of MOBMO algorithm to optimally select the threshold value for multi-level segmentation and parameter tuning of the FSVM model helps to considerably boost the classification performance. In order to highlight the betterment of the MOM-IDL technique, an extensive experimental analysis takes place. The simulation results pointed out the enhanced performance of the MOM-IDL technique over the recent state of art techniques with sensitivity, specificity, accuracy, and F-score of 98.60%, 98.65%, 98.87%, and 98.83% respectively. As a part of future scope, the diagnostic performance of the MOM-IDL technique can be boosted by the use of advanced DL models with hyperparameter tuning processes.