
Abstract
The primary goal of this study is to optimize web content for a positive user experience and to develop a data-driven methodology to assess the success of visitor flow on a website for school children. Through Vision-Based Page Segmentation, the suggested study work intends to broaden the stated web approach’s reach and statistical inference. The improvisation has been made accordingly with the semantic structure observed from each node with the designated degree of coherence to indicate the content in spatial and block based on visual perception for each event. The click count (number of clicks) is calculated for all the possibilities of Quest Software. The most frequently accessed event is displayed at the top to enhance usability and visibility with an accuracy of about 92.80%. From the experimental analysis, it has been observed that most of the students preferred events corresponding to drawing, rhymes, and rangoli with a willingness rate of above 80%, respectively. Statistical analysis has been made using chi-square analysis, and it has been found that the levels from A to D are significant for three years with a P-value < 0.001. Sentimental analysis of feedback collected from the participants about the events is also done, and the most preferred event is suggested for the upcoming years.
Introduction
The data analytics domain corresponds to the study of raw data with the mechanism of concluding solutions for real-time problem analysis. In recent days, most educational and industrial organizations have widely used the term analytics to make decisions at various levels. The level of drawing solutions and making interpretations can be made easier with the analytic approaches and their algorithmic patterns. The extraction of practices and decision-making differs significantly from data mining by algorithm, model development, interpretation, and evaluation. The condition of analytics is used with different sorts of algorithms, including machine learning, knowledge discovery, and pattern analysis. The rate of modeling and its analysis factors are the cases that have to be considered for interpretation and evaluation. The raw data may contain missing fields, data duplication, and varying formats. It has to be identified in the first stage of analysis.
The second stage is transforming the data and making it available for the modeling process. All the modeling mechanism doesn’t fit the selected data. Some may work well, and some may lead to poor performance analysis. It has to be consistently checked with the parameters corresponding to the algorithm and its evaluation. The final stage is data interpretation and evaluation [4].
In recent days, the impact of using web pages is considered one of the essential information retrieval platforms that provide plentiful resources. The web page is regarded as the single semantic that exposes information such as interaction, navigation analysis, and design components. The topics concerned with each web page won’t be relevant to each other but may indirectly have their relationship through semantics and web properties [26].
Most real-time web applications utilize different sorts of semantic content and its structure to formulate the web pages. Some may embed the wrapper-based design to categorize the web information contents into distinguishable chunks. Once the semantic network is retrieved, the wrappers can be built on top of it to recover the structural contents related to the web page. Links and hyperlinks concerned with each web page have to be treated differently. There is a possibility of linking from A to B, then some of the transformable data structure from page A to B. To formulate this Document Object Model (DOM), HITS algorithms are used for focusing and handling crawl problems. But this algorithm is not so enough to take to deal with more number of hyperlinks and web pages in action with proper semantical segmentation [5].
The process and mechanism of web analytics focus on evaluating and estimating web-based content to formalize with the level to optimize web data and its usage. Most the analytical management system utilizes the mechanism to measure the traffic in web data. But it is also proving its efficiency in business analysis and marketing research to improvise the tendency of web utilization. It makes users to have the obsolete analysis of trend analysis which is directly related to market research [27].
Algorithms in machine learning play a significant role in the analysis and design of real-time data modeling platforms, specifically in business analytics. The web-based data analysis system relies on the update and simulation of data retrieval and analysis. Among the data analytic processing models, text analytics is one of the essential models which focuses explicitly on opinion mining and extraction of sentiment structures [14]. Extraction of the semantic structure of the user data provides more valuable information when compared to the data structure in a raw format. The degree of coherence, data design in terms of a node by node analysis, and visual perception make the study more profound, making us understand the meaningful pattern in the data.
Web analytics, in general, uses more number of manipulating algorithms specifically for page segmentation and analysis. The web page, in turn, can be viewed as a block by block of data that contains segments over it. Some of the contents on the web page correspond to advertisements, login instructions, decorations, information corresponding to the web users, and contact details. All the data is analyzed in segments that can be easily explored and extracted with a block-by-block analysis. Methods corresponding to DOM are available to operate, focusing on page segments. But the notable thing is to select the most appropriate form of data segment analysis specifically suited for semantic aggregation. Also, the resultant output should be error-free for analysis with the observed segments and data corresponding to the web page for user analysis and reviews [24].
In this context, they will treat humans’ view of the web page from a different perspective rather than considering it as a single uniform object. When a user examines the web page, the spatial and the ocular views will make the user segment it into different perspectives. In this investigation, we have enabled a data-driven mechanism to model the visitor’s flow on the web page. The effectiveness of page statistics with data optimization has been observed with improved quality metrics and segment analysis.
Page segmentation is how the web page is divided into blocks or chunks, which are then made suitable for the classification process. In earlier days, the classification is made according to the view of rectangles and lower heuristics for segment analysis. The tilting process often makes it for each element and its aggregation. Data classification in text analysis is wholly based on the properties of the degree of elements, coherence, and the adjacent lines that exist along with the web-line structure. In web-based extraction feature, the phenomenon of click analysis is the one that makes the novelty behind the proposed research work for the quest software developed by [22].
Here the effort is made by expanding the web analytic approach to include analysis and data for each block on a page through Vision-Based Page Segmentation. Each page is analyzed so that the interpretation is made accordingly with the VIPS algorithm through node-based analysis. The segment is partitioned into block-based elements to indicate visual perception. The improvisation was done by the semantic structure seen from each node with the specified degree of coherence to represent the data in spatial and block enabled segmentation [3]. The click count (number of clicks) is calculated for all the events of Quest Software. The most frequently accessed event is displayed at the top to enhance the usability and visibility of the webpage. From this outcome, a sentimental analysis of feedback collected from the participants about the events is also done, and the most preferred event is suggested for the upcoming years.
Literature review
In recent days the process of automation reduces the time to work across platforms and makes the student learning in an efficient way [12]. Significant tools in technology rapidly increase the scheduling of activities, data exchange and automation process. The process of education technology has a significant role in teaching learning as well as designing platforms for educational events [6]. Event analysis and participation makes the students to have out of the box thinking and facilitates automated analysis. The term instructional technology makes the students to have an attention towards the instructional use in educational technology.
The mechanism of instructional technology involves the measures of integrating complex problems, and making implementations in a specific way where learning is purposive and controlled Kim and Strimel (2020). Addressing the students with technical and non-technical events makes them to have exploration on knowledge, facts and technological incorporation [7]. The realm of understanding during in-class activities can be well addressed through the technical and non-technical events if conducted regularly [10].
The variation in understanding of in-class activities can be planned accordingly with the differentiation in conducting technical as well as non-technical events. Technical events can be well understood by the students corresponding to different learning categories [8]. Most of students in the average learning categories need some of the improvisation mechanism to get updated with regard to the core fundamentals of subjects. If these processes are explored through events then the nature and realm of understanding gets never forgot till their schooling ends [9].
A proposed [28] methodological framework for the estimation of Arabic handwriting and its segmentation described. They have incorporated CNN and MMO framework to best determine the segments that falls under different category. The proposed model using CNN has given good results when compared to other such algorithms. Also, this model can be efficiently used with other such data segmentation platforms.
An analysis [29] process of semantic segmentation of water bodies for ATLANTIS dataset. Different segments of images has been analyzed with regard to the natural object analysis. The segregation has been made in accordance with the semantic segmentation networks using deep neural network model. The experimental results provided a good insights with regard to the model analysis and segment fault detections.
Data Collection and Analysis
The quest program involves both technical and non-technical events which aids in the involvement of school students. The event has been categorized into 4 levels such as: Level A –KG to 1st standard Level B –2nd standard to 5th Standard Level C –6th standard to 7th standard and Level D –8th standard to 12th standard
Based on the above levels the students have been categorized into different categories and the event planning is also made accordingly. The following Table 1 provides the count achieved for each level upon registration.
Student registration count
Student registration count
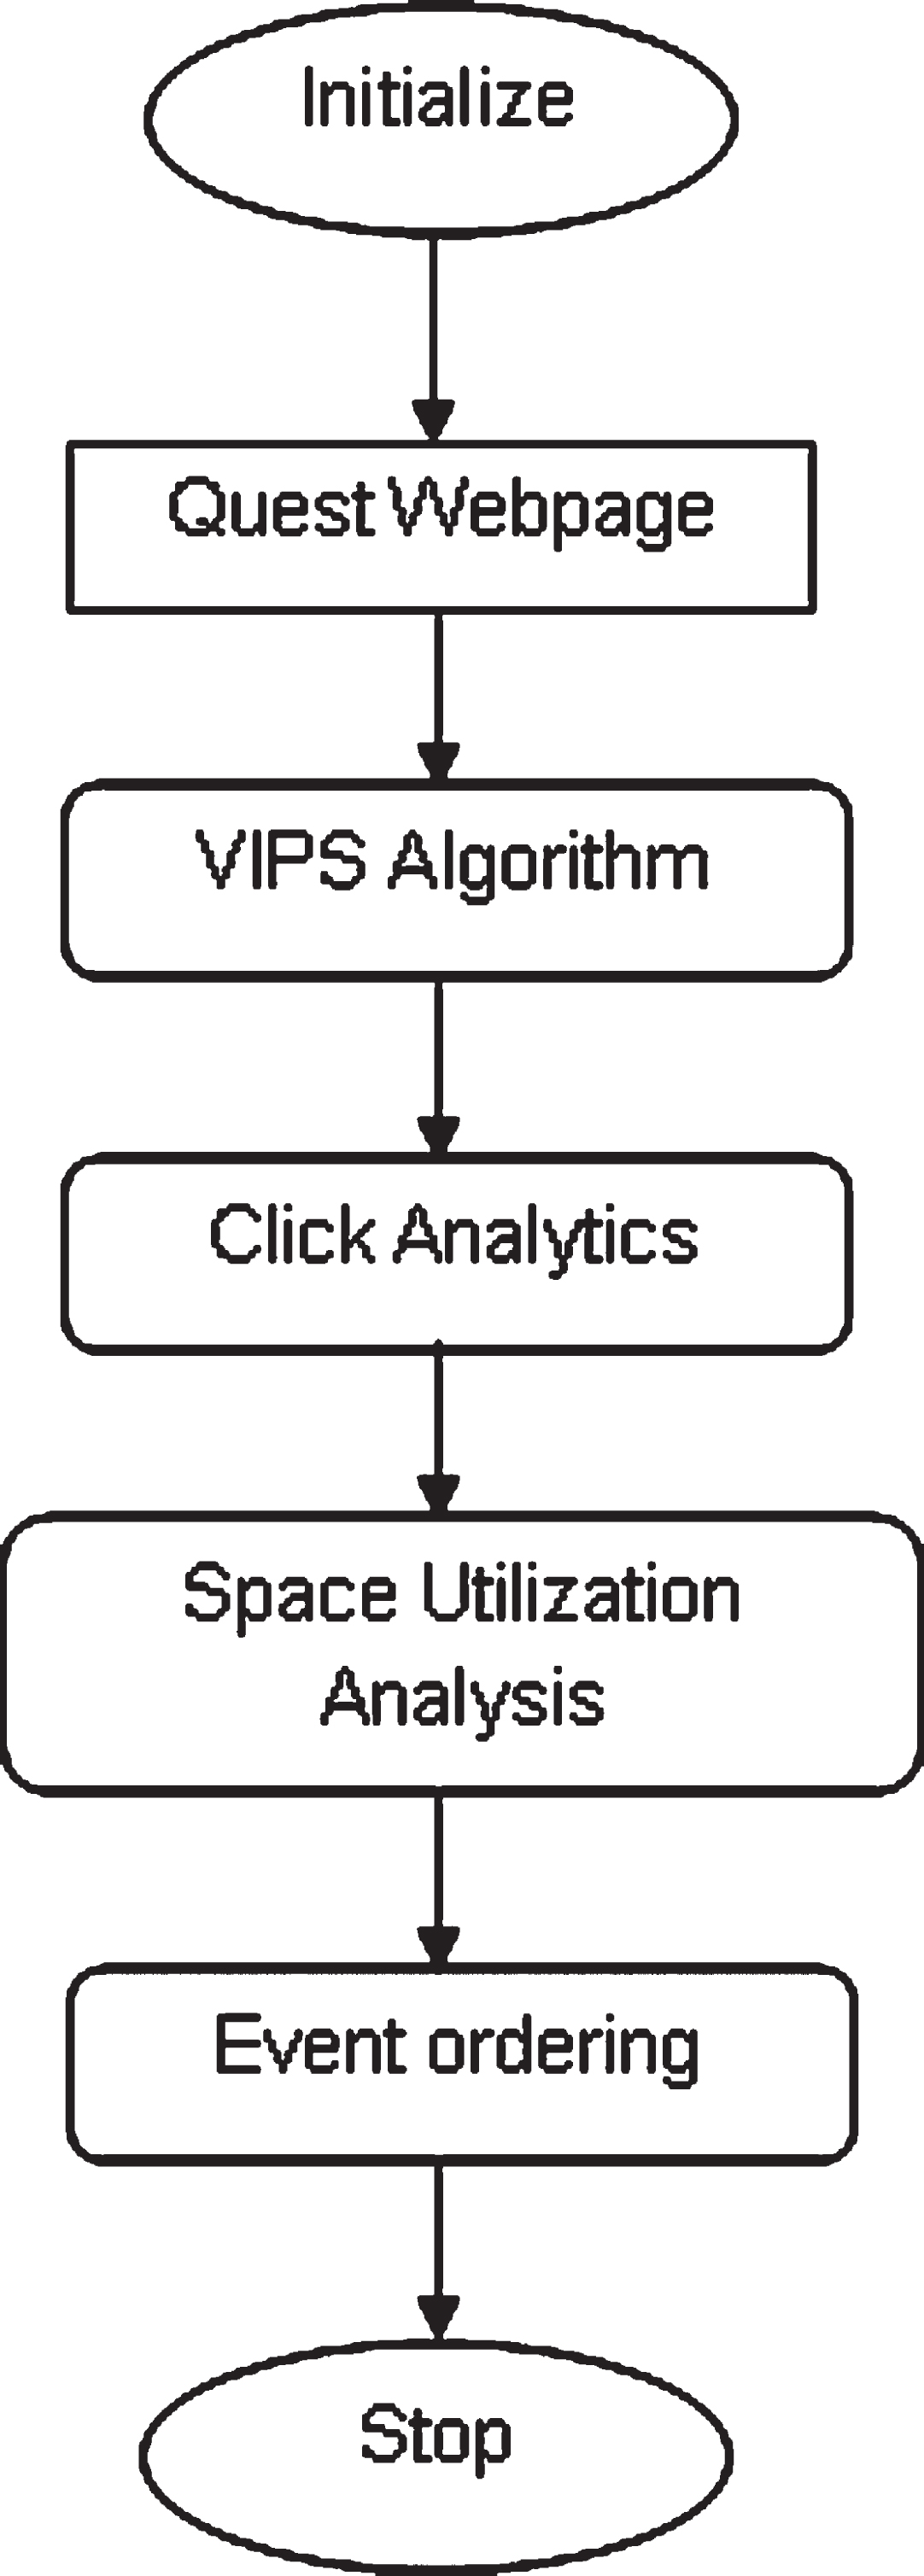
From the observed count the level of participation in each of the event will be analyzed with the proposed scheme. Each of the students in the category 1–4 will be given chances for participating a maximum of 4 events in which they are well versed in their technical and non-technical skills. Some of the students may participate much in a specific event which makes the organizer to have more focus and to allot more venues for the students to participate. This has to be taken into consideration in event analysis with click-based registration upon user clicks for navigating the web page into more focused to be get prepared for the specific event. Hence the future prediction for the year 2021 can be made effectively with the VIPS click counter technique with the creation of segment based layout for analyzing the user clicks more efficiently. The visual block tree is depicted in Fig. 1.

Visual block tree.
Web analytics is primarily used to evaluate a website’s and it’s associated commercial operations’ success rate. The following are some of the most important aspects of web analytics: Identifying and resolving issues with web content Having a thorough understanding of website trends Keeping track of online traffic and user flow Demonstrating the acquisition of goals Determining possible keywords Identifying areas for improvement Identifying referring sources
The web analytics process includes creating company goals, tracking goal achievement with Key Performance Indicators (KPI) [30–36], gathering correct and suitable data, extracting insights, and evaluating data, testing alternatives based on assumptions obtained from data analysis [37–44], and adopting insights based on either data analysis or website testing.
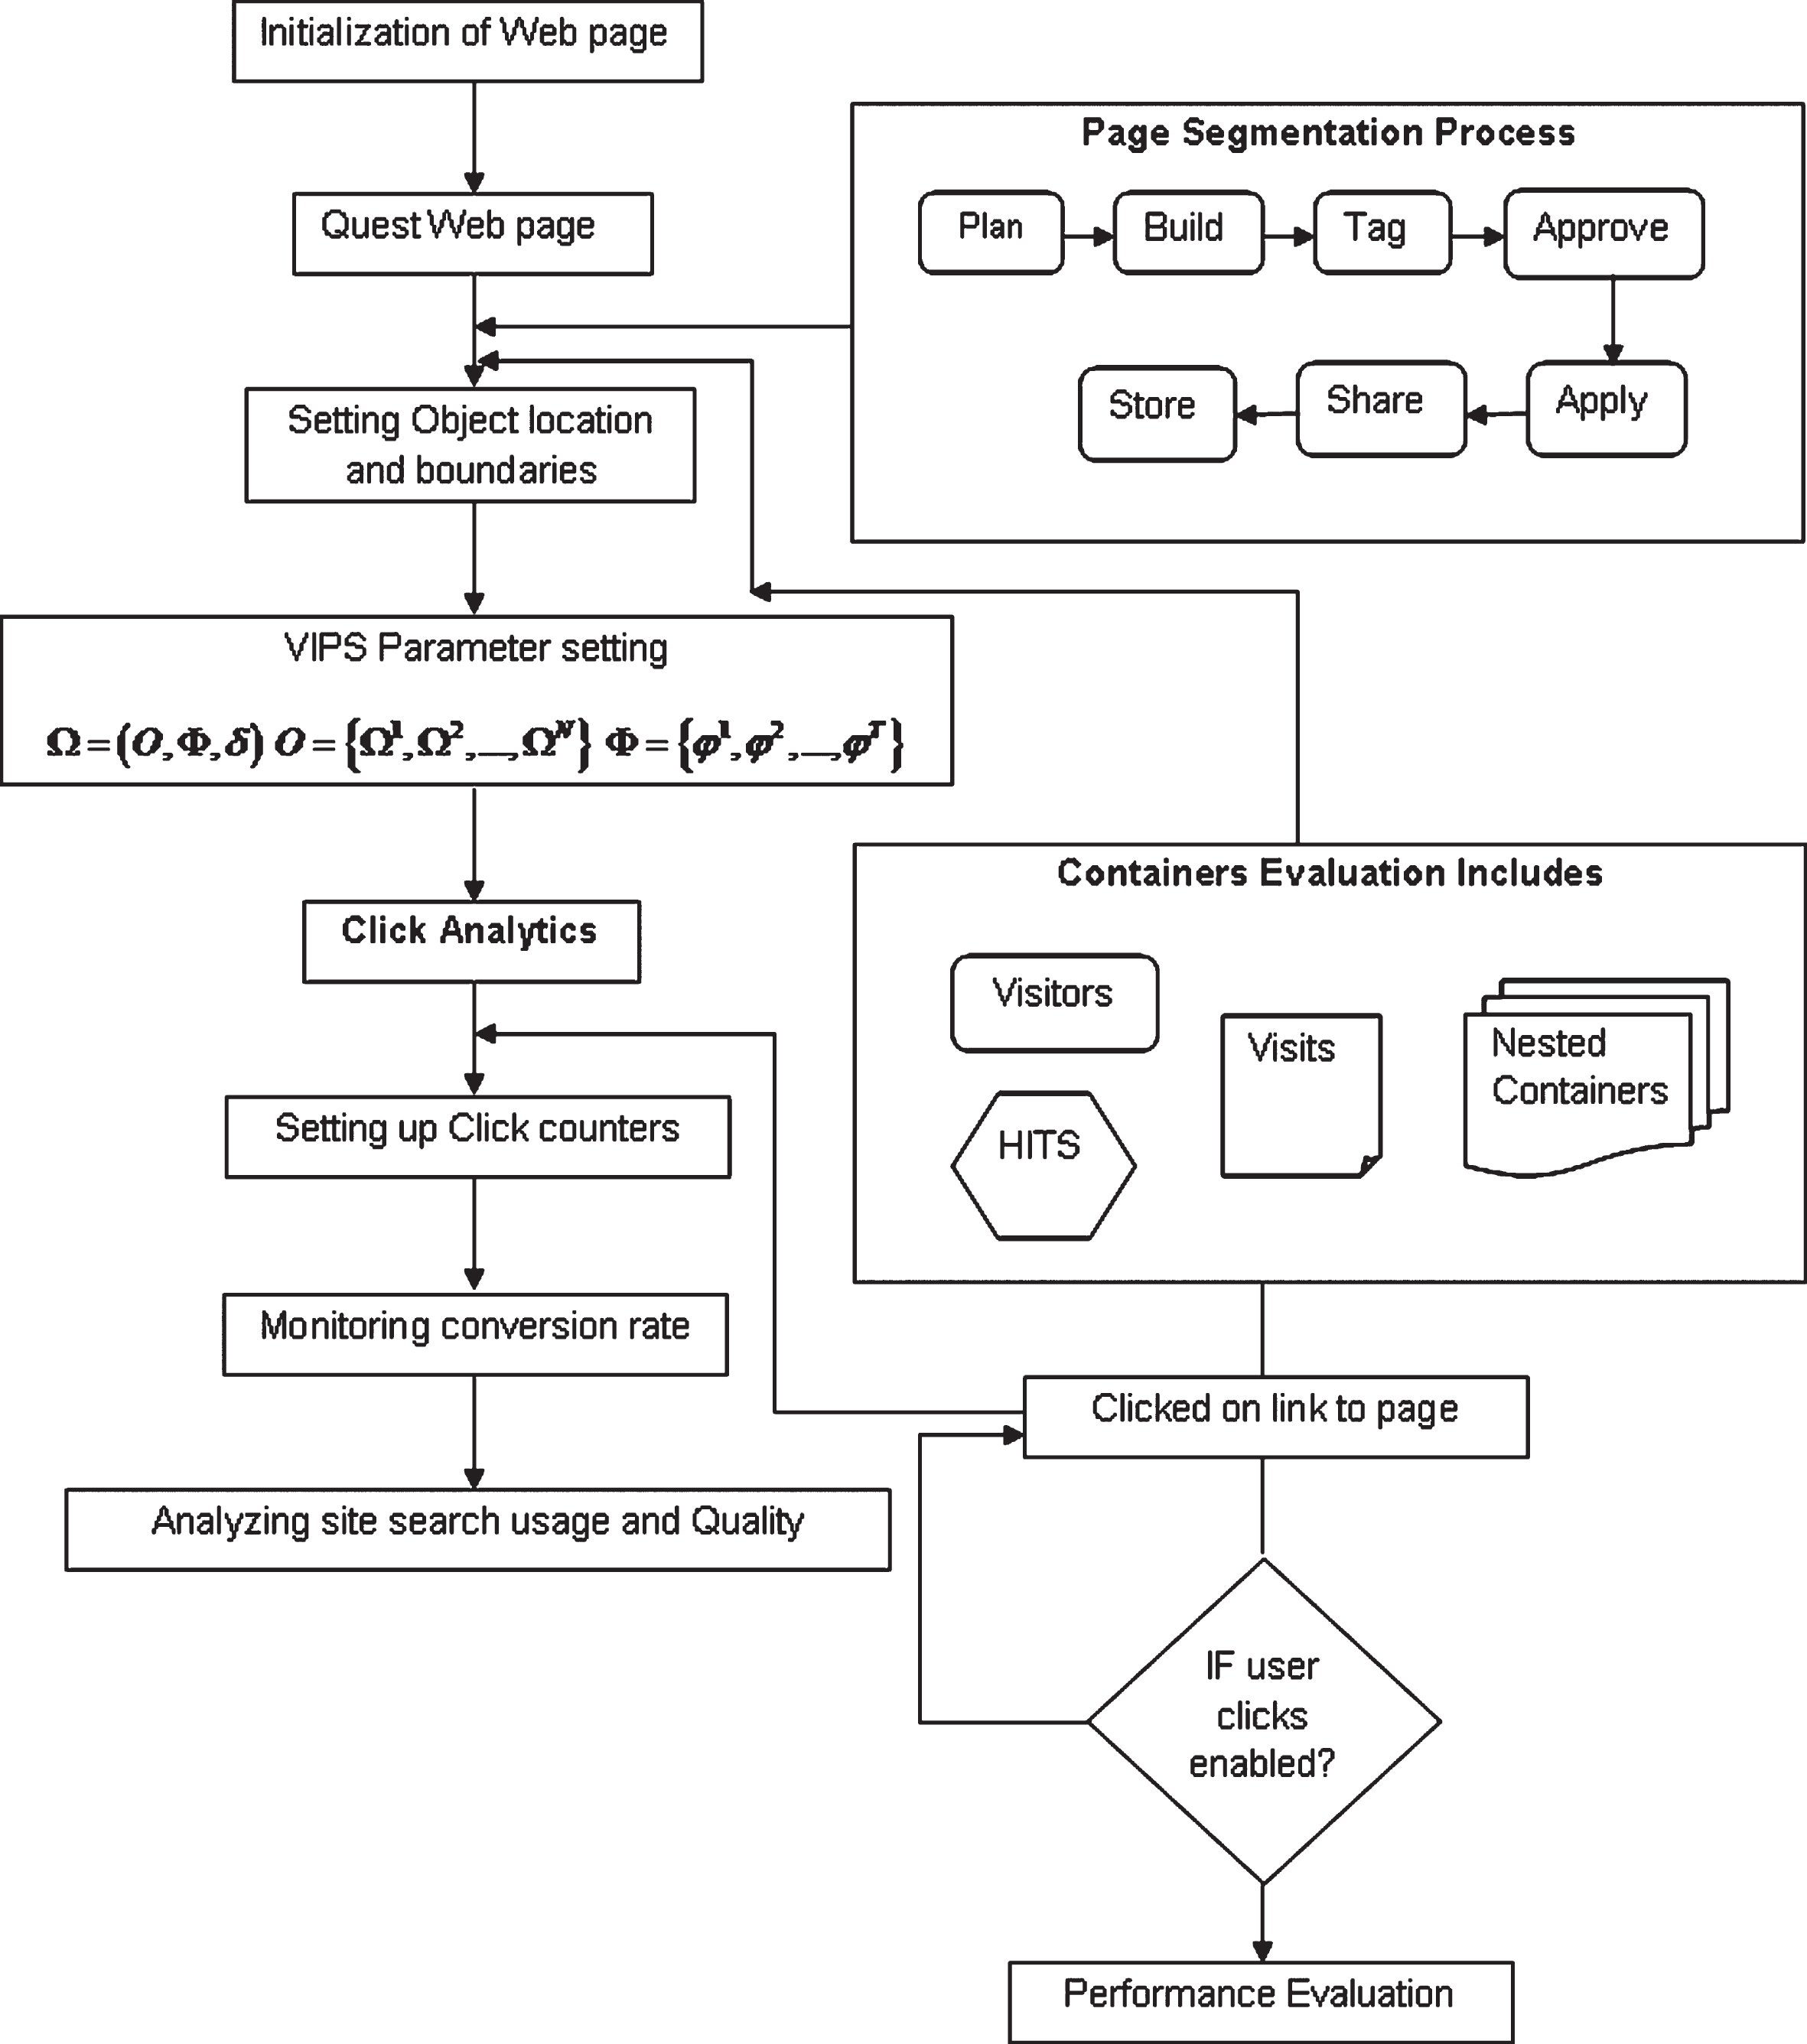
Considering many sorts of real-time applications, the impact of web-based tools plays an important role in design, implementation and analysis. This makes the scenario to broaden the sector of web analytics and its constituent paradigms to extend towards multiple fields of action [11]. Also, the generated click and its link considered for each of the web page is illustrated and represented in Fig. 2. The process is well said by the authors [2] for representing the tree-based segmentation and moderation for the analysis of web page setting. In addition, certain visual blocks can also be rendered by the established pattern.
Click analytics process.
The proposed work has the following objectives owing its importance supporting the visualizations for the Quest web pages Using link attention, the motto is to manage the web page space To propose each portion of the webpage to ensure greater user engagement and visibility To analyze feedback for suggesting various events in the upcoming years Some of the limitations of the existing web analytics software were identified as follows Focuses only on the page statistics and user metrics of a webpage Doesn’t deal on utilization of the space used in a webpage No proper information regarding the design inputs for a webpage
These issues can be solved if the web analytics technique is enhanced through space utilization concept by tracking the concentration of clicks in a webpage that increases user interaction re-arranging the elements& buttons according to their functionality prescribed [20]. In our proposed work [3] to execute web analytics at the page segment level, we analyse space use and use that information to provide various design inputs.
The VIPS algorithm tries to deduce a web page’s semantic structure from its visual presentation. One example of a semantic structure is a tree structure in which each node corresponds to a block. To reflect the level of coherence in the block content based on visual perception [13], each node will be assigned a value called Degree of Coherence (DoC). The higher the DoC, the more cohesive the environment proposed by [2].
After extracting all of the required blocks from the html DOM tree, it finds the separators between these blocks. Separators are horizontal or vertical lines that visually intersect on a web page but do not include any blocks. Figure 3 depicts the recommended methodological workflow. Based on these separators, the semantic tree of the web page is constructed. Thus, a web page can be represented as a set of blocks (leaf nodes of the semantic tree) [15]. The segments obtained by VIPS are substantially more semantically aggregated than those obtained by DOM-based approaches. Because they are frequently placed in certain areas on a website, noisy content such as navigation, advertising, and decoration can be quickly eliminated. Different themes are divided into discrete blocks of content determined [16]. The data flow of VIPS segment analysis is given in Fig. 4.
Steps in Segmentation Segmenting the webpage through VIPS Algorithm Mapping the semantic structure of a webpage and concentration of clicks Implementing Click Analytics through Click Counters Click count and its parametric raise Making specific action for the click that has been initiated
Proposed methodological workflow.
Page segment Analysis.
As a result of our proposed method, the user’s most often accessed section and significant connections can be shifted to these locations with notable web analytic models [1].
For implementing Vision Based Page Segmentation, java code is developed and the website URL is given as an input to the VIPs Tester class. VIPS was implemented for registration page of Quest (tceit.acm.org/quest). The entire webpage is segmented and the layouts of the webpage are displayed in an xml format. Each layout’s details are clearly analysed and individual attributes of the corresponding layout are shown. The layouts are then parsed using xml parsing code and the number of layouts is calculated as in Fig. 5.

XML layout design output.
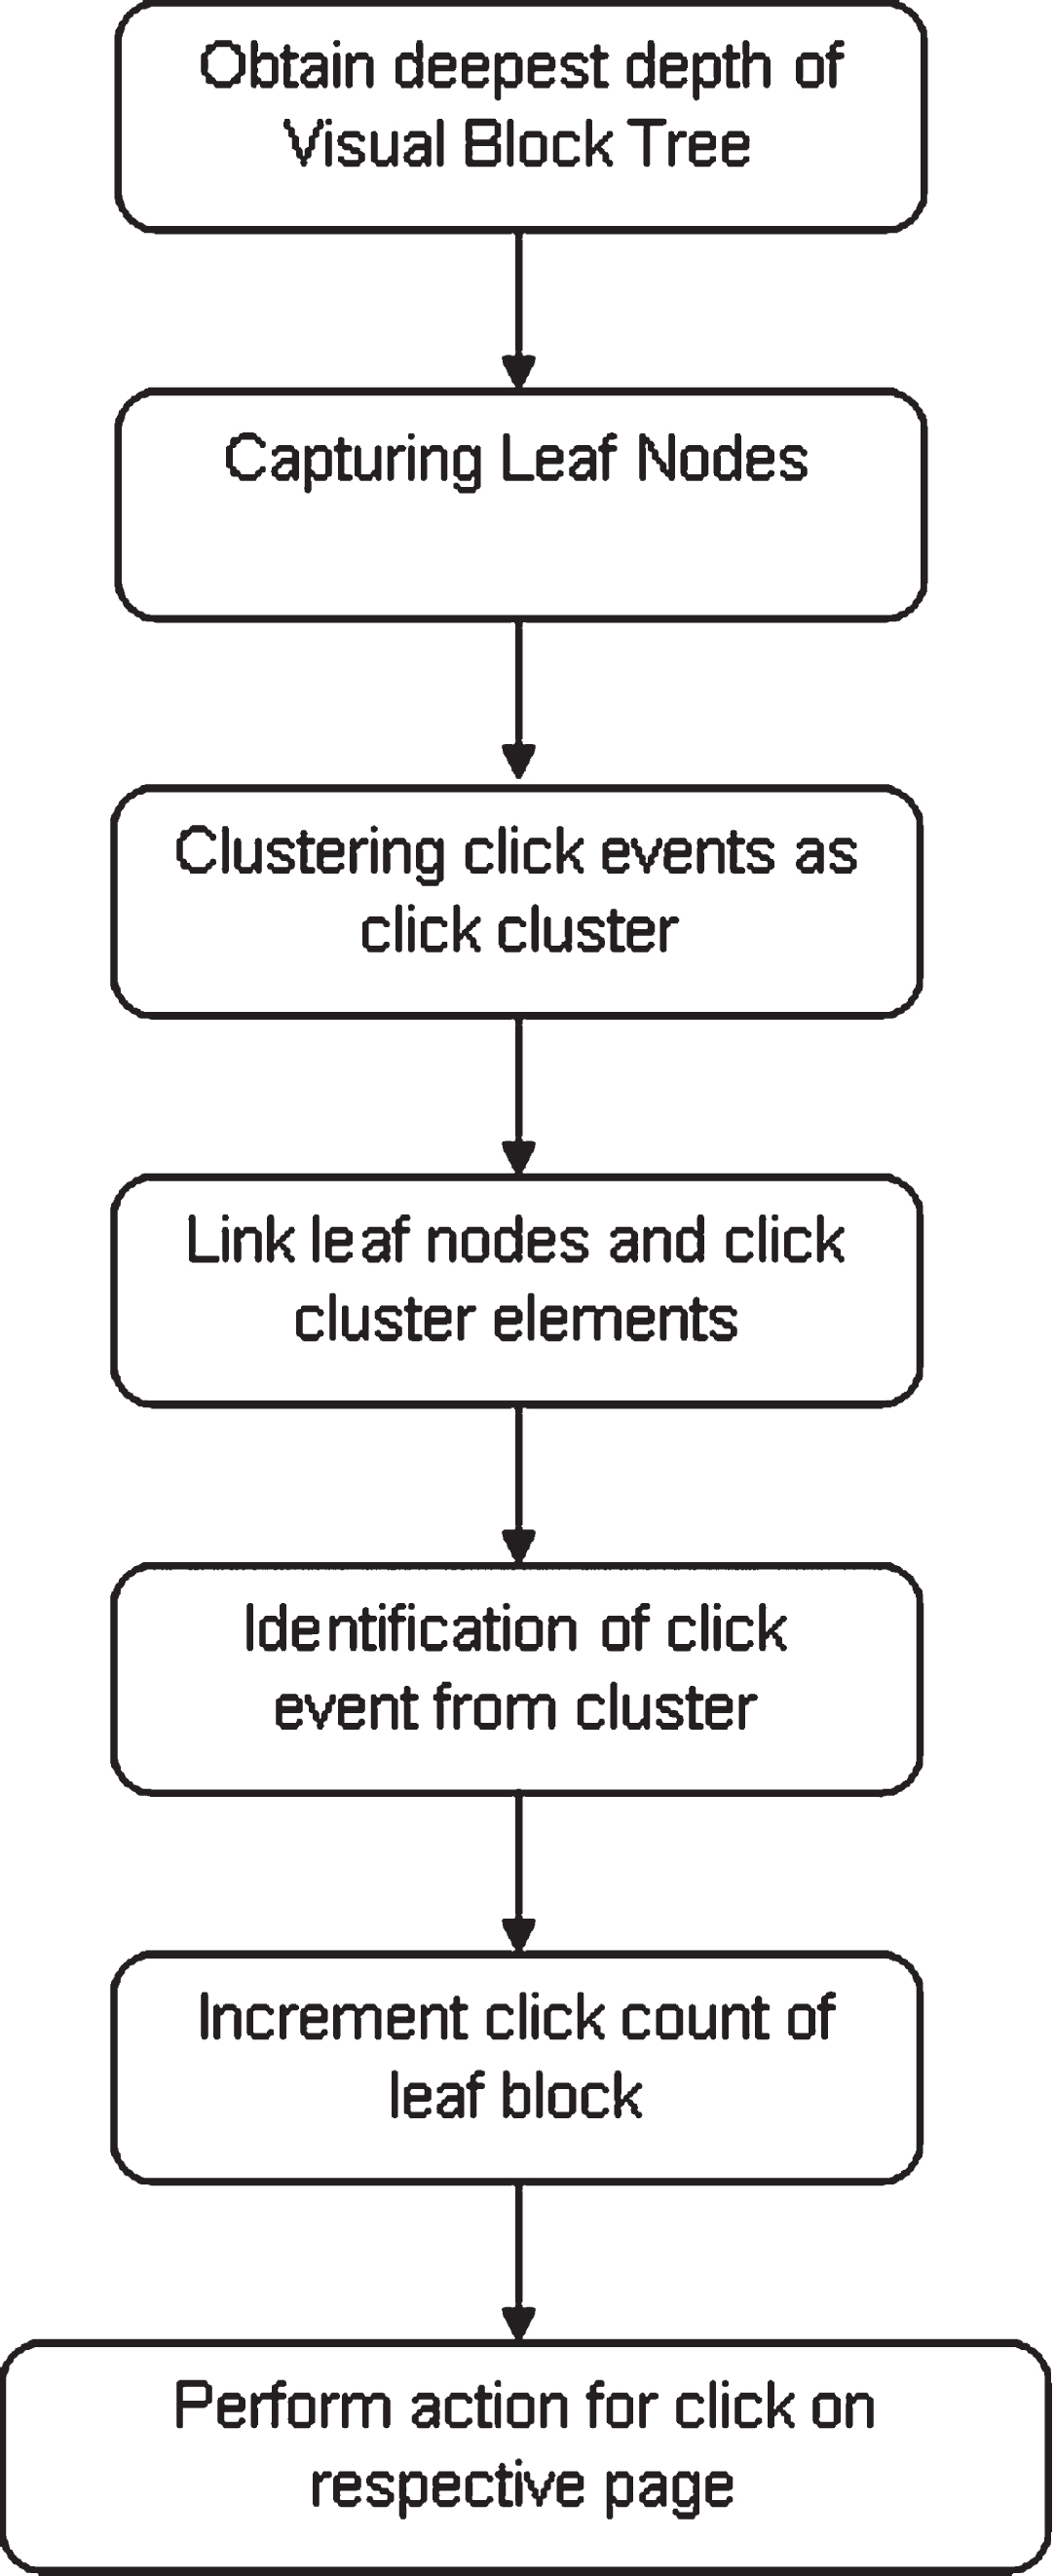
For each layout found from the visual block tree, a click counter is generated. When the user clicks on a particular layout, the corresponding click counter is incremented. Using the click counts of each layout the maximum utilized space in the webpage is calculated. In case of Quest Events Webpage, the maximum number of events enrolled through this VIPS Click Counter Technique is found. The parsing output is depicted in Fig. 7.

XML layout parsing.
Organizing and scheduling events among school students is a challenging task in which resource allocation has to be made in an efficient way for participation. Upon considering the year 2020, a set of 76 events has been planned and conducted depicting the semantic structure and segments provided in the web page as depicted in Fig. 5. From the divided segments the incorporation of each event is made accordingly. The following Fig. 8–11 provide the events and its count with each levels considered for quest 2020.

Projection of event count in Level A.

Projection of event count in Level B.

Projection of event count in Level C.

Projection of event count in Level D.
It has been observed that some of the events are less preferred by the student and some events are mostly registered by all the students. These favourite events have to be clearly identified for representing the best segments in the web page with spatial and block based on visual perception. Thus it improves the usability and visibility of most favoured events for school students to register for the events conducted [17]. In general the intention of school students mostly relies on their favourite event or the event that has been chosen by their colleague. If the impact of visibility is made with significant visual effects this will ultimately increase the count and intention of registration process by student teams.
From the event analysis it has been observed that some of the events are mostly preferred by many of the students for all the levels [21]. The following Table 2 summarizes the mostly preferred events among the school students for participation in [20]. These identified events are placed in the visitor’s flow to easily improve the usability and visibility based on the proposed VIPS web page segmentation. The projection of maximum participation is given in Figs. 8, 9, 10 and 11.
From the mostly preferred events the analysis of click counts is made in such a way that the space optimization and the visual perception are improved [18]. This will be continuously made with a good view of segments for the Quest 2021. Hence the event will be segmented with more priority on top which is mostly preferred with the degree of coherence.
Mostly preferred events from all Levels
The goal of the proposed study is to provide an optimal automated web analytic approach for web page space utilisation. Segment Analytics tracks how users engage with different sections of the website [25]. The statistical analysis is based on the link’s location. The concept of space utilisation is utilised to optimise the location of data. To improve design analytics at the entity level, user metrics and stats for every part of a web pages are used. A comparison of segment analytics information and web analytics statistics on links in a page can improve the effectiveness of a web page [23]. A page with a high bounce rate can have the most sought element in the most clicked section. The most clicked graphic block of a page can be optimised for space. As a result, the bounce rate is reduced, making it easier for the user to find what they’re looking for. In addition, the gathered data is visualised and shown on the webpage. The VIPS algorithm’s performance with click-enabled service is depicted in Table 3 respectively verified [19].
Experimental results obtained for sentimental analysis using feedback
Experimental results obtained for sentimental analysis using feedback
In chi-square analysis the estimation of joint distribution of two categorical variables can be determined more efficiently. These tables are said to be contingency or crosstab tables. The evaluation of data is segmented into two-way process for analysis. This is mostly suited for analyzing the survey or to predict the significance of future trends with the existing data patterns. The measure of chi-square analysis performs the calculation of contingency-table statistics for estimating the trend in the proportion values.
In the view of statistical evaluation and analysis the count observed for the set of student during the year 2020 is found to be increased when compared to the previous years. This should be considered as important and it is mainly due to the data driven approach that has been formulated with the segmentation of the web page using VIPS. If the data in Table 1 is viewed as a contingency table then the incorporation of chi-squared analysis can be made to determine the test of independence between the rows and columns. Since each of the level is independent of one another we can preferably formulate hypothesis for the observed data.

Page segmentation output.
Test Interpretation
H0: The rows and the columns of the table are independent.
H1: There is a link between the rows and the columns of the table.
From the observed and expected values the test of independence is depicted in Table 4 as:
Chi-square analysis
From Table 3 If the computed p-value is less than the significance level alpha = 0.05, the null hypothesis H0 should be rejected, and the alternative hypothesis H1 should be accepted. Therefore each of the level and its corresponding data values are independent of each other. The percentage of deviations is also observed for the generated value. The target behind the percentage deviation and the residual are noticed to be the degree to which the cell frequency of chi-square value differs from the generated value that is based on the formulated null hypothesis. The observed percentage deviation is depicted in Table 5.
Percentage deviation for the contingency values
The value of percentage deviation is calculated using the Equation 1 as:
Hence the deviation in percentage of about +15% specifies the observed frequency is 15% greater than the value of the expected measure. The rate of percentile deviation of –15% determines the observed frequency is found to be 15% smaller than that of the expected value. If the value of degrees of freedom is found to be 1, then we have the following incorporation in the measure of continuity as depicted in Equation 2 as:
Where,
The output value is positive if obs > exp
The output value is negative of obs < exp
Similarly the values of residual calculation for a cell for the chi-square values is calculated as in Equation 3 as,
The value of calculated residuals is depicted in Table 6. If the value of degrees of freedom = 1, then the Equation 3 gets modified as,
Standardized residuals for the contingency values
Where,
The output value is positive if obs > exp
The output value is negative of obs < exp
The value obtained as a result of chi-square analysis is said to be the equal value of sum of the square of standardized residuals. If we assume that the null hypothesis is true, then the expected value of the cell is at least 5. The values of the standardized residual belong to a normally distributed sampling distribution with a mean of zero and a standard deviation of±1.0. Hence our observed value falls with the specified range we can confirm that the levels are independent of each other. Also the mechanism of hybrid web analytic approach can be used up with different sorts of data with different parametric execution, the only thing needed is the parametric setting with the selective algorithm.
One of the challenges in web analytics is to collect the data corresponding to the website. One of the options is to have web server log analysis, which is considered to be server-side data collection with its log analysis. The next is to enable client-side text analytics-based approach to solve for page segmentation and tagging. In this research work, we have proposed a hybrid web analytic approach using click enabled VIPS algorithm for analyzing the web page to locate the important links and position with effective space utilization. The design is made in such a way that each of the segments is enabled with click-based user interaction and data visibility. The experimental results shows that the proposed work provides an improved accuracy of about 92.80% in terms of user interaction and event suggestion for different events conducted through quest web page. As a result, the proposed method can be used to extend any web-based reporting tool or dashboard. This method can be applied to online dashboard tools as well. Tableau for example, is quite similar to Qlik view can be enabled for the user to have access with regard to publicly available and in auction. The maximum and minimum participation in events is analyzed and their interpretation is also studied. The maximum liked events are given top priority in the segments of the web page with more visual perception. Thereby, the user can view more of what he wants on the first page thanks to the space optimization strategy. Furthermore, the bounce rate can be lowered. The proposed web analytic solution with effective text analysis process through segmentation can therefore improve dashboard spacing, user view, click analytics, and conversion rate monitoring.
Conflict of interest
The authors declare that they have no conflict of interest.