
Abstract
Categorical Boost (CatBoost) is a new approach in credit rating. In the process of classification and prediction using CatBoost, parameter tuning and feature selection are two crucial parts, which affect the classification accuracy of CatBoost significantly. This paper proposes a novel SSA-CatBoost model, which mixes Sparrow Search Algorithm (SSA) and CatBoost to improve classification and prediction accuracy for credit rating. In terms of parameter tuning, the SSA-CatBoost optimization obtains the most optimal parameters by iterating and updating the sparrow’s position, and utilize the optimal parameter to improve the accuracy of classification and prediction. In terms of feature selection, a novel wrapping method called Recursive Feature Elimination algorithm is adopted to reduce the adverse impact of noise data on the results, and further improves calculation efficiency. To evaluate the performance of the proposed SSA-CatBoost model, P2P lending datasets are employed to assess the prediction results, then the interpretable Shap package is used to explain the reason why the proposed model considers a sample as good or bad. Consequently, the experimental results show that the SSA-CatBoost model has an ideal accuracy in classification and prediction for credit rating by comparing the SSA-CatBoost model with the CatBoost model and other well-known machine learning models.
Introduction
Classification and prediction are the core tasks of machine learning in credit rating. In recent years, a variety of gradient-boosting machine learning methods have developed for building classification and prediction models, of which, Categorical Boost (CatBoost) based on Gradient Boosting Decision Tree (GBDT), with its fewer parameters and superior algorithms, already has a pivotal position in the field of machine learning. Prokhorenkova et al. [1] proposed CatBoost for the first time in 2017, and pointed out that the most effective way to minimize the loss of information when dealing with categorical features is to use Target Satistics (TS) as a new numerical feature [2], then demonstrated that CatBoost outperforms leading GBDT packages. Dorogush et al. [3], to reduce the gradient bias and accelerate the scoring and training speed, modified the algorithm of selecting the tree structure, adopted the oblivious tree to facilitate the calculation of leaf values, and GPU acceleration to optimize the CatBoost model. After that, CatBoost enriched the categories of machine learning models, and many people put the CatBoost model into practical applications. Jabeur et al. [7] compared the performance of CatBoost and eight machine learning models which include SVM and Random Forest for rating the company’s credit level, and proved that the CatBoost model has a significant improvement in classification performance. Li et al. [5] utilized CatBoost to measure the credit risk in P2P lending and found that CatBoost was superior to SVM, Random Forest and other traditional machine learning models. Ibrahim et al. [8] discussed the performance of CatBoost, Random Forest and other machine learning models, recommended CatBoost for better prediction of loan approvals. Izotova and Valiullin [6] used the classification algorithm in the CatBoost model to solve the problem of fraud detection. These works mentioned above have obtained some promising results, and numerous researches on CatBoost have been reported in [9–12], but parameter tuning are not involved in these papers, which is the essential part during the classification and prediction process, via iteration will directly affect the machine learning model’s performance. If appropriate parameter is employed, the results in these papers will reach a higher level. The trial and error method is usually applied to find the optimal parameters. However, this method is inefficient, and the resulting parameters are most likely not optimal. Swarm intelligence algorithm is an excellent approach for optimizing machine learning model parameters. It significantly improves the calculation efficiency and adjusts the parameters more accurately. (It adjusts the parameters more accurately and improves the calculation efficiency significantly.). Hence, many researchers use this (swarm-intelligence-based) method to optimize the parameters of the machine learning model. Dong et al. [13] mixed Bat algorithm and CatBoost model for predicting the pan evaporation in northwest China. Huang and Dun [14] combined the Particle Swarm Optimization (PSO) algorithm and SVM model to perform feature selection and parameter optimization. Barmana and Choudhur [15] hybridized Grey Wolf Optimizer (GWO) with SVM to predict the power system load in the Indian state of Assam. Many successful examples of combining machine learning methods with group calculation methods have been published [16–27] and have achieved remarkable results. Instead of PSO and GWO, this study tries a more advanced swarm algorithm, Sparrow Search Algorithm (SSA), which proposed by Xue and Shen [4] in 2020, inspired by the swarm wisdom. SSA with its high computational efficiency and fast convergence speed has been widely used in machine learning and other fields. It formed from the predation and anti-predation behavior of sparrows and randomly selects producers from the entire population. When the surrounding danger is less than the safety threshold, the producer will continue to initiate an alarm to warn the surrounding sparrows. Otherwise, the producer will take anti-predation behavior and lead the sparrow to fly to a safe position. Finally, the fitness and the best position for the entire population will be found via multiple iterations of the sparrow position. By comparing SSA with GWO, PSO, and Gravitational Search Algorithm (GSA), Xue and Shen [4] fund that SSA has apparent advantages in accuracy, stability, and other aspects.
Another crucial issue in the performance improvement of the machine learning model is feature selection, which has a direct effect on the classification and prediction accuracy. A classification problem always needs abundant features to prompt the machine learning model to make correct judgments when classifying, however, a key point is some features involved in dataset maybe useless or redundant. Once those redundant features are retained by the dataset and utilize the dataset to train a machine learning model, this will lead to a decrease in the accuracy of classification. In order to increase the accuracy of classification, feature selection is required in the process of dealing complicated data, and many researches have been reported. Li et al. [24] proposed a novel feature selection method named chaotic search algorithm which is embedded in the searching iterations of GSA to optimize the feature subsets. Wang and Ku [31] employed the Correlation-based filter method due to it can generate a general feature subset, and 22 features are selected out of 28 features, achieved an ideal result in corporate credit rating.
In this paper, motivated by Huang and Dun [14] and other researches [16–27], SSA was borrowed as an optimization algorithm to tune the regularization parameter in CatBoost, then formed a hybrid SSA-CatBoost model for personal credit rating experiment. Furthermore, a feature selection algorithm named Recursive Feature Elimination is utilized to improve the accuracy of classification. Consequently, by comparing with CatBoost, XGBoost, and other machine learning models, we found that SSA-CatBoost has better classification and prediction performance in our experiment.
This paper is organized as follows: Section 2 describes the related works of CatBoost and SSA. Section 3 illustrates the specific process of the SSA-CatBoost model. Section 4 describes the source and processing of the data. Section 5 gives some experiments which verify the effectiveness of the SSA-CatBoost model. Conclusions are finally drawn in Section 6.
Related works
CatBoost
CatBoost classifier
Assume we observe a dataset of examples
There are two common approaches to minimize the expected loss, the Newton method and the Negative Gradient method [1] that both aradient descent methods. Since the Newton method uses the second-order partial derivativto calculate the negative gradient, it improves the quality of the classified results, and we mainly introduce the Newton method in this paper. According to the document [28], CatBoost uses the following loss function (the loss function is defined:):
In the internal structure of CatBoost, trees are bui sequentially, and each next tree is built to approximate negative gradients
h (x) is a decision tree function of the explanatorvariables x, R j is the disjoint regions corresponding to the leaves of the tree.
The score function is a key issue of CatBoost, it measures the quality of gradient approximation. When a new tree needs to be added to the ensemble, the score function is used to evaluate the gradient descent optimization of the candidate tree, and it contains the following four categories: L2, Cosine, NewtonL2, and NewtonCosine. Based on the Newton method in Section 2.1.1, NewtonL2 use second-order derivatives in the calculation process, this approach can improve the quality of the model rests. In order to derive NewtonL2 [28], We start from L2:
The next step is to find the index i* of the optimal fte and the suitable boundary 𝕓* of the tree. From equation (3), after regrouping by left leaves and right leaves, the lose function takes follow form:
As expressed in formula (10), the regularization parameter λ is in the denominator of the leaf value, which means that the larger the L2 regularization parameter, the smaller the leaf value. This situation will lead to over-fitting, otherwise it will lead to under-fitting. Hence, it is necessary to find a suitable regularization parameter with SSA to achieve the optimal accuracy of the classification of the CatBoost model.
Eanding the brackets of equation (7), use
Thus, the NewtonL2 score function is expressed as follows:
Followed [4], a detailed description on the SSA is given. Suppose a matrix of X
i
,j represent the position of sparrows, where i is theber of sparrows, and j shows the parameter dimension that needs to be optimized. Afterward, the optimized fitness of all sparrows can be described by F
X
:
Once the location of the producer is updated, the position of the beggar will also change. If
Fitness definition
As mentioned in Section 2.1.2, improper regularization parameters will lead to over-fitting or under-fitting of the model. In order to find an appropriate regularization parameter L2 _ leaf _ reg, SSA is used to optimize the regularization parameter of the CatBoost model. To implement the idea of combining SSA and CatBoost, the following step is to define the Fitness which measures the accuracy of SSA-CatBoost for data prediction in each iteration. Firstly, the dataset is randomly divided into K subsets, then build K CatBoost models for each subset. Now, the Fitness is defined as the average value of the prediction accuracy of the K CatBoost models, that is:
This section gives a detailed description on the hybrid model of SSA-CatBoost. For simplicity, the essential parameters are listed and explained in Table 1.
Essential parameters of SSA-CatBoost
Essential parameters of SSA-CatBoost
Next, the procedures of SSA-CatBoost are given as follows:
Step 1. Data preparation: For a research dataset, we randomly divide it into K subsets, each of which contains the training set and the test set. The training set is to build a basic CatBoost model. The test set is to evaluate the classification accuracy of the CatBoost model.
Step 2. SSA parameters setting and initialization: Set the SSA parameters, including the number of sparrows, the warning threshold, the proportion of discoverers, the ratio of sparrows aware of the danger, and the maximum number of iterations. Then generate a random value of initial L2_leaf_reg via SSA.
Step 3. Set iteration i = i + 1.
Step 4. CatBoost model training and prediction: NewtonL2 is assigned to the Score function, and L2_leaf_reg is calculated by SSA. The basic CatBoost model is established through the training set, then use the test set to make predictions. Then, the average values of prediction accuracy are obtained.
Step 5. Fitness calculation: After training the CatBoost model on the training set and predicting on the test set, formula (14) is used to calculate the Fitness which is the global fitness of sparrows in SSA.
Step 6. Sparrow position updating: All the sparrows move according to the fitness value, and update the positions that followed formulas (11), (12), (13). Each sparrow moves to next new position, and the new position produces a new L2 regularization parameters L2_leaf_reg.
Step 7. Parameter optimization results checking: The new L2 regularization parameter is employed to train CatBoost model, and used the trained model to obtain the prediction accuracy. Then, formula (14) is adopted to calculate the new Fitness value, if the new Fitness value is smaller than the former one, replace Fitness value with the new Fitness value, and keep the regularization parameter which corresponds to the new Fitness value; otherwise, abandon the regularization parameter value which corresponds to the new Fitness, and adopt the former Fitness to continue searching for a smaller one, until meet the condition of Step 8.
Step 8. End condition checking: If the current number of iterations is less than the maximum number of iterations, return to Step 3; otherwise, proceed to the next step.
Step 9. End the SSA-CatBoost model.
Based on the above, the flowchart of the SSA-CatBoost model is summarized in Fig. 1.
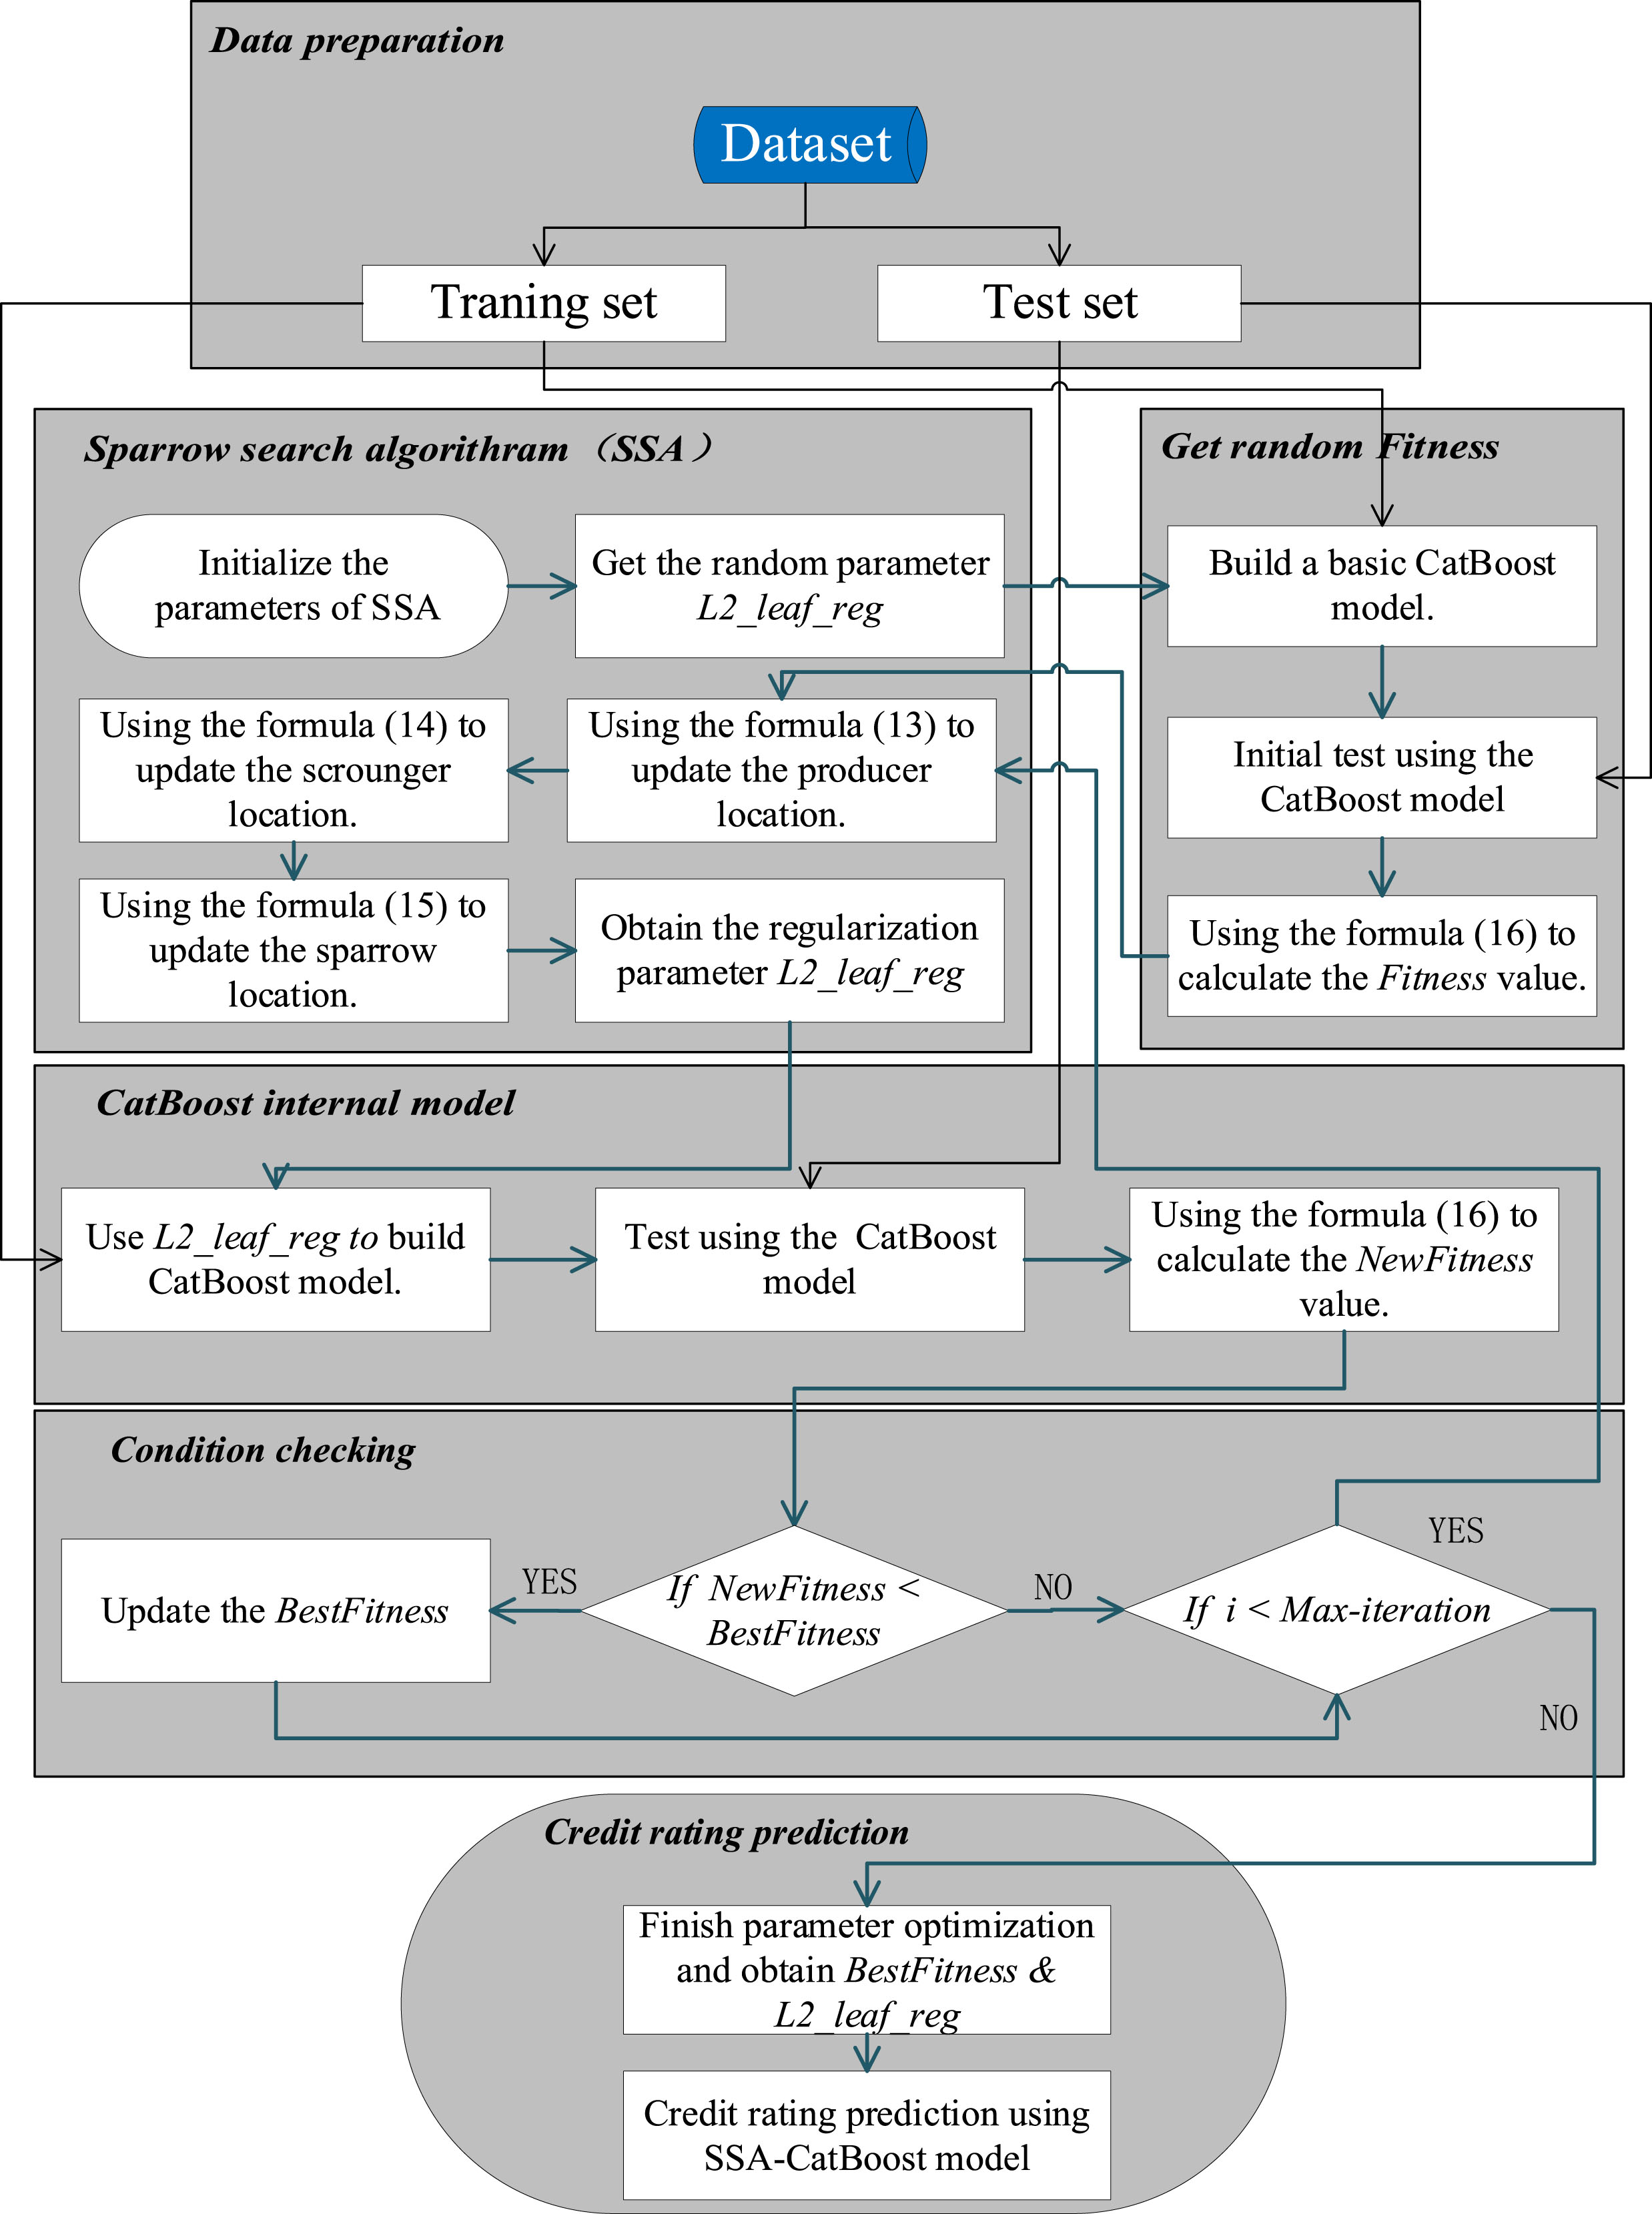
Flowchart of the SSA-CatBoost model.
Data description
In this paper, the data chosen from the US Lending Club company is employed to evaluate the performance of SSA-CatBoost model, and contains 28339 pieces of transaction records are entered our research. Before using these data to build SSA-CatBoost model, some missing borrower features have been filtered out to ensure the data is authoritative and valid. Now, we summarize the borrower’s personal information with 81 features, of which, feature ‘grade’ is divided into three categories: A, B, and C, and each class is further divided into five sub-categories. That is, Lending Club uses these 15 sub-categories to identify credit ratings for borrowers. Figure 2 shows the percentage of each sub-category.

Proportion of each sub-category.
Feature selection plays a key role in credit rating. Among all the features of borrower’s personal information, some features have major contributions to classification and prediction, other features may be slight or redundant. If the dataset contains the slight or redundant features and is utilized to train CatBoost model, it will cost longer computational time, and decrease the accuracy of classification and prediction. Nowadays, feature selection has three groups: Wrapper methods, Embedded methods and Filter methods. Wrapper methods are based on the weight of features in the training model to eliminate features with lower weight and retain features with higher weight. The selected subset consists of the features with higher weight, and use it to train the machine leaning model with best performance [29]. Embedded methods eliminate slight and redundant features in the process of training the model. Rodriguez-Galiano et al. [29] use wrapper and embedded method to evaluate the prediction strength of every feature, and the result shows that, wrapper method has a lower mean misclassification error than embedded method, although it costs a longer computational time. Filter method is based on the correlation between features and target variables to eliminate slight and redundant feature. Rodriguez-Galiano et al. [29] also point out that the subset selected by filter method will increase or decrease the classification accuracy of the machine learning model. This can be found in [29].
As mentioned above, wrapper method has a better performance than other two feature selection methods. As one of Wrapper methods, Recursive Feature Elimination algorithm is more advanced than others. It trains the CatBoost model to get the weight of every feature, and eliminates noise data by iterates multiple times to complete the feature selection. Thus, Recursive Feature Elimination algorithm is applied to select those features in this paper. The following gives a detailed description about Recursive Feature Elimination algorithm.
Using dataset
Invoked that
Description of selected features
Features and their corresponding scores
Experimental environment and evaluation indicators
The experimental environment is based on Python 3.6.3. The processor of the physical host is Intel Core i7-6700HQ, and the operating system is 64-bit Windows 10.
In this paper, a set of evaluation indicators is introduced to evaluate the performance of experimental results, namely Accuracy score, Precision score, Recall score, and F1 score. The specific formulas related to these evaluating indicators are shown as follows.
Another evaluation indicator is Receiver Opating Characteeristics (ROC), which measures the performance of classification accuracy, plots the false positive rate (FPR) on the Y-axis and the true positive rate (TPR) on the X-axis.PR and TPR are defined as follows:
An ideal machine learning model’s ROC curve coincides with the Y axis, but any model cannot achieve this situation. Area Under the Curve (AUC) is defined as the area composed of the ROC curve and the abscissa, and it always be bounded between 0 and 1, which can intuitively evaluate the classifier’s performance. The larger the size, the stronger the classification performance of the machine learning model.
According to (16), the fitness curve as shown in Fig. 3. It shows the fitness value gradually decreases with iterations from 0 to 200, and tends to be stable after reaching a certain number of iterations. It achieves a better and stable convergence after 25 iterations, which means that SSA continuously looks for the regularization parameters during the iteration process and finally finds the optimal one. Then, using the optimal regularization parameter, train the CatBoost model and compare the performance of SSA-CatBoost to other machine learning models, we will give full details about this in the next section.
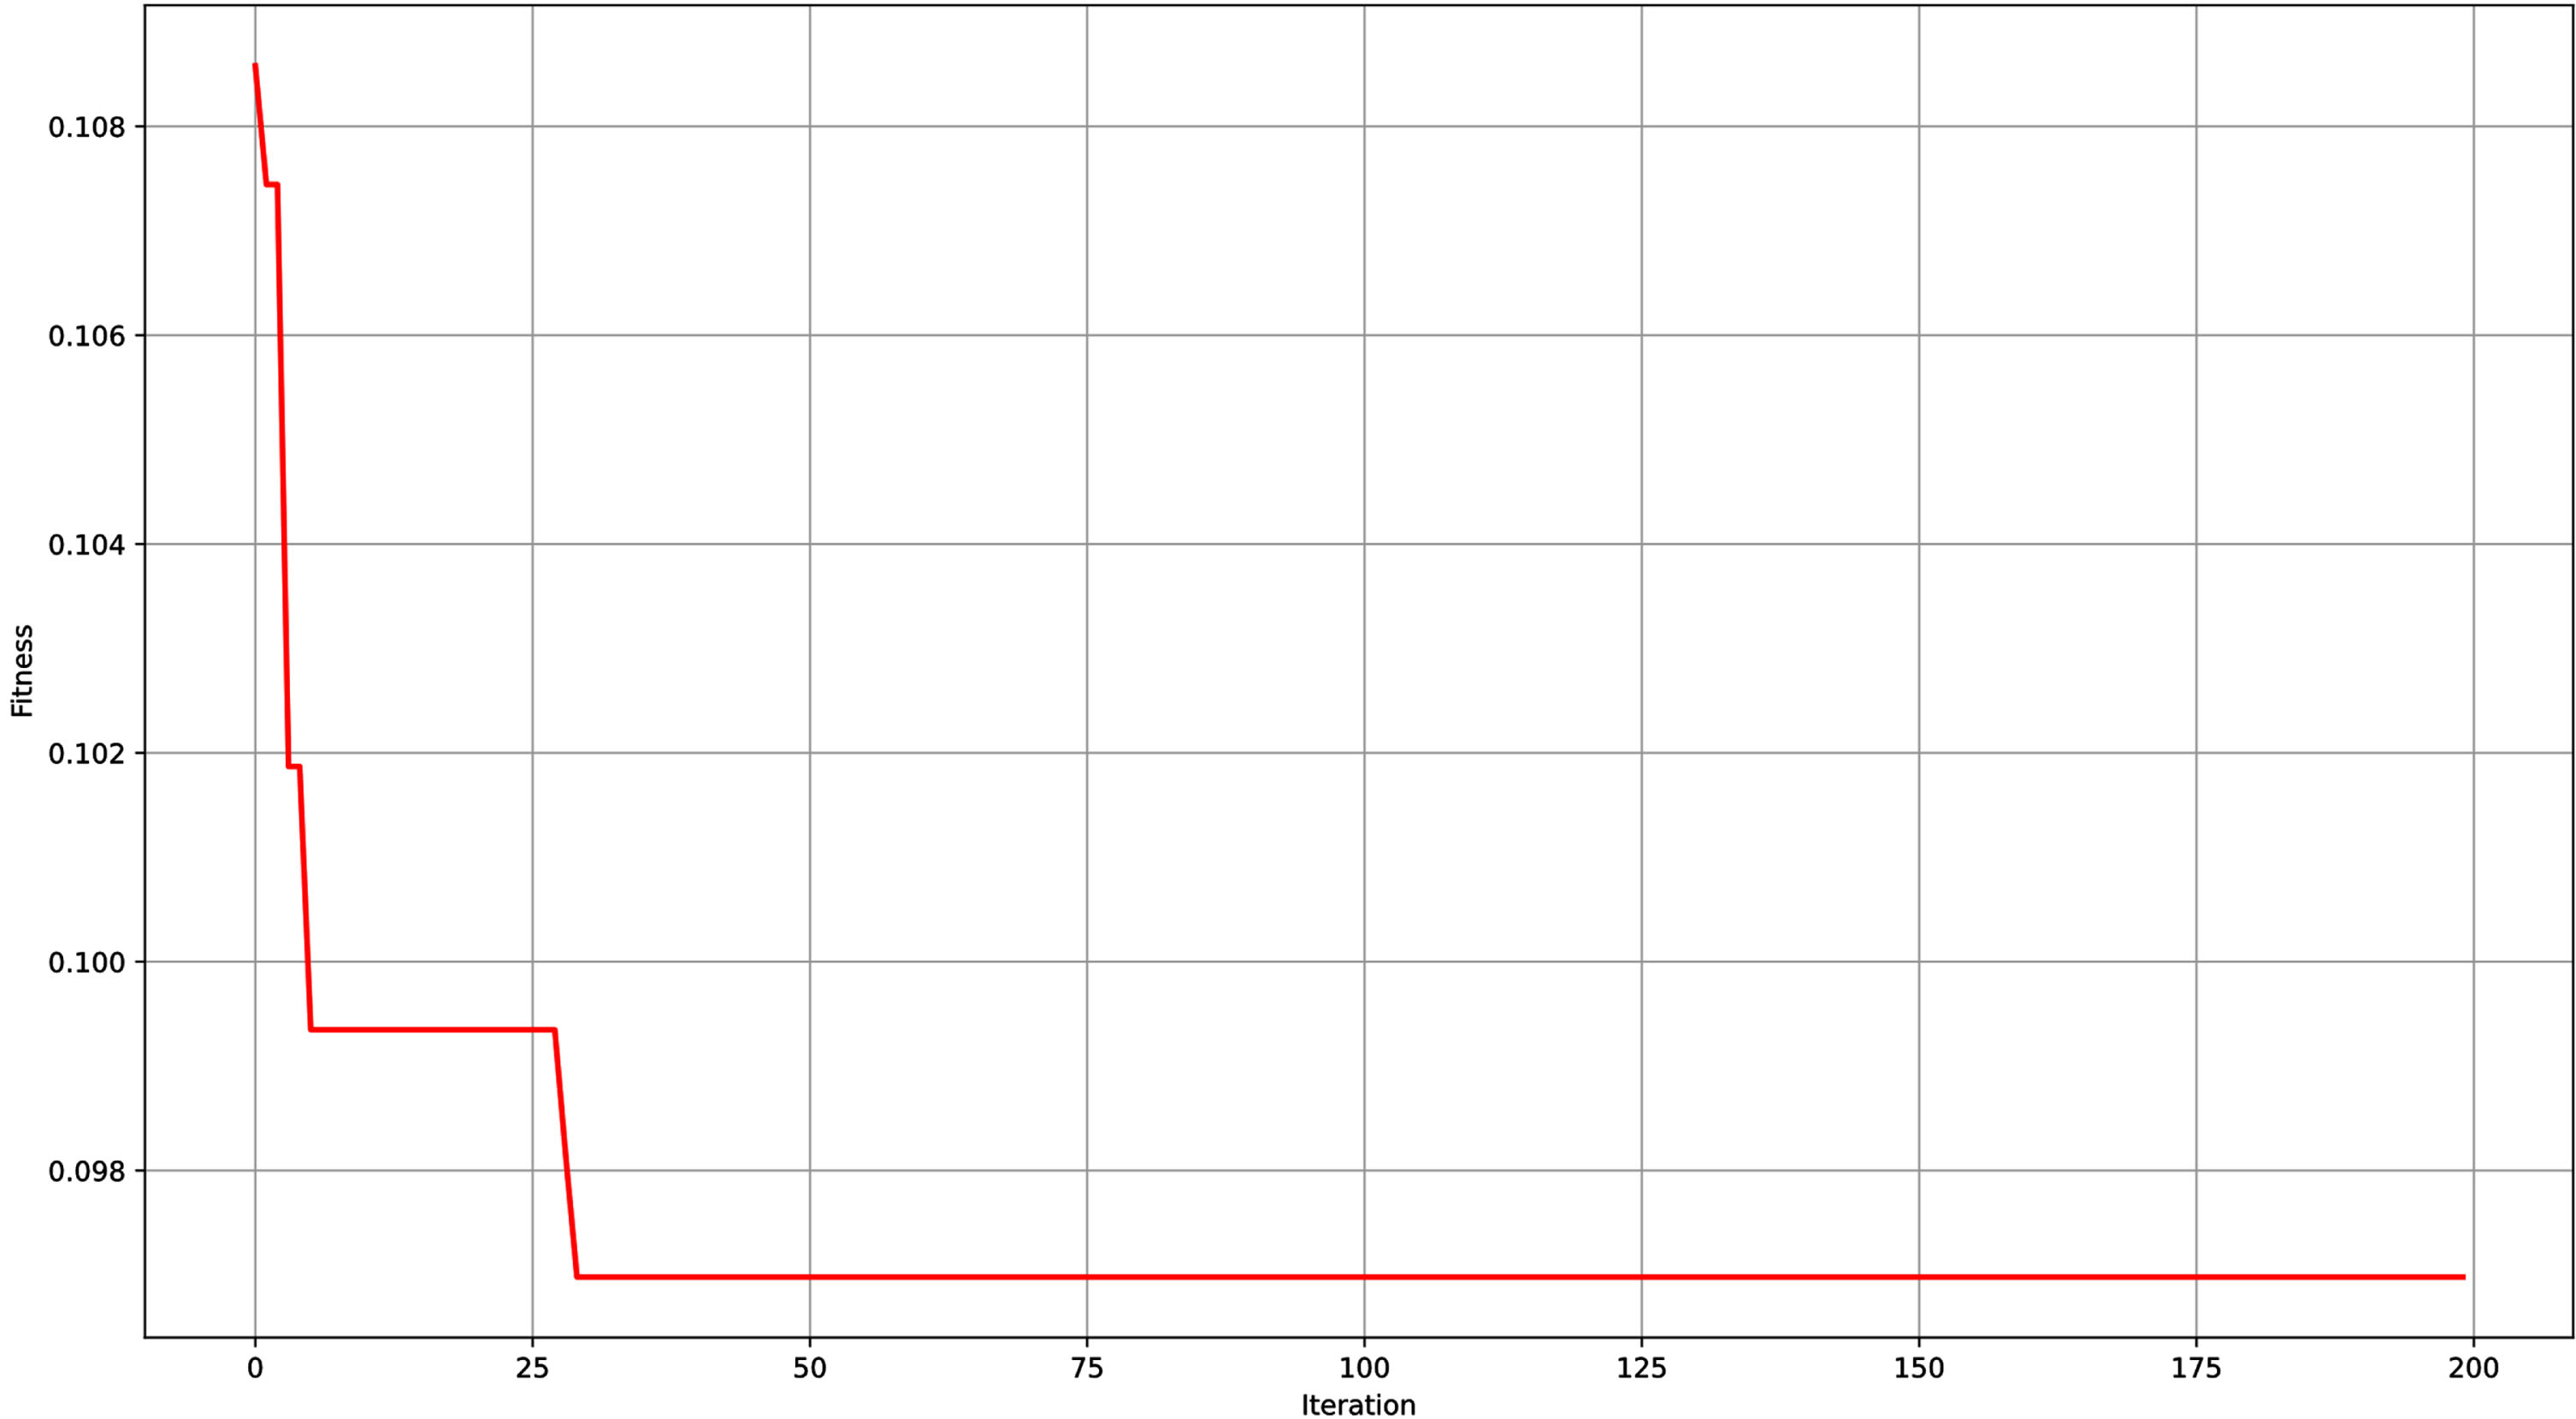
Fitness value curve of SSA-CatBoost model.
Proper model parameter setting can improve significantly the classification accuracy, and SSA is an advanced algorithm to optimize parameter. So in this paper, SSA is employed to tune the regularization parameter L 2_leaf_reg in CatBoost to obtain the optimal parameter. To test the performance of the SSA-CatBoost model, some comparison experiments is given as follows:
Case I. Comparison between SSA-CatBoost and some other classical models such as XGBoost, LightGBM, SVM and CatBoost. In this case, the CatBoost model and other models all set default parameters without tuning any hyperparameters manually.
Case II. Comparison between SSA-CatBoost and other classical models with optimal parameter values, such as SSA-XGBoost, SSA-LightGBM and SSA-SVM.
Experiment for Case I
To evaluate the performance of the SSA-CatBoost model, we compare SSA-CatBoost with other machine learning models. Here, the compared models include XGBoost, LightGBM, SVM and CatBoost which all set default parameters. As for the parameters in SSA-CatBoost, we try to set the sparrow’s number in an interval of 10 from 0 to 100. After several experiments, we found that the number of sparrows did not significantly affects the model’s classification accuracy. This phenomenon is because the sparrows will always move towards the optimal position, and the entire population will eventually converge to the optimal position. However, setting enormous sparrow size will result in a significant increase in the program’s running time. Hence, the number of sparrows is assigned to 20 in the following experiment. The detailed parameter information of SSA-CatBoost, CatBoost and other machine learning models are listed in Table 4.
Dominating parameters of machine learning
Dominating parameters of machine learning
After training these models on the training set and predicting the probabilities on the test set, the evaluation indicators including Accuracy score, F1 score, Recall score and Precision score is obtained, and Fig. 4 showed the comparison results associated to the four metrics. The SSA-CatBoost algorithm achieves the highest accuracy, as plotted with blue bar, and intuitively shows that the SSA-CatBoost model has better classification performance than other classifiers. More precisely, the corresponding values of evaluation indicators are recorded in Table 5, SSA-CatBoost achieved the highest Accuracy Score of 0.90302, Precision Score of 0.90150, Recall Score of 0.91422, F1 Score of 0.90758, much better than CatBoost, XGBoost and LightGBM. At the same time, the correctly classified value (TP+TN) and miss-classified value (FP+FN) of SSA-CatBoost also demonstrate the proposed model has a better performance than other three implemented models.
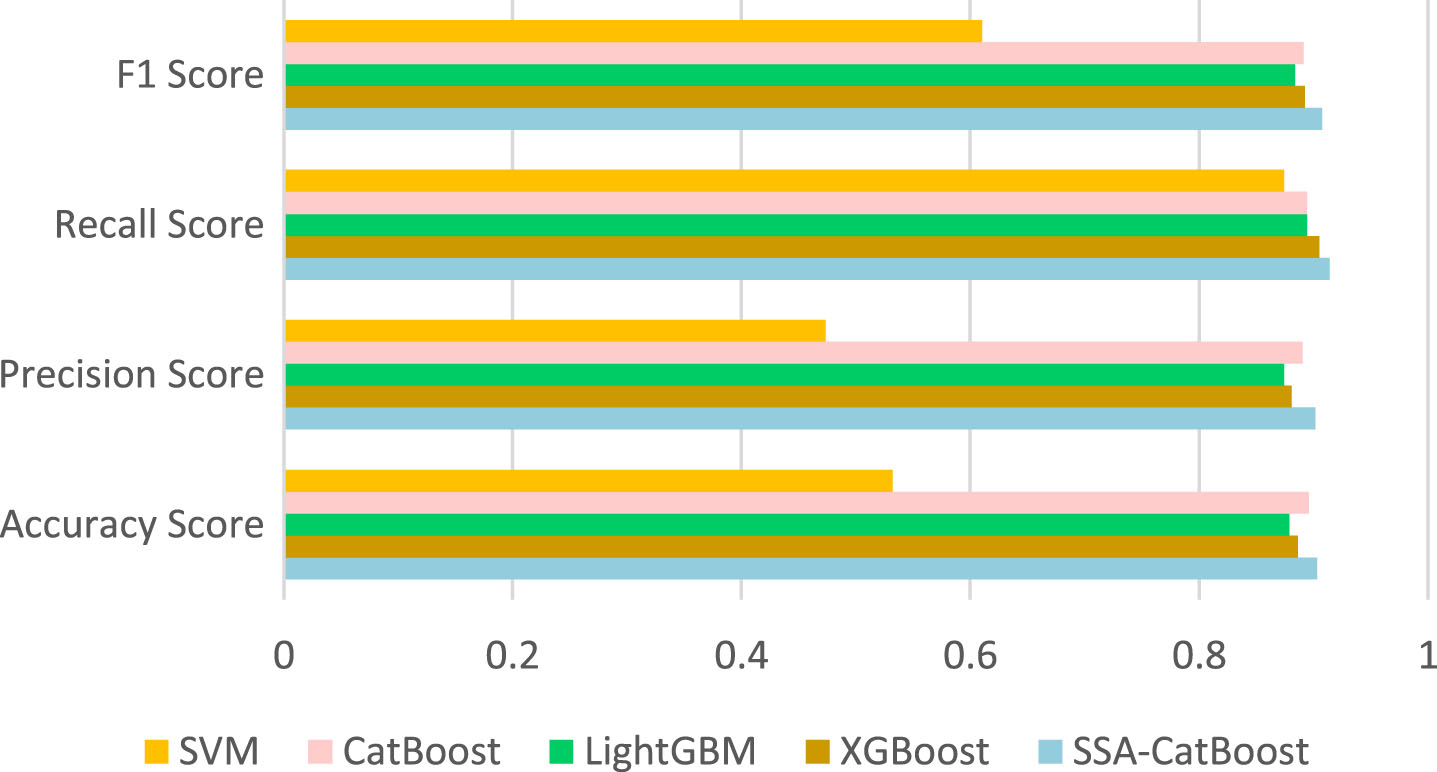
Comparison for the models with bar chart.
Performance comparison results of four models
In addition, Fig. 5 plots the ROC curve of the applied models, the SVM classifier has the least AUC value of 0.49522 while other machine learning models are higher than it, and the SSA-CatBoost achieves the highest AUC value of 0.97224 which means the proposed SSA-CatBoost better than the other classifiers.
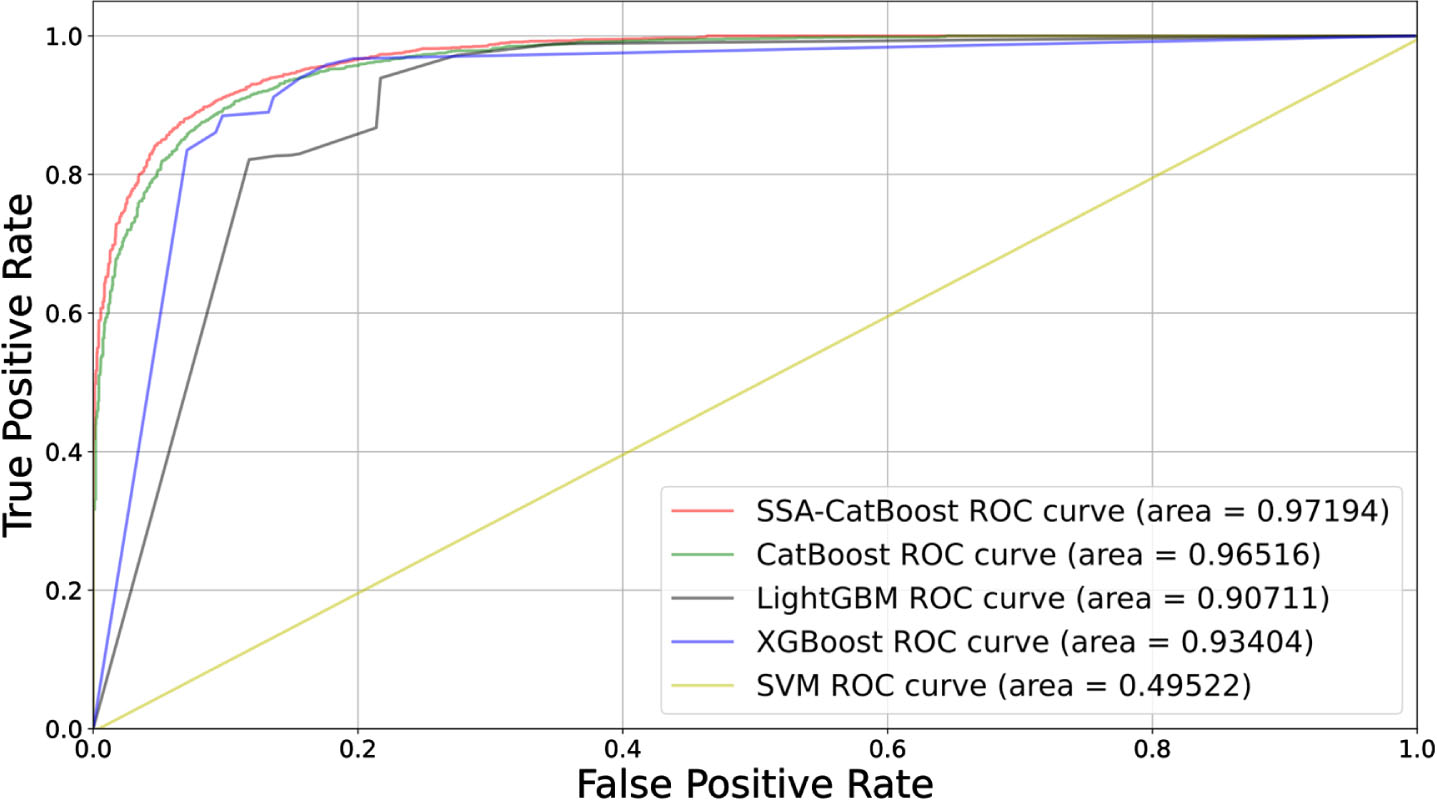
ROC curve for the models.
In order to demonstrate the effectivity of SSA-CatBoost, we construct SSA-XGBoost, SSA-XGBoost and SSA-SVM by implementing SSA to XGBoost, LightGBM and SVM, and further give some comparisons among these hybrid models. Similar to Section 5.3.1, we also obtain the accuracy of the four involved machine learning models (SSA-CatBoost, SSA-XGBoost, SSA-LightGBM and SSA-SVM) in Fig. 6, and find that all the accuracy of the three involved machine learning models improve significantly after optimized by SSA. Moreover, the SSA-CatBoost model still achieves the highest score of Accuracy score, F1 score, Recall score and Precision score. More detailed information about the evaluating indicators is shown in Table 6. Table 6 shows SSA-CatBoost achieves the highest Accuracy score of 0.90302, F1 score of 0.90758, Recall score of 0.91442 and Precision score of 0.90150.
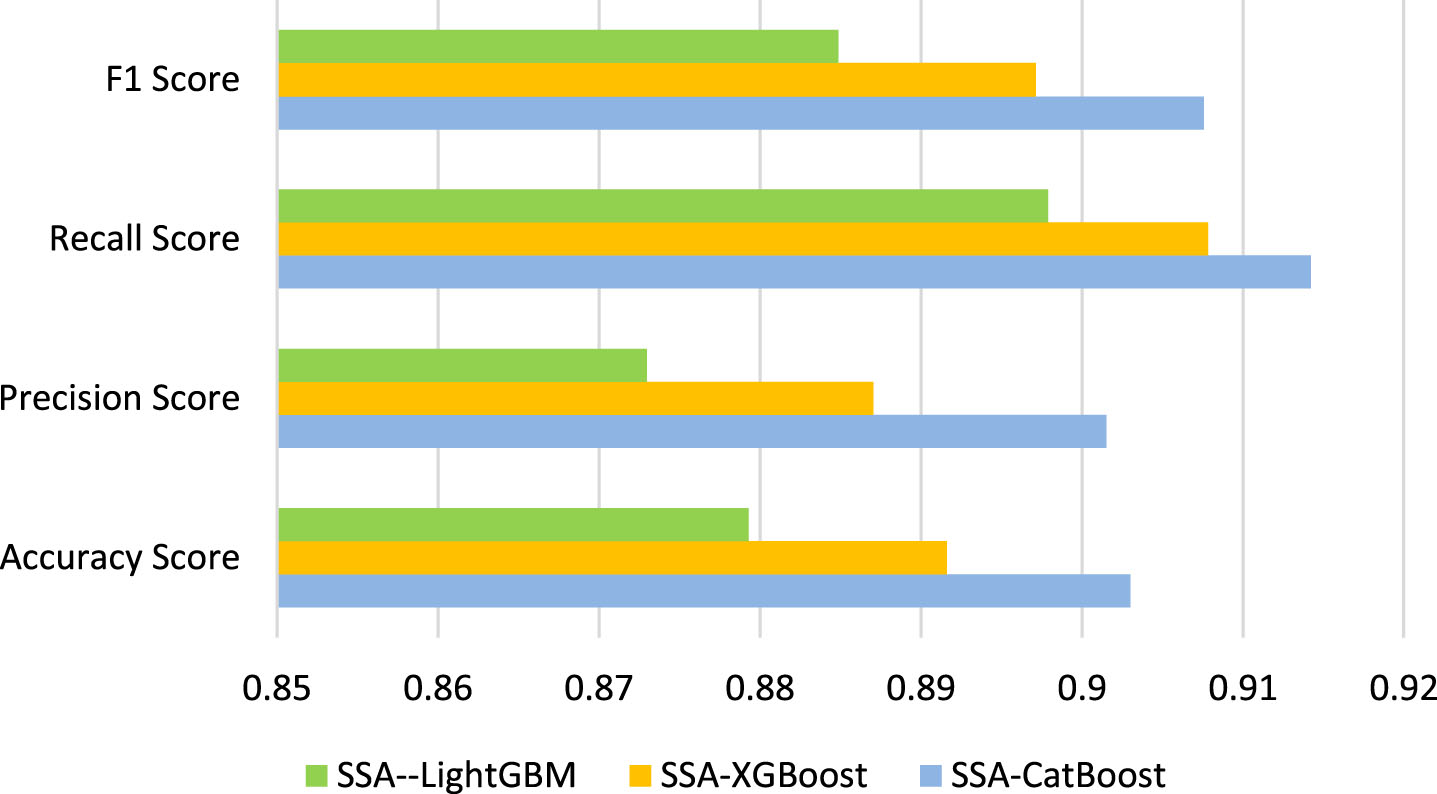
Bar chart for the models.
Model performance comparison
Noted that the prediction accuracy of the SSA-CatBoostt and SSA-XGBoost models is no much difference, but the AUC values of the two models are significantly distinct. This is the accuracy only measures the model’s ability of classifying samples, but AUC can better measure the comprehensive performance of the model. So, when comparing the performance of machine learning models, more attention should be focused on the AUC values. Consequently, the results measured by ROC curve in Fig. 7 illustrate the AUC value of these ensemble learning algorithm models. Compared with Fig. 5, machine learning models optimized by SSA have a significant improvement, the SSA-SVM classifier has the least value of 0.5, while SSA-CatBoost achieves the highest AUC value of 0.97224, this means SSA-CatBoost outperforms others. In addition, SSA-XGBoost’s AUC score implies that SSA-XGBoost’s performance is better than LightGBM, but inferior to SSA-CatBoost.
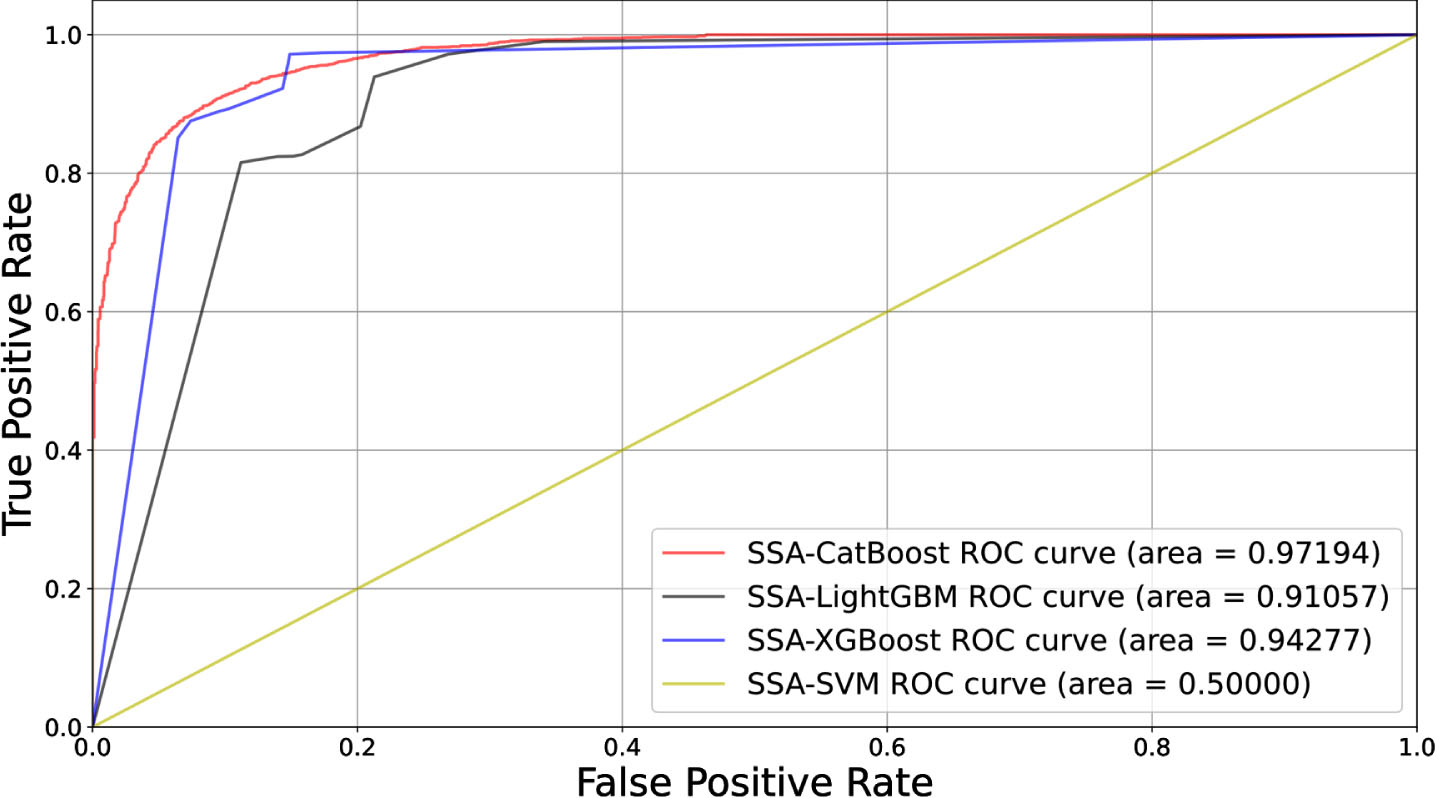
ROC curve for the models.
The interpretable machine learning Shap package is used to explain the SSA-CatBoost classification model experiment results. Below is a detailed description.
The summary plot on Fig. 8 illustrates the importance of every feature on the model output. This figure shows the importance of 20 features, from which we know the feature total_rec_int contains the most information and has a significant impact on the classification output, followed by the feature total_rec_prncp.
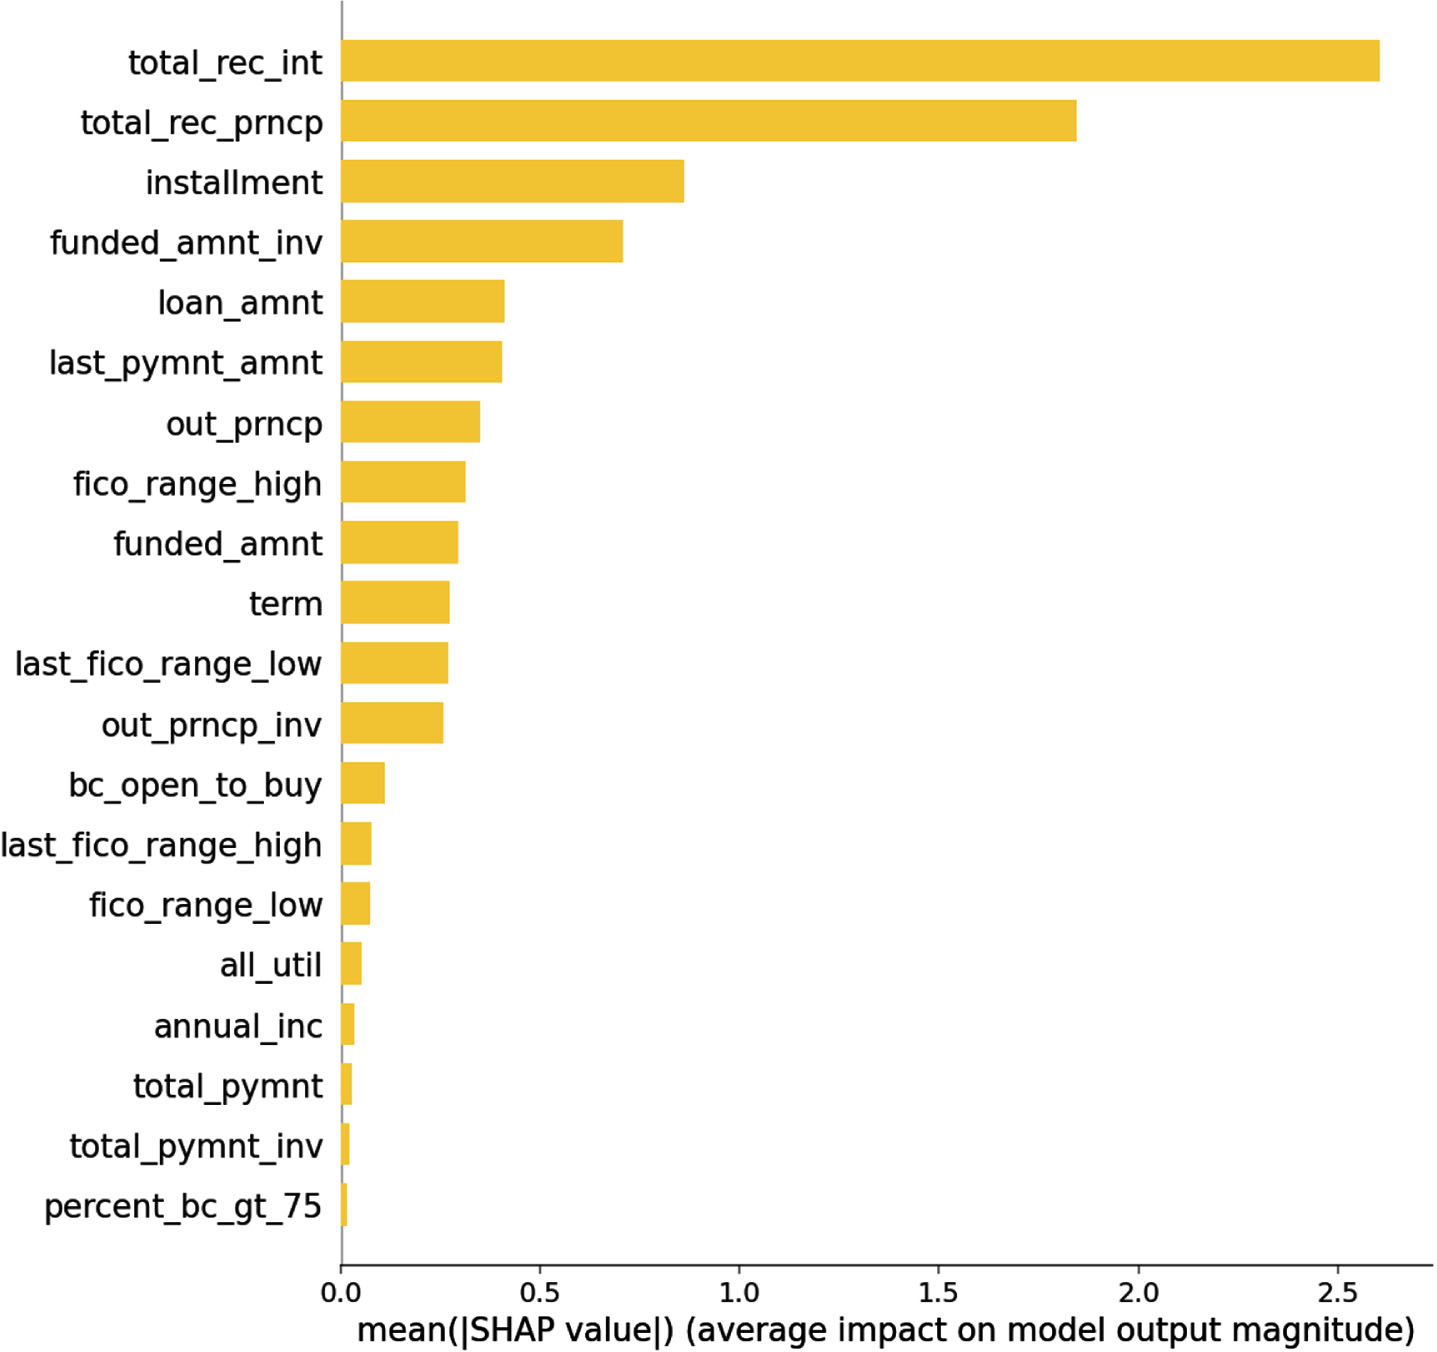
The importance of every feature to the output.
Figure 9 summarizes the Shap values of every feature. One dot shown in each variable’s row represents a sample or a borrower in the dataset. The X-axis represents every feature’s positive or negative impact on the model prediction results. A positive SHAP value increases the probability of the sample to be considered a bad one, and a negative SHAP value enable a sample more likely to be a good one [30]. The Y-axis represents the Shap value of every feature (yellow is high, pink is low), ordered by the average absolute SHAP value. The right side of X-axis indicates that the contribution to the forecast result is positive, otherwise, negative. The colormap bar in the right side of Fig. 9 moves from pink to yellow as the feature value increases. High feature values on the positive side of the X axis have a positive correlation with the corresponding feature. Hence, the greater the positive value, the more likely the borrower is to be considered as a bad one, and vice versa. For instance, for the first feature total_rec_int, the color from yellow to pink as the feature value decrease, at the same time, the Shap value increases from -8 to 6, the negative correlation exists between feature value and Shap value, that is the higher the value of its feature, the smaller the Shap values and therefore, higher the probability of a good individual. On the other hand, the fifth feature loan_amnt, the higher the feature value, the higher the Shap value, the positive correlation makes a sample with high feature value more likely to be considered as a bad borrower.
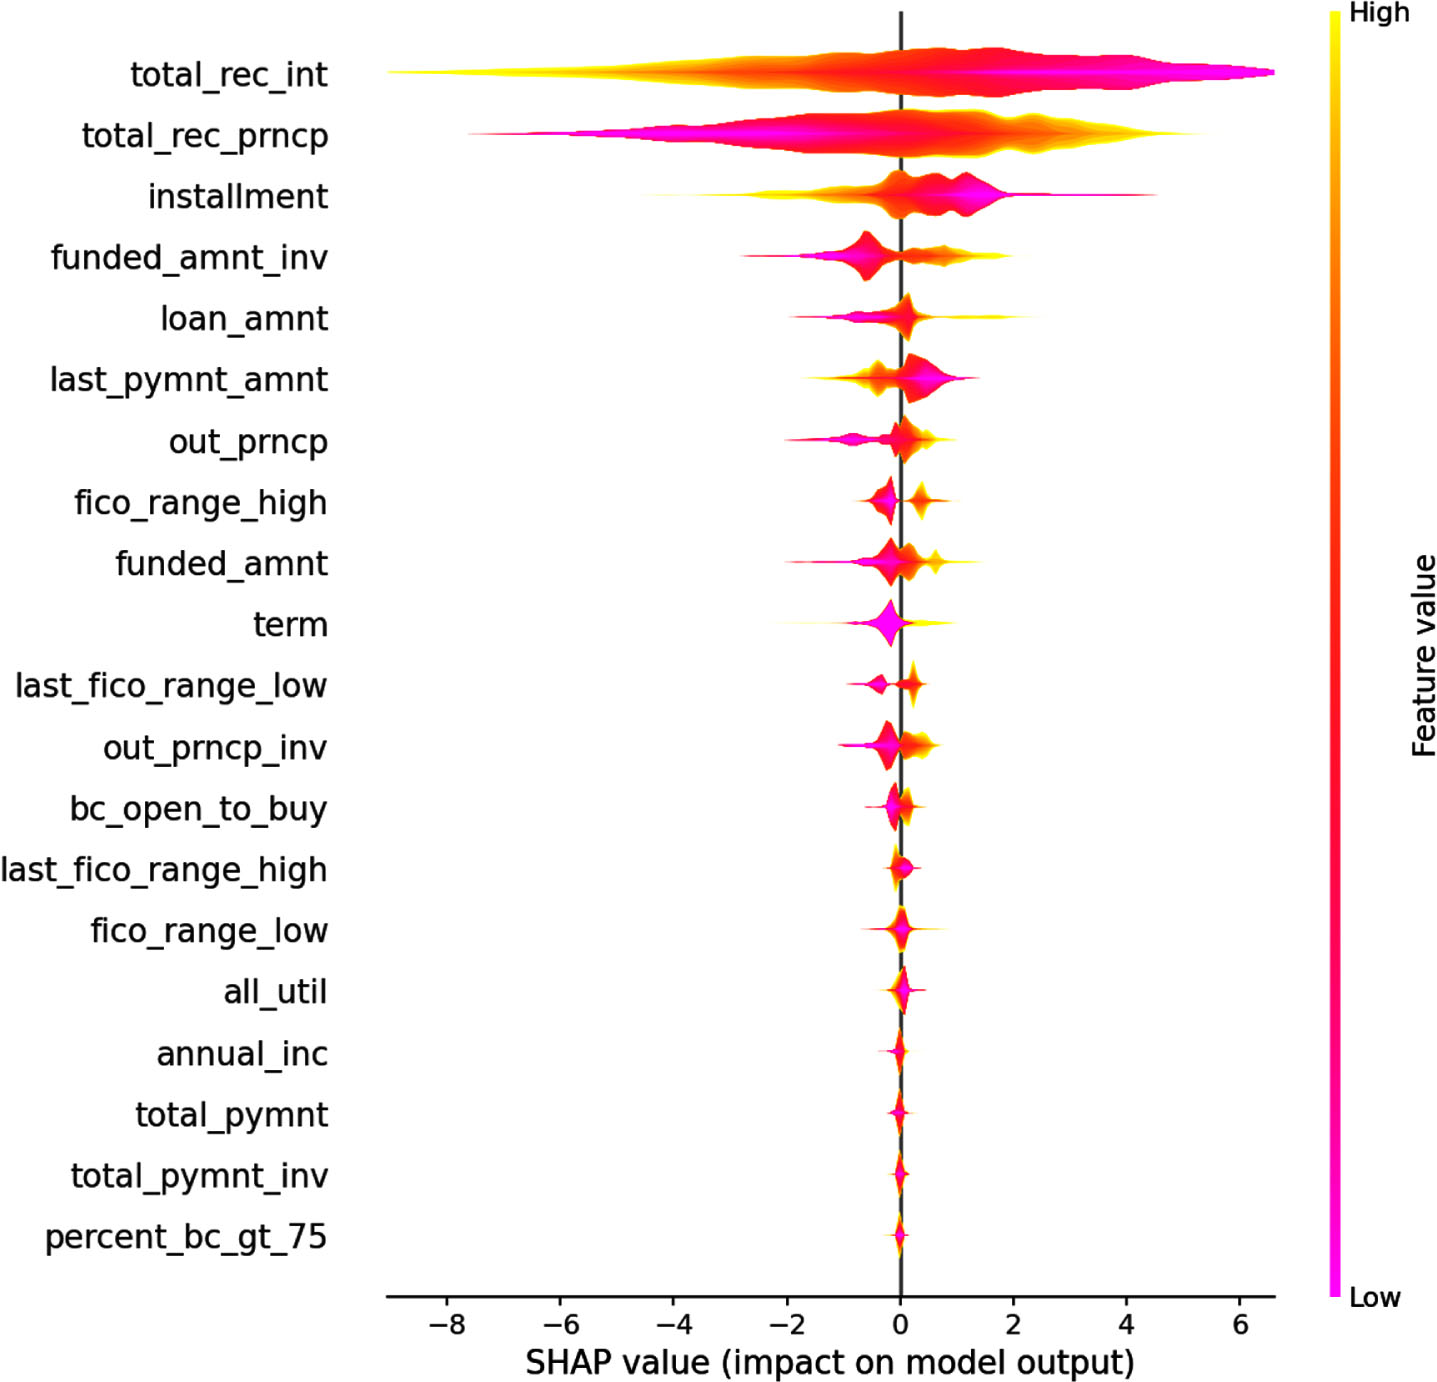
SHAP values for every feature.
The scatter plot of the total_rec_int is shown in Fig. 10. Each dot in the graph represents a borrower. The feature value of total_rec_int and funded_amnt_inv are negatively correlate with the Shap value, which makes a borrower more likely to be predicted into a bad one when the Shap value is positive (feature value is close to 0), as shown by the pink dots at the beginning of the X-axis in Fig. 10. Conversely, as the feature value of total_rec_int and funded_amnt_inv increase, the dots from pink turns yellow, Shap value gradually decreases to negative, as shown by the yellow dots and pink dots with negative Shap value in Fig. 10. The extremely negative Shap value prompts the model to consider this part of the borrowers as good without hesitation.
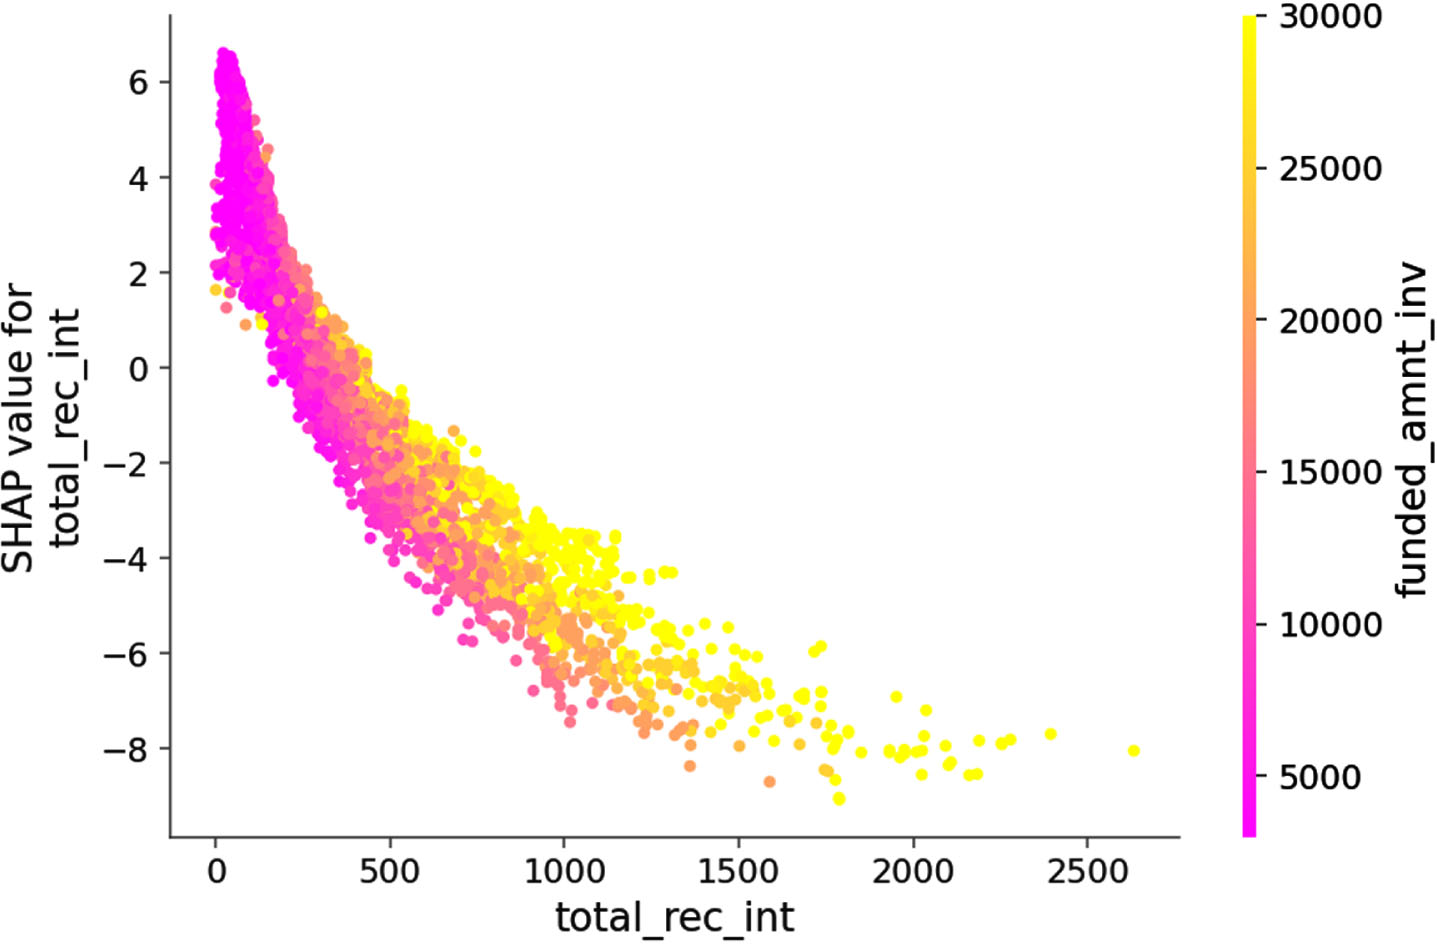
Dependence plot of feature total_rec_int.
Similar to Figs. 10, 11 shows the relation between the feature value of loan_amnt and their Shap values. As expected, there is a positive correlation between the feature values and the Shap values. This is more likely to predict a borrower into a bad one when the loan_amnt and funded_amnt_inv are of high values, as presented by the yellow dots in Fig. 11. On the contrary, when the dots turn pink (at the beginning of the X-axis), the feature value close to 0, the negative Shap value make the model doesn’t hesitate to predict these borrowers into good.
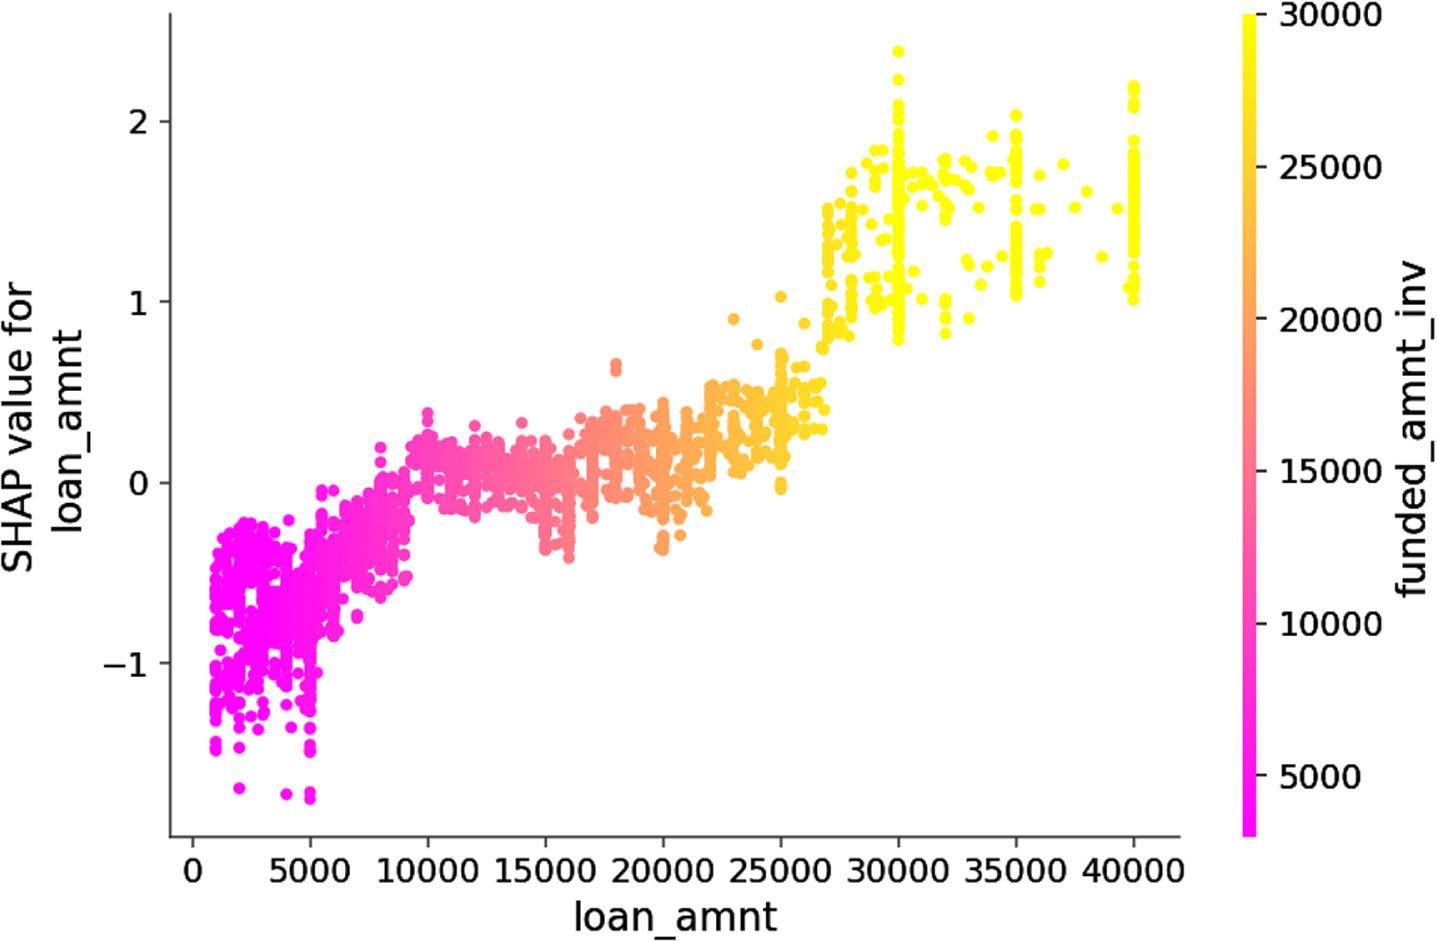
Dependence plot of feature loan_amnt.
In this paper, the main contributions are listed as follows: A novel machine learning model called SSA-CatBoost is proposed, which hybrided the SSA and CatBoost to improve the classification accuracy. The developed SSA-CatBoost model optimizes the regularization parameters via SSA, and adopted the optimized parameters to enhance the accuracy of CatBoost. In addition, to further improve the accuracy when dealing with large-scale data, Recursive Feature Elimination algorithm is used to eliminate useless features and reduce the impact of noisy data on results, and 20 features with higher scores are selected and entered into our research. After selecting the features, the dataset from US Lending Club is divided into eight subsets to build the training model, then ROC curve, Accuracy score, Precision score, Recall score, and F1 score are utilized to compare the prediction results of SSA-CatBoost and other machine learning models, such as XGBoost and LightGBM. To understand why the SSA-CatBoost model predicts a sample as a good or bad one, the interpretable Shap package is employed to illustrate the relationship of every features.
The experiment results show that the SSA-CatBoost model obtains much higher classification and prediction accuracy than XGBoost and other machine learning models, this means SSA-CatBoost model is capable for searching for the optimal CatBoost parameters, and make it convincible that the proposed model is a useful classification method. However, this paper still exists two limitations to improve. Firstly, our proposed model spends too much time to running, nearly one day to classify and predict. Secondly, the final prediction accuracy is only 90.3%, it still has very large improvement space. So, our further work will optimize the algorithm of the SSA-CatBoost model to improve its computational efficiency, and try to use other swarm intelligence optimization algorithms to improve the accuracy of model’s classification and predictions.
Footnotes
Acknowledgments
We acknowledge the financial support from the National Natural Science Foundation of China (No. 72261028, 71761029), the Project of Collaborative Innovation Center on Research of China-Mongolia-Russia Economic Corridor (No. DS20210010), and the Project of Regional Digital Economy and Governance Research Center Project (No. szzl2022002). In addition, we also thank the Lending Club to support the data for our academic research.