
Abstract
With the continuous escalation of telecommunication fraud modes, telecommunication fraud is becoming more and more concealed and disguised. Existing Graph Neural Networks (GNNs)-based fraud detection methods directly aggregate the neighbor features of target nodes as their own updated features, which preserves the commonality of neighbor features but ignores the differences with target nodes. This makes it difficult to effectively distinguish fraudulent users from normal users. To address this issue, a new model named Feature Difference-aware Graph Neural Network (FDAGNN) is proposed for detecting telecommunication fraud. FDAGNN first calculates the feature differences between target nodes and their neighbors, then adopts GAT method to aggregate these feature differences, and finally uses GRU approach to fuse the original features of target nodes and the aggregated feature differences as the updated features of target nodes. Extensive experiments on two real-world telecom datasets demonstrate that FDAGNN outperforms seven baseline methods in the majority of metrics, with a maximum improvement of about 5%.
Introduction
With the rapid development of the telecommunication industry, telecom fraud is becoming more and more prevalent, causing significant economic losses worldwide [1]. Meanwhile, it is increasingly difficult to distinguish fraudsters from normal users simply by user features, as fraud modes gradually shift from a wide spread to a precise fraud. Therefore, traditional machine learning methods based on feature engineering reach a performance bottleneck when dealing with such problems. As a result, researchers have started to investigate graph-based approaches [2–4], which can increase the modeling for user interaction while preserving the user features.
Due to the excellence of GNNs represented by GCN [5], GraphSAGE [6], and GAT [7] in modeling irregular data, many researchers have introduced GNNs techniques to the field of communication networks [8–10] and fraud detection in recent years. [11–15] employ GNNs to detect financial fraud on Alipay, Tmall, and Taobao platforms, which are owned by China’s largest e-commerce company, the Alibaba Group. In [16–22], GNNs are utilized to detect fraud on social media platforms and combate underground black production. Moreover, [23–25] use GNNs for detecting telecom fraud. These work focus on constructing interaction graphs according to the actual business characteristics, and they still essentially update the features of target nodes by aggregating the neighbor features of them. That is, these studies are still focus on the commonality of neighbor features.
GraphConsis [26] and CARE-GNN [27] calculate the similarity between target nodes and their neighbors based on node features, and aggregate only the features of the neighbors that are highly similar to the target nodes. These efforts are an enhancement to commonality of neighbor features. [28–30] start to pay attention to the differences between target nodes and their neighbors. However, there is still room for improvement. In summary, The majority of existing efforts ignore the differences of features between target nodes and their neighbors. Taking Fig. 1 for example, if all the neighbor features of User 6 are aggregated as its updated features, then User 6, as a fraudster, will be difficult to distinguish from normal users. Even if only the most similar neighbors are aggregated, User 6 is very likely to escape.
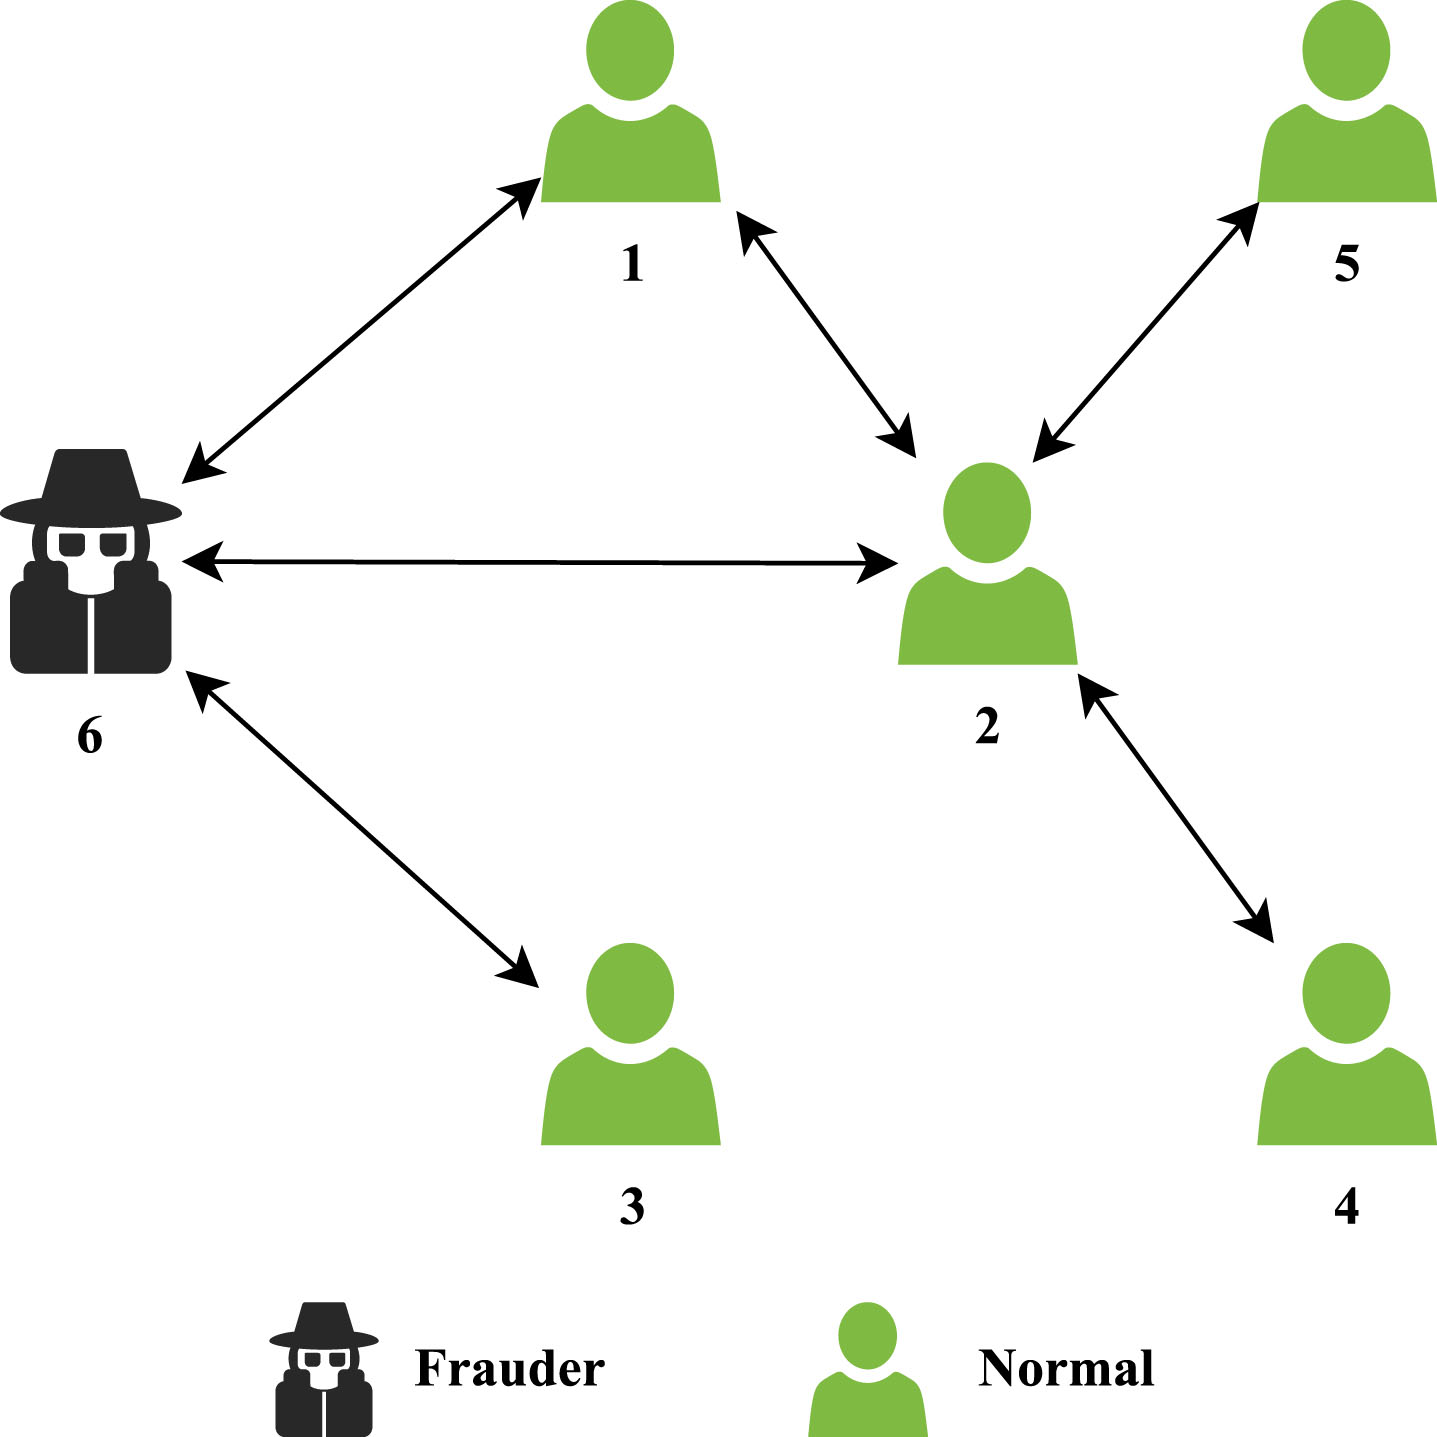
Local View of the Telecom Call Network. Note: The black lines with double arrows represent the communication relations between users.
In order to address the shortcomings mentioned above, Feature Difference-aware Graph Neural Network 1 (FDAGNN for short) is proposed. FDAGNN adopts GAT method to aggregate feature differences between the target nodes and their neighbors, then employ Gate Recurrent Unit (GRU) [31] approach to fuse the original features of target nodes and aggregated differences. Furthermore, FDAGNN improves the focal loss function [32] instead of the standard cross-entropy loss function, in order to further enhance model performance.
The specific contributions of this paper are summarized as follows: A new GNN-based fraud detection model called FDAGNN is proposed. FDAGNN aggregates the differences between target nodes and their neighbors based on an attention mechanism, instead of aggregating the raw features of neighbor nodes like existing GNNs. The proposed model can be generalized to multiple fraud detection domains, such as telecommunications, finance. GRU approach is adopted to fuse the raw features of target nodes and aggregated differences. Compared with the other common methods of feature fusion, the GRU method shows excellent efficiency and effectiveness. The focal loss function is improved to deal with the problem of class imbalance. Experiments show that the improved loss function can effectively enhance the model performance. Experiments indirectly demonstrate that it is very necessary to consider the actual interaction between users when constructing graphs to detect fraud, especially telecommunication fraud with sparse data.
The work of this paper focuses on telecommunication fraud detection based on graph neural networks, and telecommunication fraud detection is a specific implementation of fraud detection technology in the field of telecommunication. Therefore, a brief overview of related work is given in three areas: (1) graph neural networks, (2) graph-based fraud detection, and (3) graph-based telecom fraud detection.
Graph neural networks
GNNs have received extensive attention in recent years as an efficient method of dealing with irregular data. A number of GNNs employ a mechanism based on message passing and aggregation [33]. When updating the feature of a node in the graph, the features of its neighbors are transferred to the node firstly, according to the topological association of the node in the graph. Then, all neighbor features received by the node are aggregated as its own updated features by a specific method. Different graph neural networks adopt different aggregation methods. In GCN [5], the target node is regarded as one of its neighbors, and the neighborhood features are then averaged. GraphSAGE [6] proposes four aggregation modes. The first is similar to GCN. Second, the target node concatenates the average of its neighbors with itself. Third, it adopts an elementwise max-pooling operation on the features of neighbors transformed by a fully-connected neural network, and the last is Long Short-Term Memory (LSTM) [34] mode. GAT [7] assigns different weights to neighbor nodes. As of today, GNNs are being used in a wide range of fields, such as recommendation systems [35–37], chemistry [38, 39], and fraud detection.
Graph-based fraud detection
Graph-based fraud detection has witnessed a growing interest. GeniePath [40] takes LSTM [34] to adaptively select neighbor nodes in different hops for target nodes. At the same time, an attention mechanism is employed to assign different weights to the neighbors in the same hop. ASA [16] constructs multiple homogeneous graphs based on different types of nodes, then uses GCN to update node features in each homogeneous graph. In Player2Vec [22], multiple homogeneous graphs are constructed based on different meta-paths. Then, Player2Vec updates node features for each homogeneous graph using GCN and fuses the features of same nodes among different homogeneous graphs via an attention mechanism.
CARE-GNN [27] builds a multi-relationship heterogeneous graph. Firstly, it measures the similarity between the target node and each of its neighbors under different relationships with l1-distance, then it samples those neighbors that are more similar to the target node by using reinforcement learning technology, and finally it applies aggregation operations within each relation and among relations. It is important to note that CARE-GNN satisfies the homogeneity assumption of GNNs, that is, nodes are more inclined to establish edges with nodes of the same type. FRAUDRE [28] constructs multiple homogeneous graphs based on different relationships, then utilizes a fraud-aware graph convolution module to combine two distinct parts of the message: one is based on the average aggregation of neighbor features, while the other is based on the average aggregation of feature differences between the target node and its neighbors. Lastly, it aggregates embedding features among relations with an attention mechanism.
Graph-based telecom fraud detection
[23] detects international telecommunication fraud. It models the call network as a directed attribute bipartite graph and provides a dynamic anomaly scoring approach based on both time information and network attributes. AGRM [24] extracts a k-order subgraph of target nodes based on the sampling idea of GraphSAGE, employs an attention mechanism to aggregate messages of neighbors, except for targets themselves, and finally adds the aggregated neighbor features to the target nodes. MRG-GNN [25] models the call network as an attribute graph with edge features. The technology of Short walks are introduced to sample high-order neighbors. MRG-GNN accumulates the neighbor features as well as the features of edges in a single convolution layer. Furthermore, it integrates the output of different convolution layers in a GRU-like manner.
Problem definition
The proposed method
In this section, the proposed model named FDAGNN is introduced. First, Section 4.1 summaries the overview framework of FDAGNN. Then the core modules are detailed, i.e., the difference-aware graph convolution module in Section 4.3, and the classification module in Section 4.4, respectively.
Overview
The proposed FDAGNN framework consists of three different modules, and its pipeline is shown in Fig. 2. The first module is the input component, whose main function is to construct and preprocess graphs. The difference-aware graph convolution module and the classification module are the core of FDAGNN. The difference-aware convolution module mainly completes hierarchical feature aggregations, which include the aggregation of feature differences between target nodes and their neighbors, and the fusion of target nodes themselves and the aggregated differences. The focal loss function is introduced, which originated in the field of computer vision, and further improve it in the classification module.

The Overall Framework of FDAGNN. Note: Red circles represent fraudulent users and other coloured circles represent benign users in the Telecom Graph. Taking the feature update of node v as an example,
The procedures of constructing or preprocessing graphs on the two datasets (see Table 1) are different. For the first dataset, it has been processed into a directed graph by [24]. Here, it is pre-processed into an undirected graph. For the second dataset, since the open data is the raw data of the actual running system, the method, provided in [42], is utilized to construct the raw data as an undirected graph.
Statistics Information of datasets
Statistics Information of datasets
Note: The edges represent real interactions between users in BUPT. In SC, the edges are constructed manually based on feature similarity between users.
AM-GCN [41] demonstrates that GCN cannot adequately merge network topological structures and node features to extract the most correlated information. Specially, GCN even damages the original feature information for those networks with rich features, to some extent. So, the original features are preserved in the module:
where

The Procedure of Feature Fusion in the l
th
layer. Note:
Taking the learning of
After the Difference-aware Graph Convolution Module, the final representations of the target nodes are obtained, denoted as
All types of misclassification errors are evaluated equally by the object function. However, in real-world scenarios, this is not feasible. The real cost of misclassifying a fraudster as a normal may be greater than that of misclassifying a normal as a fraudster when it comes to detecting telecommunication fraud. Moreover, if the aforementioned objective function is applied directly to a dataset that is class-imbalanced, it is easy to overfit the majority class while underfitting the minority class. Consequently, the objective function is further improved to focal loss function by drawing on the experience in handling the imbalanced classes problem in dense object detection.
The training procedure is presented in Algorithm 1.
1: // Initialization and data preparation;
2:
3:
4:
5:
6:
7:
8:
9: z
i
← Eq.(6)
10:
11: //Back-propagation and update weights
12: //Validate and decide whether to stop early
13: Return model parameters θ
In this section, a series of experiments were conducted on two real-world telecom network fraud detection datasets to primarily investigate the following themes: How does FDAGNN perform comparing with existing baseline methods? How do different components affect the performance of FDAGNN? Is FDAGNN sensitive to the hyperparameters? How efficiently does FDAGNN run?
Experimental setup
Hyperparameter settings for FDAGNN
Hyperparameter settings for FDAGNN
Note: lr is the learning rate of Adam optimizer, and weight-decay is the decay rate of lr. feat-drop is the dropout rate of node features. attn-drop is the dropout rate of attention in the phase of aggregating feature differences.
GCN, GAT, GeniePath, and CARE-GNN were implemented through an open-source framework, DGL v0.8.0post2 4 . GEM was performed using an open-source toolbox for fraud detection 5 , FRAUDRE and H2-FDetector using the source code released by its corresponding authors. All experiments were conducted by Python 3.7.10, 1 GeForce RTX 3090 GPU, 48 GB RAM, 12 cores Intel(R) Xeon(R) Gold 5218 CPU @2.30GHz and Linux Server.
Table 3 reports the experiment results of FDAGNN and the baselines. The percentage of training entities varied from 5% to 40%. The percentage of validating entities remained at 20%, while the remaining entities were used as test cases. In all experiments, the early-stopping mechanism was utilized, which was controlled by the accuracy under the validating set.
Performance Comparison of FDAGNN and Baselines (under different training ratios)
Performance Comparison of FDAGNN and Baselines (under different training ratios)
1. Note: Precision, Recall and F1 are related to fraud. Accuracy is about all samples.
2. Note: The edges in BUPT represent real interactions between users. In SC, the edges are constructed manually based on feature similarity between users. For specific performance analysis, see Section 5.2.
Before performing an in-depth analysis, we should pay attention to the characteristics of the two telecom graphs constructed from real-world datasets, BUPT and SC. Firstly, the edges of BUPT are true call relationships, while those of SC are artificially manufactured based on feature similarity between nodes. Secondly, BUPT is unbalanced and the proportion of positive samples, i.e., frauder, is about 7.26%. The graph constructed on BUPT is relatively sparse. However, SC is relatively balanced and the proportion of positive samples is about 32.13%. The graph constructed on SC is dense.
On BUPT, FDAGNN performs best in the metric of precision and F1 for frauders and accuracy for all users under all training ratios (except F1 in the ratio of 40%). The maximum improvement is about 5%. Thought CARE-GNN, FRAUDRE, and H2-FDetector get higher scores than FDAGNN in the metric of recall for frauders, the precision for frauders is quite low. Moreover, the accuracy is also bad. That is, CARE-GNN, FRAUDRE, and H2-FDetector incorrectly identified many normals as frauders. This is not obvious in the FDAGNN.
On SC, considering the metric of F1 for frauders and accuracy for all users, FDAGNN has some competitiveness and performs best under some training ratios. Specially, GAT get highest score in the metric of precision for frauders, but the recall is almost the worst. CARE-GNN is best for recall, however, the precision is worse than FDAGNN. FDAGNN obtains a high precision on the basis of a relatively ideal recall. In summary, FDAGNN does not perform as well on SC as it does on BUPT. The most possible reason is that the edges in the graph of SC are artificially manufactured based on feature similarity between nodes. That is, the edges do not represent real call relationships on SC. This implicitly indicates that it is necessary to exploit real interactions between users when adopting GNNs methods.
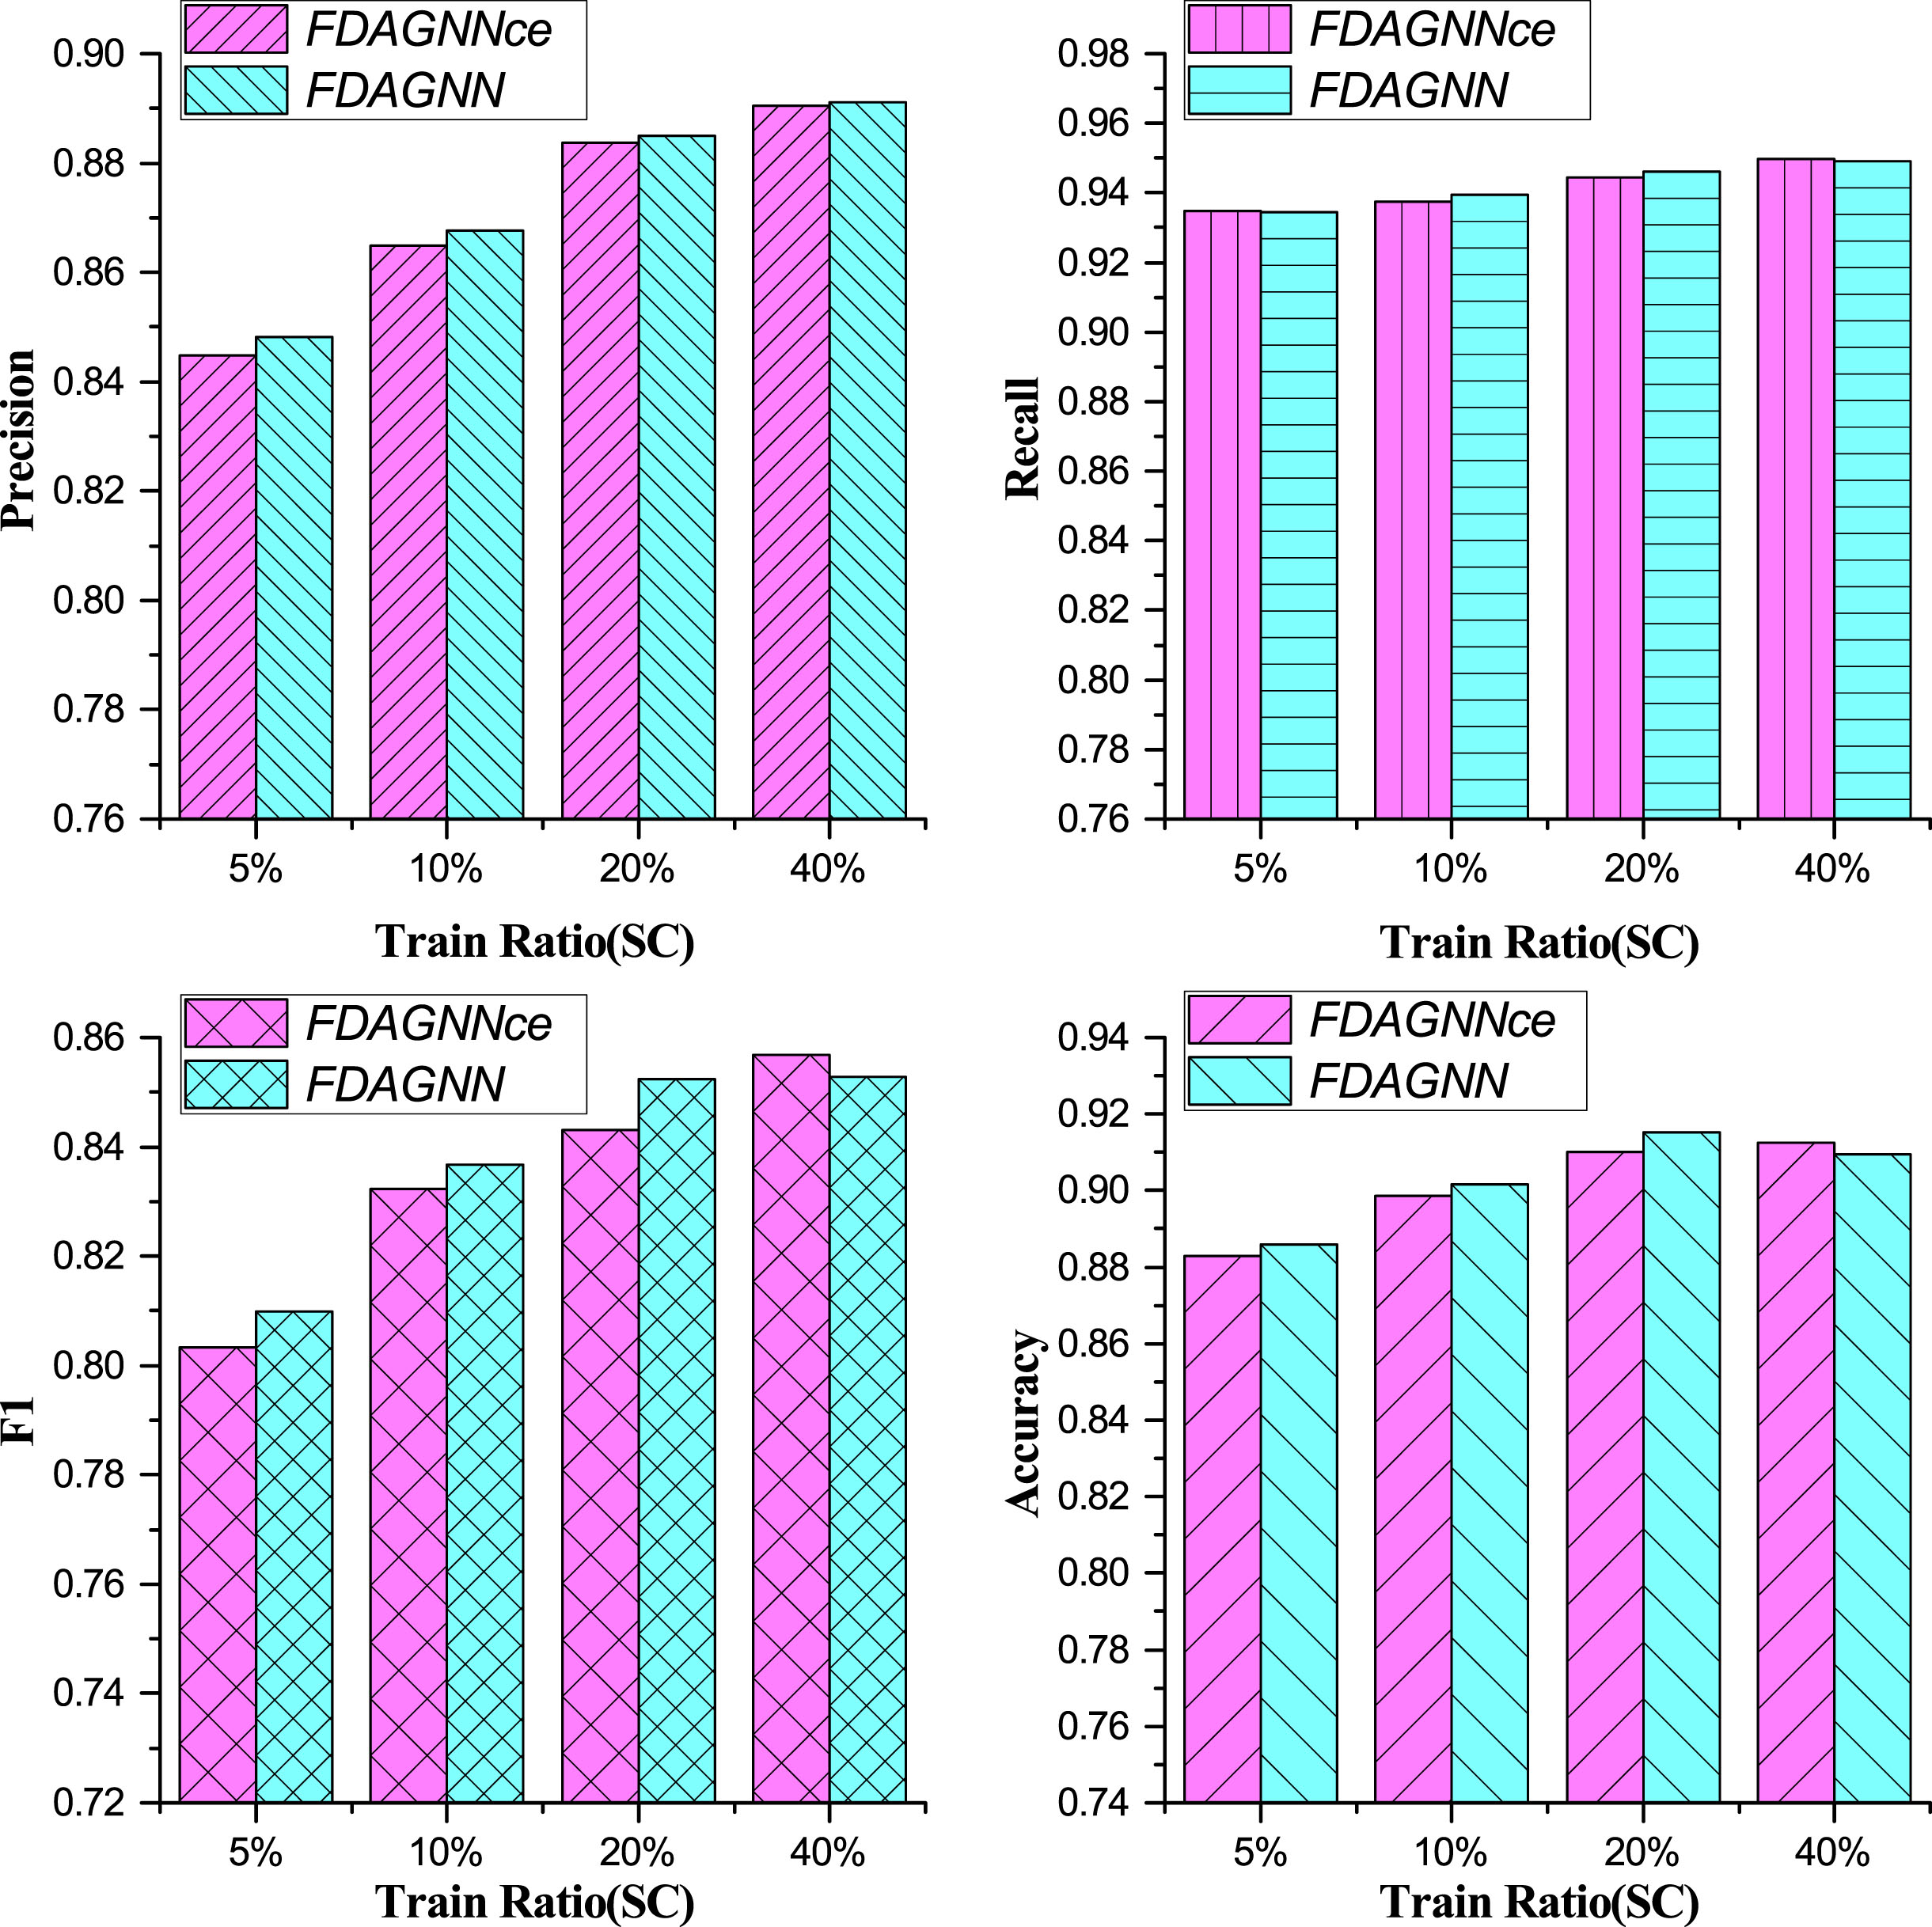
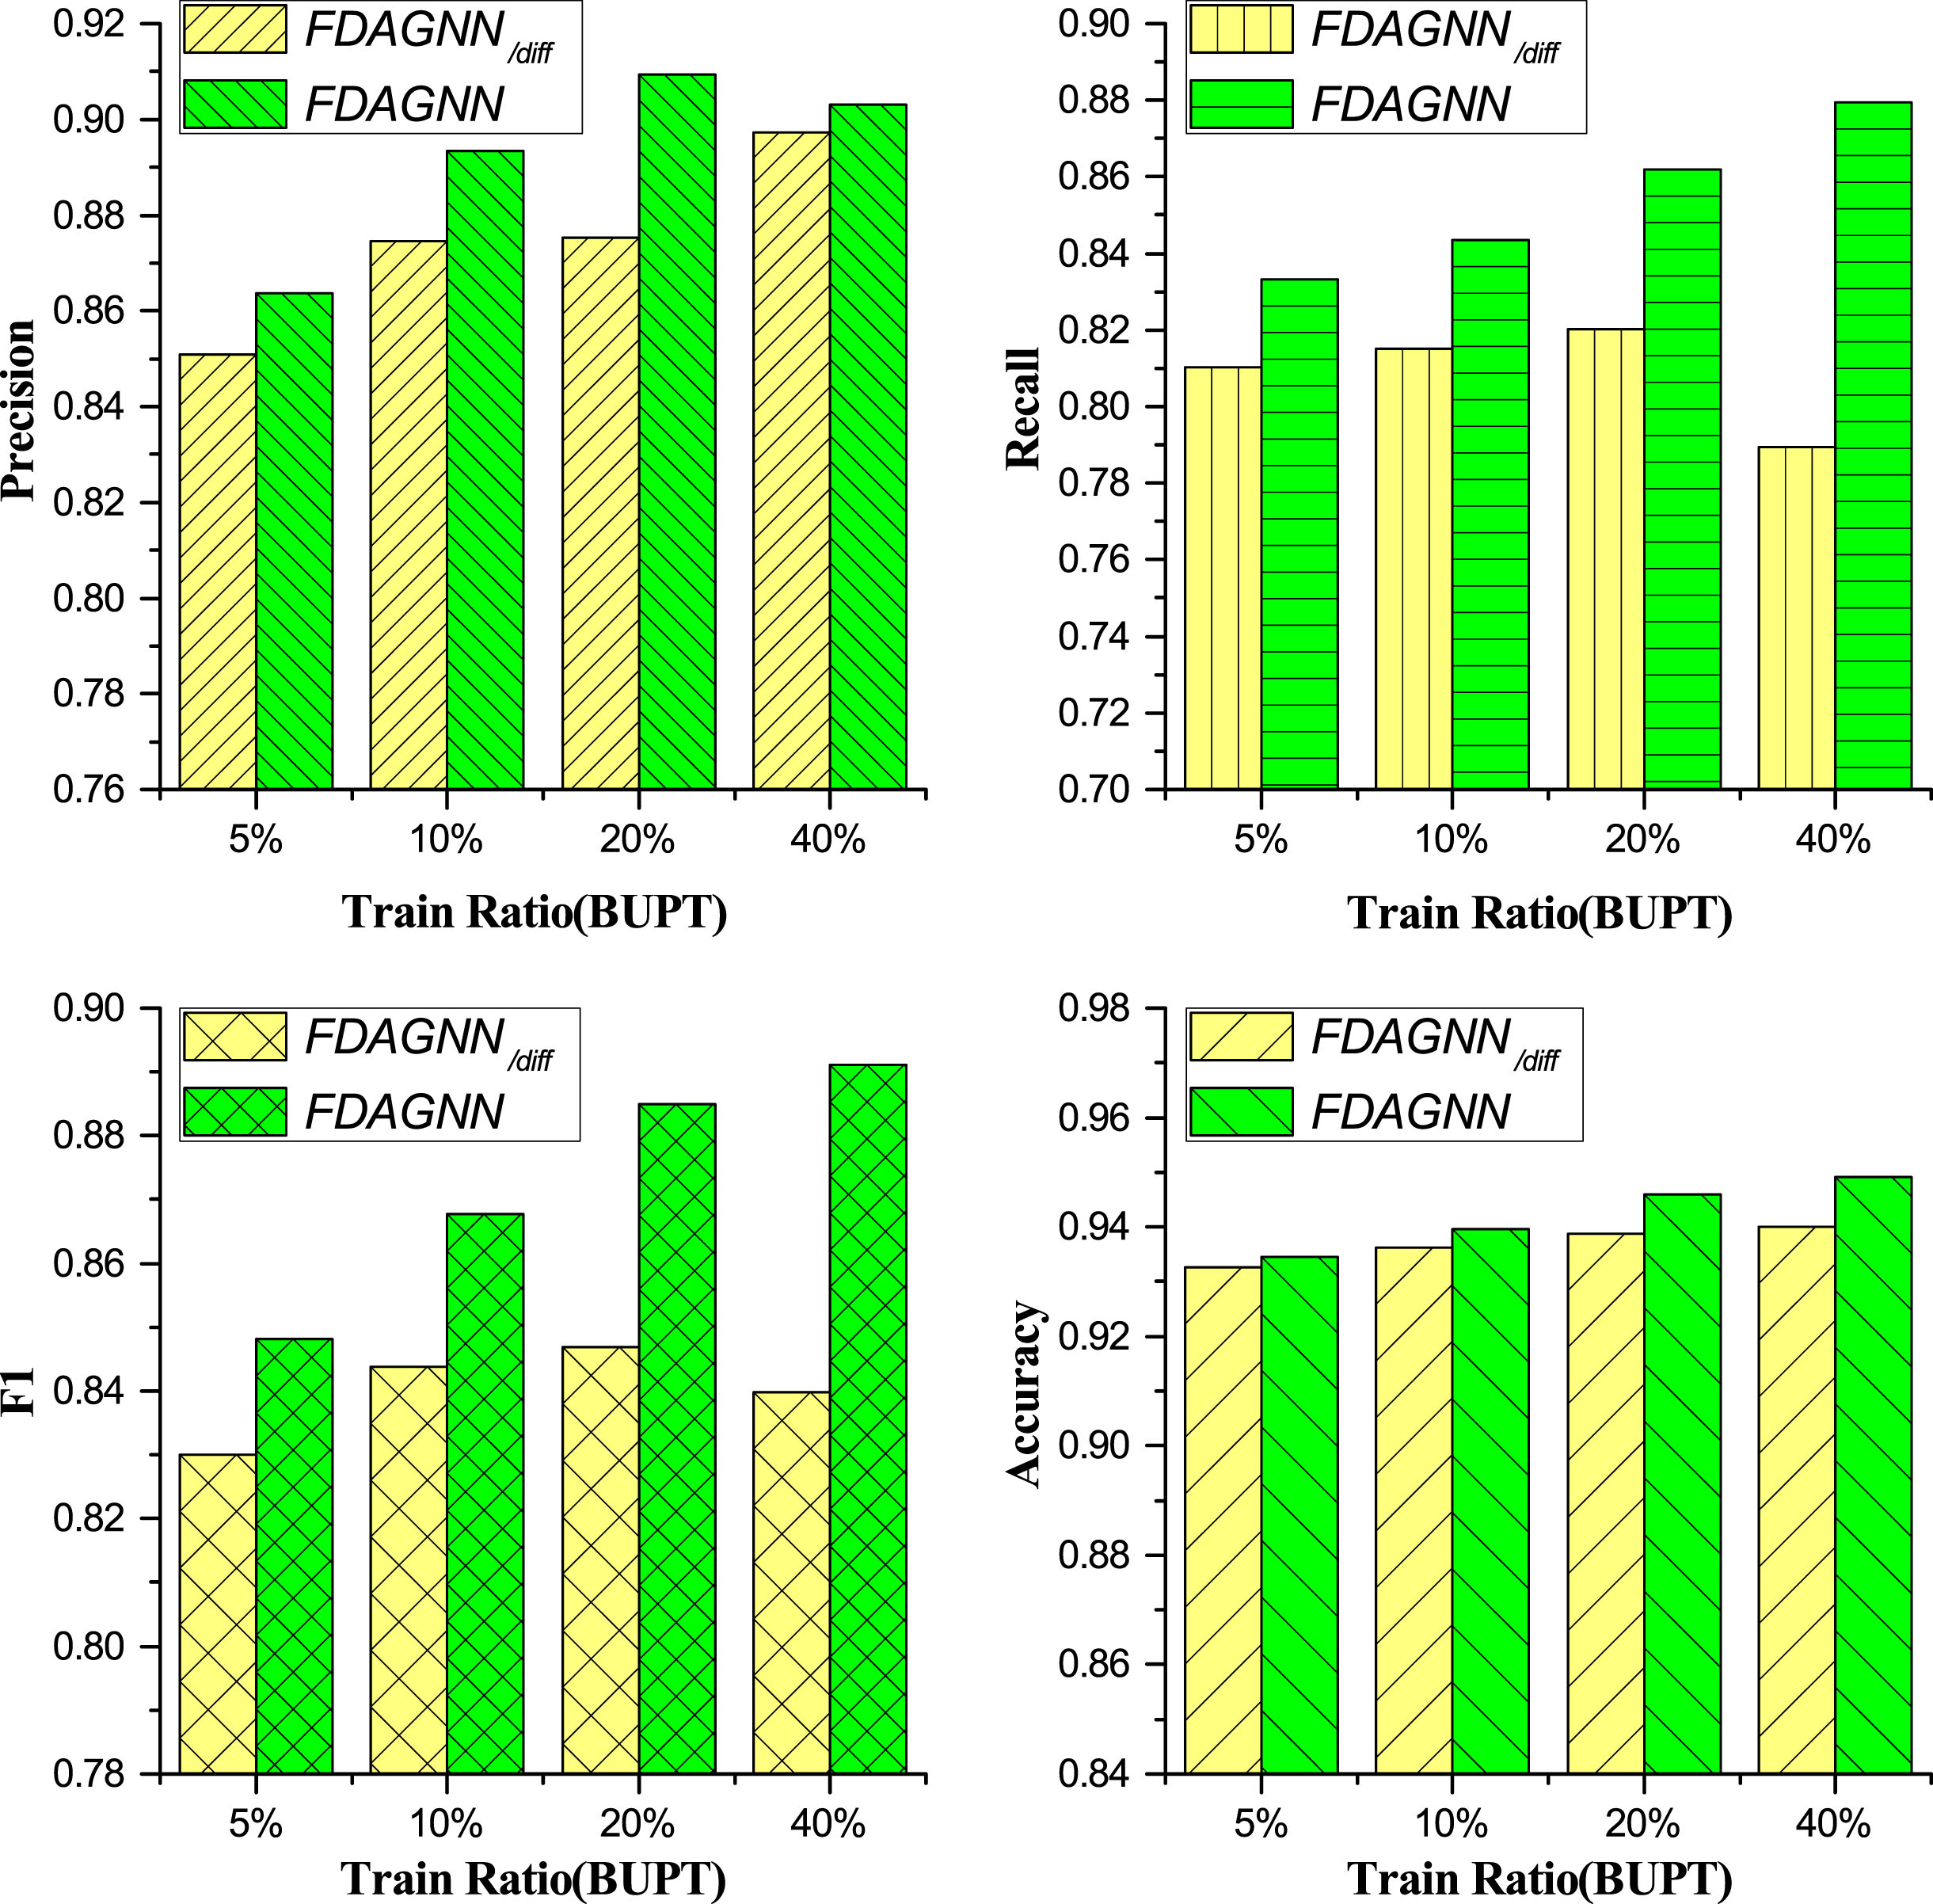
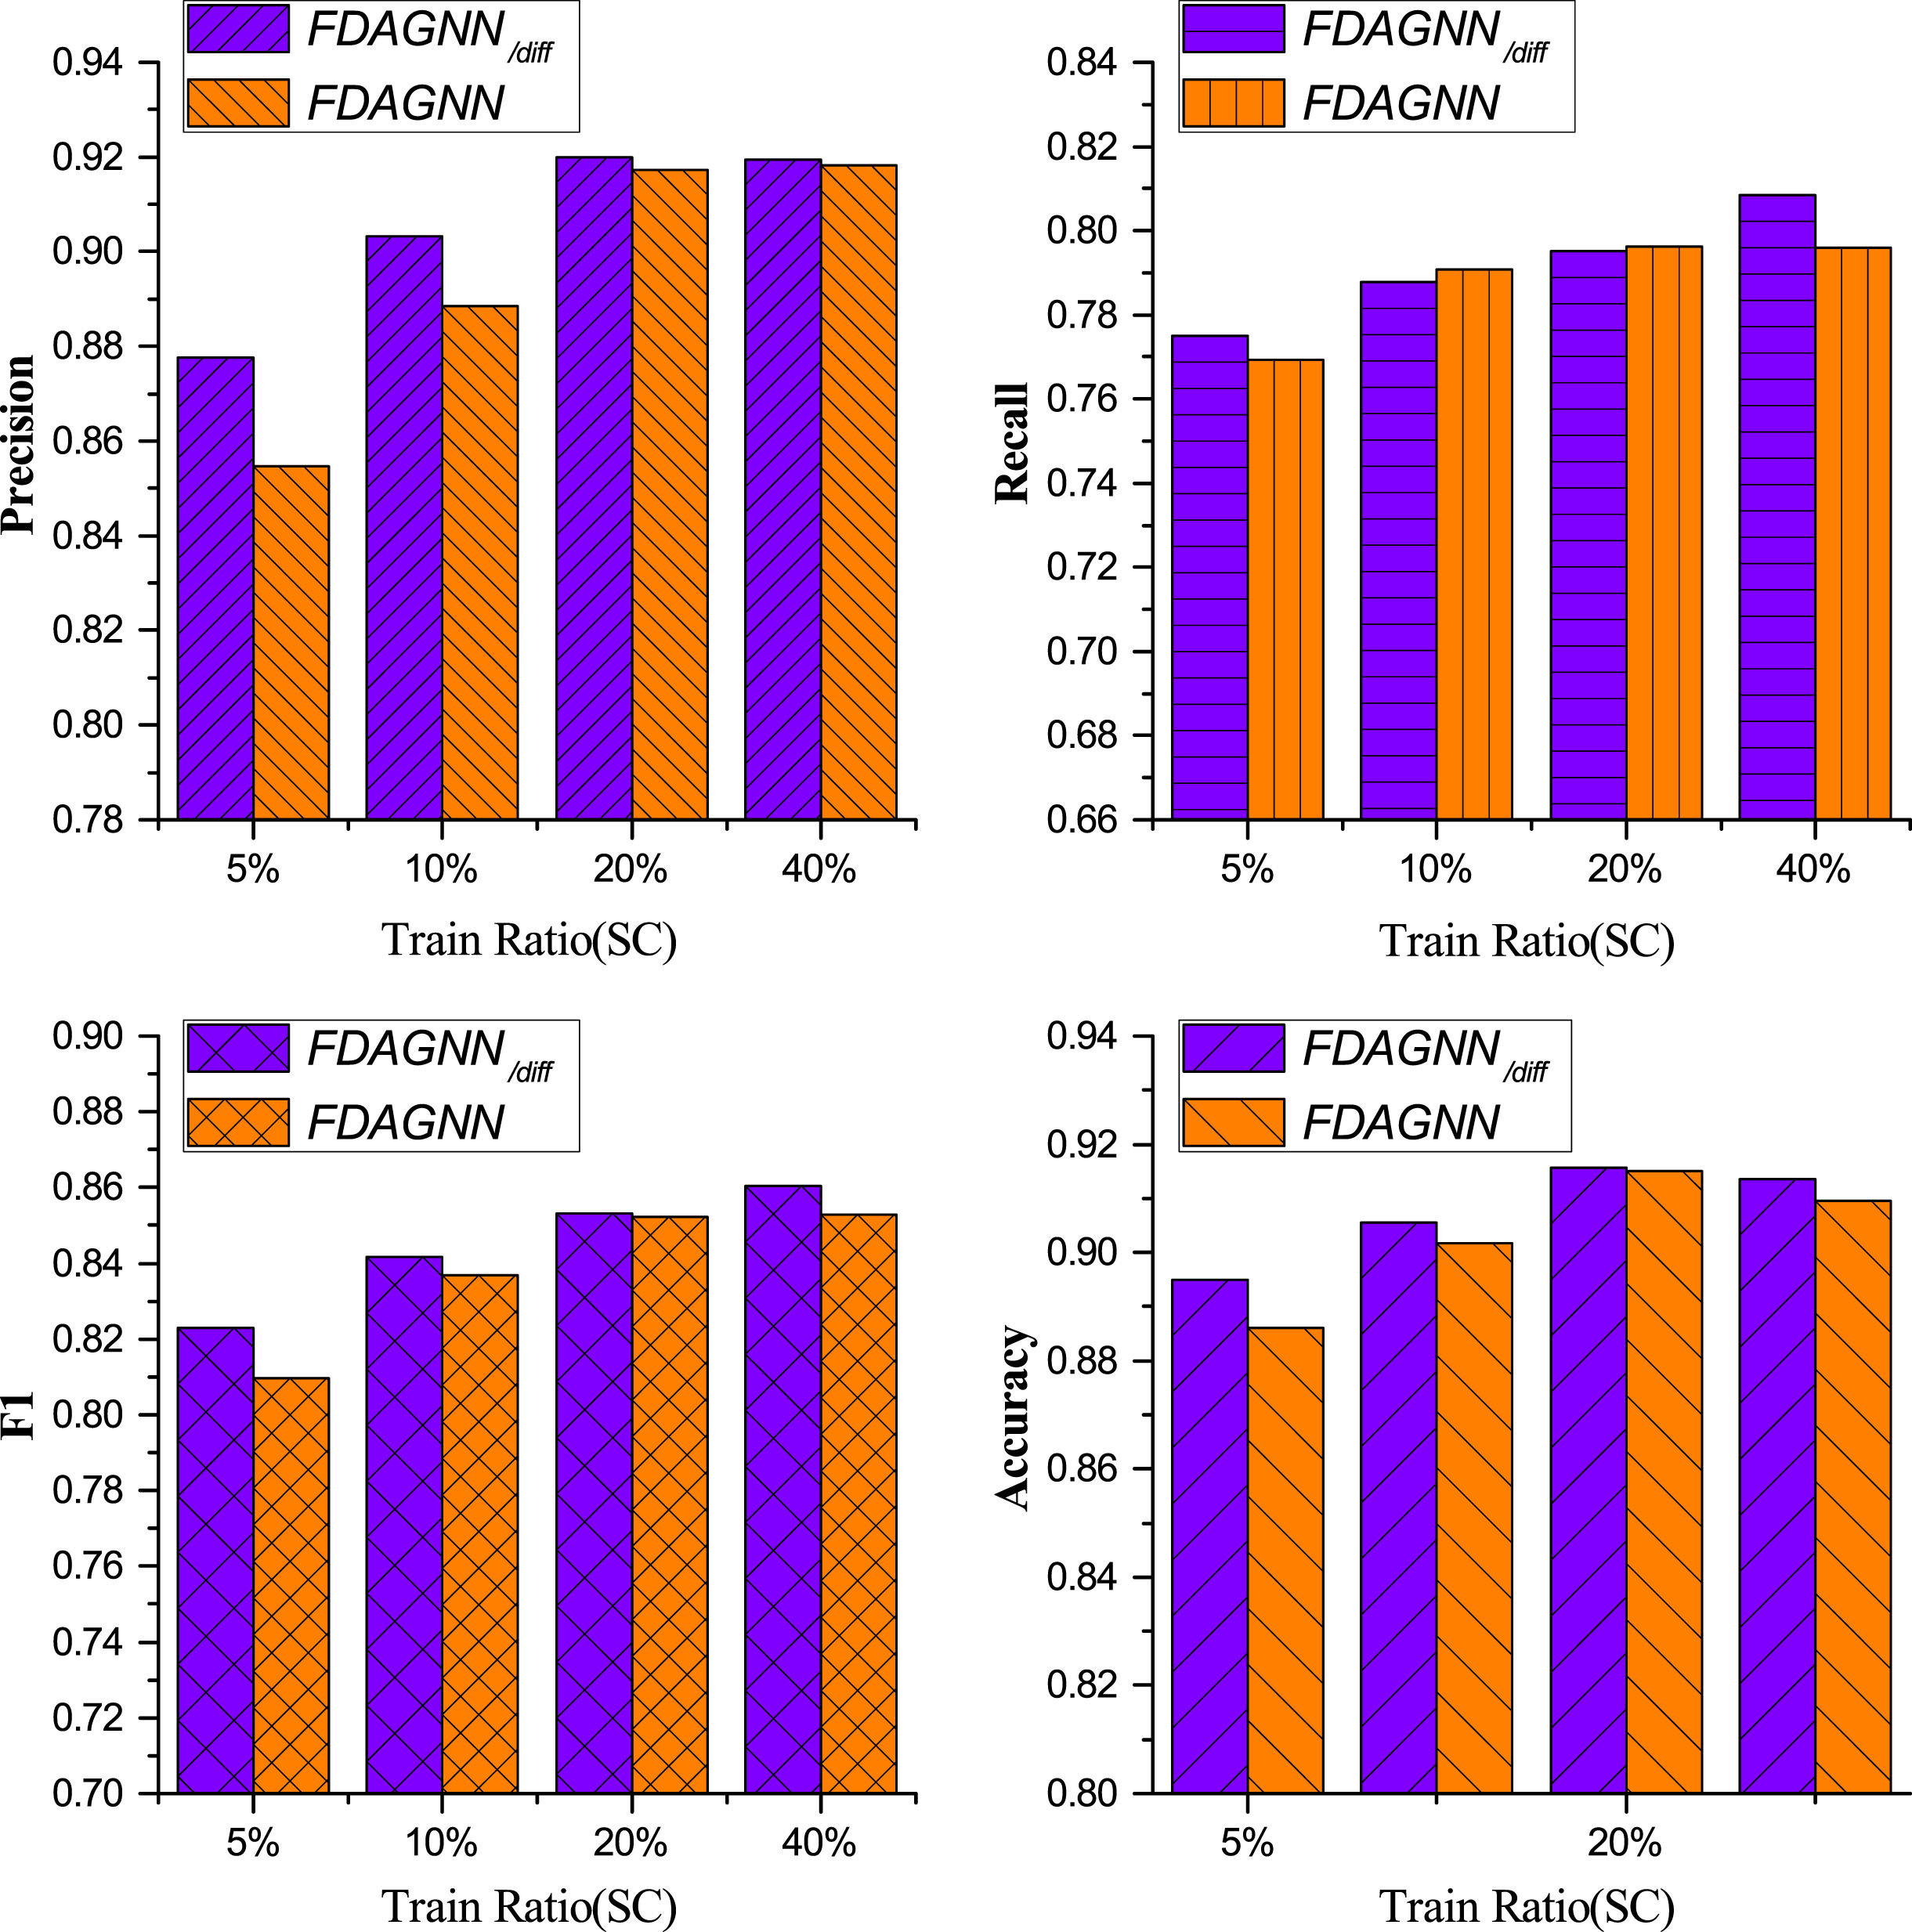
To verify the effectiveness of each module or component in FDAGNN, three sets of ablation experiments were conducted: (i) FDAGNN-Fusion: which designed three other variants for the component of feature fusion. These variants were FDAGNN add , FDAGNN att and FDAGNN cat , which respectively involved addition, attention, and concatenation to replace the GRU component of FDAGNN. (ii) FDAGNN-Loss: which applied the standard cross-entropy loss function instead of the focal loss function in FDAGNN. It was denoted as FDAGNNce. (iii) FDAGNN-no-differences: which did not take advantage of the feature differences, but only used the features. It was presented as FDAGNN/diff, which was essentially equivalent to MLP (multilayer perceptron).
As shown in Fig. 4 and Fig. 5, FDAGNN was superior to the other three variants with respect to almost all evaluation metrics under a variety of training ratios on the BUPT dataset. On SC, FDAGNN performed better than the others in terms of F1 and Accuracy metrics. This demonstrated that the GRU fusion method was more effective than the others. It can be observed that FDAGNN att performed the worst out of all fusion patterns, both on BUPT and SC. Possible causes were as follows. In aggregating the feature differences, the proposed model adopted the attention mechanism. Thus, FDAGNN att increased the complexity of the model, which resulted in overfitting of the model. FDAGNN add was equivalent to summing the original features and feature differences with a fixed weight of 0.5 respectively. It was not adaptable for different nodes. FDAGNN cat did not perform the fusion operation explicitly in the Difference-aware Graph Convolution Module, and its operation of fusion was completed implicitly during the process of transforming from the hidden space of embedding to the target space of classification. When compared with FDAGNN add , FDAGNN cat can adapt to different nodes to some extent. Therefore, it performed better than FDAGNN add but worse than FDAGNN.
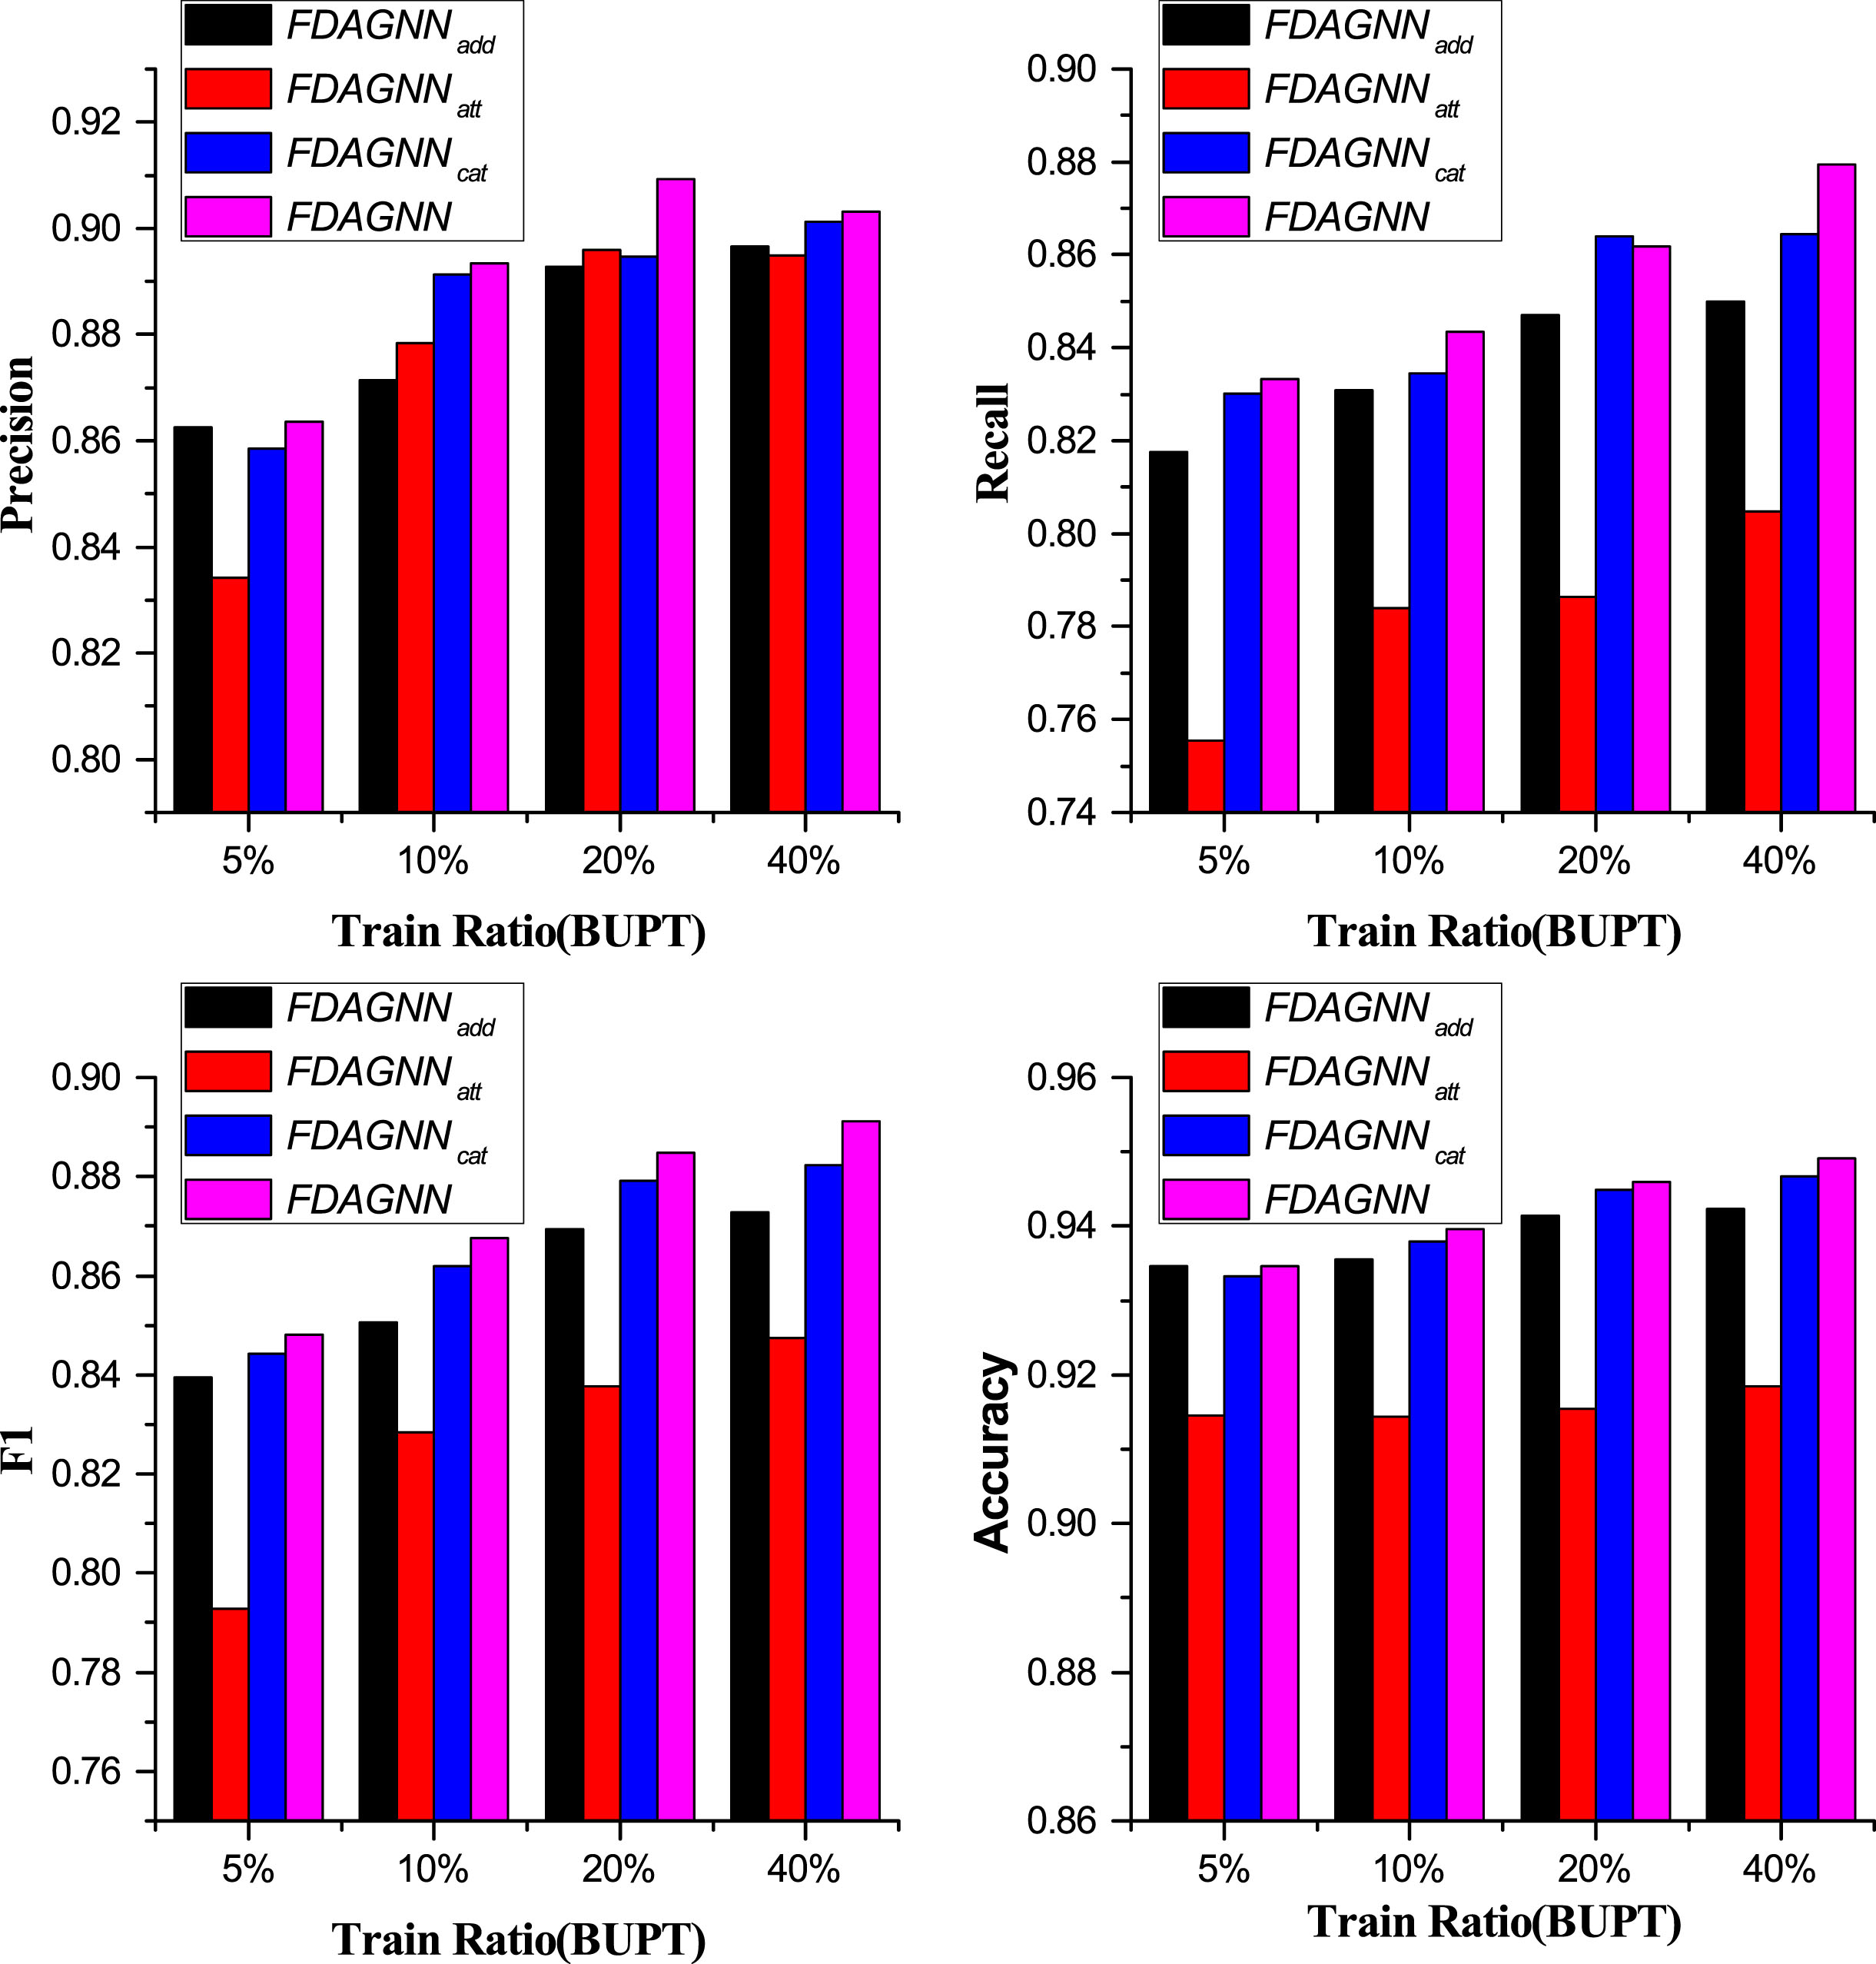
Performance Comparison of FDAGNN Using Different Feature Fusion Methods on the Dataset BUPT.
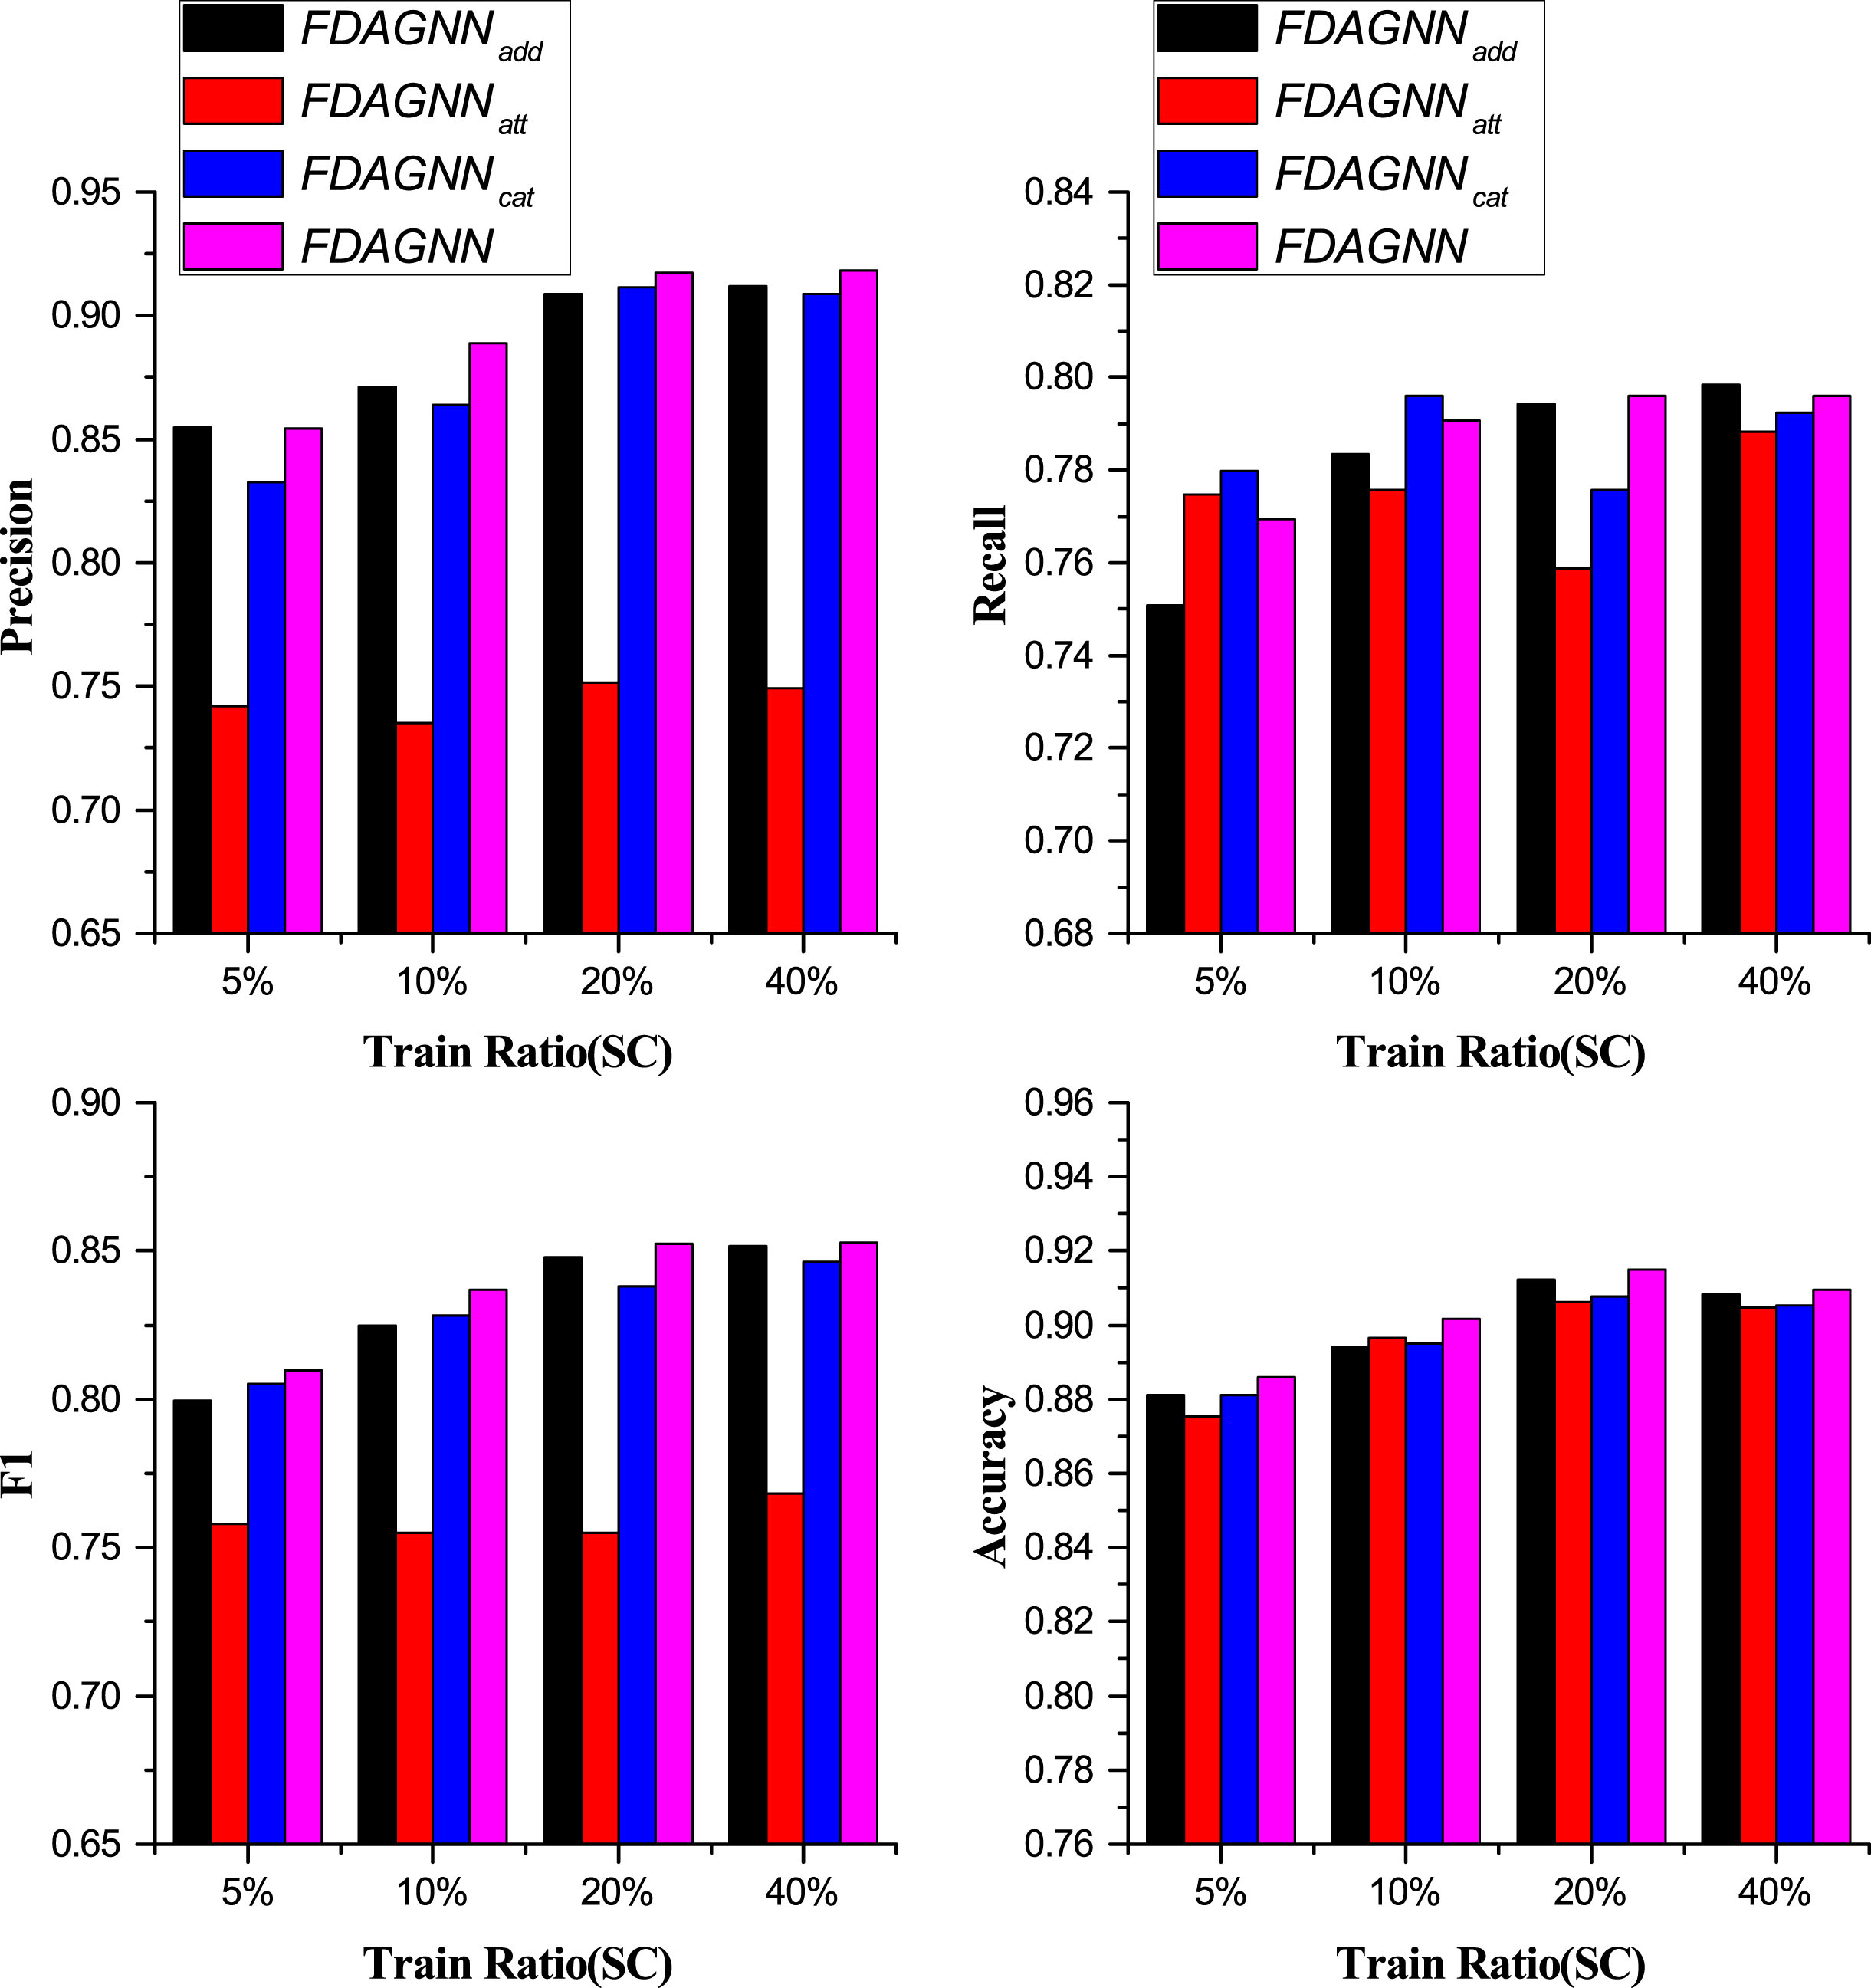
Performance Comparison of FDAGNN Using Different Feature Fusion Methods on the Dataset SC.
In the experiment of FDAGNN-Loss (results are shown in Fig. 6 and Fig. 7), all the metrics of FDAGNN improved under different training ratios on SC, except for 40%. Among them, the largest boost reached one percentage point. However, FDAGNN performed worse than FDAGNNce when the training ratio was 40%. The possible reasons for this may be as follows. The topology graph of SC was constructed artificially using a similarity measure. In other words, we assigned an edge between two nodes when the feature similarity between them exceeded a certain threshold. Because of this processing, the feature similarity between the target node and its neighbor nodes is very high, and it is not easy to distinguish them with the cross-entropy loss function. In the case of samples whose features are very similar and not easily distinguishable, we refer to them as hard entities. While focal loss function is capable of improving the ability for discriminating hard entities. Therefore, when the training ratio was low, FDAGNNce could not assist with hard samples, but FDAGNN could. As the training ratio increased to a certain level, FDAGNNce became capable of handling the hard samples effectively. Nevertheless, if focal loss were introduced at that time, it may damage the model. With the dataset of BUPT, F1 rose only a little, not more than 0.4 percentage points, across all training scales. As for Accuracy, it was nearly the same. The topology of BUPT was based on real communication, FDAGNNce was able to separate different classes of samples based on the feature differences. In other words, the hard entities of BUPT were less, and as a result, focal-loss has a small impact on performance.
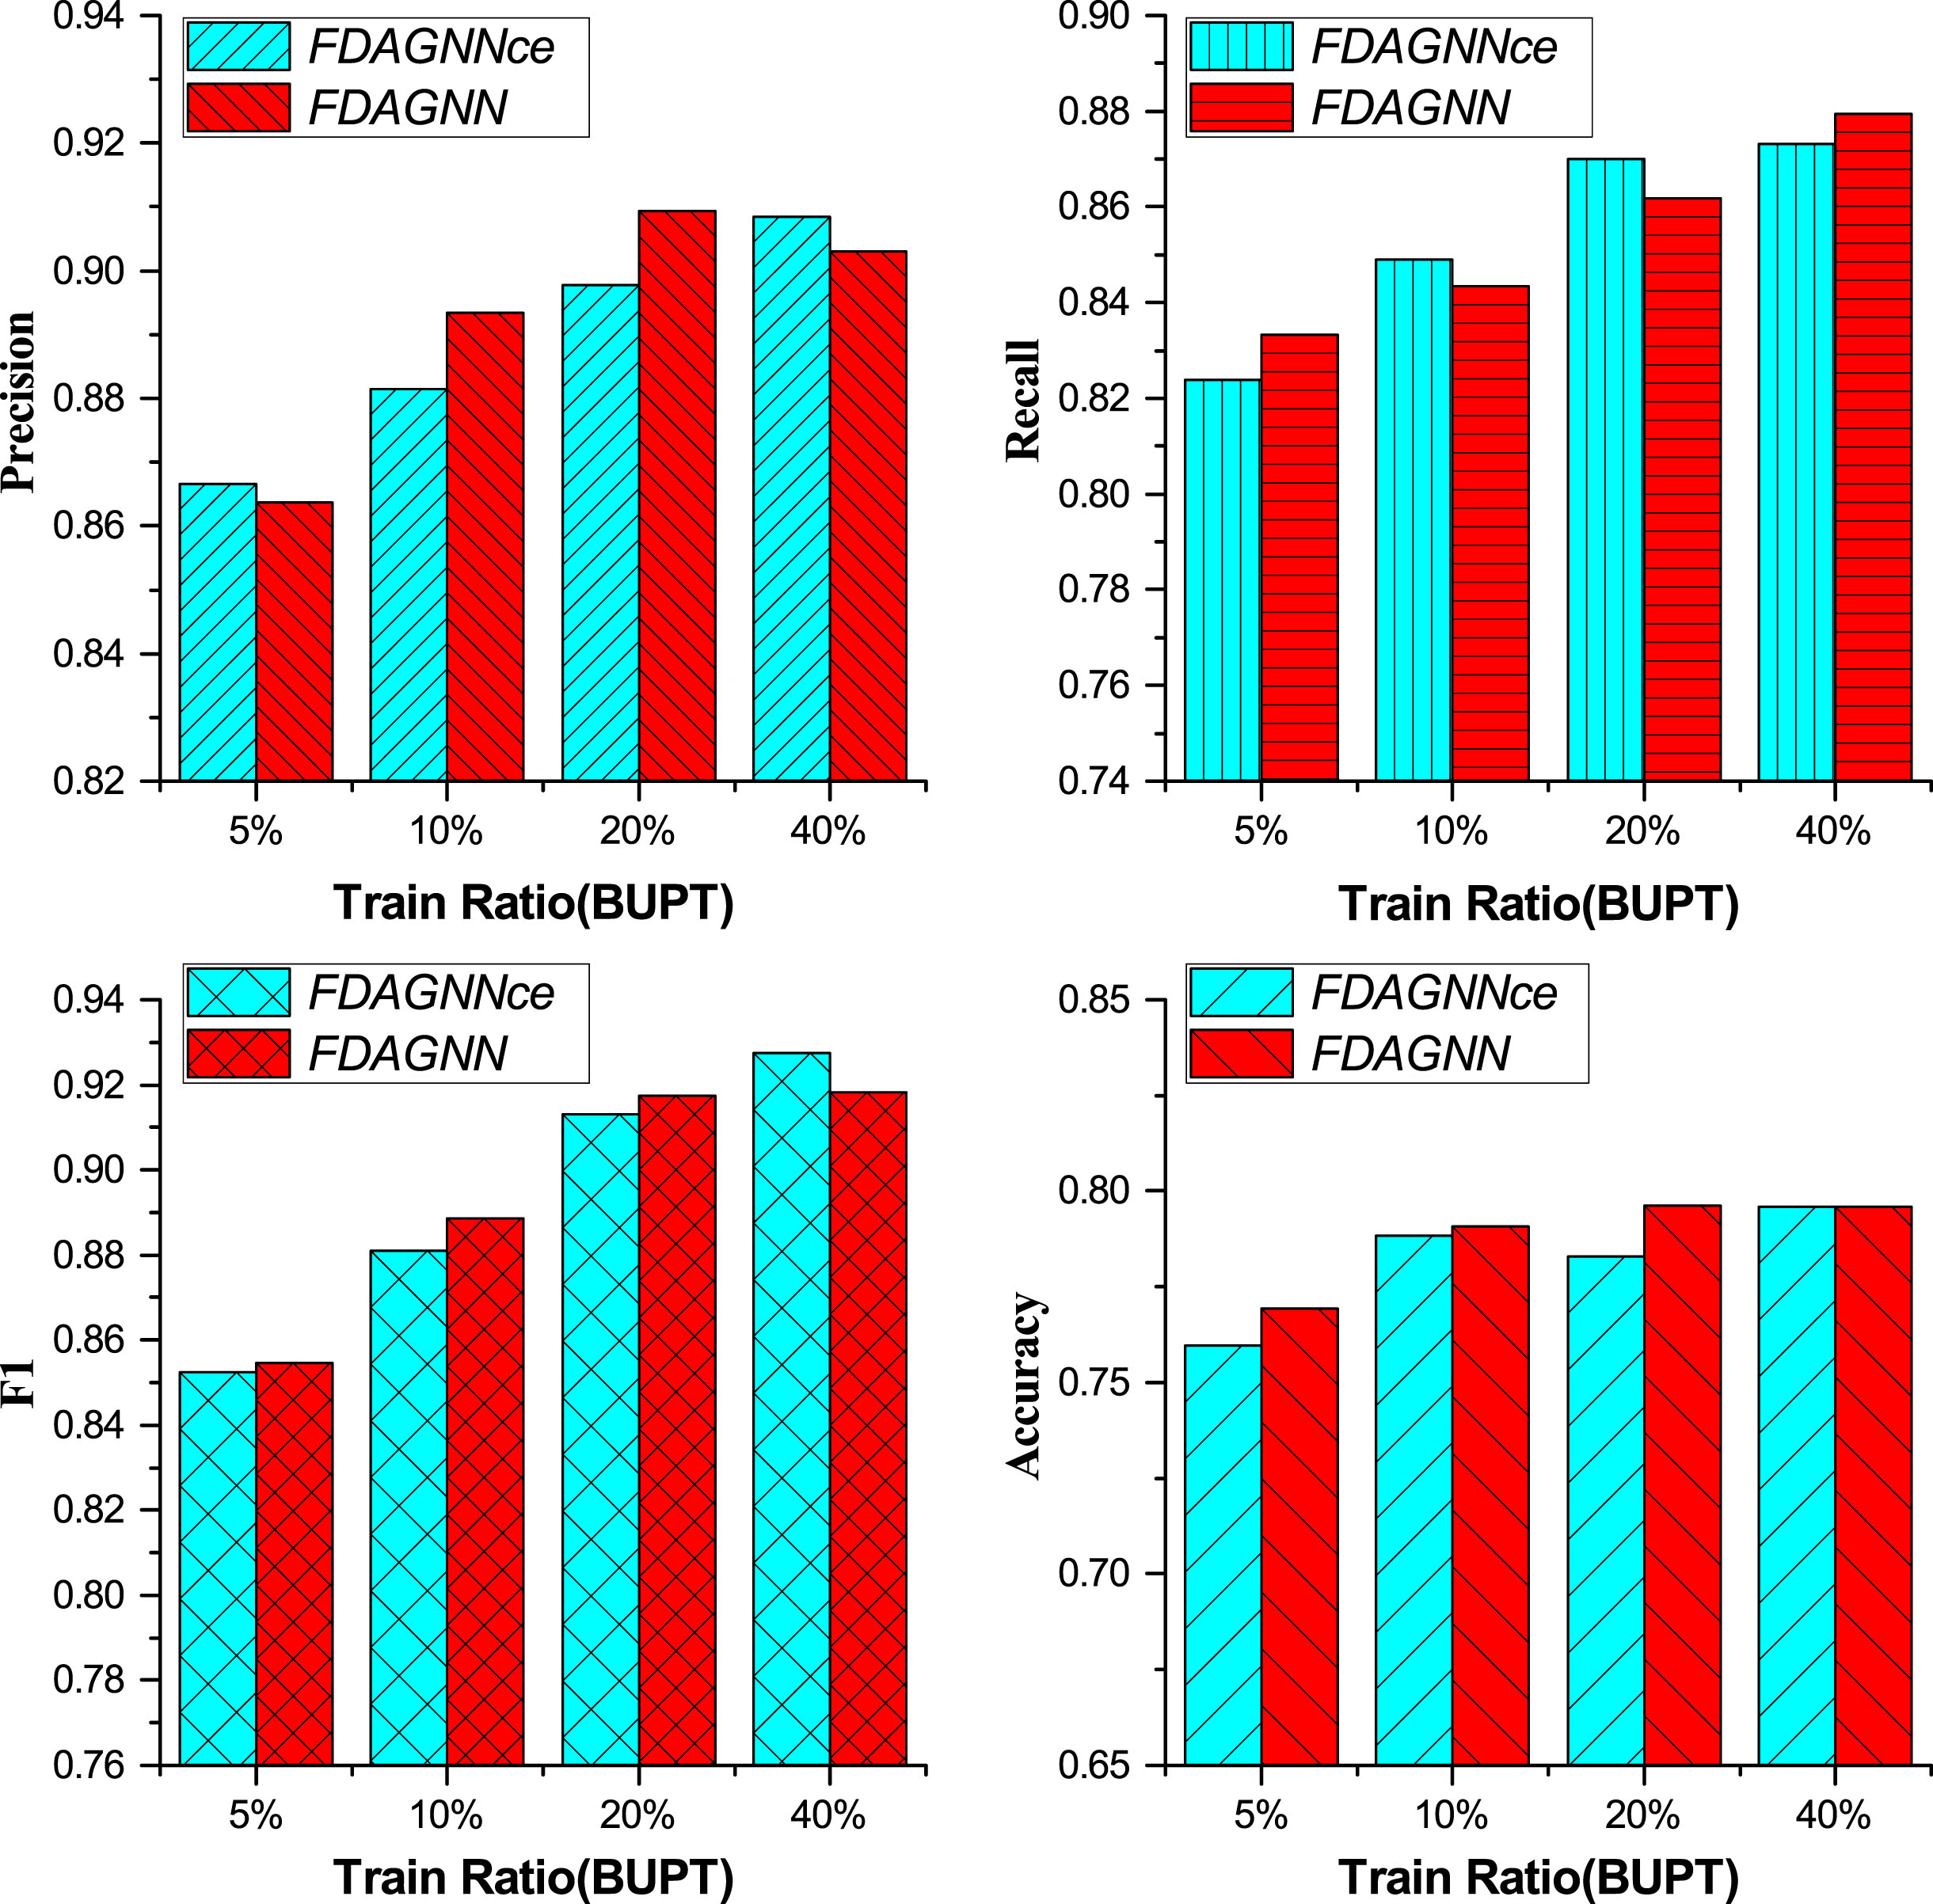
Performance Comparison of FDAGNN Using Different Loss Functions on the Dataset BUPT.
Performance Comparison of FDAGNN Using Different Loss Functions on the Dataset SC.
Fig. 8 and Fig. 9 illustrate diverse comparison results. On the dataset of BUPT, FDAGNN exceeded FDAGNN/diff on all evaluation metrics under a variety of training ratios. F1 rose by more than 5 percentage points at maximum. In spite of the minimum training ratio of 5%, F1 improved by almost two percentage points. This proves that it is necessary to take advantage of feature differences. However, the results were opposite for SC. Apart from Recall under the 10% and 20% ratios, FDAGNN was worse than FDAGNN/diff. The possible reason was that FDAGNN took advantage of the differences of the features between target nodes and their neighbors. However, the neighbors of the target nodes in the graph of SC were not the real neighbors in actual communication relationships. Therefore, the feature differences acted as noise for the original features. Furthermore, this result also confirmed the importance of the interaction behavior of calls, which was mentioned in the introduction of this paper, in telecom fraud detection.
Performance Comparison of FDAGNN Using or not Using the Feature Differences on the Dataset BUPT.
Performance Comparison of FDAGNN Using or not Using the Feature Differences on the Dataset SC.
In this section, the sensitivity of FDAGNN to the hyperparameters was investigated with regard to different hidden dimensions, gamma values of the loss function and numbers of graph convolution layers (Fig. 10, Training ratio is 0.2). The Accuracy remains relatively stable for both BUPT and SC in terms of all the three hyperparameters. Due to the fact that Precision, Recall, and F1 of the fraud category are used as the evaluation metrics, different values of these parameters result in different results. Based on the performance with different values of hyperparameters (as shown in Fig. 10), the three hyperparameters were finally determined to be 32, 1 and 1 respectively.

Note: Hidden-Dimension represents the dimension of feature embedding. Gamma denotes the gamma value in the loss function of FDAGNN. Layer represents the number of graph convolution layers in FDAGNN.
It is essential to consider the runtime efficiency of algorithms in real-world applications. The number of graph convolution layers for all algorithms was set to 2, and the other parameters were set as described in corresponding papers. All algorithms were trained in a transductive manner. Then, the training time of each algorithm is recorded per 100 epochs. From these data, the statistical mean time per epoch is calculated. As shown in Table 4, FDAGNN shows a significant advantage over CARE-GNN and GEM on BUPT, CARE-GNN FRAUDRE and H2-FDetector on SC.
Comparison of training time (seconds) per epoch between FDAGNN and baselines
Comparison of training time (seconds) per epoch between FDAGNN and baselines
In this paper, a graph convolution algorithm named FDAGNN for detecting telecommunication fraudsters is proposed. FDAGNN consists of two main modules: a difference-aware graph convolution module and a classification module that takes sample imbalance into consideration. The Difference-aware graph convolution module is made up of three components: the original feature transformation component based on a fully-connected layer, the feature differences aggregation component based on the graph attention mechanism, and the fusion component of the original feature and feature differences in embedding space in the GRU approach. Extensive experiments on two real-world telecom datasets demonstrate that FDAGNN outperforms seven baseline methods in terms of Precision, Recall, F1 of fraud, and Accuracy of total samples. For future work, the category imbalance problem will be further investigated, so as to improve the detection for telecom fraudsters. Meanwhile, the future research will involve privacy and security problems.