
Abstract
Image classification using polarimetric synthetic aperture radar (Pol-SAR) is becoming more important in image processing for remote sensing applications. However, in the existing techniques, during the feature extraction process, there exist some limitations including laborious endeavour for Pol-SAR image classification, identifying intrinsic features for target recognition is difficult in feature selection, and pixel-level Pol-SAR image classification is difficult for obtaining more precise and coherent interpretation consequences. Hence to overcome these issues, a novel Multifarious Stratification Stratagem in machine learning is proposed to achieve pixel-level Pol-SAR classification. In this proposed model, a novel Scrumptious Integrant Wrenching method is used for efficient feature extraction. It is compatible with the orientation-sensitive of the Pol-SAR image which increases the variety of intra-layer features. To remove the difficulty in feature selection, a novel Episodicical Proximity Selection method is proposed in which a Split-level parallel feature selection strategy is used to select the best qualities from the extracted features. To tackle the difficulty in classification, an Elastic Net Classifier (ENC) is used that find the coefficient vector for the linear combination of the training sets. This efficiently classified the best features in the Pol-SAR images and improved the proposed system’s accuracy. As a result, the performance measures of the proposed system demonstrate that the accuracy is increased by 99.69%, precision is increased by 98.99%, recall is increased by 98.99%, sensitivity is increased by 98.99%, and F1-score is increased by 98.99% as a response.
Keywords
Nomenclature
Input data
Transposition
Weight vector
Bias item
Composite function of ReLU and max pooling
Regularization parameters
Embedding function
Coefficient vector to reconstruct the testing sample, x
Introduction
Machine learning is a subfield of artificial intelligence (AI) that enables computers to learn and develop without explicit programming. Machine learning is the process of developing computer programs that can access data and learn on their own. To categorize and represent the characteristics in an image in terms of the object or kind of land cover that these features reflect as a certain grey level on the ground (or colour), image classification must first identify the features in the image. The most crucial step in processing digital images is classification. Polarimetric Synthetic Aperture Radar (PolSAR) has a wider range of applications than single-channel Synthetic Aperture Radar (SAR) because it can provide more details about the backscattering characteristics of objects, greatly enhancing its ability to distinguish between various types of land cover. The fact that PolSAR is widely employed for both military and civilian applications, such as topographic mapping, resource identification, catastrophe monitoring, combat reconnaissance, and precision guidance, has drawn a lot of interest to PolSAR image interpretation research in recent years. Both supervised and unsupervised approaches have received attention [1].
The categorization of high-resolution SAR images continues to present the following two difficulties: Due to the coherent imaging system, complicated spatial structure patterns, speckled object shadow occlusion, and pixels from the same object can all vary greatly [2]. Hand-crafted feature-based techniques can perform rather well for some particular categories with limited training data and have decent low-level feature representation capacity for SAR images [3]. In practical applications, manual annotation of SAR data is labour- and time-intensive. Due to the paucity of SAR-labeled data, many plans, including domain adaptation, have been presented [4]. To train SAR features, a deep supervised and contractive neural network (DSCNN) was previously used [5]. After that, the discriminant deep belief network (DisDBN) is recommended for high-resolution SAR image categorization [6]. In optical images, manifold learning is utilized to increase the effectiveness of semantic segmentation [7]. A multi-alignment fusion technique for hyperspectral and polarimetric SAR is then put forth utilizing LPP [8].
For identifying PolSAR images, the remote sensing community has developed a variety of algorithms [9]. In Pol-SAR image classification utilizing multifarious stratification stratagem, machine learning serves as the cornerstone by employing advanced algorithms and techniques to effectively interpret and classify polarimetric synthetic aperture radar (Pol-SAR) data. Through the intricate utilization of diverse stratification strategies, machine learning models leverage the multi-dimensional nature of Pol-SAR data, extracting nuanced features and patterns that aid in accurate classification of different land covers or targets [10, 11]. These models adaptively learn from labelled data, employing methodologies such as convolutional neural networks (CNNs), support vector machines (SVMs), or random forests to discern complex relationships within the polarimetric data, ultimately enabling precise and efficient classification of land cover types or objects in Pol-SAR imagery [12]. Furthermore, a method for classifying optical remote sensing scenes was developed that combines multi-layer CNN feature maps with covariance pooling [13].
Other techniques, to identify and categorize images of finger veins, a pre-trained model dubbed Xception uses a depth-wise separable convolutional neural network (DS-CNN). The Xception model can effectively learn the feature from finger vein images according to the depth-wise separable convolution layers and residual connection [14]. The finger-vein recognition (FVR) system is subject to presentation assaults, in which the sensory device accepts a falsely printed FV image and provides access as if it were a sincere attempt, according to a recent study. There hasn’t been much deep learning (DL) research created to identify spoof attacks in FV images. Since there are currently no lightweight and efficient feature descriptors available, existing research depends on performance enhancement while ignoring the issues of a small dataset, high computational complexity, and lack of them [15].
The two main categories of presentation assault detection techniques are software-based and hardware-based. The subcategories of the multimodal finger vein biometric system include feature-level fusion, matching-level fusion, and hybrid fusion approaches [16]. In the field of computer vision, image categorization is receiving greater attention. Many studies on image categorization using traditional machine learning and deep learning approaches have been conducted in recent years [17]. The analysis of digital images to spot alterations is known as image forensics. Digital images are becoming more and more well-liked in today’s world since there are so many inexpensive photo-capturing technologies available. A common occurrence is the intentional or unintentional manipulation of these images, which causes the images to convey false information [18].
A multifold growth in the distribution of multimedia data over the open and unprotected Internet has drawn the attention of forensic professionals and security researchers to content authentication of digital images. Attackers using cunning strategies effectively overcome modern forensic techniques designed to identify forgeries in digital images. On benchmarked datasets, feature engineering techniques have shown accurate results. Deep learning techniques have produced encouraging results for several image classification issues, but they are unable to identify the underlying patterns in digital photos that may be used to detect forgeries of real images. On benchmarked datasets, the current accuracy of deep learning techniques for forgery detection [19].
On the other hand, using image patches or superpixels as classification units might lead to classification mistakes in some locations and perhaps result in the loss of ground target contours [20]. It makes sense to have classification algorithms directly operate on these covariance matrices since the coherency or covariance matrix may be utilized to determine the scattering properties of scattered objects in PolSAR images [21]. Like the Linear Programming Problems (LPP) approach, the Neighbourhood Preserving Embedding (NPE) method aims to preserve the local structure of the data manifold while still optimizing the objective function. The NPE approach is frequently used for image classification in chemical processes or computer problem detection and diagnostics, facial identification, and facial clustering [22]. The asymmetric data distribution alters the region surrounding the sample point. Hence, a novel model has to be created to tackle the challenges in existing techniques. The main contributions of this paper are as follows: To extract all features from Pol-SAR images, a novel Scrumptious Integrant Wrenching is proposed in which it enhances the intra-layer features and is consistent with the Pol-SAR image’s orientation sensitivity. To choose the best features from the retrieved features, an Episodicical Proximity Selection is utilized in which the problem of feature selection is reduced via a Split-level parallel feature selection strategy. To categorize the features in Pol-SAR images, the Multifarious Cladio-elastic net layer is used to eliminate the challenge associated with feature classification by finding the coefficient vector for Pol-SAR images.
The content of the paper is organized as follows: section 1 represents the introduction; Section 2 presents the related work; the novel solutions are presented in Section 3; the implementation results and their comparison are provided in Section 4; and finally, section 5 concludes the paper.
Literature survey
Shang et al. [23] suggested a spatial feature-based convolutional neural (SF-CNN) that utilizes a CNN topology with two branches where the parameters and structure of both branches are the same. Several samples were sent to SF-CNN as input and it solved the issue of insufficient labeled training data in PolSAR image classification jobs by mixing diverse samples to increase the original training set. High-dimensional PolSAR images were mapped by SF-CNN during training to low-dimensional feature space. By maximizing or reducing the distance between the feature centres of various classes, SF-CNN improved the network’s capacity to extract discriminative features in low-dimensional feature space. The SF-CNN, on the other hand, employs the Euclidean distance, and this artificial measurement function is more or less flawed.
Mu et al. [24] proposed a multi-scale and multi-level spectral-spatial feature fusion network (MSSN) for hyperspectral image categorization which did not require feature engineering because it used the original 3D cube as input data and effectively extracted spectral-spatial information of multiple scales by employing varied scale neighbourhood blocks as the network’s input. The proposed 3D-2D alternating residual block combined spectral data extracted by a three-dimensional convolutional neural network (3D-CNN) with spatial characteristics extracted by a two-dimensional convolutional neural network (2D-CNN). Although multi-scale input results in more accurate categorization, the three-branch network model increases calculation complexity.
Zhang et al. [25] proposed a PolSAR-tailored contrastive learning network (PCLNet), for few-shot classification and unsupervised deep PolSAR representation learning. To reduce the application gap between optics and PolSAR, a diversity stimulation mechanism is built, as opposed to using optical processing techniques. In addition to the traditional supervised techniques, PCLNet creates an unsupervised pretraining phase based on instance discrimination as a proxy aim to extract meaningful representations from unlabeled PolSAR data. The downstream job, which is a few-shot PolSAR classification, uses the acquired representations. However, there is a lack of discriminative features and the appearance of speckles.
Okwuashi et al. [26] presented an innovative way of classifying PolSAR images using a Deep Support Vector Machine (DSVM), a combination of DL and SVM. The experiment is tested using two PolSAR photos of Winnipeg, Canada, and the Flevoland region of the Netherlands. The photos are filtered using the Lee filter to reduce speckle noise. Four kernel functions Exponential Radial Basis Function (ERBF), Gaussian Radial Basis Function (GRBF), neural, and polynomial are used to create the DSVM classifier. A comparison of the DSVM and SVM is presented in the first set of results. However, the interpretability of deep SVMs in the context of PolSAR data is limited due to the complex transformations performed by deep architectures, making it challenging to comprehend how these models arrive at their classifications.
Jamali et al. [27] developed and presented a deep CNN network with three branches. By employing the Haar wavelet transform as a powerful feature extraction method, the PolSAR picture classification accuracy is increased. Compared to two shallow CNN networks of AlexNet and a 2-D CNN, it was discovered that the suggested technique produced substantially more homogenous and smoother classification maps for two PolSAR benchmark datasets of the Flevoland and San Francisco with significantly reduced speckle noises. However, the complexity of PolSAR data with its multi-dimensional nature occurs.
Cui et al. [28] constructed the polarimetric convolutional neural network (PolCNN) by designing a set of convolution kernels known as polarisation rotation kernels (PRKs). This final model’s basic network, the PolCNN, can adaptively learn polarisation rotation angles. The final model, polarimetric multipath CNN (PolMPCNN), is the result of extending the PolCNN into a multipath structure for the second obstacle. The networks of various pathways inside the PolMPCNN are directly correlated with the polarisation rotation angles of various land coverings. However, it is computationally expensive and time consuming, especially considering the high dimensionality and complexity of PolSAR images.
Dong et al. [29] proposed a vision transformer (ViT)-based representation learning framework, which covers both supervised learning and unsupervised learning. In the supervised learning aspect, the ViT model is trained using labelled PolSAR datasets, where the model learns to map input PolSAR images to their corresponding class labels. By fine-tuning the ViT architecture and utilizing techniques like transfer learning, the model can discern complex patterns and features from the polarimetric data, improving classification accuracy. However, it is computationally intensive, and scaling them for large PolSAR datasets demands substantial computational resources.
Ren et al. [30] proposed an innovative, complex-valued deep learning method for classifying PolSAR images to overcome the difficulty of balancing the complex-valued inputs of PolSAR images with the real-valued deep learning models. The method consists of complex-valued nonlinear activation, amplitude-based max pooling, and a cross-entropy loss function based on complex-valued probability. Three publicly available datasets were used to confirm the efficacy of the suggested technique, which was applied to a shallow CNN, deep CNN, FCN, and SegNet. However, ensuring the stability and convergence of training complex-valued neural networks is much more complex.
Table 1 depicts the overall review based on existing works in Pol-SAR image classification. Its significance lies in its capacity to capture polarimetric properties, offering valuable insights beyond traditional optical or single-polarization radar imagery. However, PolSAR image classification also faces notable challenges. The complexity and dimensionality of PolSAR data pose hurdles in feature extraction and interpretation. The interpretation of polarimetric information requires specialized expertise, making the analysis and classification process more intricate compared to optical imagery. Thus, a novel technique is recommended for solving the aforementioned issue to achieve a more discriminative representation and resolve the effects of speckles, maintaining image boundaries and smoothing classification results.
Review on the classification of Pol-SAR image with existing works
Review on the classification of Pol-SAR image with existing works
Polarimetric SAR is a kind of advanced imaging radar that is used for radar remote sensing. The shape and direction of the scatters have a significant impact on the backscattering of the single-polarized Pol-SAR image during the feature extraction process in existing systems. This is a challenging technique because of the complex statistical structure and three-dimensional structural patterns of Pol-SAR image categorization. To solve this issue, a brand-new technique called
Furthermore, the proximal position of the sample point determined by the uneven distribution of data causes a significant reconstruction error in the selection phase of existing techniques. To address this issue, a novel approach called
In addition, the current system was unable to produce an accurate and coherent explanation. To address these problems, a unique
Architecture of the proposed system.
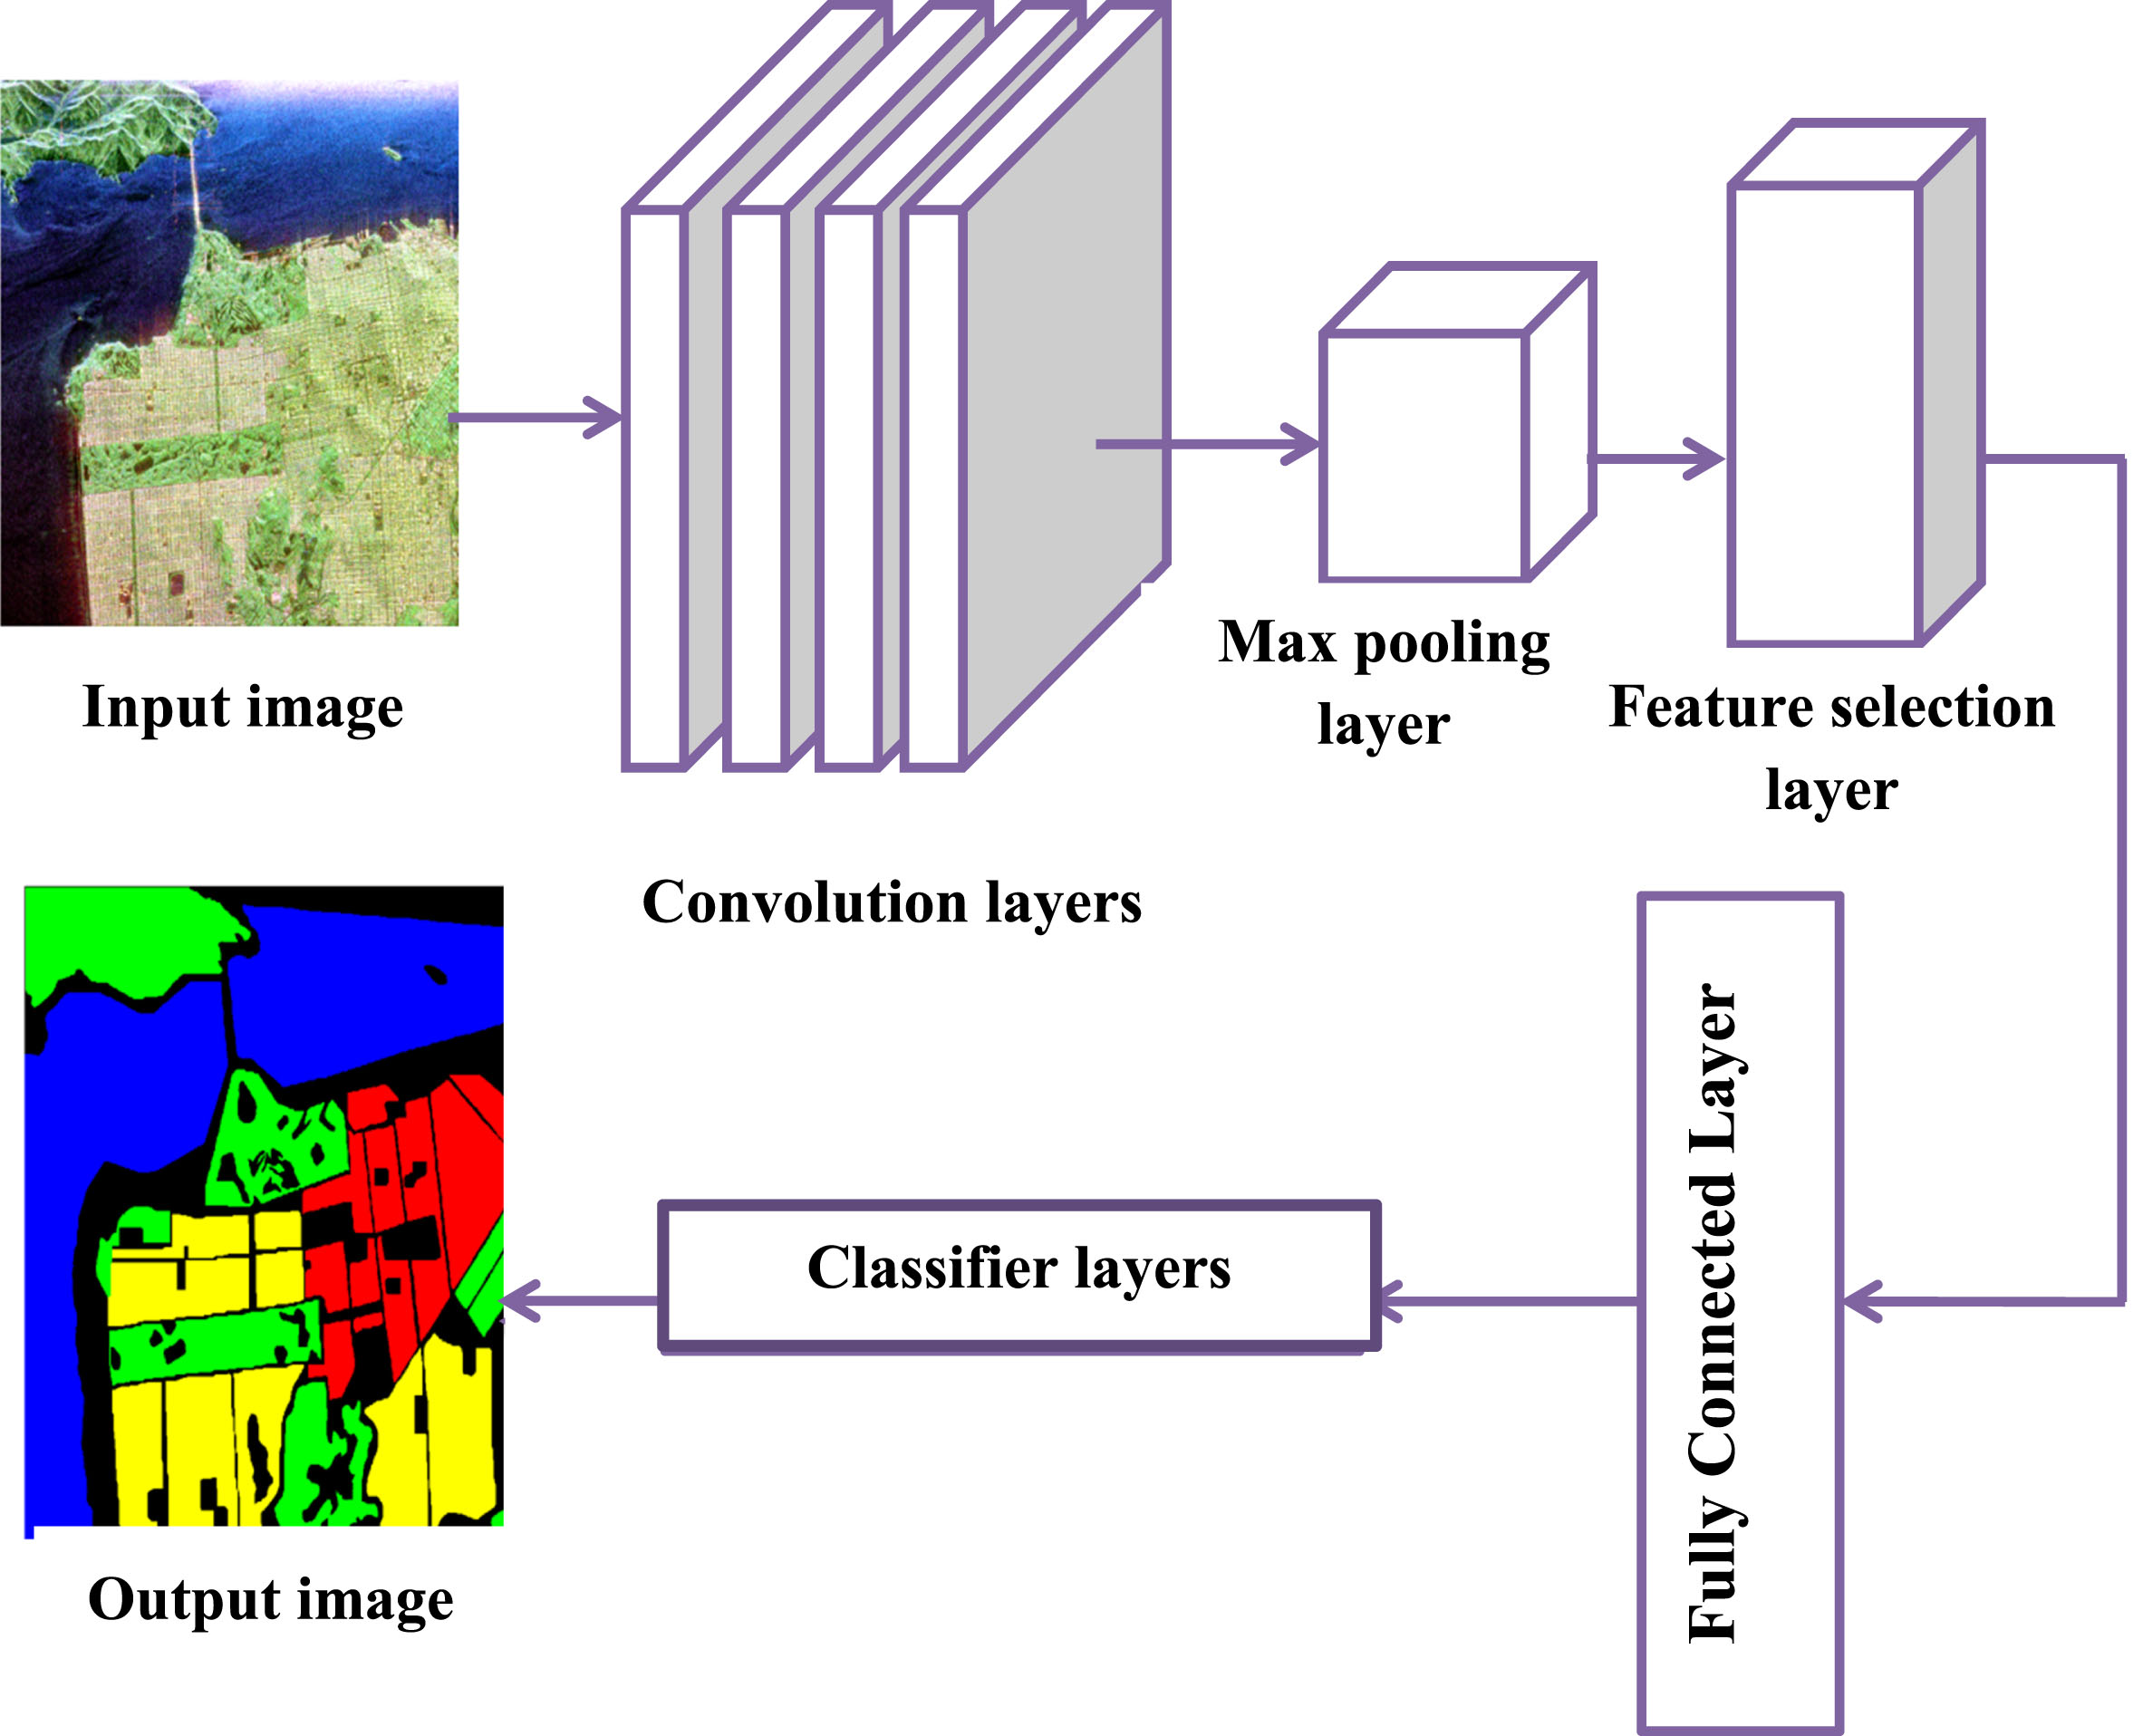
In Fig. 1, the input pol-SAR image is first sent to the convolution layer in which the convolution layer extracts the features using convolution operation from the input Pol-SAR image then the max-pooling layer takes the input from the convolution layers; the max-pooling layer maps the extracted features based on maximum value from the input image. After that, the feature selection layer selects the best features from the extraction features of the max pooling layer. Then fully connected layer connects all the best features of the input image and the classification layer accurately classifies the input image.
In scrumptious integrant wrenching, intra-level basic features are learned using the convolutional layer to capture the spatial patterns in the SAR image in a delicious integrant way. In this work, feature extraction is conducted to learn a better representation of the Pol-SAR image, and the convolution filters are interpreted with all convolution layers for feature learning without suffering performance. The convolution layer feature extraction figure is shown in Fig. 2.

Convolution layer feature extraction.
In Fig. 2, the input Pol-SAR images were transformed using a convolution layer to extract features from the Pol-SAR image. The incoming data is processed by a convolutional layer using a set of programmable filters, also referred to as kernels and un-deviational filters. These filters employ convolution processes, which entail element-wise multiplication and summing, to scan the input image with a sliding window. In doing so, the convolutional layer recognizes elements like edges, textures, and other visual patterns and captures local spatial patterns. Convolutional layers identify and extract significant spatial patterns that are indicative of particular classes or structures within the image in the context of SAR imagery. The training procedure improves the convolutional layers’ capacity to spot and record these spatial patterns in SAR pictures. To maximize the model’s capacity to identify and categorize spatial patterns in SAR images, the network modifies the weights of the filters during training to reduce the discrepancy between anticipated and ground truth labels.
The Pol-SAR image is convolved with a kernel in this transformation process. In addition, a kernel filter is a tiny matrix which is smaller in height, and width than the image to be convolved therefore the convolution layers efficiently extract all the features from the input Pol-SAR image even if it has complicated spatial structures. The output of the convolution layer is mathematically expressed as
In here, the CNN includes the convolutional layer of both the rectified linear unit (ReLU) activation function and max pooling. For that reason, the convolutional output M is reformulated as,
Where:
g (·) is a composite function of ReLU and max pooling
At every point, the filters multiply and add elements one at a time as they move across the image. Using this method, feature maps are created that emphasize particular structures or patterns in the Pol-SAR data. In Pol-SAR image analysis, convolved features of various kinds that represent various parts of the scene can be captured via convolved layers. These characteristics include texture patterns, scattering mechanisms, polarimetric characteristics, or other details pertinent to the target categorization and analysis task. As higher-level representations of the original Pol-SAR image data, the convolved features derived from the convolutional layers are being used. The max-pooling layer reduces the spatial size of the convolved features and also it extracts the dominant features of the Pol-SAR image, which are rotational, and positional invariant, thus the max-pooling layer maintains the process of effectively training the model. The max-pooling layer also does de-noising and dimensionality reduction, thereby removing the noise from the input picture. The feature selection layer then chooses the best features from the max-pooling layer, as explained in the episodic proximity selections.
This code represents the creation of a convolutional neural network that employs convolutional and max-pooling layers to extract features from Pol-SAR images. To define the appropriate architecture, including the number of layers, filter sizes, and activation functions based on the specific requirements of the problem and dataset. Additionally, the model is compiled and trained using the Pol-SAR images to learn and extract meaningful features. Finally, the model.predict() function is used to obtain the extracted features from the trained model.
In episodially proximity selection, the best features are picked from the extracted features using Principal Component Analysis (PCA) thereby reducing the problems of image classification. PCA is an unsupervised Feature Reduction method for projecting high-dimensional data into a new lower-dimensional representation that captures as much variance as possible with the least degree of reconstruction error, hence PCA is used to choose the best features from the extracted features in the episodically proximity selection. PCA perform the conversion of the original data to eliminate the correlation between the bands. Episodicical Proximity Selections identify data patterns in between features and the statistical features of the bands are used to examine the band’s correlation or dependence. This strategy improves classification accuracy while also saving time for feature selection. Moreover, the PCA reduces the dimensionality of high-dimensional data of the Pol-SAR image while preserving trends and patterns therefore it can effectively identify the intrinsic features from the extracted features without having the difficulty of reconstruction. The principal component analysis produces a feature set that reduces the dimensions. The data dimensions’ reduction process by using the principal component analysis algorithm is explained given below.
The first step is to use the given formula to get the mean of X.
Equation (3) aids in both data normalization and covariance computation. Then the covariance matrix is computed in the second step as.
Here, the covariance matrix is used to identify the correlation and dependencies among features. Then the last step of the principal component analysis is the spectral decomposition of the covariance matrix using Eigenvectors ɛ1, ɛ2, …, ɛ
D
and Eigenvalues v1, v2, …, v
D
. The Eigenvalues are sorted as v1 ≥ v2 ≥ … ≥ v
D
. From the covariance matrix, the Eigenvectors and the Eigenvalues are calculated and it is given as,
Then the diagonal matrix is extracted by using,
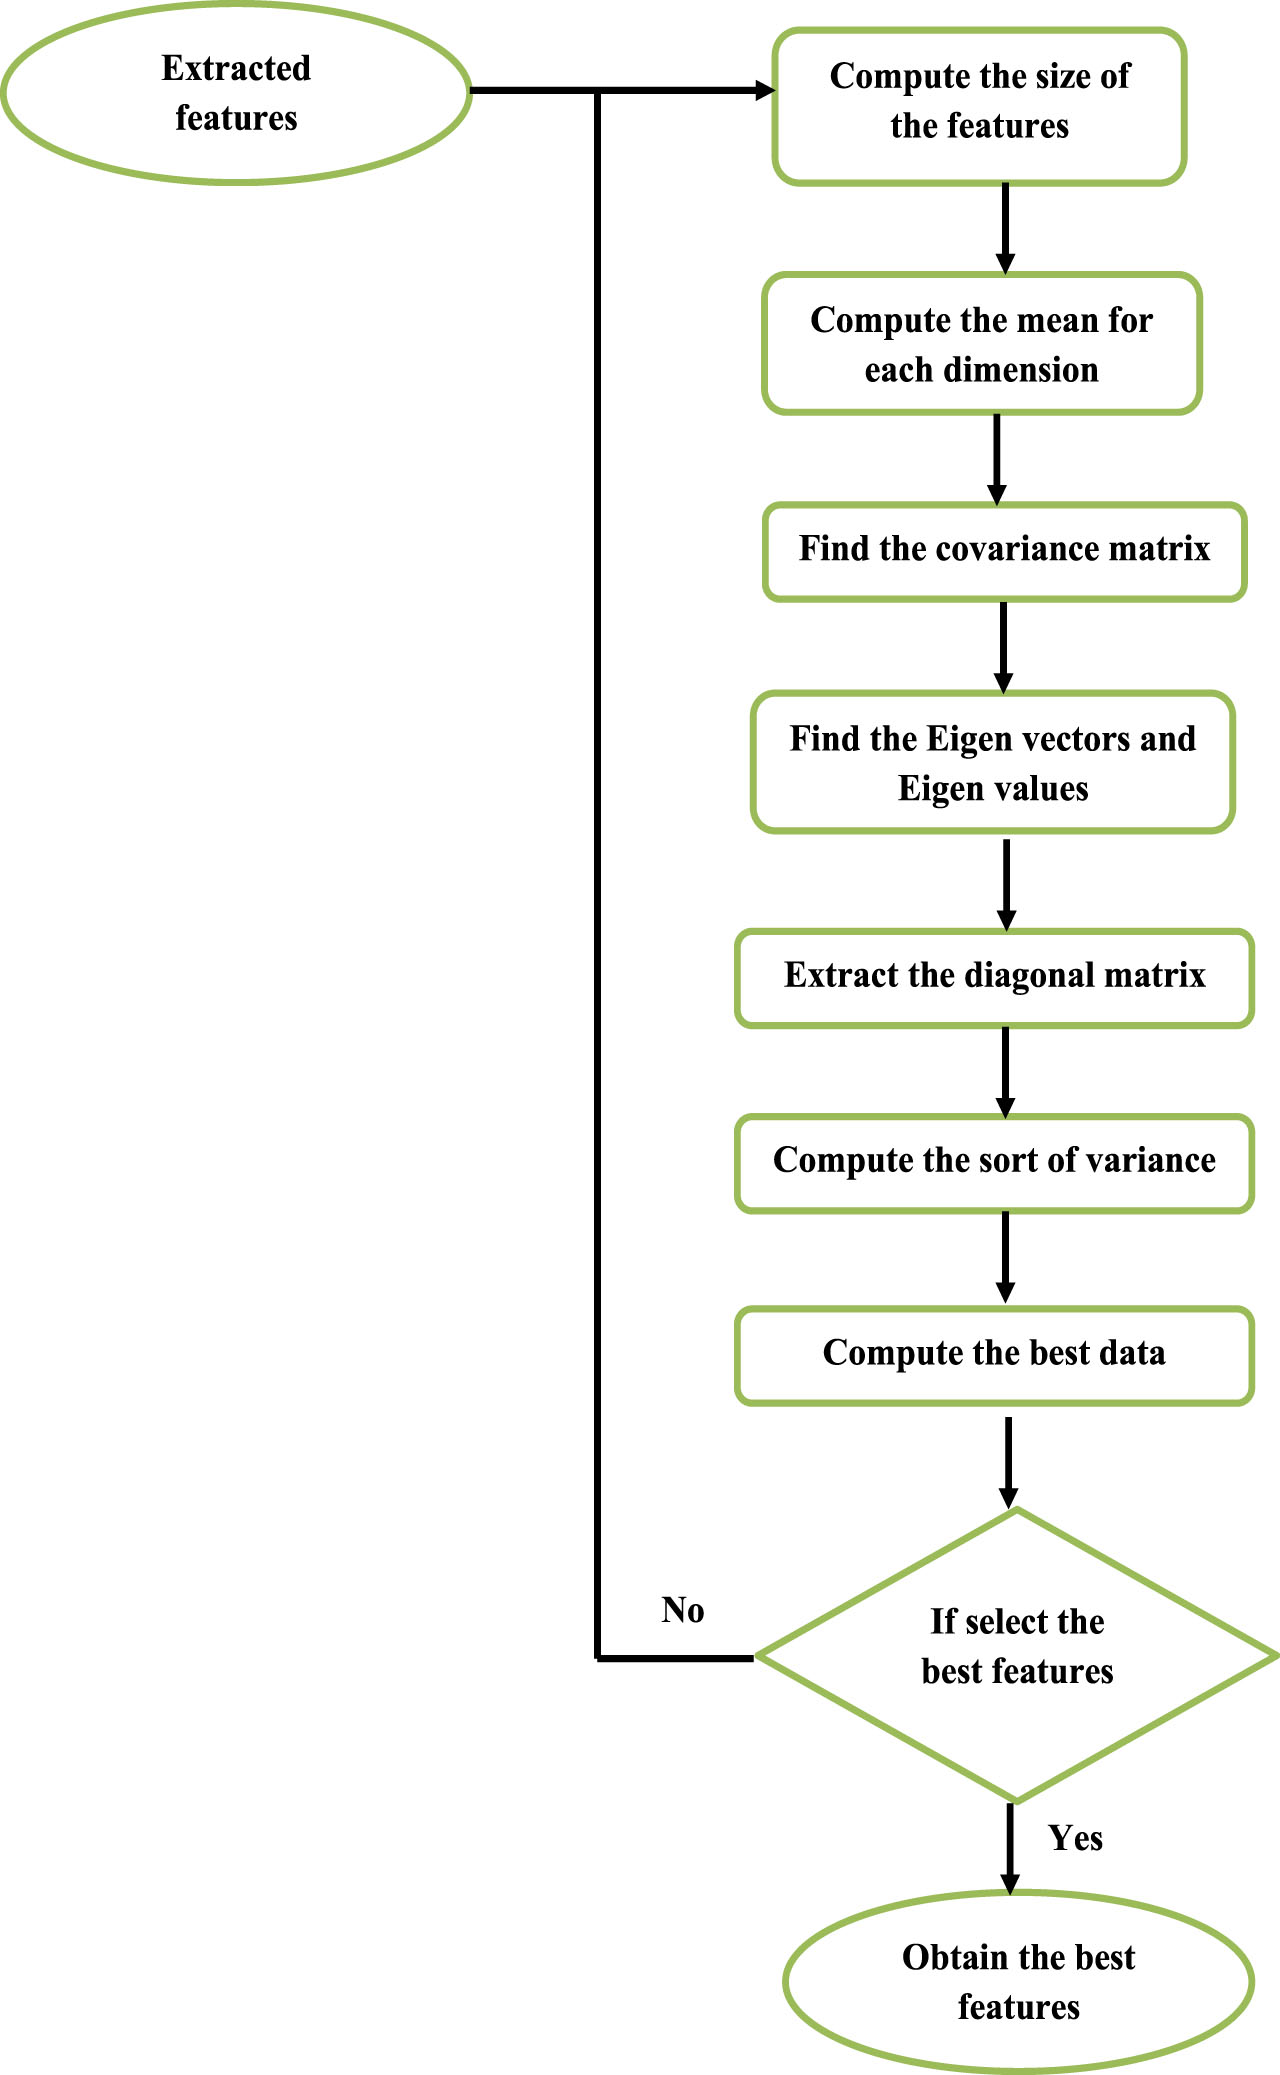
Flowchart of episodicical proximity selections.
In Fig. 3, the covariance matrix identifies the relationship among features of the input Pol-SAR image, and then through the eigen decomposition of the covariance matrix, eigenvectors and eigenvalues are obtained from the Pol-SAR image. Next, extract the diagonal matrix from the decomposition matrix. Finally, episodic proximity selections compute the best data from the input Pol-SAR image. In this way, the episodic proximity selections efficiently select the best features from the extracted features without losing information from any features. After selecting the best features from the max-polling layer, the proposed system must classify the best features efficiently. For that reason, the proposed system uses a multifarious stratification stratagem to classify the image without classification errors.
To achieve better classification accuracy and high computational efficiency in the proposed system used a novel multifarious stratification strategy. In this work, the kernel is integrated with the elastic net classifier (ENC) for the PolSAR image classification. ENC in Multifarious Stratification Strategem estimates robust coefficients to demonstrate a more powerful discriminant ability to provide improved classification performance even when there are only a few training sets.
For a testing sample of Pol-SAR image
Where:
λ1 and λ2 are the regularization parameters.
Ø(·) is an embedding function, which maps the data from the Riemannian manifold into PKHS.
β = [β1, …, β C ] is the coefficient vector to reconstruct the testing sample, x
According to the estimated coefficient vector
In the same way, a whole PolSAR image is classified. As a result, the proposed system achieved the pixel-level PolSAR classification.
This pseudo-code illustrates the usage of an Elastic Net classifier for classification tasks. It initializes the classifier, trains it using the extracted features and corresponding labels, and then predicts the class labels for test Pol-SAR images.
The overall process of the proposed system flowchart is shown in Fig. 4. Through the kernel, the kernel-elastic net classifier takes advantage of the PolSAR data’s intrinsic statistical properties and spatial information. Consequently, it produces a more discriminative representation and overcomes the impact of speckles, retaining picture borders and smoothing classification results.
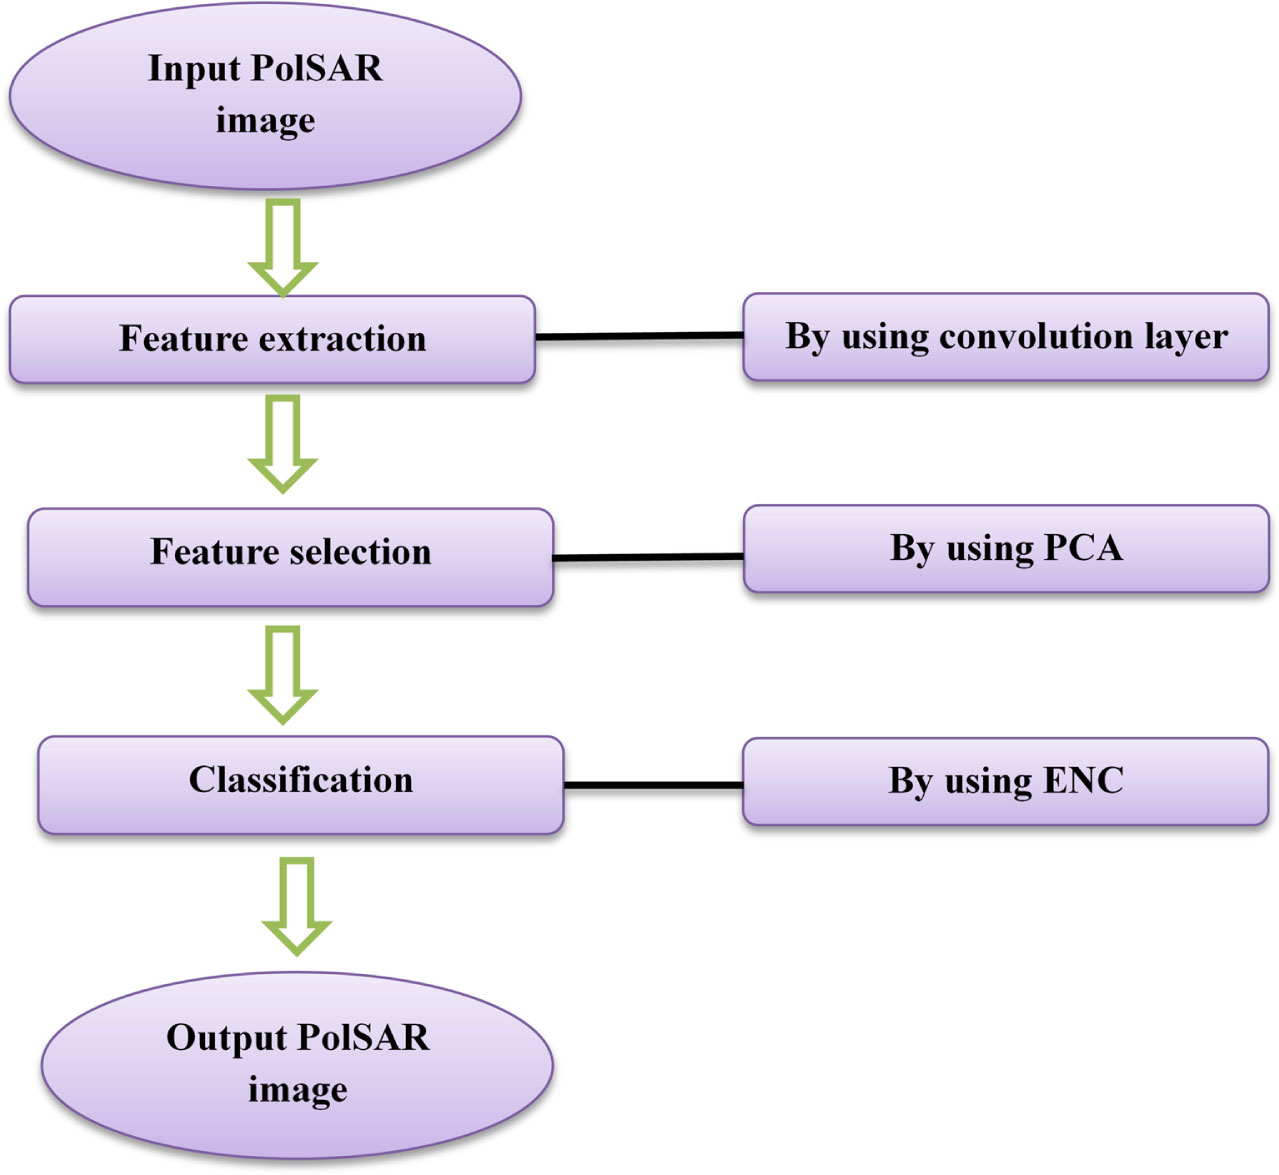
Flowchart of the proposed system.
Thus, overall the convolution layers, max-pooling layers, feature selection layers, fully connected layers, and a classification layer as an output layer make up the completely proposed system. The convolution layers extract all of the characteristics from the input data automatically. The max-pooling layer then reduces the spatial size of the convolved features and extracts the rotational and positional invariant prominent features of the Pol-SAR image, ensuring that the model is properly trained. The feature selection layer then uses principal component analysis to choose the best features from the max-polling layer, and the fully connected layer then gets all of the best features from the max-polling layer. The output layer, which is the classification layer, then uses an elastic net classifier to classify the best features. Consequently, the proposed method retrieves the best characteristics from the Pol-SAR image efficiently and properly classifies it.
This segment provides a detailed description of the implementation results as well as the performance of the proposed system and a comparison section to ensure that the proposed system performs valuably.
Experimental setup
This work has been implemented in the working platform of Python with the following system specification and the simulation results are discussed below.
Dataset description
The proposed system used the Indian pines dataset to examine the work. This is a portion of a greater scene and the AVIRIS sensor captured this view above the Indian Pines test site in northwestern Indiana, with 145 × 145 pixels and 224 spectral reflectance bands in the wavelength range of 0.4–2.5 10∧ (-6) meters. Two-thirds of the scene in Indian Pines is farmland, with the remaining one-third being forest or other natural permanent flora. Two large dual-lane highways, a rail line, as well as some low-density residences, other manmade buildings, and minor roadways, are all present. Since the image was captured in June, some of the crops present, such as maize and soybeans, are still in the early stages of development, with less than 5% coverage. The accessible ground truth is divided into sixteen categories, none of which are mutually incompatible. The sixteen categories of the ground truth figure are given below.
Figure 5 shows the simulation output of the classified Pol-SAR image. In scrumptious integrant wrenching, the features are extracted from the Pol-SAR images by using the convolution layer in which it extracts all the features from the input Pol-SAR image at the same time it increases the variety of intra-layers features and makes full use of a large number of training sets by convoluting the Pol-SAR images with convolution filters in all layers. Table 2 shows the ground truth classes for the Indian pines scene and their respective sample number. Then the proposed system must find out the suitable features from the extracted features so, a novel episodical proximity selection approach is used to select the best features from the extracted features in which the principal component analysis is used to select the best features. Afterwards, the proposed system used a multifarious stratification stratagem to efficiently classify the essential features in which the composite kernel is integrated with an elastic net classifier to achieve better classification accuracy. As a result, the proposed system efficiently extracted, and selected the features from the input Pol-SAR images, and classified the features more precisely. The different categories of the ground truth of the output Pol-SAR image are given below table.
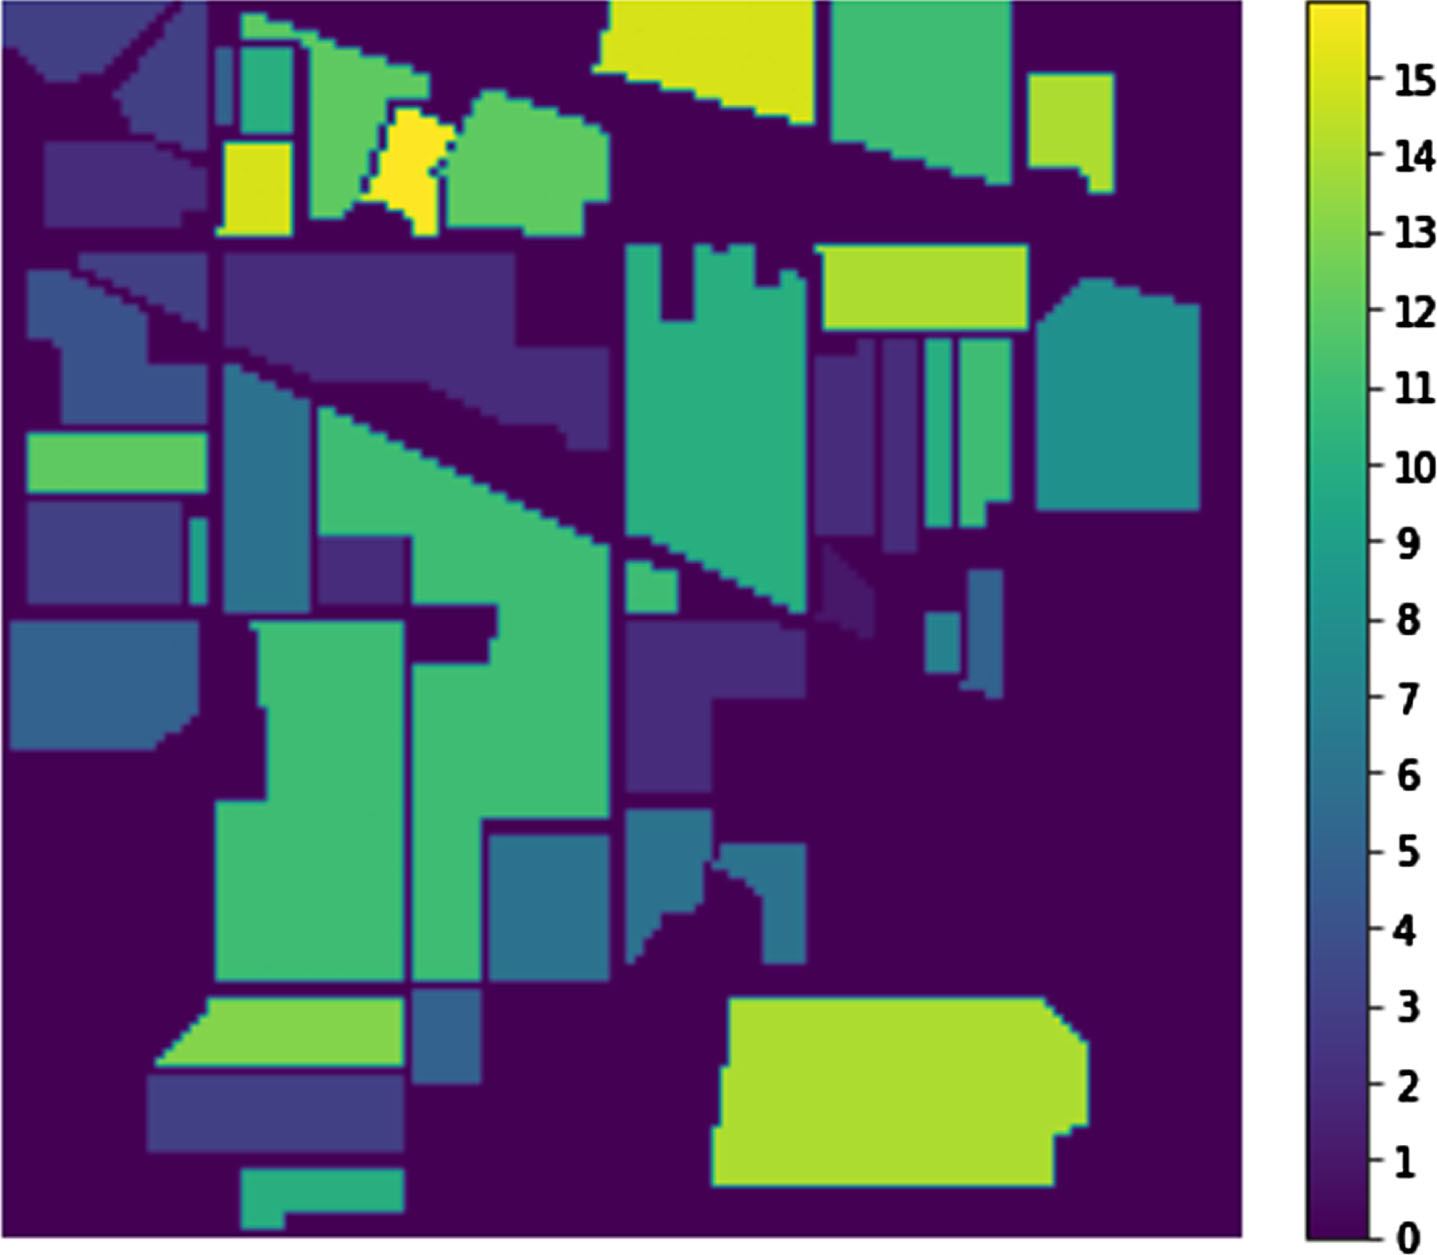
Simulation result of classification Pol-SAR image.
Category of ground truth
Figure 6 shows the t-SNE curve for the proposed work. The t-SNE plot visualizes the extracted features derived from Pol-SAR images during the classification of digits 0 to 9 in a training dataset. It showcases the transformation of complex rotational and positional invariant features into a two-dimensional space, enabling a clear depiction of how these features cluster together based on similarities, and aiding in understanding the discriminative patterns within the dataset. This plot provides a concise representation of how these invariant features contribute to the classification of different digits, highlighting their distinct distributions and relationships within the feature space.
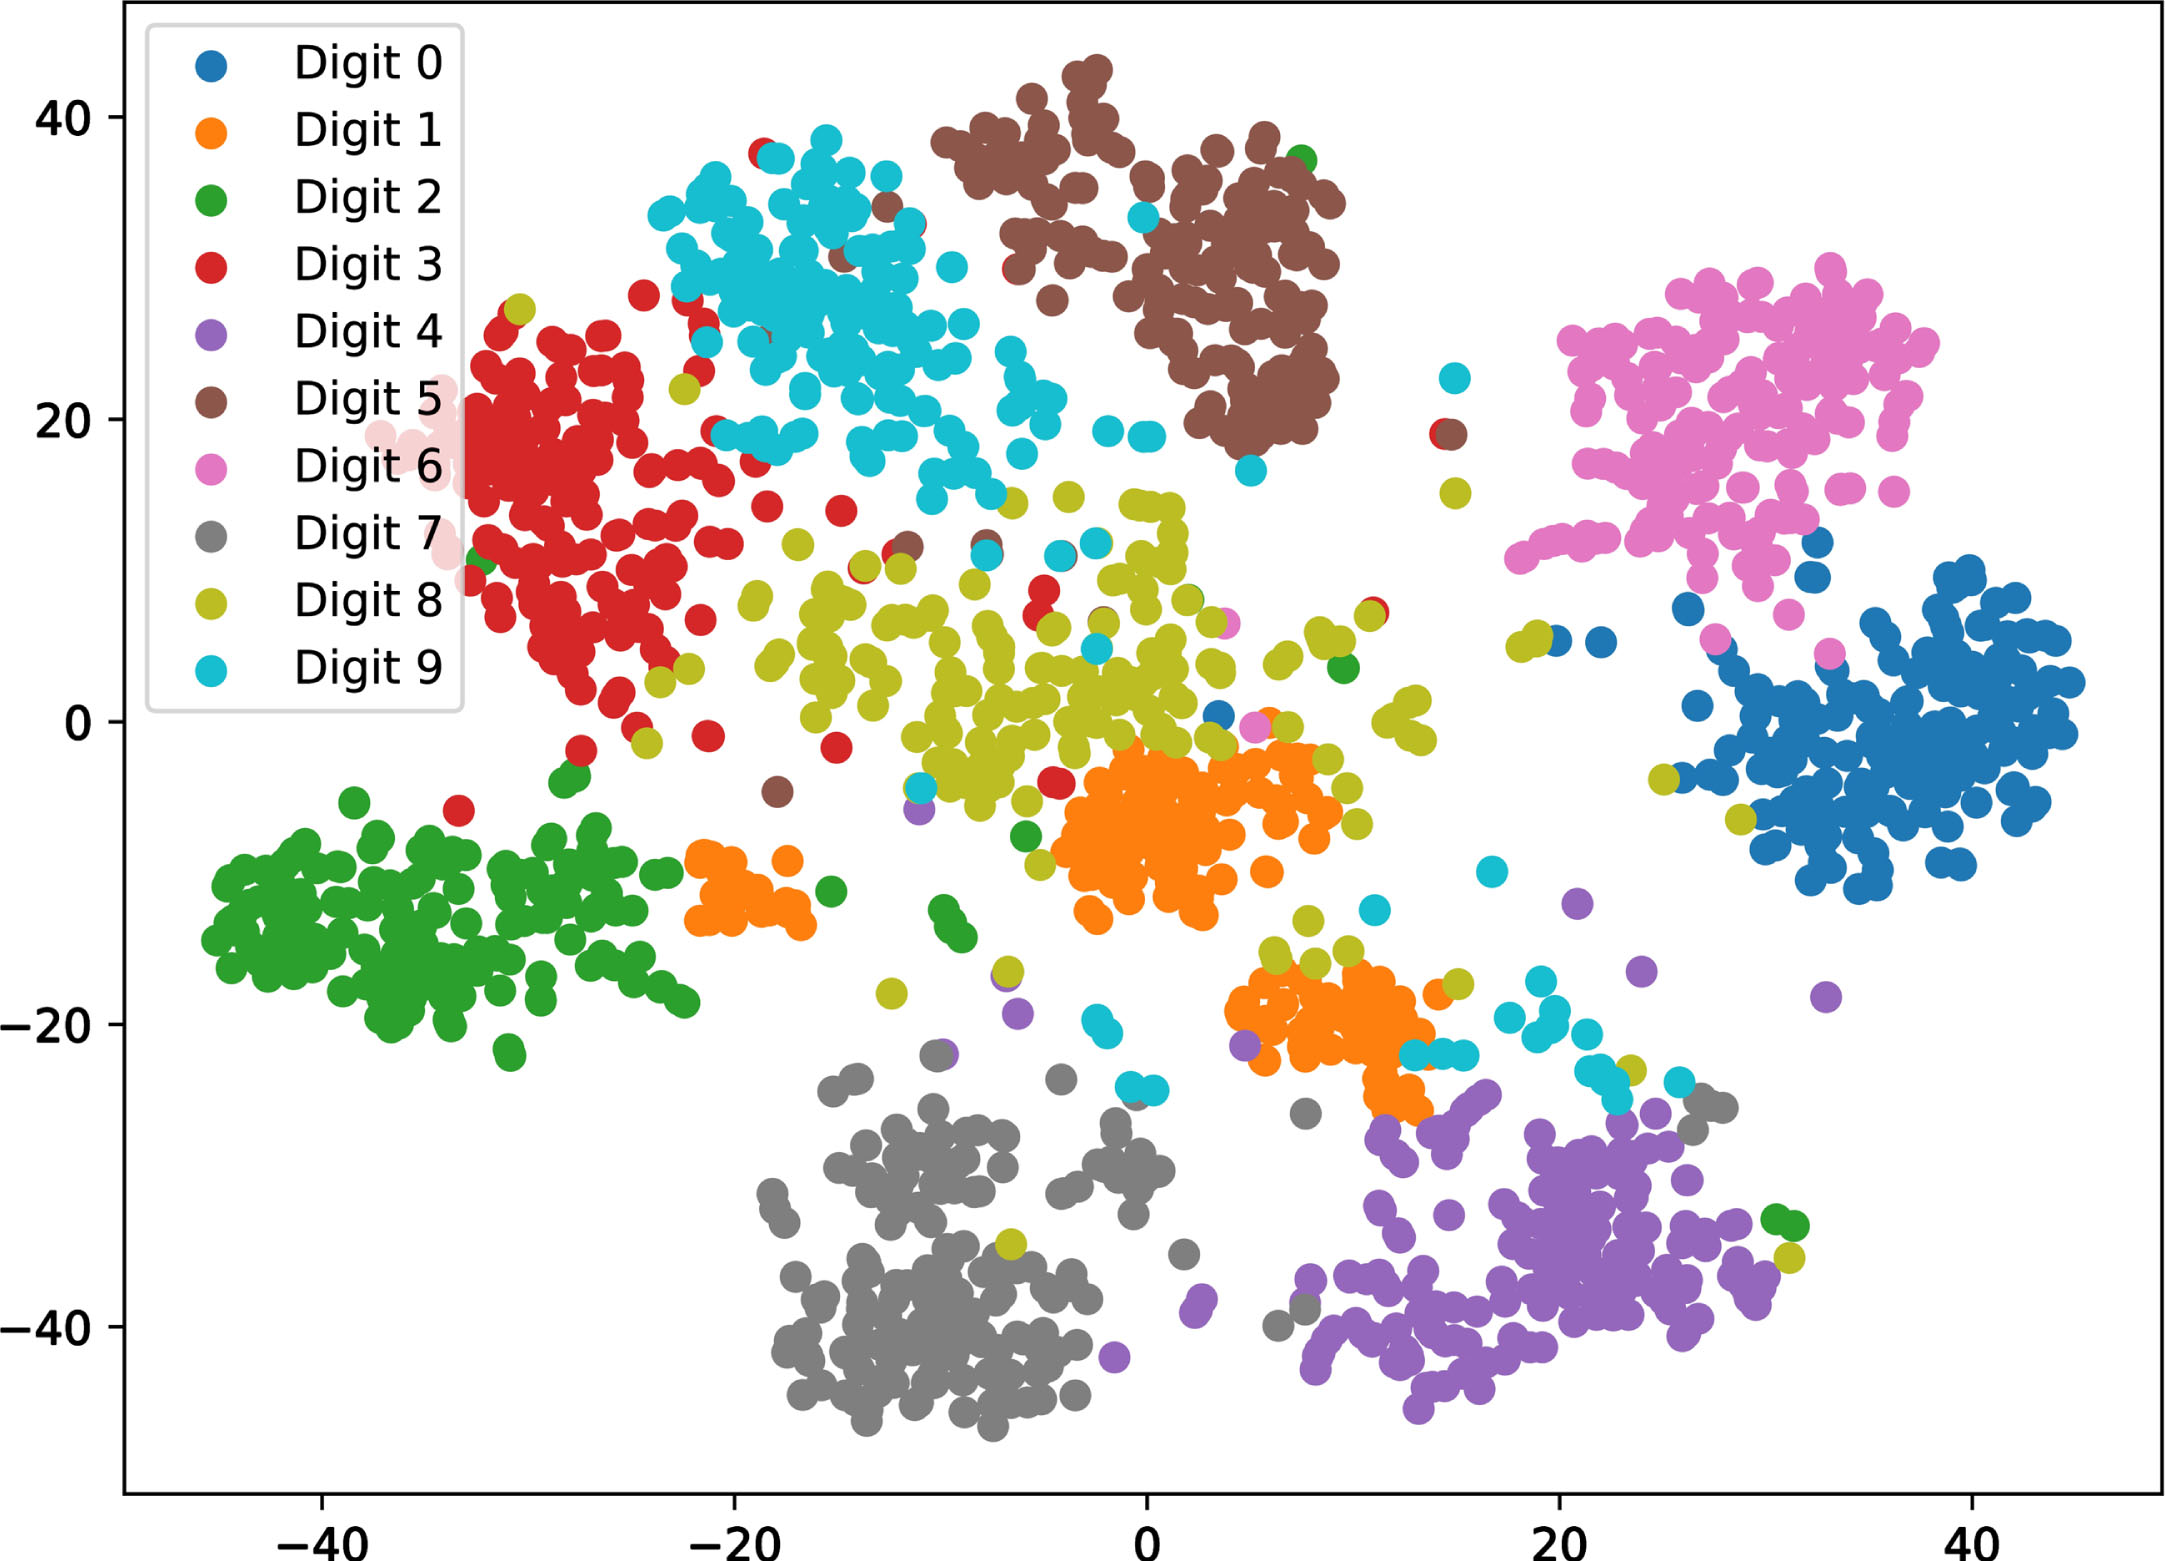
t-SNE plot curve.
Accuracy
The accuracy of the input data is calculated using,
TP- True Positive Value TN- True Negative Value FP- False Positive Value FN- False Negative Value
The above-mentioned graph clearly explains the accuracy of the proposed system. From Fig. 7, the number of classes is increased from 0 to 15 and the accuracy of the proposed system is also increased. The proposed system used a scrumptious integrant wrenching in which the convolution layer was used to extract all the features from the input Pol-SAR images. The max-pooling layer then reduces the spatial size of the convolved features and isolates the rotational and positional invariant prominent features of the Pol-SAR image, ensuring that the model is properly trained. Therefore, the proposed scrumptious integrant wrenching method successfully extracts the feature from the input image even if it has a complicated spatial structure thereby the accuracy of the proposed system increased.
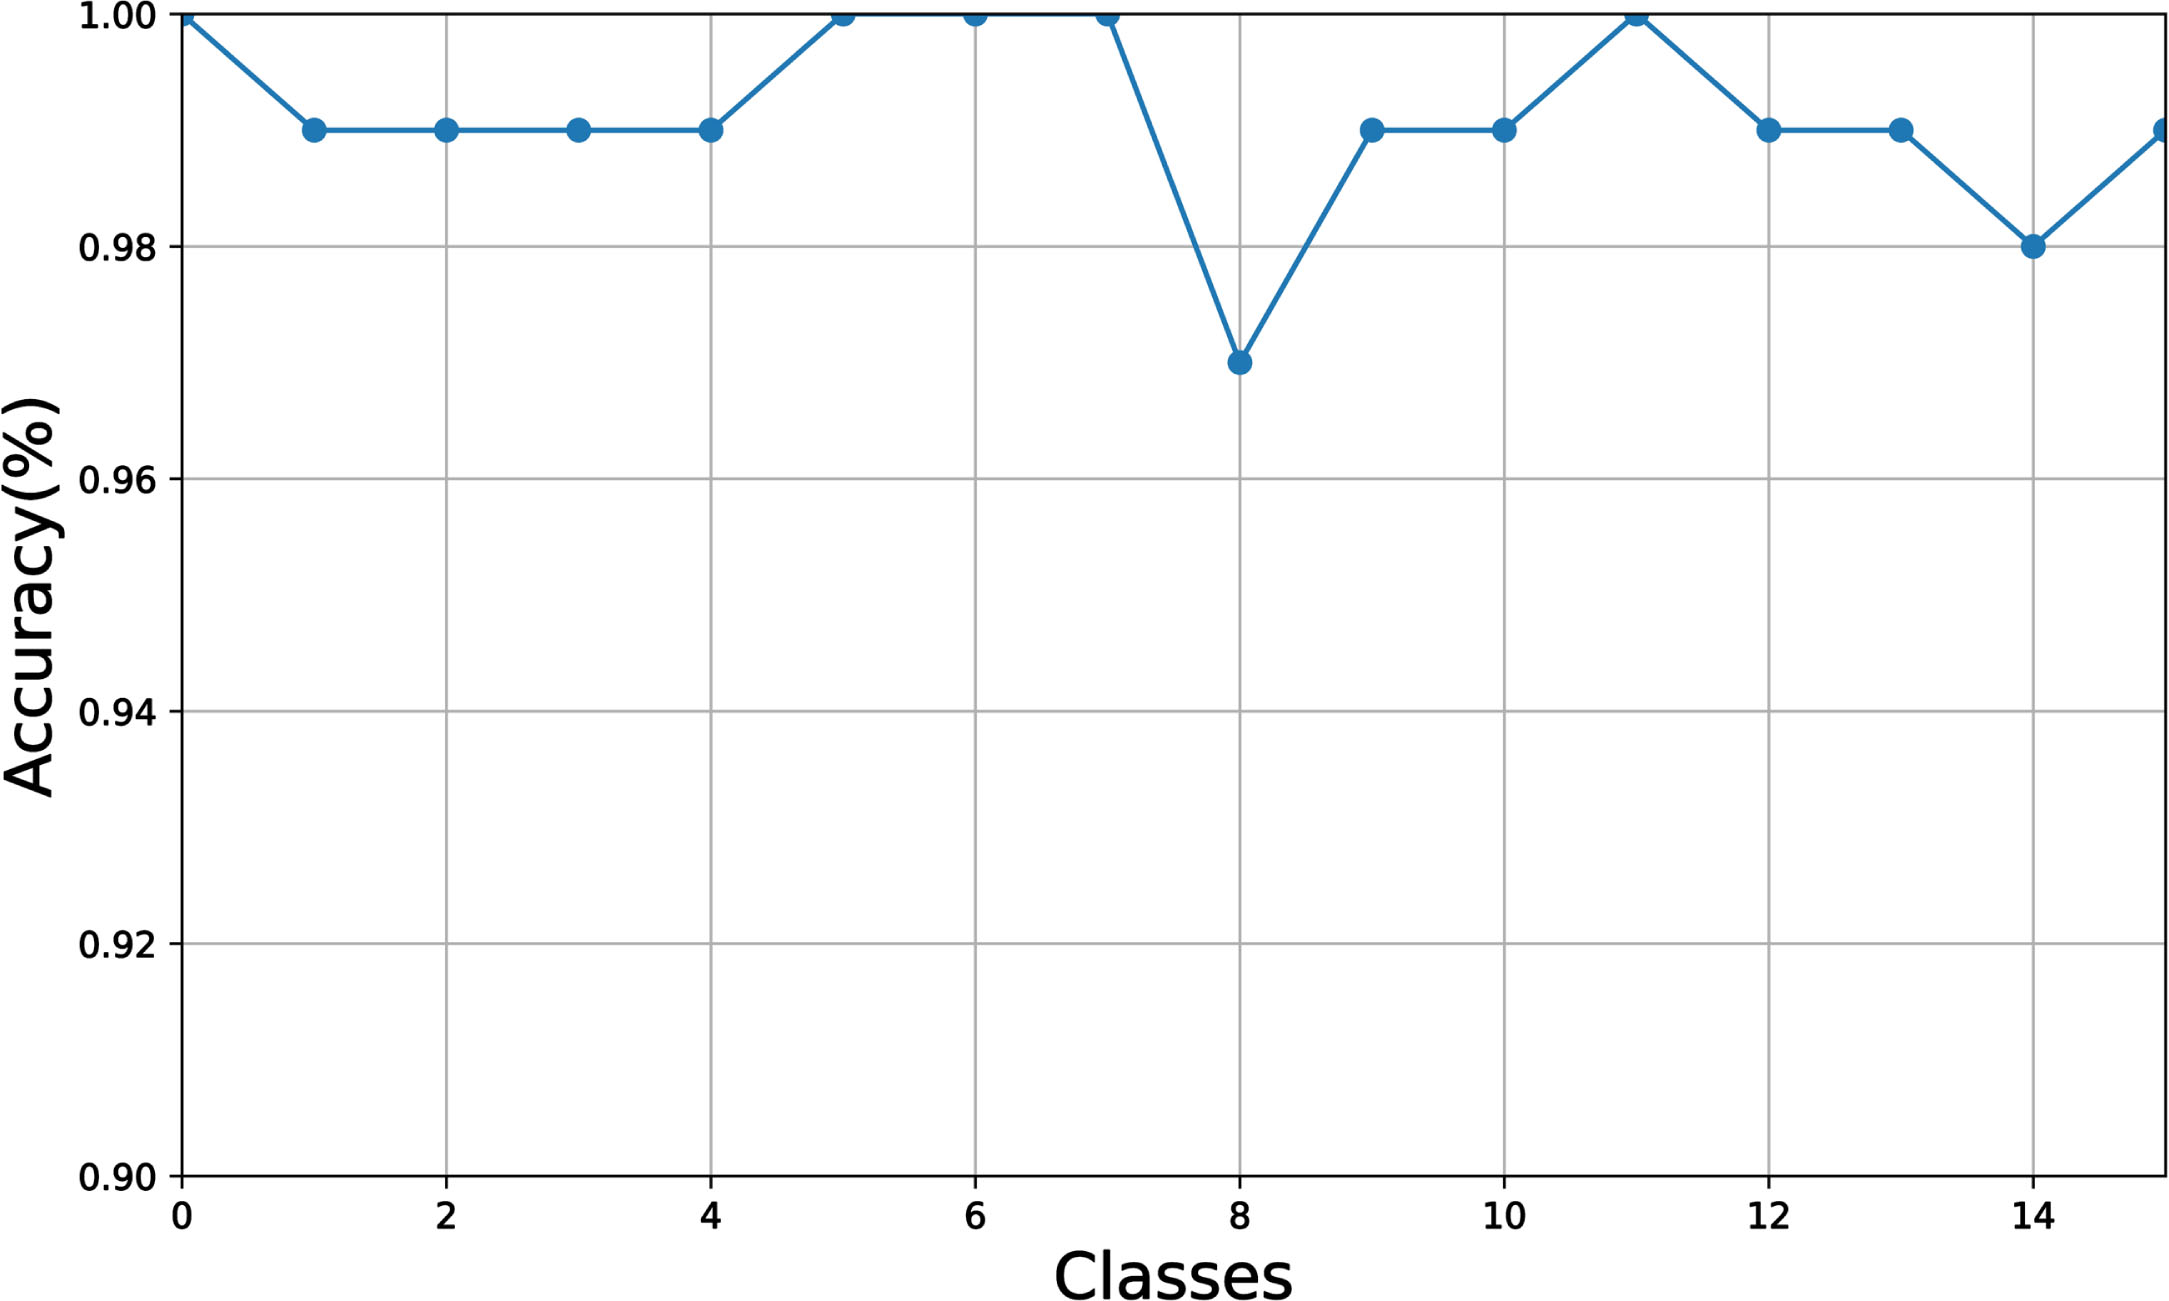
Accuracy of the proposed system.
The precision of the input data is calculated using,
TP- True Positive Value FP- False Positive Value
The precision of the proposed system is shown in Fig. 8. It clearly shows the precision of the proposed system is increased when the number of classes is increasing. The proposed episodical proximity selection improves the precision of the proposed system by reducing the number of input features. Because a large number of input features degrade system performance, the principal component analysis is used for dimensionality reduction and selecting the best features from the extracted features in which the PCA increase the classification accuracy and reduces the processing time, thereby improving the precision of the proposed system.
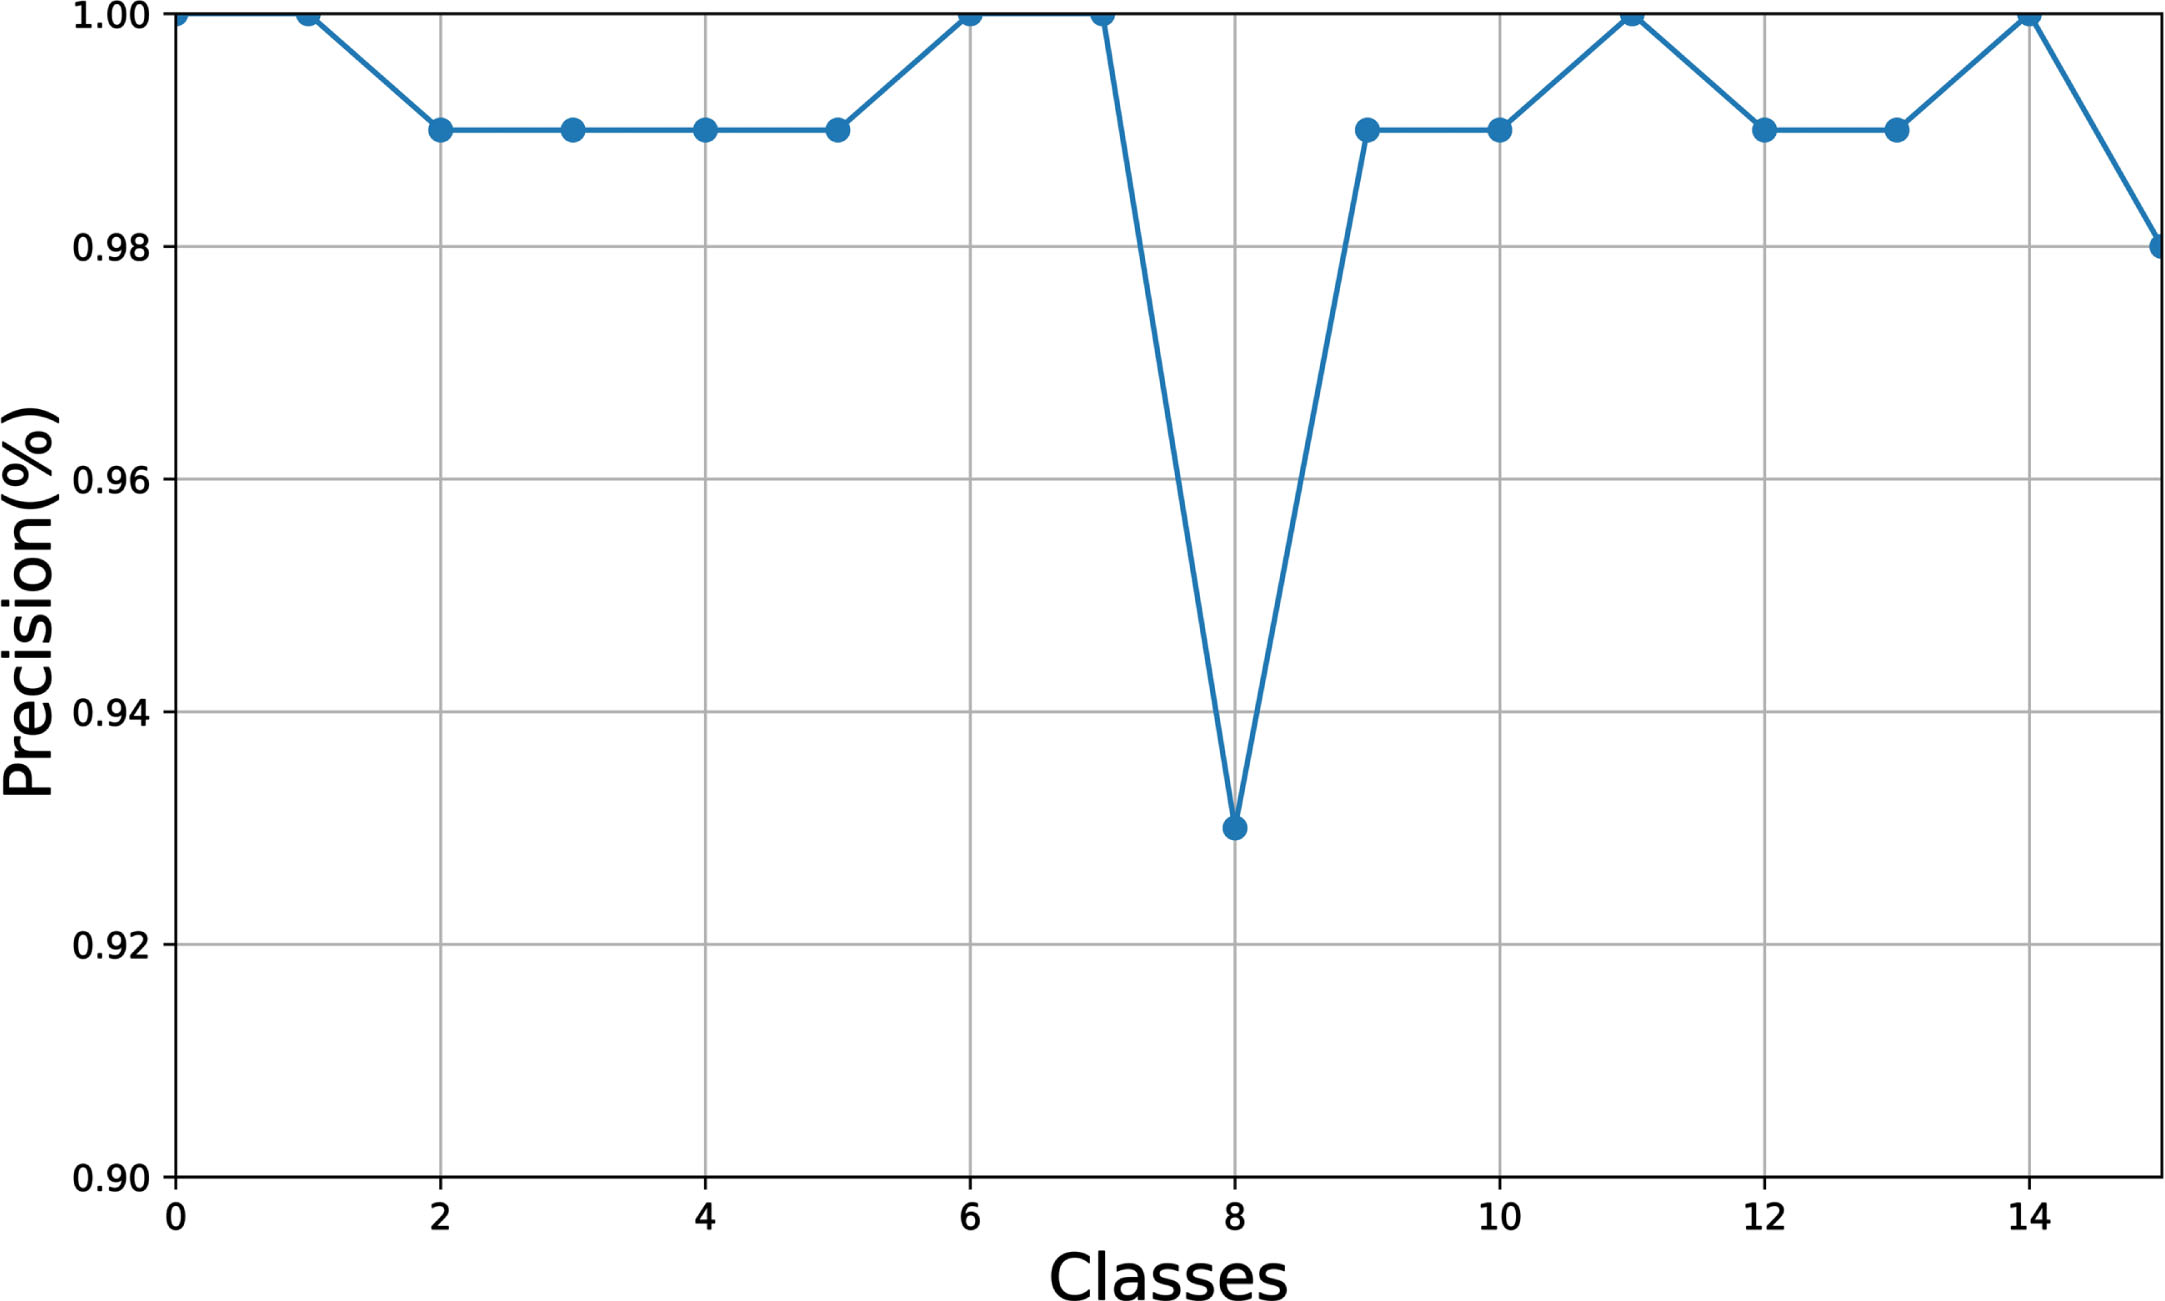
Precision of the proposed system.
The recall of the input data is calculated using,
TP- True Positive Value TN- True Negative Value
Figure 9, clearly explains the recall of the proposed system. The number of classes is increasing from 0 to 15 as well as the recall of the proposed system is also increasing. Multifarious stratification stratagem used an elastic net classifier to efficiently classify the features from the input Pol-SAR image. Furthermore, the composite kernel is interpreted using an elastic net classifier, therefore it significantly improves the classification of the proposed system thereby the recall of the proposed system increased.
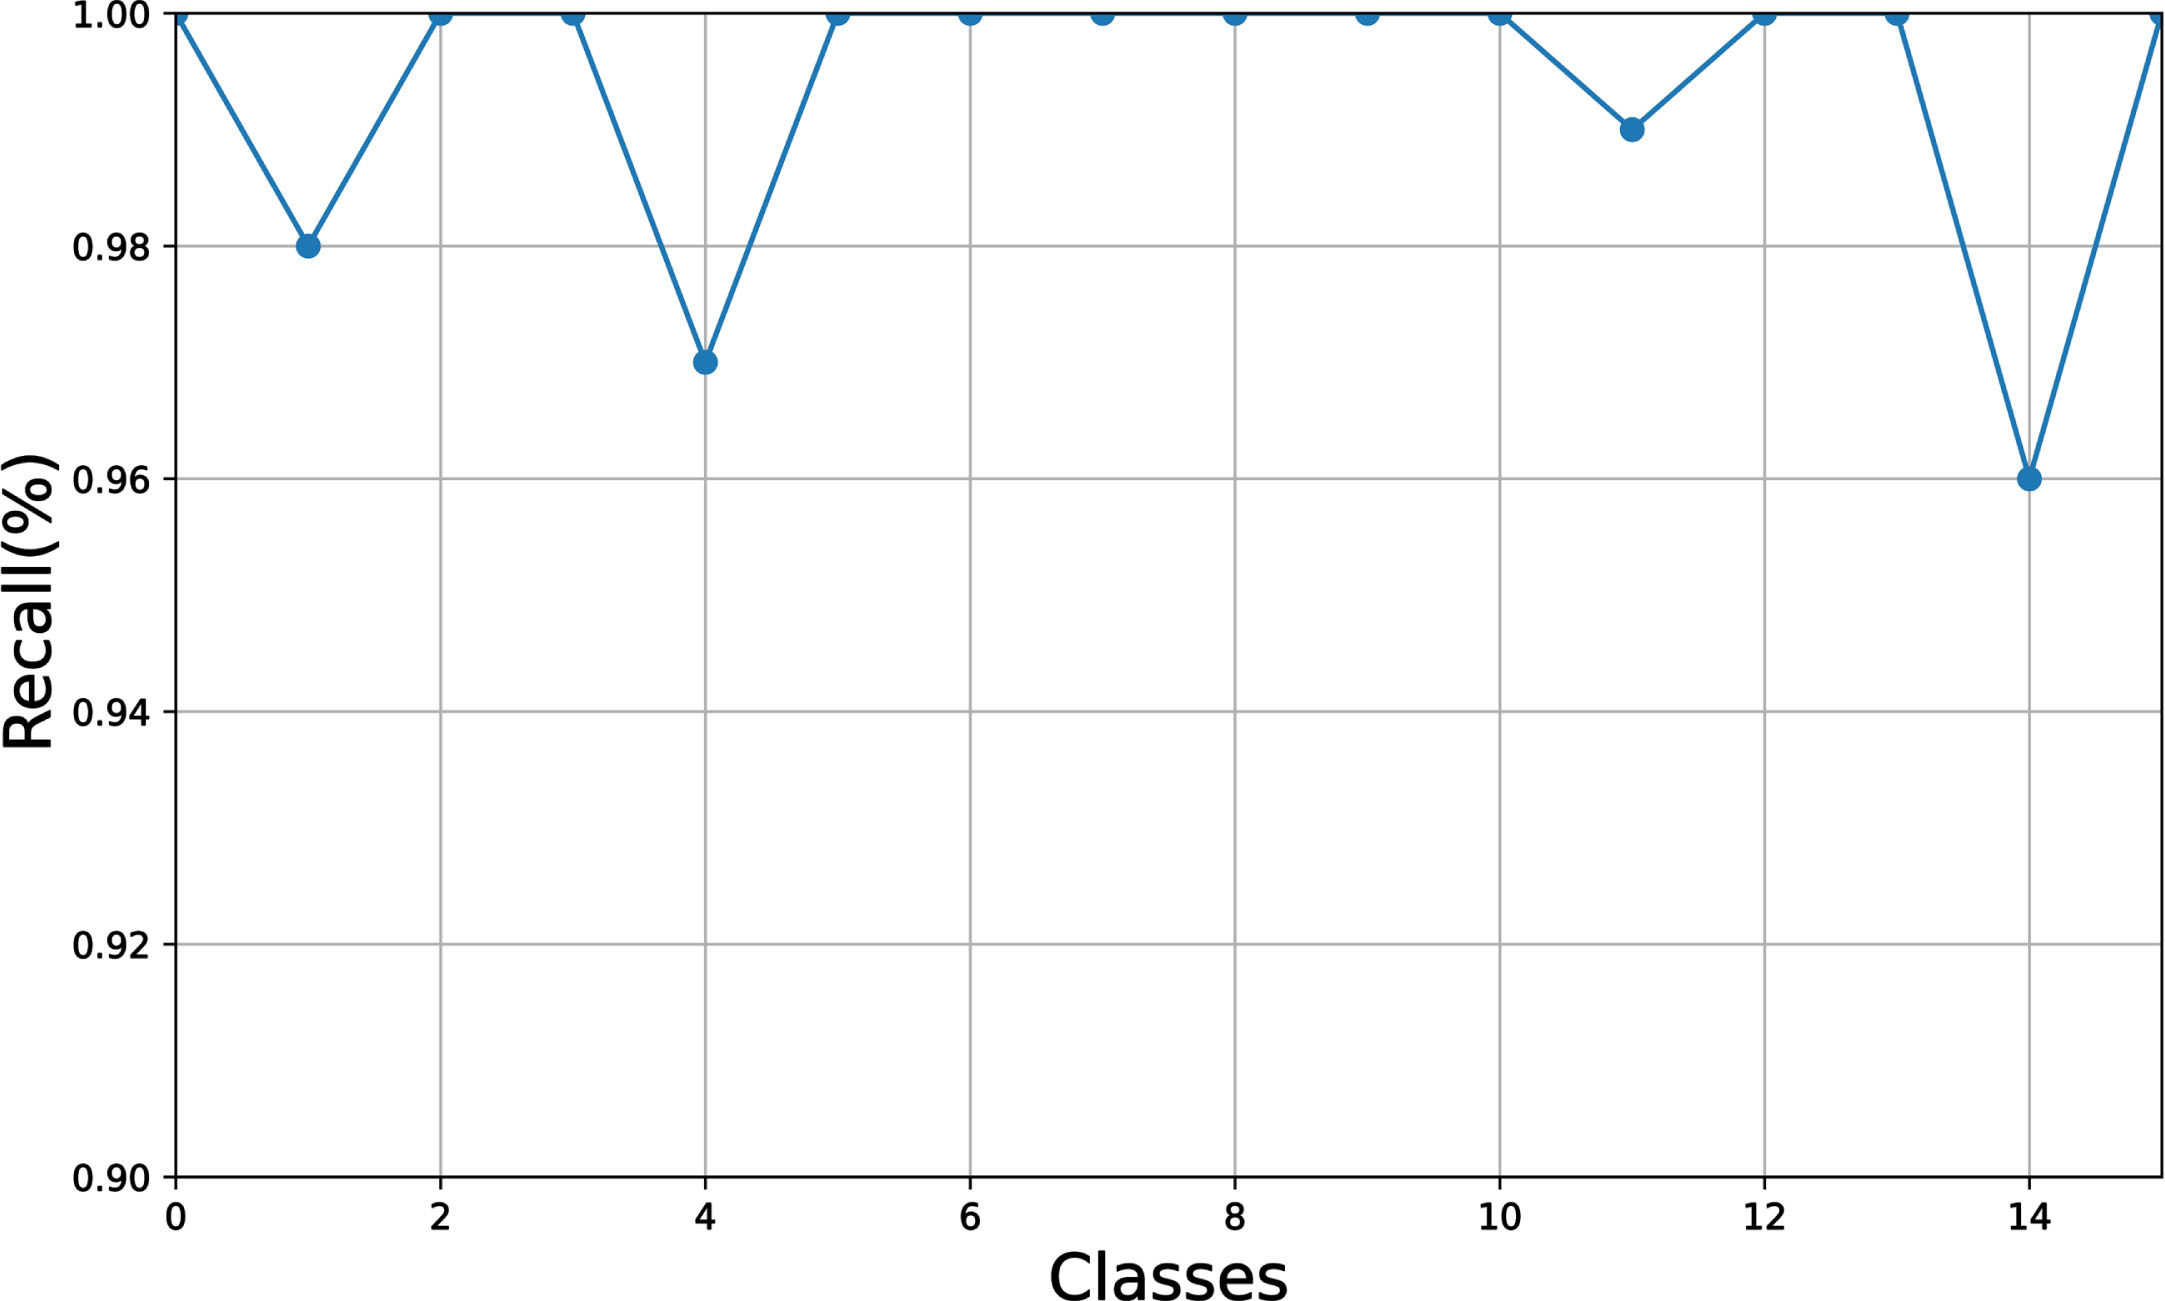
Recall of the proposed system.
The F1-Score of the input data is calculated using,
Figure 10, clearly shows the f1 score of the proposed system is increased when the number of classes is increasing. From the graph, the number of classes increased as well and the proposed system f1 score also increased. A multifarious stratification strategy efficiently classifies the input Pol-SAR image thereby accurately classifying the input image therefore the misclassification is reduced and the f1 score of the proposed system is increased.
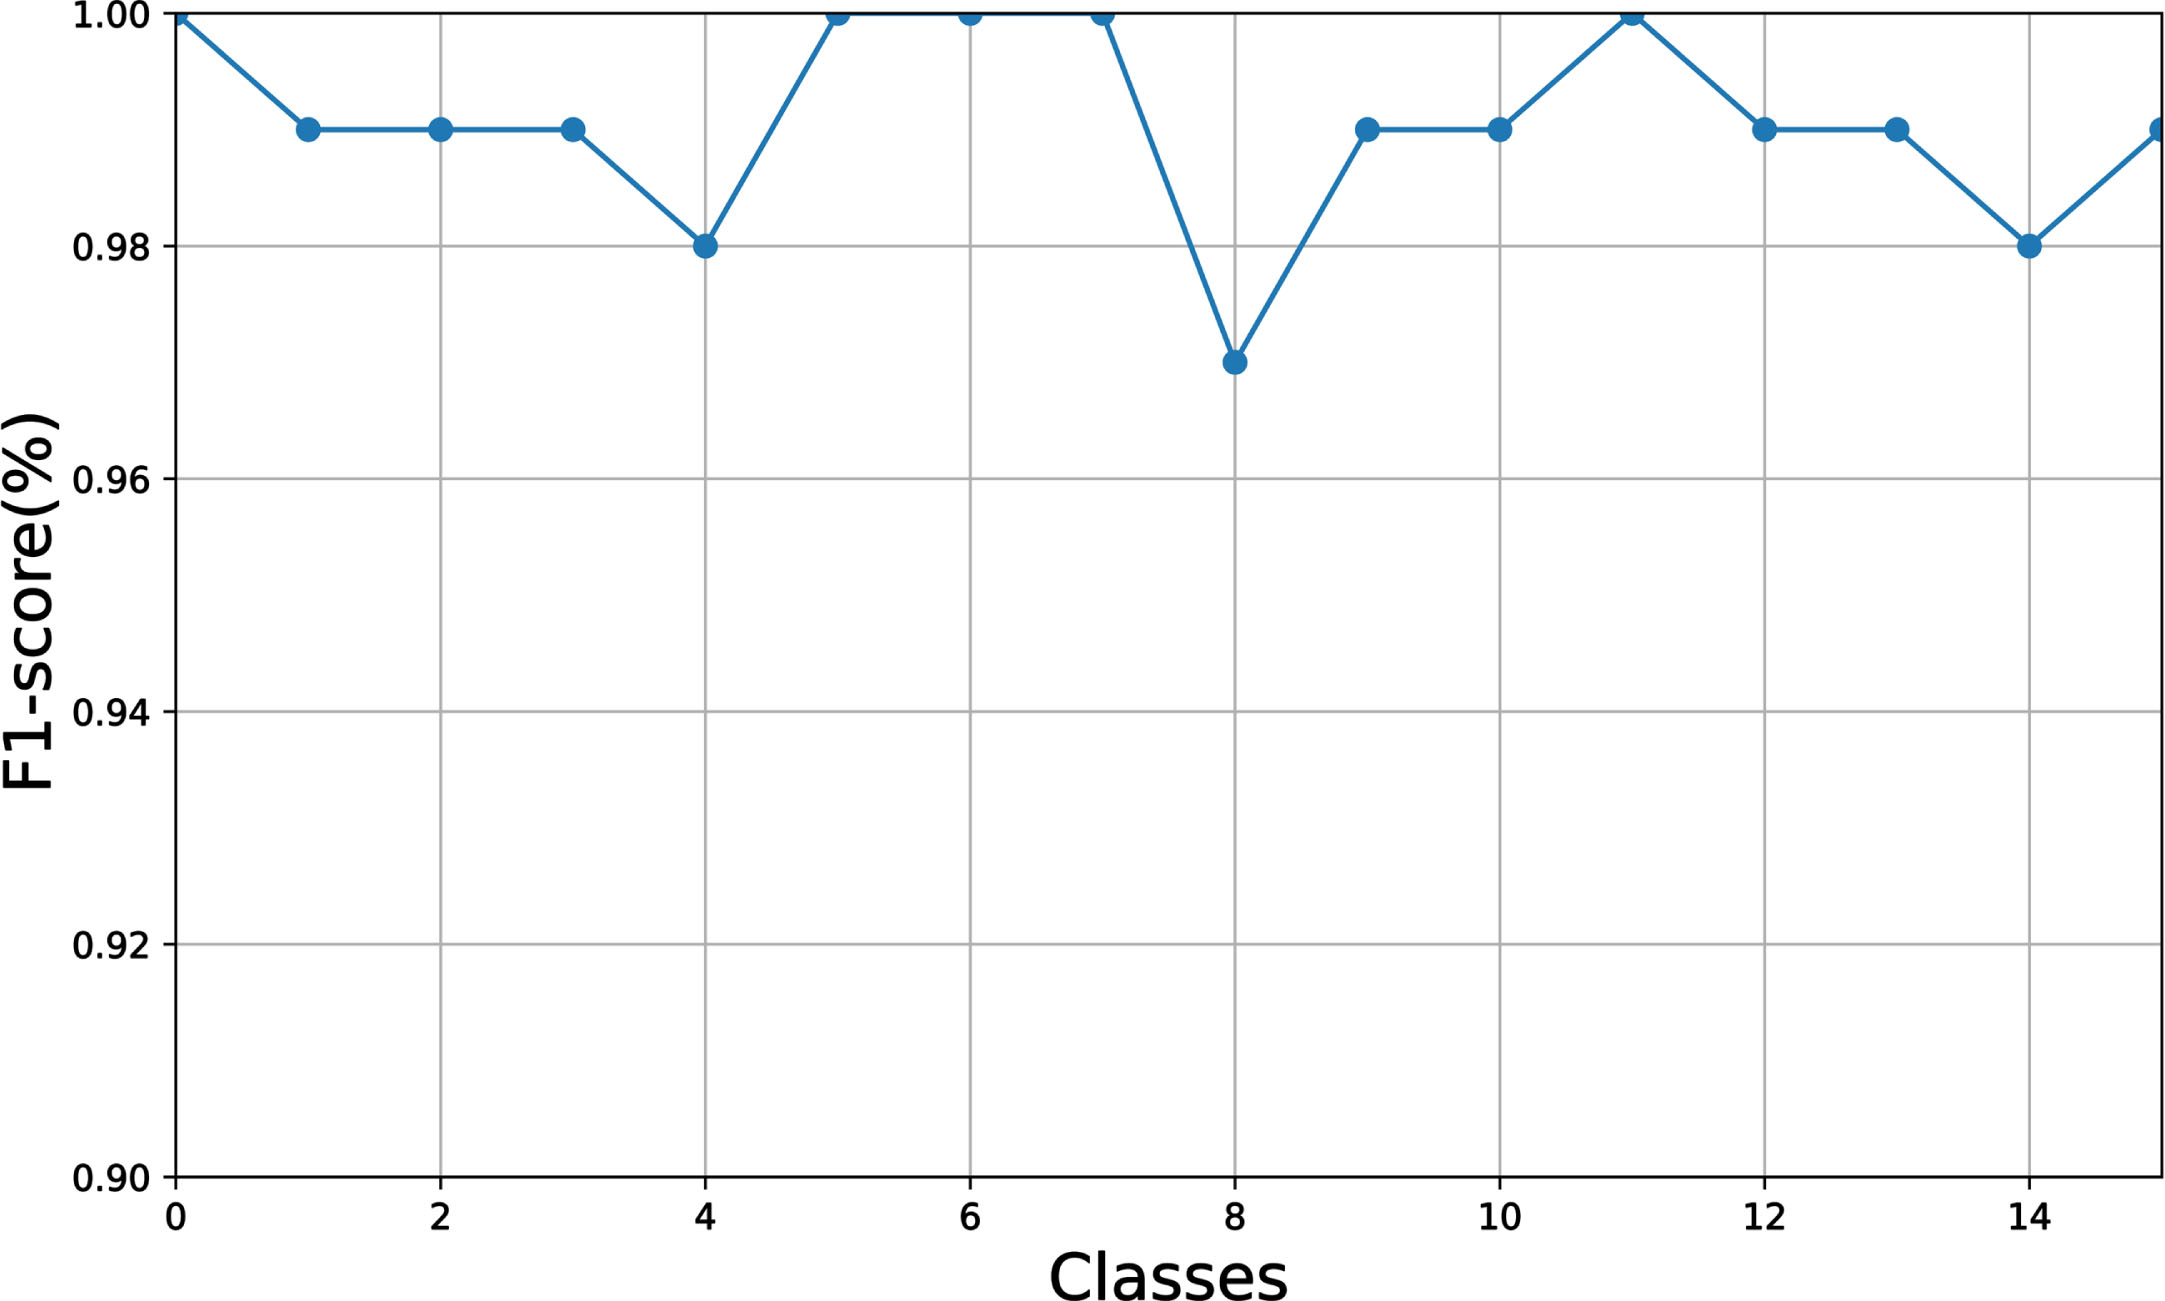
F1 score of the proposed system.

Accuracy comparison of the proposed system.
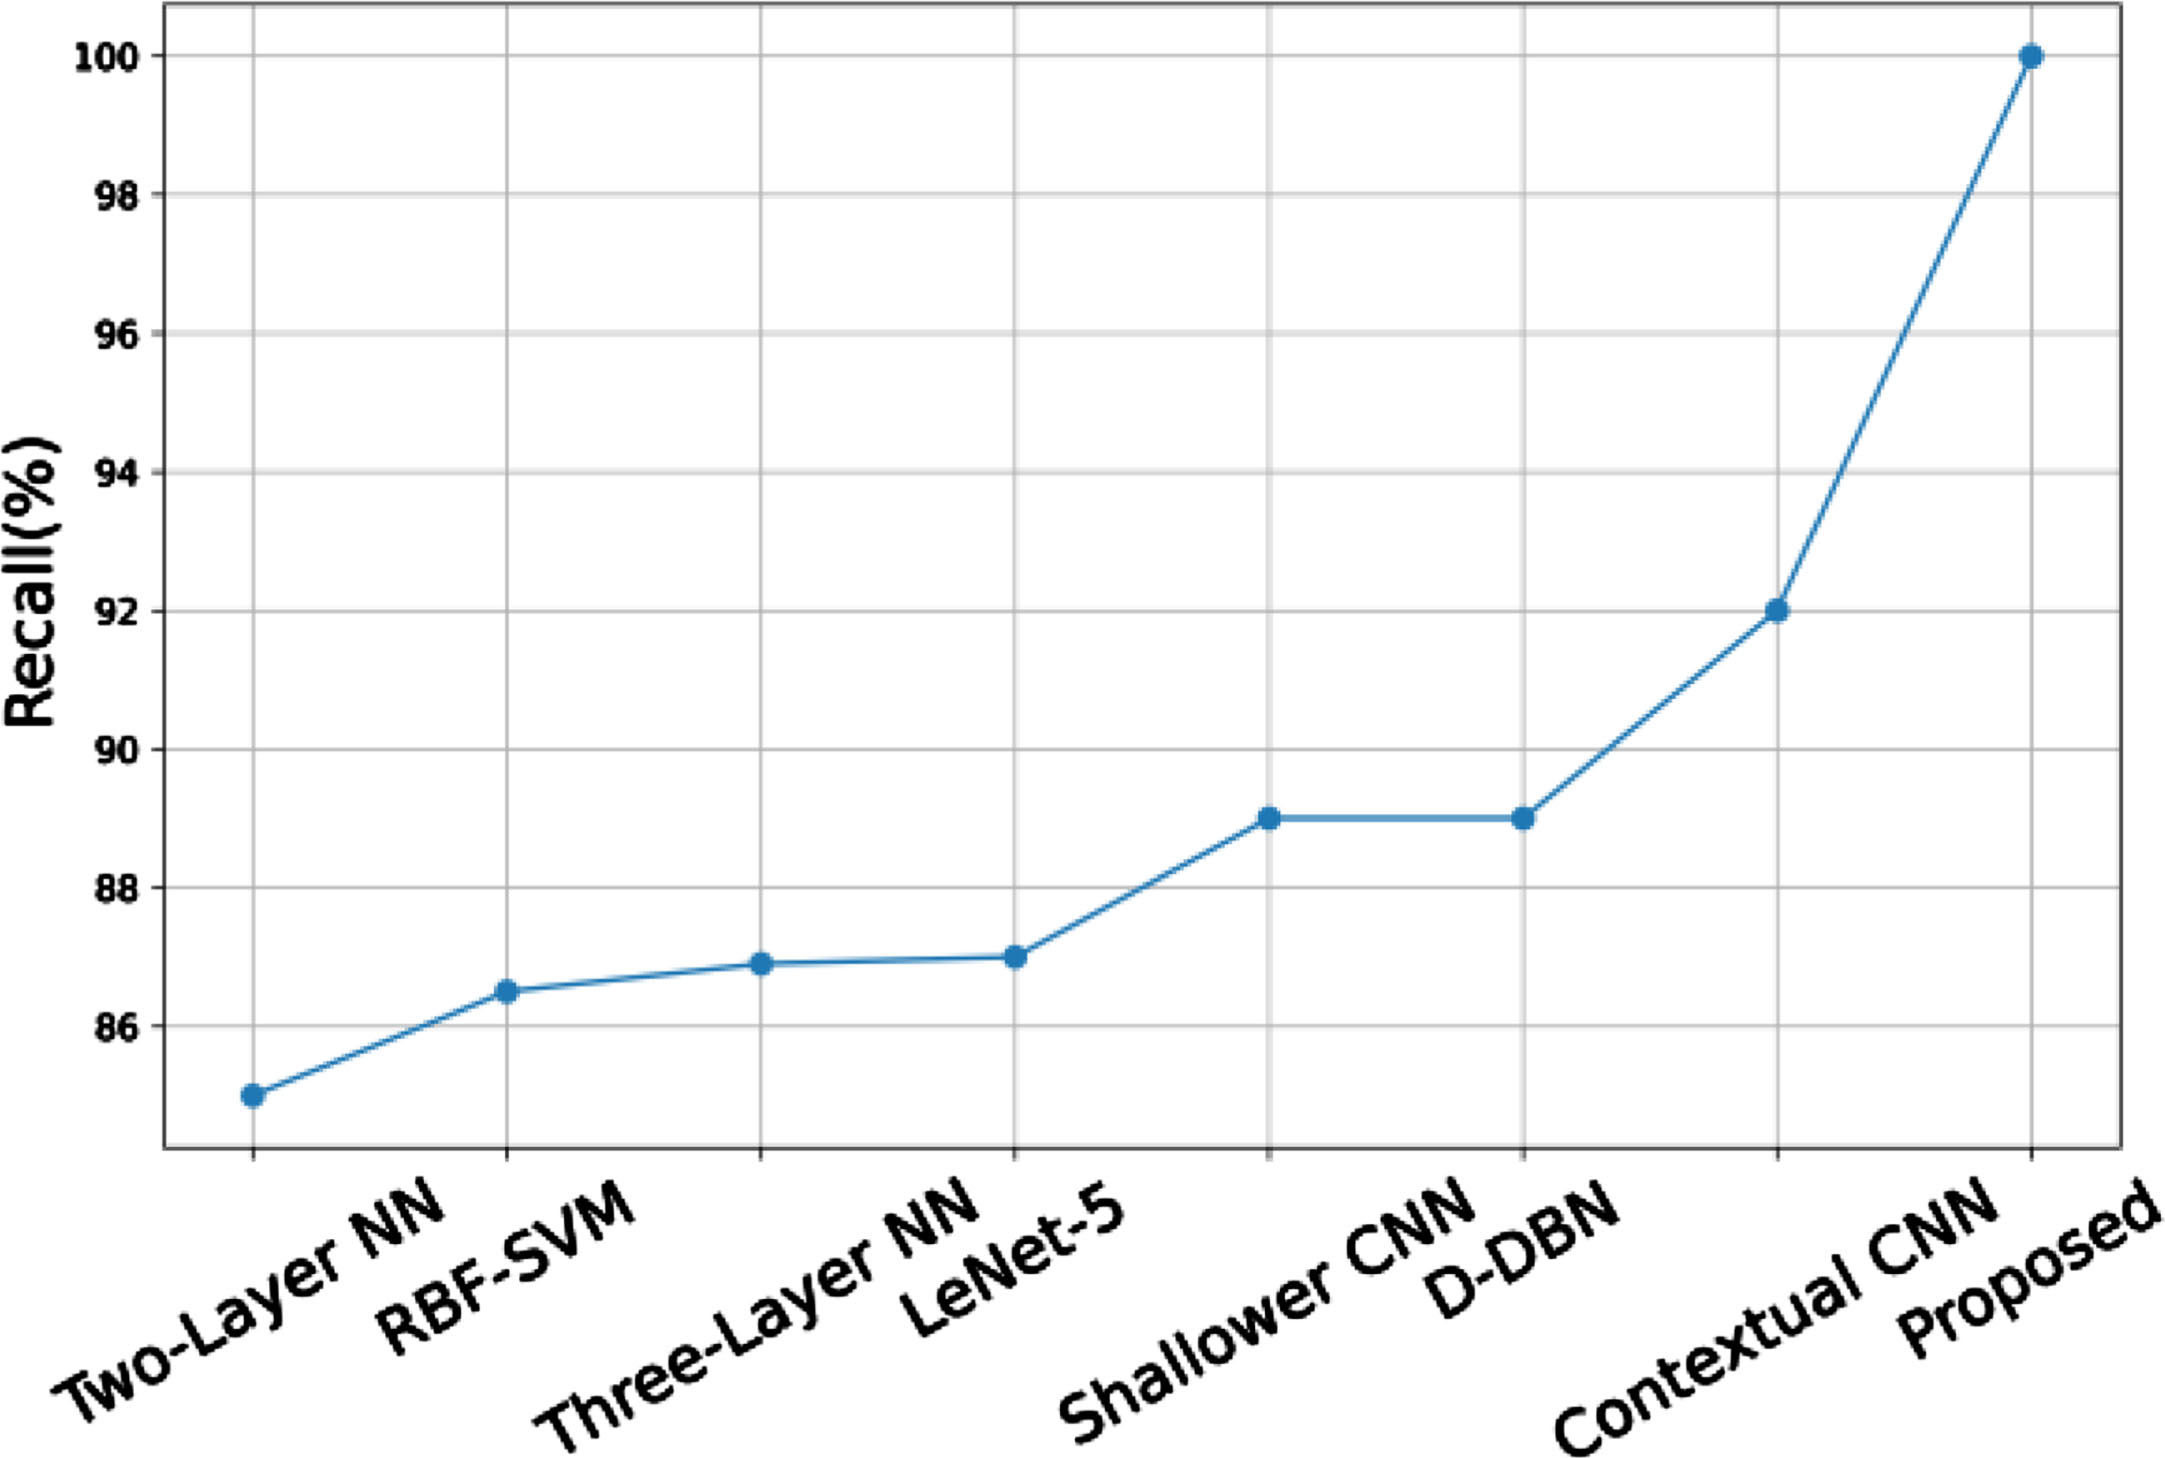
Recall comparison of the proposed system.
This section describes various performances of the proposed method compared with the results of previous methodologies and depicts their results based on various metrics.
From graph 11, it is clear that the accuracy of the proposed system is high that is 99.69% when compared with the existing output accuracy of two-layer NN [24] which is 86.33%, RBF-SVM [22] is 87.95%, three-layer NN [24] is 88%, LeNet-5 [23] which is 88.12%, shallower CNN [25] is 90%, D-DBN [25] is 91%, and contextual CNN [25] is 94.12%, and from the conclusion, it is noted that two-layer NN has the lowest accuracy whereas our proposed system has the highest accuracy.
The proposed recall is 98.99%, the existing system recall of two-layer NN [24] is 85%, RBF-SVM [22] is 86.12%, three-layer NN [24] is 86.95%, LeNet-5 [23] which is 87%, shallower CNN [25] is 89%, D-DBN [25] is 89%, and contextual CNN [25] which is 92% and from the conclusion, it is noted that two-layer NN has the lowest recall whereas our proposed system has the highest recall. When a recall is compared to the existing systems such as two-layer NN, RBF-SVM, three-layer NN, LeNet-5, shallower CNN, D-DBN, and contextual CNN the proposed system recall is higher than the existing systems.
From the graph, it is clear that the precision of the proposed system is 98.99%. In Fig. 13, the precision of two-layer NN [24] is 86.12%, RBF-SVM [22] is 87.88%, three-layer NN [24] is 87.97%, LeNet-5 [23] which is 88%, shallower CNN [25] is 90%, D-DBN [25] is 90%, and contextual CNN [25] which is 93.88% and from the conclusion, it is noted that two-layer NN has the lowest precision whereas our proposed system has the highest precision.
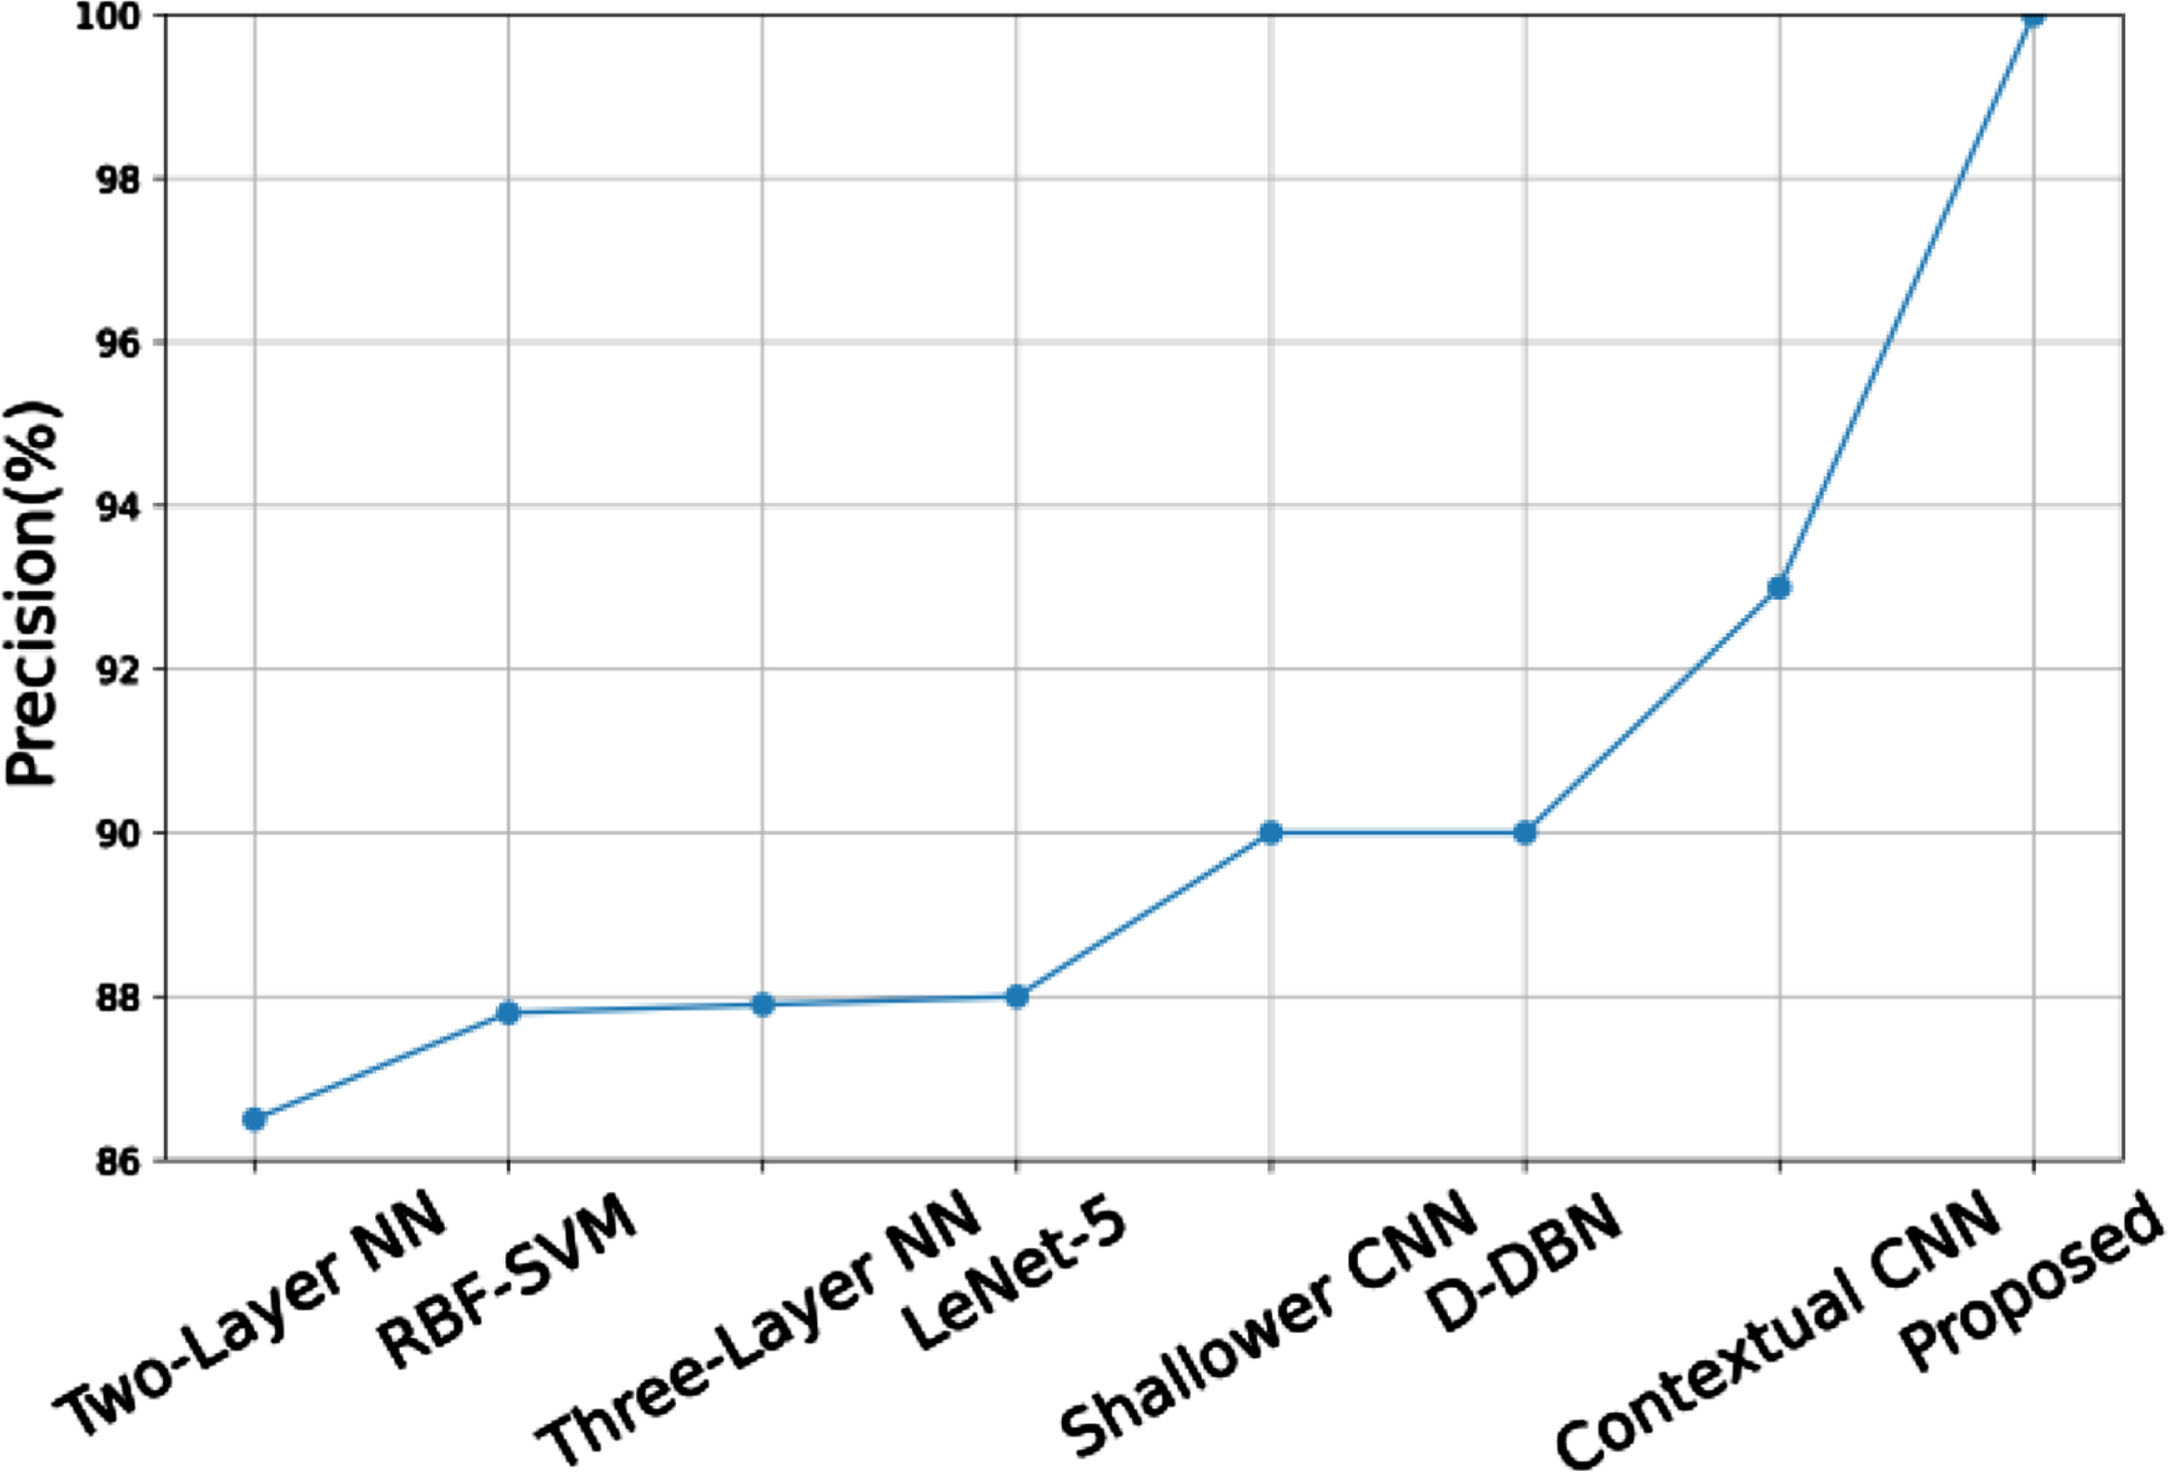
Precision comparison of the proposed system.
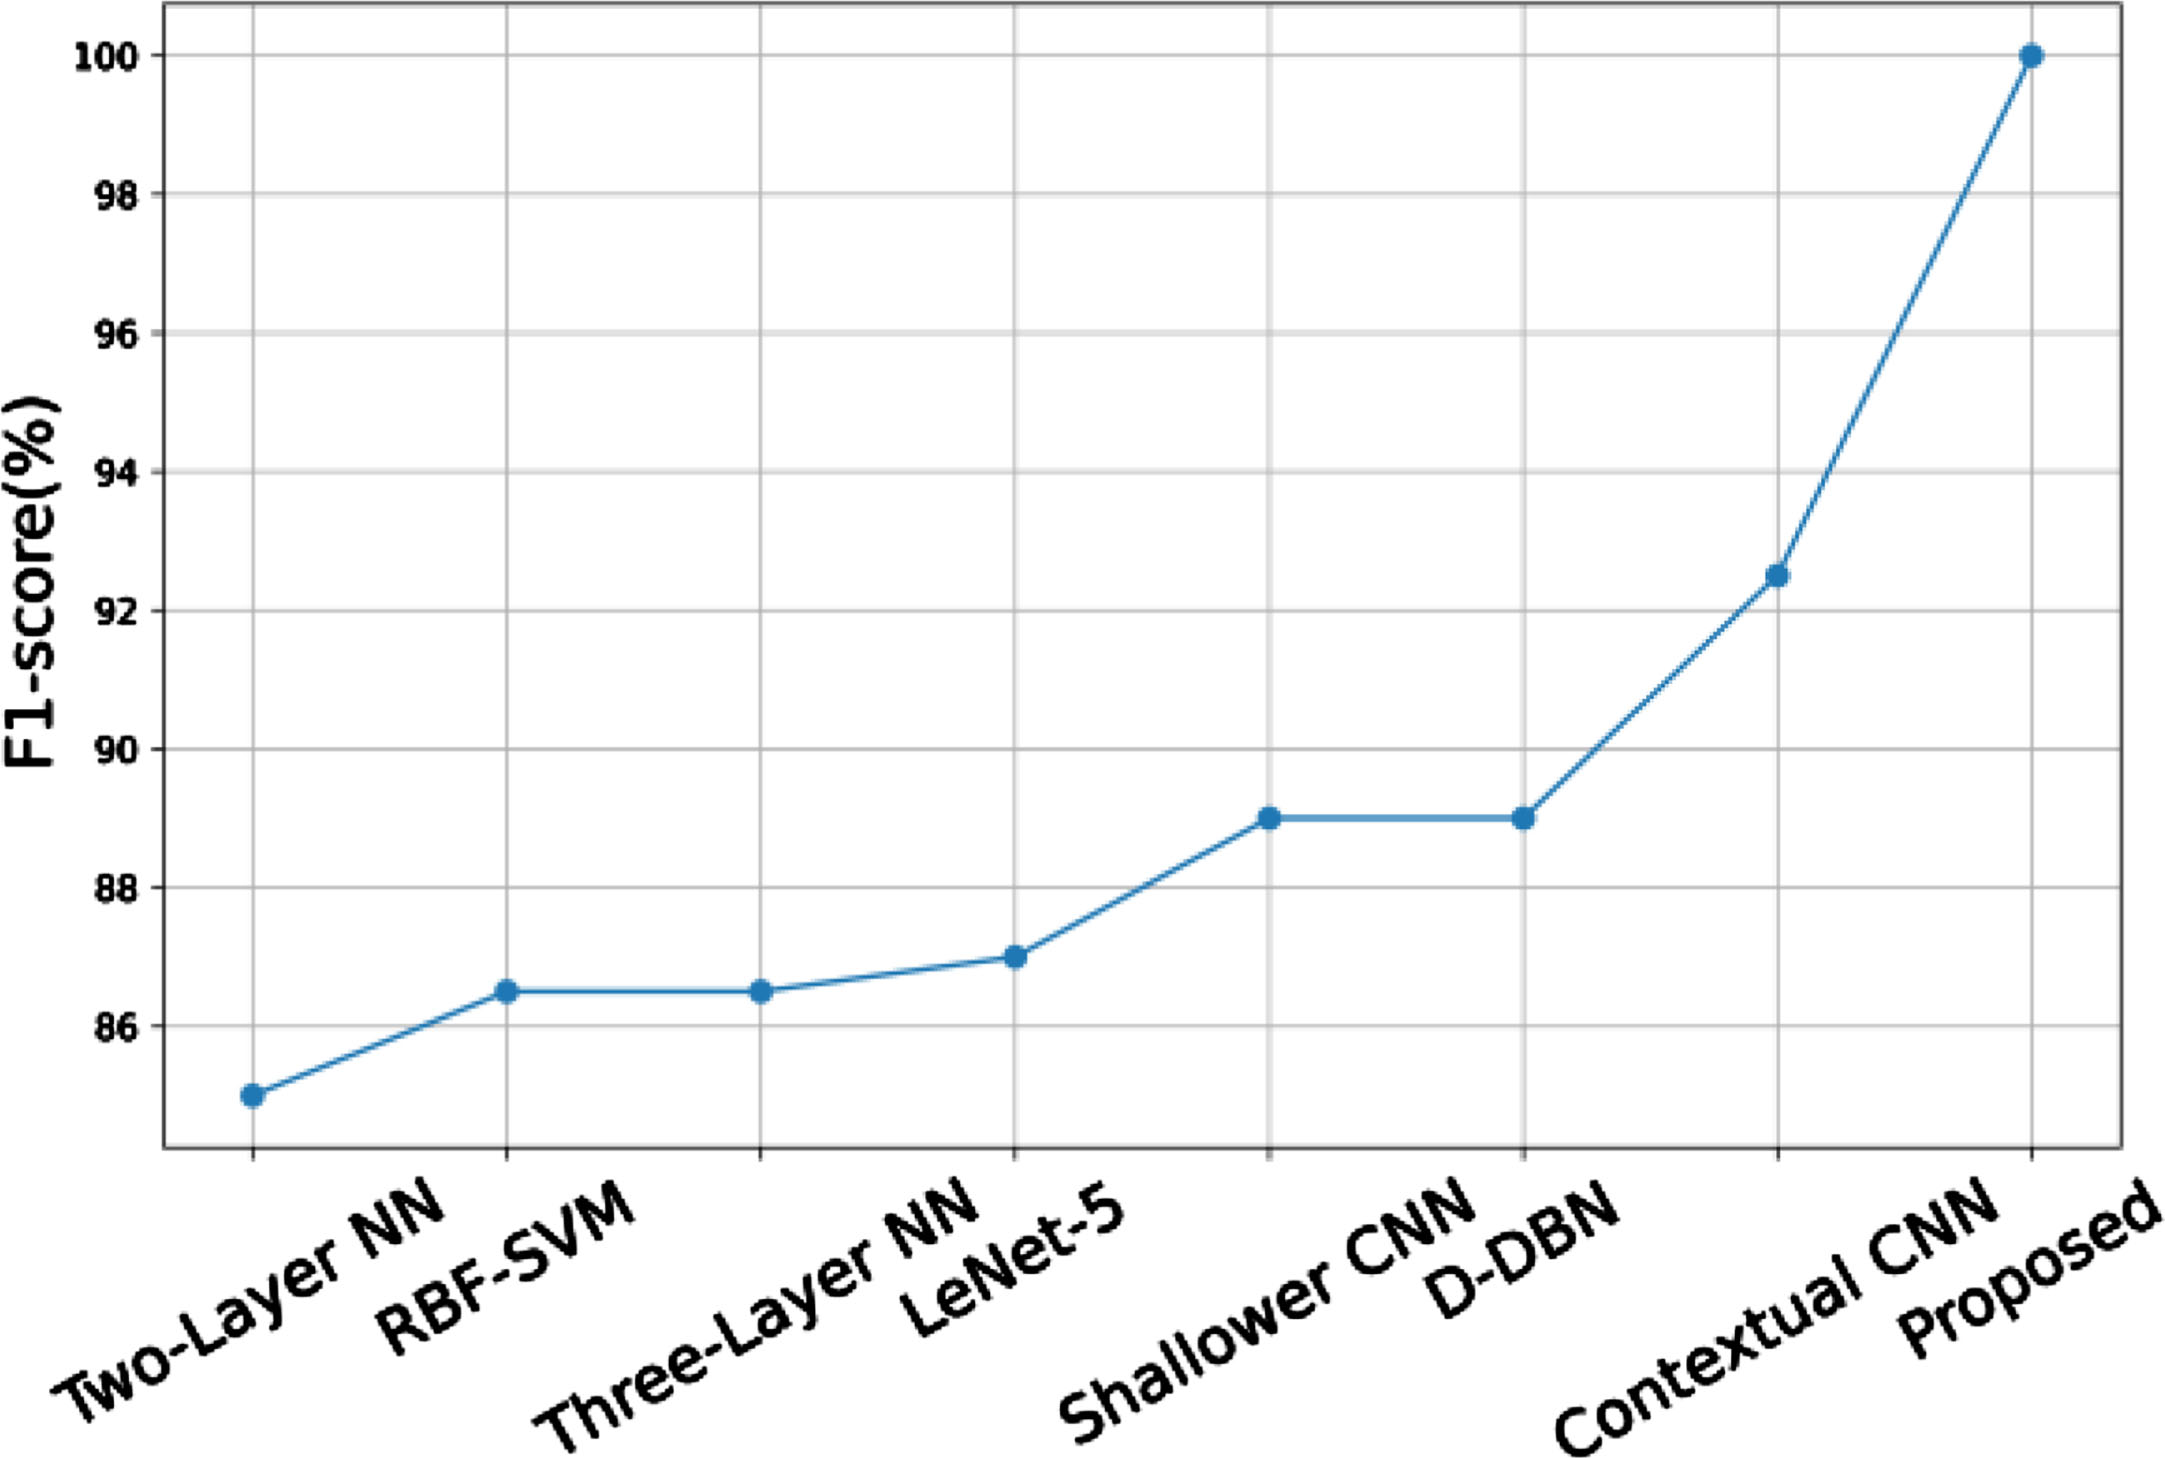
F1 score comparison of the proposed system.

Accuracy comparison of the dataset.

Recall comparison of the dataset.
The proposed f1 score is 98.98 percent, compared to the existing recall of two-layer NN [24] which is 85 percent, RBF-SVM [22] which is 86.12 percent, three-layer NN [24] which is 86.34 percent, LeNet-5 [23] which is 87 percent, shallower CNN [25] which is 89 percent, D-DBN [25] which is 89 percent, and contextual CNN [25] which is 92 percent. When comparing the proposed system’s f1 score to existing systems like two-layer NN, RBF-SVM, three-layer NN, LeNet-5, shallower CNN, D-DBN, and contextual CNN, the proposed system’s f1 score is higher.
From bar graph 15, it is clear that the accuracy of the dataset is 99.69% when compared with the accuracy of salinas [27], which is 99.68%, Pavia [26] is 99.67%, Kennedy space center [28] is 99.65%, and Botswana [29] that is 99.62%.
When comparing the recall of salinas [27], which is 98.98%, Pavia [26] is 98.97%, Kennedy space center [28] is 98.96%, and Botswana [29] that is 98.95%, it is obvious that the Indian pines dataset has a recall of 98.99 percent.
Figure 17 show that the Indian pines dataset’s f1 score is 98.98 percent, comparable to 98.97 percent for Salinas [27], 98.96 percent for Pavia [26], 98.96 percent for Kennedy Space Center [28], and 98.95 percent for Botswana [29].
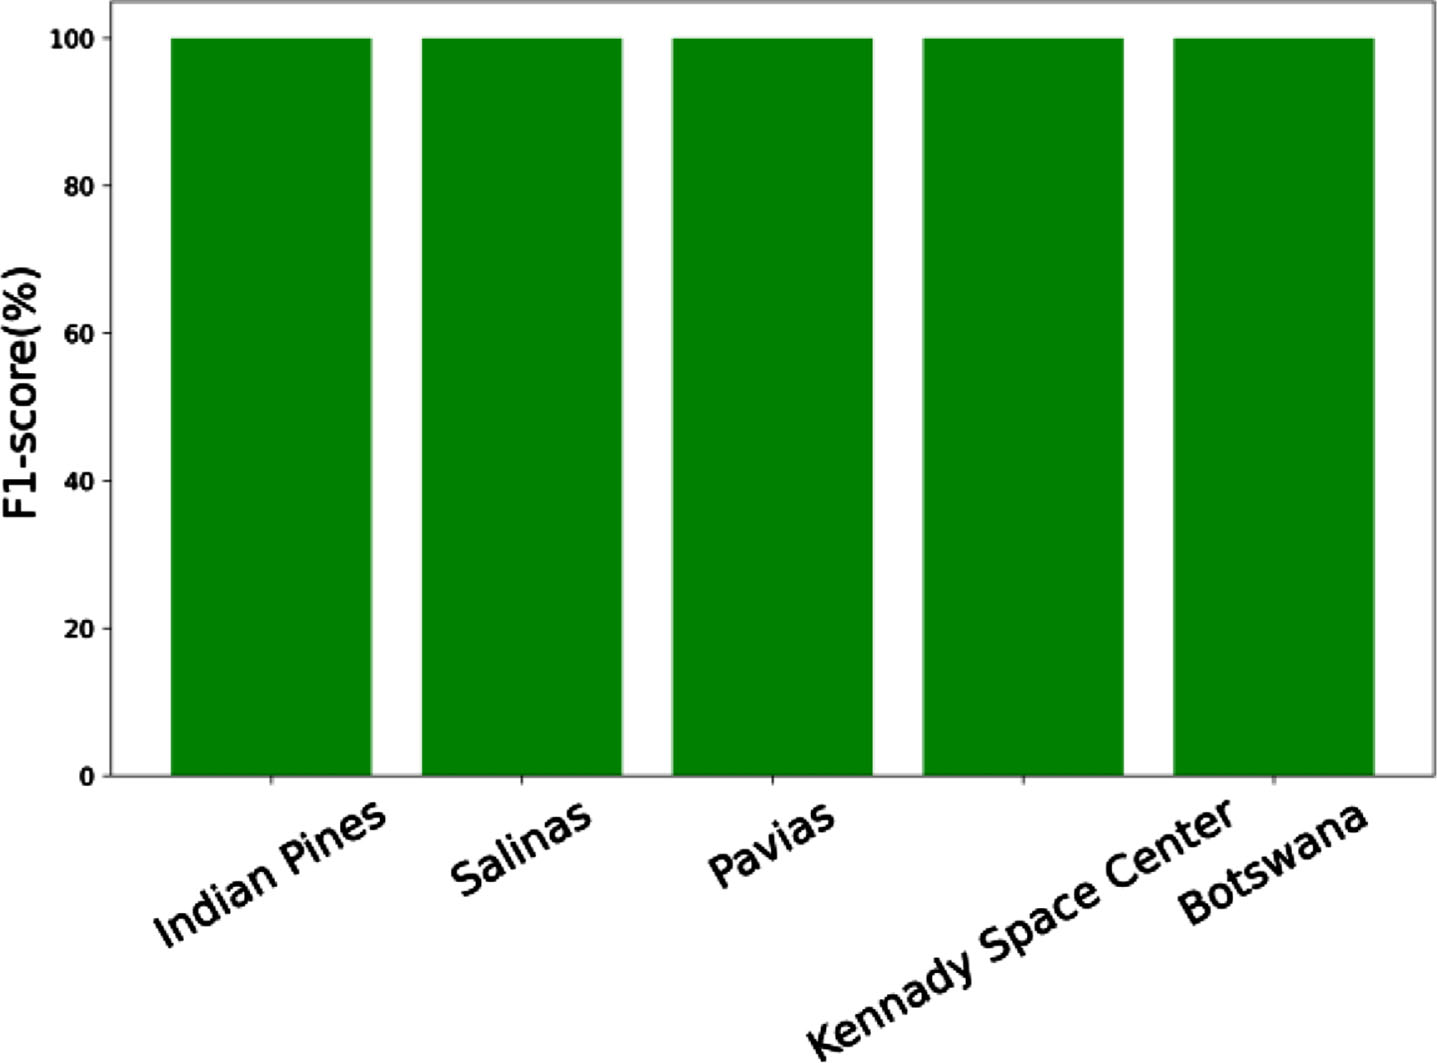
F1 score comparison of the dataset.

Precision comparison of the dataset.
In the above-mentioned bar graph, it is clear that the precision of the dataset is 98.99% when compared with the precision of salinas [27], which is 98.98%, Pavia [26] is 98.97%, Kennedy space center [28] is 98.96%, and Botswana [29] that is 98.95%.
Table 3 displays the comparison of the proposed model with the existing models. The False Positive Rate (FPR) of the proposed system. FPR of the proposed system is compared with existing models including Gaussian Naïve Bayes (GNB), Decision Tree (DT), Random Forest (RF), and XGB. When comparing the existing models with the proposed system, the proposed system achieved 0.12% while the other techniques such as GNB, DT, RF, and XGB attains value of 0.18%, 0.17%, 0.15%, and 0.15%. Here, the proposed model achieves low FPR while the GNB of the existing model attains a high FPR value. The AUC of the proposed system is compared with existing models. When comparing the existing models with the proposed system, the proposed system achieved 95.83% while the other techniques such as GNB, DT, RF, and XGB attains value of 95.94%, 96.25%, 96.79%, and 96.43%. Here, the proposed model achieves a high AUC while the GNB of the existing model attains a low AUC value.
Ground truth values of the input Pol-SAR image
Comparative analysis of the proposed work with existing models
When comparing the RMSE of the existing models with the proposed system, the proposed system achieved 19.70% while the other techniques such as GNB, DT, RF, and XGB attains value of 21.01%, 20.92%, 20.05%, and 20.01%. Here, the proposed model achieves a low RMSE value while the GNB of the existing model attains a high RMSE value. Finally, the Average execution time of the proposed system is compared with existing models. When comparing the existing models with the proposed system, the proposed system achieved 5.43 minutes while the other techniques such as GNB, DT, RF, and XGB attains the value of 0.0 minutes, 0.02 minutes, 0.39 minutes, and 7.66 minutes. Here, the proposed model achieves minimum execution time while the XGB of the existing model attains a high average execution time.
Overall, Pol-SAR Image Classification Using Multifarious Stratification Stratagem in Machine Learning outperforms existing techniques such as two-layer NN, RBF-SVM, three-layer NN, LeNet-5, shallower CNN, D-DBN, and contextual CNN as well as other datasets such as salinas, Kennedy space center, and Botswana with high accuracy of 99.69%, high recall of 98.99%, high precision of 98.99%, and high f1 score 98.98% using scrumptious integrant wrenching, episodical proximity selection, and multifarious stratification strategy. Thereby, proposed techniques effectively extracts all the features from the input Pol-SAR image even if it has a complicated statistical structure and select the best features from the extracted features as well as successfully classify the Pol-SAR image.
The Scrumptious Integrant Wrenching method, by employing convolutional layers for feature extraction and max-pooling layers to reduce spatial dimensions while preserving critical features in Pol-SAR images, has notably enhanced accuracy due to its adaptability to capture rotational and positional invariance inherent in radar images. By leveraging convolutional layers, the method excels at detecting and extracting intricate patterns, such as the complex three-dimensional structural aspects present in Pol-SAR imagery. The utilization of max-pooling further consolidates dominant features, reducing spatial redundancy and noise while retaining essential information. This combined approach not only ensures robustness against structural variations in the data but also facilitates the extraction of discriminative features essential for accurate classification or analysis tasks, thus contributing significantly to heightened accuracy in Pol-SAR image processing.
The proposed Episodicical Proximity Selection method for feature selection employs principal component analysis (PCA) to reduce the high-dimensional data of Pol-SAR images into a lower-dimensional space without compromising essential features. By using PCA to transform the data, this method focuses on preserving relevant information while minimizing redundancy, effectively capturing the inherent structure and patterns within the data. By calculating closeness point parameters derived from PCA, it optimizes the selection of features, emphasizing those that contribute significantly to the classification task while filtering out less influential ones. This approach enables the method to discern and retain the most discriminative aspects of the Pol-SAR images, thereby enhancing precision by effectively capturing the critical features essential for accurate classification while minimizing the impact of irrelevant or redundant information in the data.
The Multifarious Stratification Strategem utilizing an Elastic Net Classifier improves recall and F1 score due to its unique combination of elastic net regularization, handling feature variability through PCA, and leveraging reduced dimensions for classification. The elastic net enhances feature selection, while PCA aids in reducing noise and focusing on essential information. This approach ensures a more robust and accurate classification by efficiently utilizing features and mitigating overfitting, thereby enhancing recall and F1 score in Pol-SAR image classification tasks.
Limitations of the study
In this proposed model, an labeled PolSAR training data is a time-consuming and costly operation because it calls for the acquisition of ground truth data and professional interpretation. The creation and operation of precise classification models is hampered by the scarcity of labeled training data. Complex stratagem mechanisms are captured in the proposed system data as a result of classification interactions with the target scene. The interpretation and categorization of proposed system is more difficult. The interpretation of stratagem mechanisms is still a required one, even though the proposed system provides abundant information about the stratagem behavior of objects. The accuracy of classification algorithms is impacted by the incomplete understanding of the physical significance and connection between the stratagem mechanisms and the actual objects on the ground. In PolSAR classification, a speckle noise has a significant impact. Data quality is lowered by speckle noise, which can also impair how accurately classification algorithms work. To lessen its effects, appropriate speckle filtering methods are necessary.
Conclusion
In this work, Pol-SAR classification achieved by using a novel Scrumptious Integrant Wrenching in which the convolution layers extract the features from the input Pol-SAR image, it increases the variety of intra-layer features and makes full use of a large number of training sets. Then a novel Episodicical Proximity Selection in which principal component analysis is used to dimensionality reduction therefore the proposed system is efficiently extracting the best features from the extracted features and it makes the classification process easy. Then a novel Multifarious Stratification Strategem in which the composite kernel is interpreted with an elastic net classifier to classify the features therefore the proposed system has successively classified the features from the input Pol-SAR image. As a result, the proposed system has a more discriminative representation and maintains the image boundaries and smooth classification results are carried out and the performance metrics of the proposed system shows that the accuracy is increased by 99.69%, precision is increased by 98.99%, recall is increased by 98.99%, sensitivity is increased by 98.99%, and F1-score is increased by 98.99%.
The current Multifarious Stratification Stratagem in machine learning, designed for pixel-level Pol-SAR classification, holds great promise for futuristic applications in the realm of remote sensing and Earth observation. Beyond its immediate application in land cover and land use classification, this advanced stratagem opens avenues for more sophisticated analysis and decision-making. In the future, its integration into autonomous systems for precision agriculture, where pixel-level Pol-SAR classification can contribute to real-time monitoring of crop health and optimize resource utilization. Moreover, as the stratagem refines its ability to handle complex spatial and polarimetric patterns, it may play a pivotal role in disaster response and management, providing accurate and timely information for assessing the impact of natural disasters and guiding rescue operations.
For future work, a meticulous test setup and tuning process is imperative to enhance the robustness and generalization of the proposed Pol-SAR image classification method. Rigorous experimentation should include comprehensive cross-validation strategies, exploring a diverse range of hyperparameter configurations for the chosen machine learning algorithm, and systematically assessing the impact of various feature subsets on classification performance. It is crucial to establish a well-defined benchmark dataset for evaluation, ensuring representative samples of diverse land cover types.