
Abstract
Designers refer to existing product cases and innovate products to develop new products. However, when designers screen product cases, there is no user participation, which leads to the lack of user-side knowledge and emotional drive that is very important for design. Therefore, it is necessary to play the role of user emotional knowledge in promoting the whole design process. This paper proposes the concept of the positive perceptual sample, which applies the knowledge emotion integration of designers and users to the screening sample case stage at the beginning of the design process. This study is based on the lack of user-side knowledge and emotional drive of reference cases and integrates user emotion into the reference case screening process. Then, in the emotion measurement process, users’ cognitive data in the screening process are obtained through the eye-brain fusion cognitive experiment. Finally, the XGBoost algorithm is used to process feature index data to realize the classification and recognition of cognitive data and applied to the positive perceptual classification of products. The results show that the classification accuracy of physiological cognitive data with user emotional representation by the XGBoost algorithm is 90.87%. The results of cognitive data classification are applied to the screening of positive perceptual samples, and the satisfaction rate is 98.35%. The results show that the method proposed in this paper provides a new source of ideas for obtaining positive perceptual samples and can be applied to new product development.
Introduction
Design and innovation are the themes of the current era [1]. Innovation is an important measure necessary for enterprises to develop competitive products in response to rapid changes in the market. In product design, designers need to collect many existing products early [2]. Designers can screen products by referring to the shape and function of existing products so that products can be further optimized or improved [3]. Sokolowski et al. learn about existing products in the first phase of designing a high-performance hand-wear tool product [4]. They illustrate the importance of understanding existing product cases to help them understand the reference information involved in the design process. Jin et al. established a heuristic tool for design innovation [5]. They studied 1307 red dot award-winning conceptual designs and verified that the proposed heuristic method provided a valuable strategy for generating design. Liu et al. put forward the heuristic card method to analyze the trend of existing products, obtain design innovation inspiration through the trend, and evaluate the effectiveness of this mode [6]. It is a quick way to obtain design innovation points by obtaining existing products to inspire designers to design [7]. Therefore, the collection and screening of many reference cases in the early stage have become an essential factor affecting the direction and thinking of designers in designing products.
Another primary focus of design innovation is user-centricity [8, 9]. With the application of Kansei Engineering in product design [10, 11], designers pay more attention to users’ emotional needs for products [12]. After screening the reference cases, the designer obtains the users’ emotional thoughts through questionnaires, group interviews, oral analysis, and other methods. Wang et al. acquire emotional semantics in the process of CNC machine tool design and get the relationship between the user’s emotion and the product, so as to guide design innovation [13]. Gong et al. used the Kansei Engineering thinking-frame to design the bamboo pencil barrel [14]. In the process, they also evaluated the selected reference samples by means of questionnaire surveys and expert interviews. According to the theory of Kansei Engineering, in the process of a designer’s product innovation, the stage of user participation is limited to the cases given to users by the designer [15]. When a designer screens these cases, the designer can usually only use his knowledge to collect and filter reference cases from relevant websites, books, etc. [16]. But users as end products are not involved in screening reference cases and integrating users’ emotional needs into the design process at the beginning.
At the beginning of the design process, the designer’s selection of reference cases has excellent subjectivity [17]. These reference cases are only obtained from the perspective of designers [18]. Even if designers get user needs and emotional preferences later, they can only innovate based on these reference cases selected by designers. As the experience of end products, if the needs of users can be integrated and considered at the beginning of designer design, to establish an excellent emotional bridge between products and users and enhance the user stickiness and total value of products, it is an issue that cannot be ignored in the design research in the era of perceptual experience [19]. Therefore, in the design process, the designer needs to take the user as the main foothold [20], combine the designer’s design objectives with the user’s emotional needs, and deeply consider the user’s emotional needs as essential design knowledge [21]. Integrate the positive emotional needs of users into the screening process of product reference cases so that the design process can effectively achieve user-centered.
Given the lack of emotional integration between designers and users in the design process, we propose the concept of the positive perceptual sample. The concept of the positive perceptual sample comes from positive perceptual evaluation [22]. In selecting samples, designers pass objectives to users. When users evaluate products, samples with high arousal that can cause users please are called positive perceptual samples. According to the concept of positive perceptual samples, users take positive emotional needs as expressions and screen out positive perceptual samples to realize the design of new products driven by positive perceptual.
In the concept of a positive perceptual sample proposed in this study, users’ emotional needs are essential for screening. The traditional methods to obtain emotional needs include explicit measurement methods, such as questionnaires, oral analysis, etc. [23]. However, this method can only represent users’ subjective feelings, and the emotional experience data will be mixed with users’ irrational behavior [24]. These methods are often disturbed by the external environment, which makes users produce the explicit emotional expression of herd psychology, cannot reveal the user’s fundamental ideas, and low data reliability [25]. In the existing research, to reduce the influence of subjective factors in emotion acquisition, scholars began to introduce implicit measurement that can reflect the actual thoughts of users in psychological research into perceptual product design [26, 27].
The main methods of implicit measurement are the implicit association test, eye movement test (EMT), and EEG test [28]. EMT and EEG tests have a wide range of applications in the product design process and Kansei Engineering field. For example, In the concept generation stage of product design, Hu et al. obtained designers’ design thinking activities through EEG, discussed the relationship between different design thinking and EEG data, and provided a new research idea for guiding product design concept generation [29]. In the field of digital design, Zhang et al. evaluated the user’s design elements of building space through EEG and EMT, and optimized the design elements according to the feedback of physiological data [30]. Yang et al. used an EMT and an EEG test to match the user’s positive and negative emotional feelings about the image and rank the emotional types represented by the sample image [31]. Applying these methods in obtaining emotional experience can effectively reduce emotional acquisition subjectivity and show their methods’ effectiveness in practical application [32].
However, when the eye-brain measurement is integrated into designing emotional needs, the analysis and processing of physiological signals is a complex work, which will produce a large number of cognitive data, lead to cumbersome and complex analysis, and cannot meet the actual and efficient needs [33]. With the development of computing power and application scenarios of machine learning [34], opportunities are created for the analysis and processing of cognitive data. Machine learning can quickly learn and obtain information from many cognitive data [35]. Therefore, more and more scholars quickly analyze users’ emotional cognition through machine learning and other methods to improve the efficiency of emotional cognition extraction [36]. Through machine learning and deep learning algorithms, the analysis and recognition of implicit data related to external emotional representation have become a research hotspot.
In conclusion, although in the process of product innovation, scholars based on Kansei Engineering convert users’ emotional needs into design elements to design products, there is no relevant research to integrate users’ emotional needs in screening reference cases. In addition, it is a relatively new idea to obtain users’ emotional preferences by combining physiological data measurement to analyze them based on the advantages of machine learning and deep learning algorithm. However, it is rare to involve users’ emotional cognition in the process of selecting reference samples and building a knowledge network between users and designers. Therefore, we combine machine learning algorithms, physiological measurements, and the concept of positive perceptual samples proposed in this paper to carry out research work.
This study aims to integrate users’ emotional needs when screening reference cases and construct a method for screening reference cases, i.e., positive emotional samples, by analyzing cognitive physiological data based on machine learning. In addition, to reduce the subjective influence of users in judging decisions, we conduct experiments through the implicit measurement method, which combines EMT and EEG to improve the reliability of cognitive data and provide objective data sources for screening positive emotional samples. This research attempts to use the computing ability, learning ability, and generalization ability of machine learning to integrate artificial intelligence with human intelligence and extract features from multi-channel cognitive physiological signals. We analyze feature data and emotional information through machine learning to realize the classification and recognition of cognitive data and apply it to screening positive emotional samples.
In this paper, to effectively and accurately classify positive emotional samples of products, objective physiological cognitive data, and efficient machine learning algorithms are used to realize positive emotional samples identification. The central frame diagram of product positive perceptual sample classification based on machine learning and multi-channel physiological signals is shown in Fig. 1.

Research framework.
The rest of this paper is as follows:
The second part introduces related work. The third part introduces the setup and processing flow of the physiological cognition experiment. The fourth part studies the data information and processing methods used. The fifth part verifies the results of the data and analyses them. The sixth part carries out a discussion and robustness analysis. Finally, the main contents of this paper are summarized.
Emotional acquisition
In the existing design research and design practice, scholars and designers obtain consumers’ emotional experiences through various methods and guide design innovation to provide design sources for design optimization. Chang et al. selected adjectives suitable for describing products from relevant professional publications, magazines, and research papers and sorted them into a vocabulary of emotional perception [37]. Combined with the design characteristics of steering wheel samples, they used the Delphi method and cluster analysis to extract the subjects’ emotional experiences on the steering wheel. Quan et al. proposed matching and obtaining the samples and emotional experience based on GRA-TOPSIS for emotional product evaluation [38]. They combined the analytic hierarchy process, information entropy, game theory, and grey correlation analysis and took the electric drill as an example to obtain the user’s emotional experience highly matching the objective evaluation of the product. To better obtain consumers’ perceptual experience of product samples, Wonjoon et al. obtained emotional expression words from online comments and matched samples through text mining technology and self-organizing mapping (SOM) technology to achieve an efficient process of obtaining users’ emotional experience [39]. Liao et al. developed an online tool. Users describe and compare products through online tools, explore users’ preferences for product forms and visible features, match products with emotions, and extract users’ emotional experiences on products [40]. In the above research, obtaining the user’s emotional experience provides a guiding direction for design innovation and has been widely used in product innovation.
Whether it is based on the explicit or implicit measurement method, the reflection of the user’s emotional experience is inclined to satisfy the products that can satisfy them. Designers understand users’ perceptions and experiences of products and provide ideas for developing new products so that new products can obtain higher user satisfaction in the same category of products. In acquiring emotional experience, the subjectivity of explicit measurement often leads to the acquired emotional experience not being the expression of the user’s actual needs. The implicit measurement method solves the influence of the subjectivity of perceptual quality evaluation. This study focuses on the experiment through the implicit measurement method’s eye movement test and EEG test.
EMT and EEG on emotion
The Eye movement test is a common physiological signal measurement method. As an effective implicit measurement technology, it can reflect the process of users’ psychological cognition in real-time [41]. Through the analysis of eye movement data, it can truly and objectively reflect the cognitive needs of users. The eye tracker records the user’s gaze duration, pupil size, hot spot area, number, and frequency of eye jumps and other data indicators, which can well analyze the user’s attention to the product, processing strategy, and other information [42]. Eye movement testing technology has been widely used in product emotion acquisition. Deng constructed an eye tracking evaluation system based on annotation trajectory, number of fixation points, fixation time and pupil diameter, which improved the objectivity of emotion evaluation data [43]. EEG testing is a physiological signal measurement method for analyzing brain waves. In emotional experience acquisition, EEG analysis tests the changes in EEG signals caused by the user’s perceptual evaluation through EEG equipment, which is used to obtain the user’s psychological cognitive process [44]. Common indicators of EEG signals include wave amplitude, frequency, event-related potential, etc. [45]. Like eye movement tests, EEG signals can reflect the user’s physiological data in real-time and have high sensitivity and accuracy in time [46]. Therefore, EEG signals are mainly analyzed using time frequency. In the perceptual-cognitive evaluation, the whole process from observing the target to making the evaluation is divided into four stages: perception, understanding, preference, and decision-making [47]. The user obtains the attributes of the stimulation object through the senses and learns to understand the stimulation object according to previous experience. Based on understanding, the user obtains the preference for the stimulation object according to his criteria, and finally decides on the stimulation object. In the process of perceptual-cognitive evaluation, all stages occur in the brain and will not be exposed externally. Through the changes and analysis of EEG signals, we can get the external representation of the cognitive process. Yang et al. obtained an inference model of users’ emotional preference for products based on EEG by studying the components of N200, P300, and N400 in each brain region and establishing a relationship with behavioral data [27]. Deng Li et al. proved that the α asymmetry reflects the user’s emotional characteristics toward the product [48]. In the above research, the brain visual cognition based on eye-brain measurement can fully reflect the implicit cognitive behavior of the user unconsciously and objectively express the user’s emotional needs.
Deep Learning in physiological data
Deep learning has a wide range of applications and can solve practical problems [49]. The analysis of physiological data is very complicated [50], and it is also very tedious to construct the correlation with the research purpose [51]. Therefore, more and more scholars use deep learning algorithms to process physiological data. Pallavi Pandey et al. used Empirical Mode Decomposition (EMD) and, Variable Mode Decomposition (VMD) methods to establish Intrinsic Mode Functions (IMF) functions from EEG data to obtain feature data and then input these features into a deep neural network for classification and emotion recognition [52]. Dissanayake also realizes the emotion recognition of users through ECG combined with machine learning [53]. They obtain the characteristics of heart rate variability, empirical mode decomposition, beat analysis, and spectrum analysis and use machine learning algorithms such as SVM, Random Forest, and Decision Tree to classify emotion to obtain reliable data effect. Larabi-Marie-Sainte et al. presents a novel compact bat algorithm with deep learning model. They used this model in the EEG and EMT state classification evaluation to identify human emotional cognition [54]. Compared with traditional emotion recognition methods, the accuracy of emotion recognition by machine learning and deep learning has been significantly improved, and the recognition speed and efficiency have also been increased.
There are two ways to process physiological signal data in depth learning [55]. One way is to input the processed data into the deep learning model for training after preliminary data, and the other way is to process physiological data to obtain feature data, and then input the feature data into the deep learning model for training [56]. Because the first method does not obtain feature data, the final result is generally worse than the second method. In addition, in the first way, because of the large amount of data, you need to configure a more powerful computing environment. Therefore, this research will use the second method to process physiological data, that is, first analyze and obtain feature data, and then train through algorithms.
Experimental setup and processing flow
Research setup
Based on the eye-brain fusion cognitive experiment, this study obtains cognitive data. It classifies the cognitive data through a machine-learning algorithm to screen positive perceptual samples. The specific practical steps are as follows:
Step 1: Create a sample picture set. Sample images are crawled from e-commerce websites and online image databases, and sample picture sets are established through similarity screening and subject recognition screening.
Step 2: Determination of design objectives. Product designers, product constructors, and other designers form an expert group to discuss and determine the product design objectives.
Step 3: Recruitment and training of subjects. Recruit and train the topics according to the design objectives to fully understand the design objectives.
Step 4: Eye-brain fusion cognitive experiment. The cognitive experiment of eye-brain fusion is divided into pre-experiments and formal experiment. The subjects enter the formal experiment after they are familiar with the experiment and reach the accuracy required by the pre-experiment.
Step 5: Characteristic data analysis. Combined with the previous research of the research group, through image analysis, relationship analysis, and other methods, the EMT data and EEG data are screened to obtain the characteristic data.
Step 6: Classification training and verification. Take the characteristic data in step 5 as the independent variable and the subject judgment data in step 4 as the dependent variable for training calculation to obtain the classification results, and extract 30% of the data to verify the classification effect. The experimental flow diagram is shown in Fig. 2.

Experimental flow.
Preprocessing and feature data selection
The eye tracker can measure a variety of EM data of subjects. According to the research of Zheng [57], EM data will be affected by environmental brightness and subjects’ conditions. The subjects will maintain a stable ambient brightness during the experiment, but the ambient brightness is also different among different subjects. Therefore, each EM data is normalized to eliminate the influence of different experiments and subjects and reduce the differences in various data between subjects. The EM data are normalized to the interval value of [1] based on the subjects’ data through Equation (1).
Where f represents the original data value, f min represents the minimum value in the original data, f min represents the maximum value in the original data, and F represents the conversion value.
EEG equipment can measure EEG and other data. EEG data can be preprocessed through EEGLAB(such as loading EEG data, selecting EEG channel, loading channel position, band-pass filtering, conversion reference electrode, importing EEG data, principal component analysis, deleting drift data, deleting artifacts of EEG and EMG, EEG data segmentation, and baseline correction).
To better understand the classification of cognitive physiological data by machine learning, eye movement and EEG data need to be analyzed to obtain characteristic data. Data analysis transforms unstructured cognitive data into structured feature data sets. We define the filtered EEG characteristic data index
Feature data sets are classified according to the positive perceptual samples as labels, which belong to the problem of two classifications. Standard binary classification algorithms include SVM, KNN, Bayes, Random Forest, Decision Tree, AdaBoost, XGBoost, etc. We classify and verify the data set and finally choose the XGBoost algorithm. The verification results will be shown in the fourth part. The reasons for choosing XGBoost are as follows[58]:
XGBoost adds a regular term to control the complexity of the model, which is conducive to preventing overfitting and improving the model’s generalization ability. The traditional GBDT uses a cart as the base classifier, and XGBoost supports many base classifiers. XGBoost uses first-order and second-order partial derivatives. The second-order derivative is conducive to faster and more accurate gradient decline, which increases the applicability of XGBoost. It selects the loss function as needed, which can be used for classification or regression.
When classifying, we use 70% of the feature data set for training, use 30% of the data for verification, and verify the classification accuracy through cross-training. Figure 3 shows the classification architecture based on the XGBoost algorithm. Each circle in the figure represents the set of samples. The feature score of each sample is obtained through the first-order derivative and second-order derivative of each data point of each sample feature on the error function. Finally, the feature scores are added to get the predicted value of each sample to achieve the effect of classification.
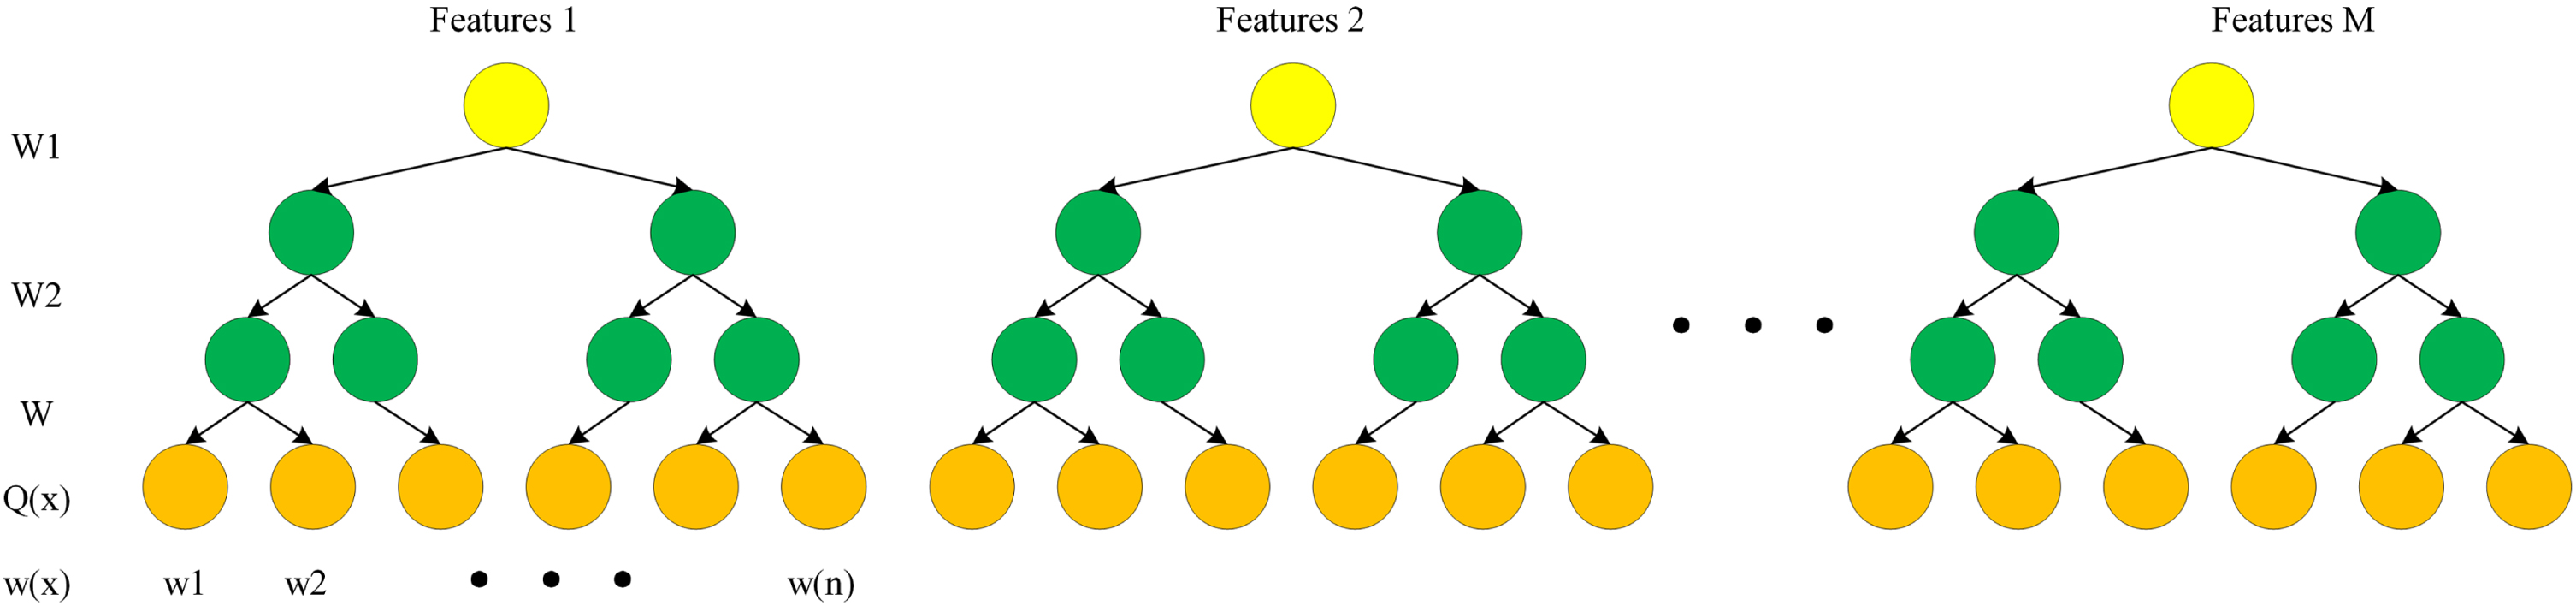
Classification structure of XGBoost.
Step 1: Create a sample picture set
The example verification of this paper took the consumer UAV as the research object. In the early stage, we took the UAV as an example and carried out much research, which has attracted the attention of many experts and scholars [59–61].
We crawled the UAV pictures in the top 20 pages from the online e-commerce (Jingdong Mall https://www.jd.com/). In addition, we crawled the UAV pictures ranking in the top 1000 lines from Baidu pictures (https://image.baidu.com/). Finally, we obtained 18045 sample pictures. We selected the products of e-commerce in the top 20 pages that can reflect the purchased heat of consumers. Baidu pictures reflect the high search degree, relevance samples, and users’ attention to UAV hotspots. To increase the experimental efficiency and reduce the impact of similar samples, we screened the pictures with high similarity through similarity screening in the preliminary processing and obtained 2103 sample pictures. More importantly, we manually screened the experimental sample pictures to reduce the influence of irrelevant factors. The screening criteria were as follows: 1) The central part of the picture was displayed as UAV products; 2) The main body of the picture needed to have a sharp contrast with the background. Finally, we screened 730 UAV sample pictures, as shown in Fig. 4.
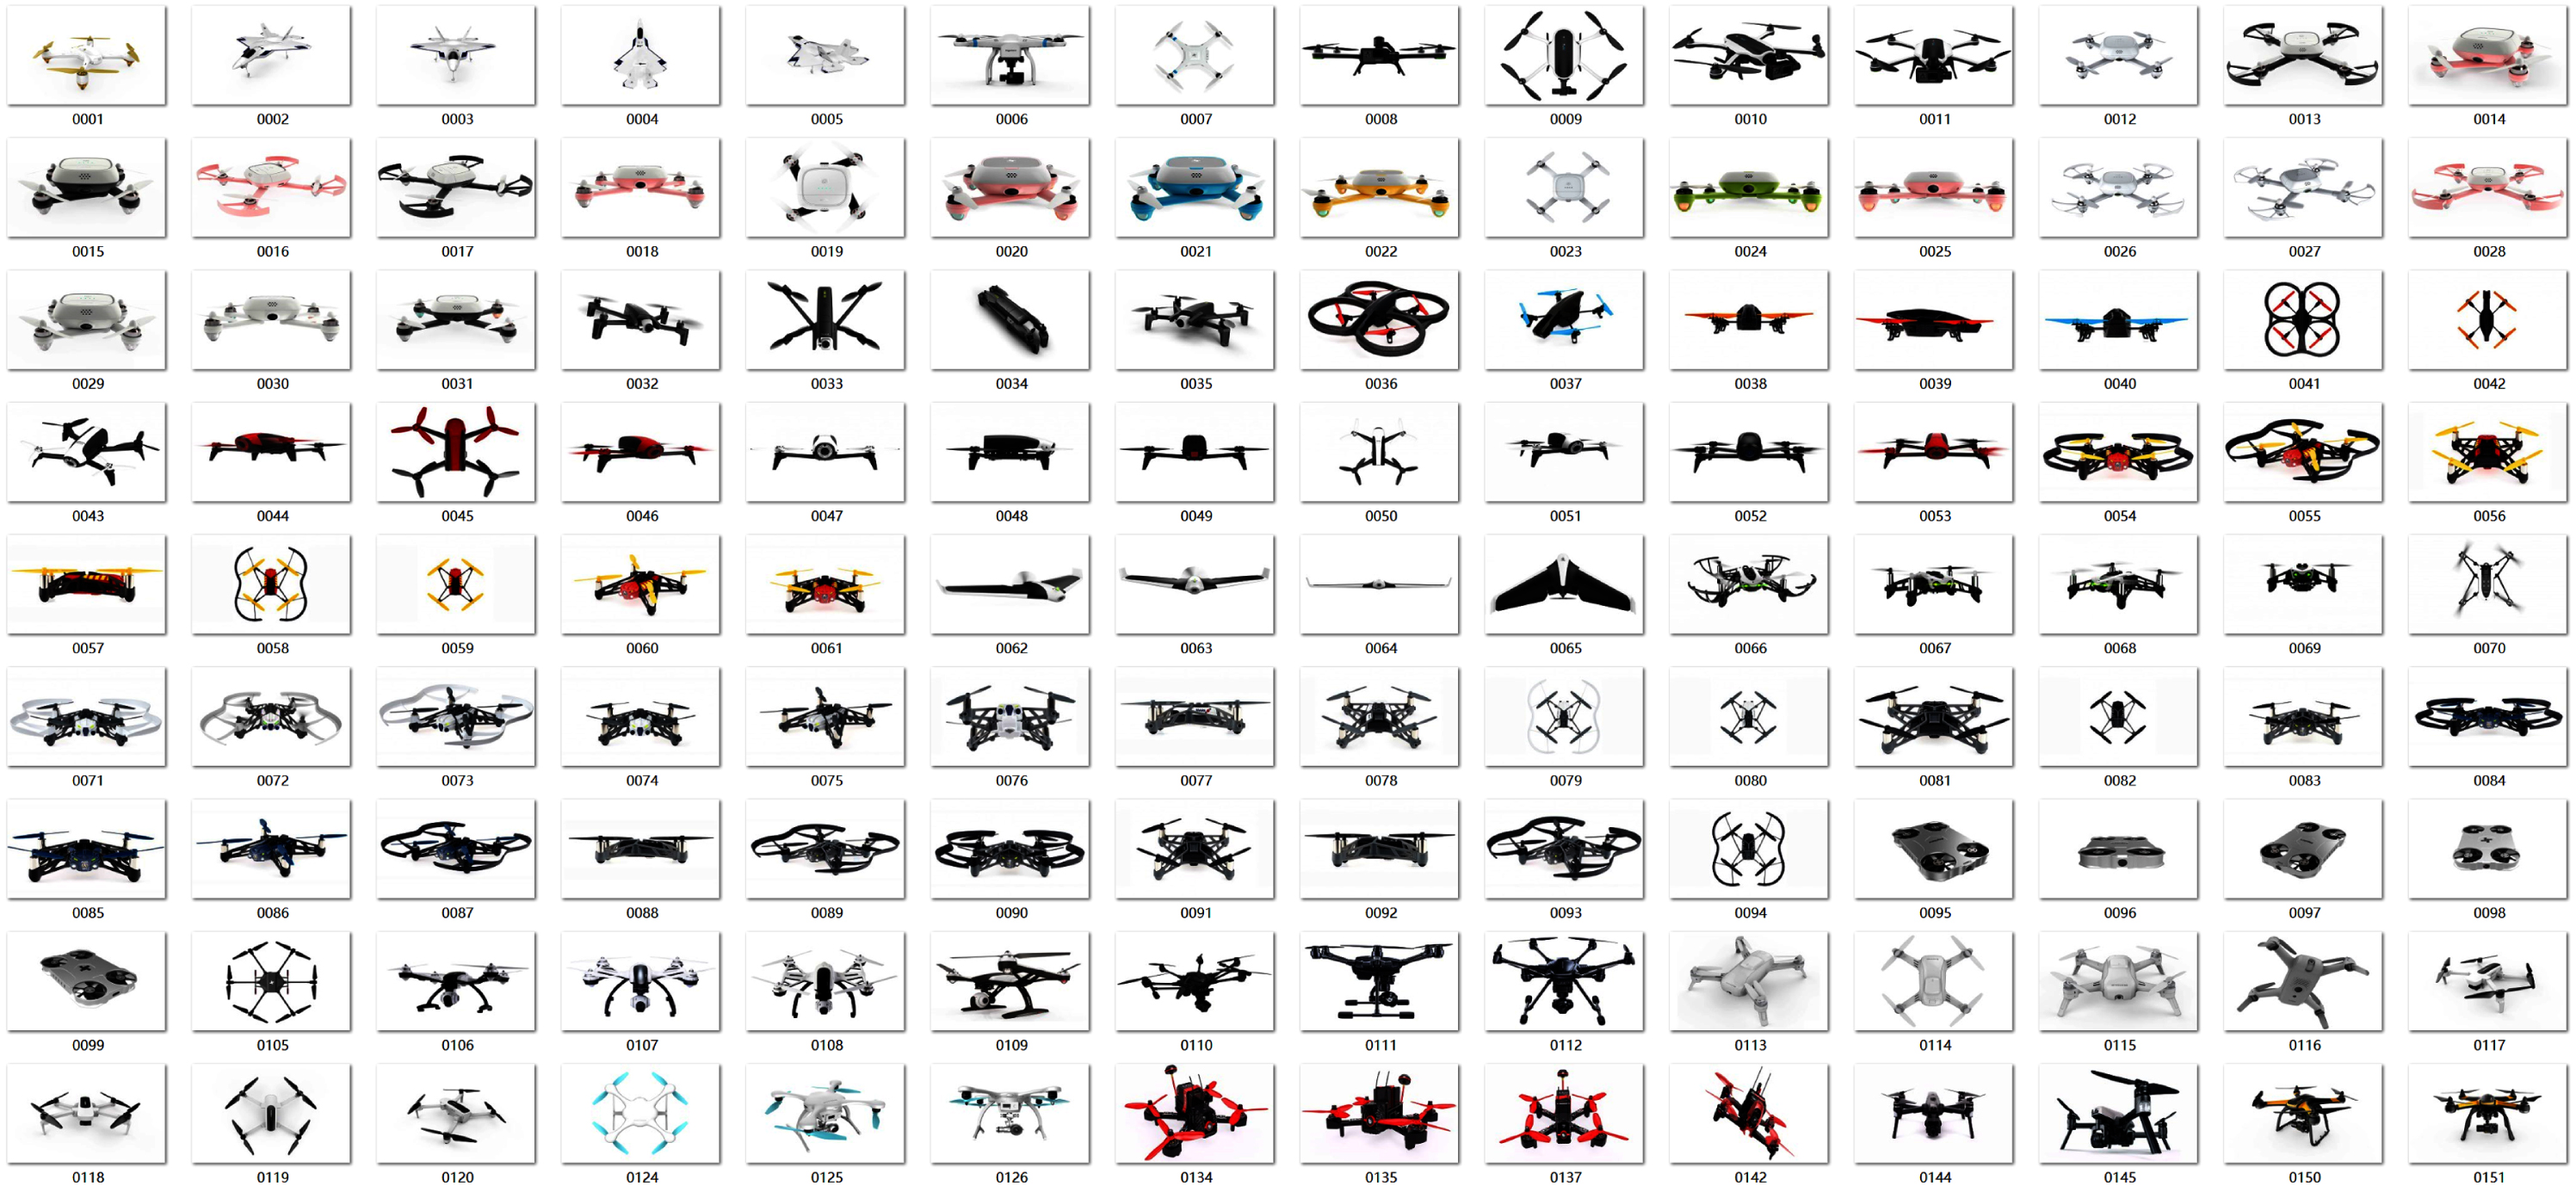
Partial sample pictures.
Before the experiment, seven senior designers (5 men and 2 women with more than 5 years of design experience and UAV design experience) and five graduate students majoring in design (2 men and 3 women who understand UAV design knowledge and are familiar with the design process) were required to form an expert group. They summarized the design experience and expertise to obtain the design objectives of the UAV, as shown in Table 1.
Information on design objectives
Information on design objectives
According to the general number of subjects in the eye-brain fusion experiment required [62], we recruited 27 subjects for the eye-brain fusion experiment (20 ∼ 28 years old, college students, right-handed, 12 males, and 15 females, with good cognition, normal vision, and corrected vision). We gave the subjects a specific reward when experimenting. Before the experiment, we trained the subjects to understand the design objectives. To make it easy for the subjects to understand the design objectives, we present them through text, pictures, videos, and other ways. The ultimate goal is to integrate the experience and knowledge of the expert group into the user’s cognition. When understanding the design objectives, we asked the subjects to browse the UAV products on sale and consumer comments on the e-commerce website. Subjects can understand consumers’ main concerns and needs according to online products and consumer evaluation. While acquiring the knowledge and experience of the expert group, the subjects can combine the current consumer information to form their cognitive information.
brain fusion cognitive experiment
After the training, the positive perceptual UAV samples were screened through the eye-brain fusion cognitive experiment. The experimental process is shown in Fig. 5. Each trial has the same process. First, a “+” appeared to attract the subjects’ attention to the center of the screen. At this stage, it appeared for 1 s, and the sample picture appeared. The time of the sample picture was determined according to the subjects’ reactions. When the subjects judged, they entered the blank interface for 1 s to eliminate the residual image. Among them, the sample pictures of the pre-experiment were 30 fixed sample pictures after being screened and evaluated by the expert group, whether positive perceptual samples were marked in the background. We matched the selection of the subjects with the type. When the matching accuracy exceeds 90% , it was proved that the subjects understood the experiment’s purpose and could carry out the formal experimentation in the next stage. When the accuracy was lower than 90% , retraining was required.
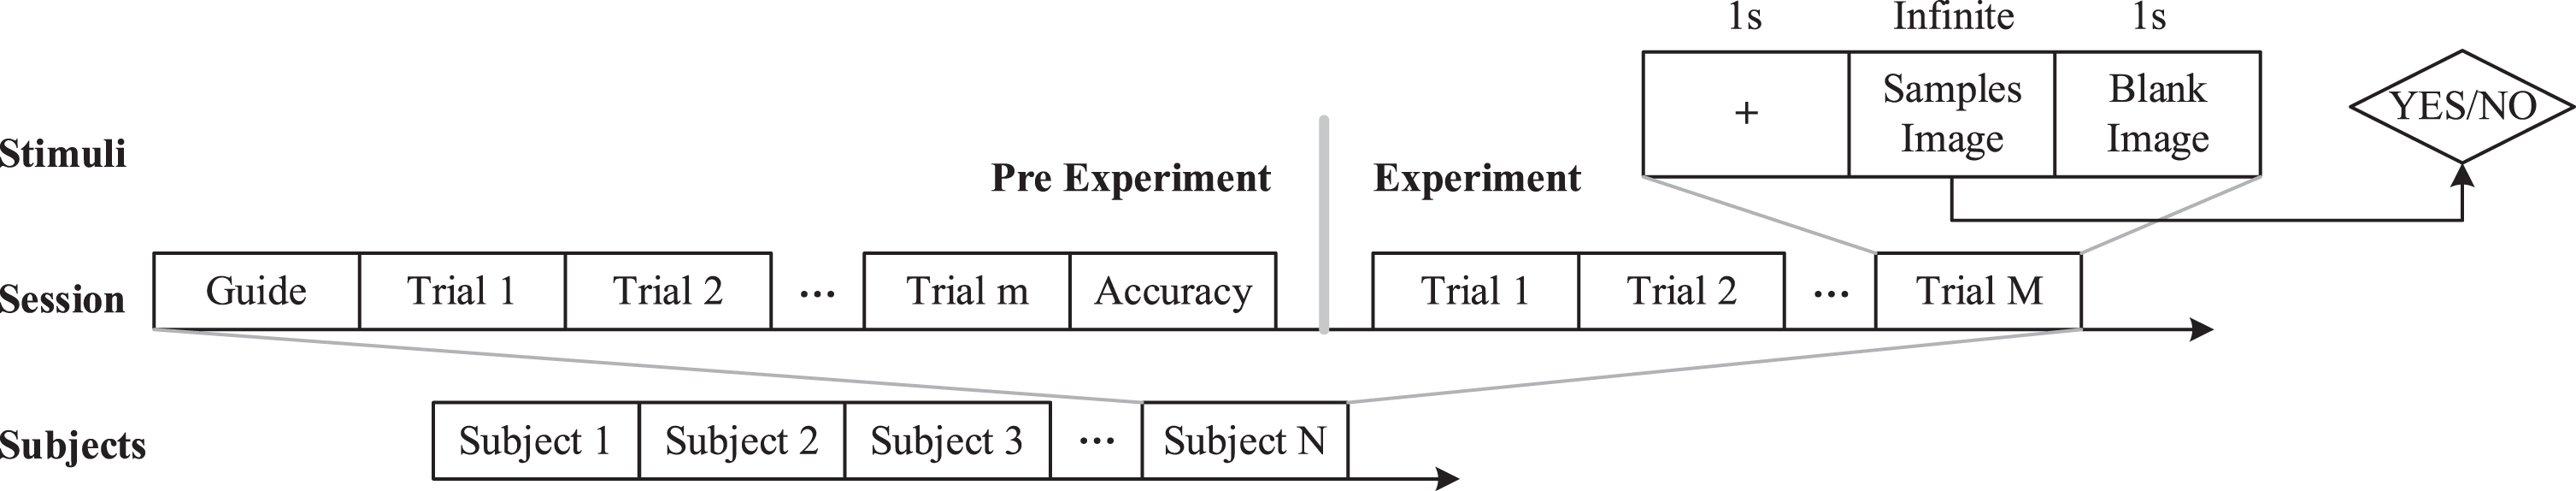
Experimental process.
Because there are too many sample pictures, we rearrange the order of the sample pictures. To prevent the subjects from getting tired during the experiment, we chose 277 sample pictures for each experiment. Each sample will be randomly used as the experimental sample of 9 10 subjects. We used the Emotiv EPOC Flex EEG device (32 electrode channels) and SMI’s RED500 EM device to measure the cognitive data. We built an eye-brain fusion measurement system through E-Prime software. The display of the sample image is Think Vision X1 (4K, 99% sRGB color gamut). The experimental environment is 22°C∼26°C, the relative humidity is 50% ∼ 60% , and natural light and LED light are used for auxiliary lighting.
Feature data selection results
Since the eye tracker and EEG equipment will record the data of all stages of the experimental process, but the user’s cognitive processing is mainly reflected in the process from the selection of sample pictures to the end of selection judgment, only the EEG and EM data at this stage are extracted, as shown in Fig. 6. According to scholars’ research [62], the pupil diameter can reflect the subjects’ emotional processing. The visual information will be input synchronously when the stimulus appears, so the pupil diameter in the user’s judgment and decision-making process is selected as the EM feature data.
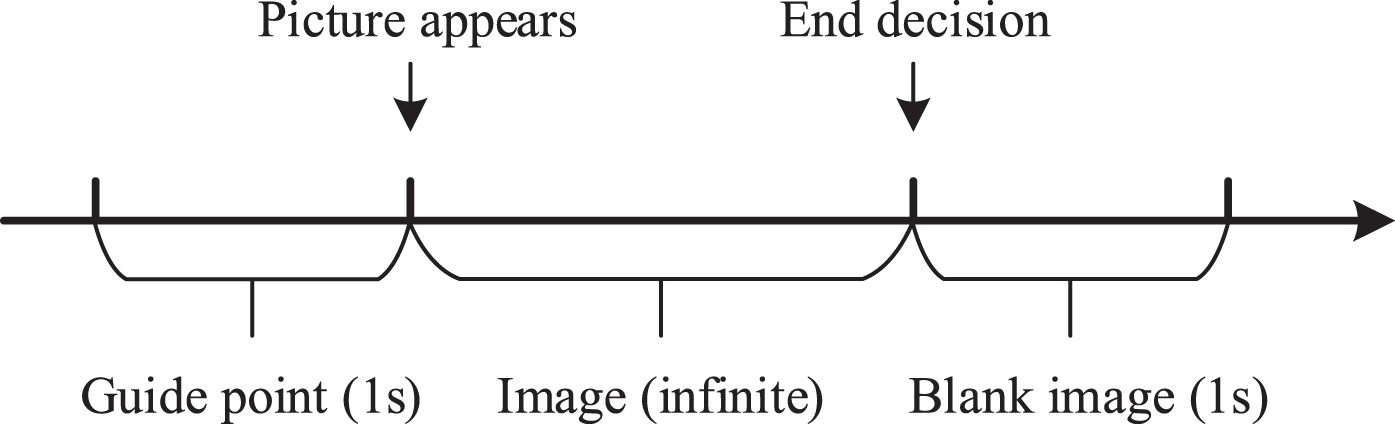
Characteristic data filtering period.
Because EEG is a non-stationary random signal without ergodicity of each state, it is easily affected by artifacts such as eye electricity and electromyography, and EEG is unstable [48]. To reduce the influence of artifact components, we did not simply extract EEG’s ERP (event-related potential) amplitude as the feature variable. However, we determined the characteristic data by analyzing the correlation between EEG data and subjects’ emotional responses.
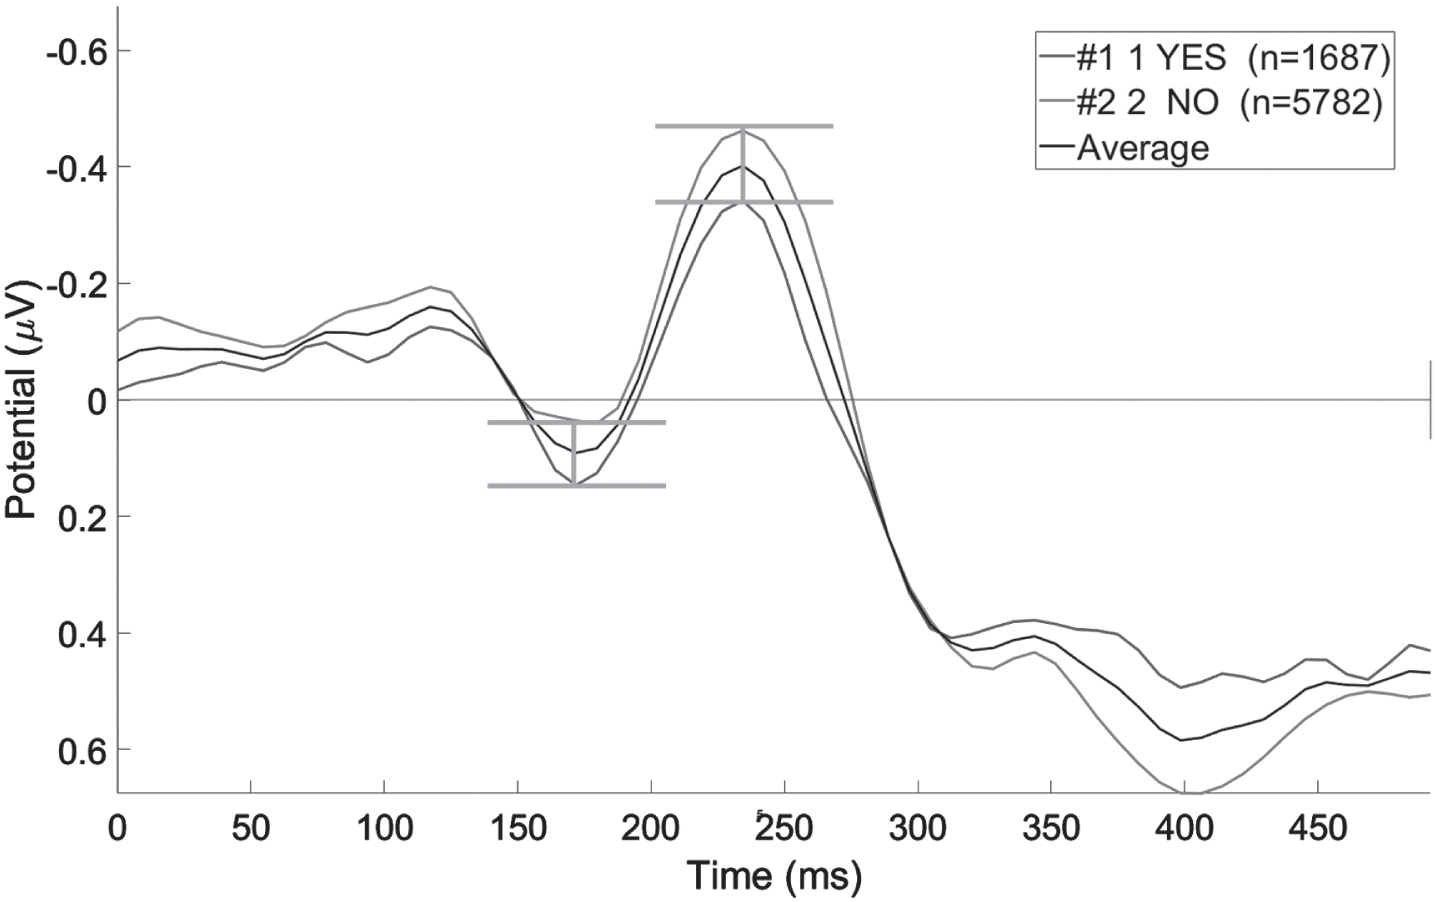
To obtain the correlation between EEG data and subjects’ emotional responses, we preprocessed EEG data according to the method in section 2.2.1. We superimposed the average EEG data of all subjects under different emotional judgment responses to obtain the average ERPs under users’ emotional reactions under different judgment decisions. The average ERP can reflect the general characteristics of the data. We plotted ERP waveforms of each electrode channel from 500 ms before stimulation to 1000 ms after the event. In addition, we analyzed and extracted the waveform features to obtain the correlation between EEG data and subjects’ emotional responses. We extracted three types of characteristic data according to the average ERPs shown in the waveform, as shown in Fig. 7. We took the waveform of ERP of the F3 channel as an example (Fig. 7-1). At 170 ms and 240 ms after stimulation, the superimposed average ERP in the two states had a peak, and the peak values of the two states were quite different. We took the trial voltage at 170 ms and 240 ms under the electrode channel as the feature variable. In addition, through the analysis of the waveform of each electrode channel, we also found that different electrode channels had different peaks at 200 ms, 270 ms, 300 ms, 320 ms, 370 ms, and 400 ms.
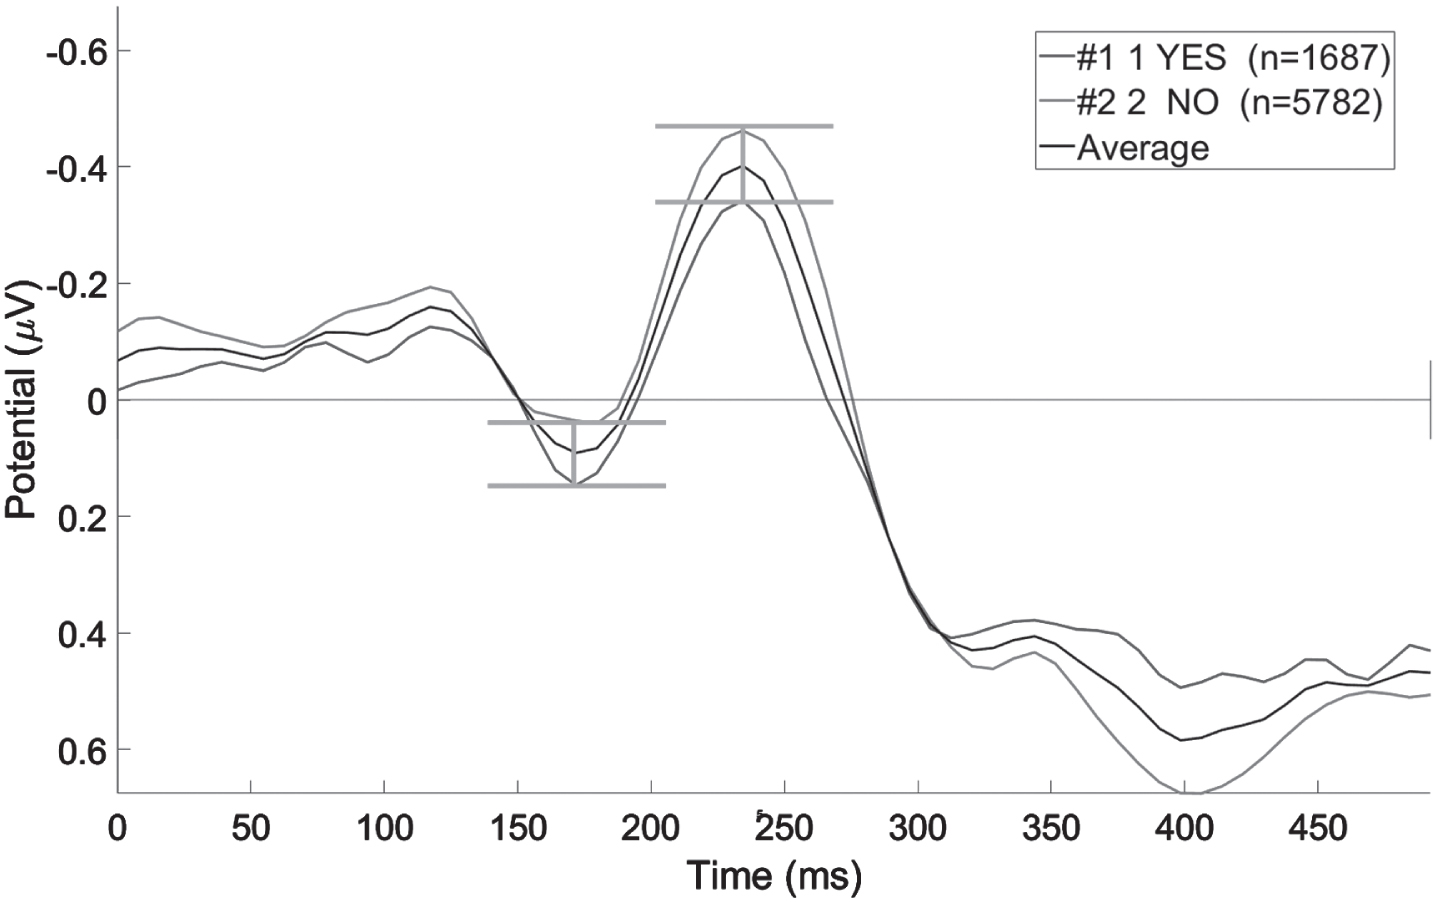
Time peak (F3).
Similarly, the trial EEG voltage value at the peak time of these channels was taken as the feature variable. We took the ERP waveform of the O2 channel as an example (Fig. 7-2). The waveform showed that average ERPs’ overall value in different states had apparent differentiation in a specific period. We took the average value of 0 ∼ 400 ms trial voltage of the O2 channel as the feature variable. In addition, we also found that different channels will have similar noticeable differences in different periods.

Time period average (O2).
Meanwhile, the average voltage of these channels in the corresponding period was taken as the feature variable. We took the ERP waveform of the P8 channel as an example (Fig. 7-3). The ERP in the two states had obvious relative peaks and troughs at 0 ∼ 250 ms and 50 ∼ 300 ms. We took the obvious relative peaks and troughs in the same period as the feature variables. The variable was defined as “1” when the wave crest occurs and “0” when the wave trough occurs, which was also applicable to other electrode channels as the feature variable. We defined that the trial data label when the subjects chose YES was 1, and the trial data label when they did NO was 0. The extracted feature variables are shown in Table 2. In this experiment, 7460 trial data were obtained (19 data with missing event values were deleted), and 71 feature variables (70 EEG feature variables and 1 EM feature variable) were selected. The characteristic data set is shown in Table 3.
Time period peak and trough(P8). ERPs waveform.
Feature variables
Feature variable data set
The original dataset will be provided free of charge: https://pan.baidu.com/s/1TGUsyLfE0dgTIot__SoChQ. Password: 0914.
We used SVM, KNN, Logistic, and XGBoost to obtain the best classification results to classify and predict the feature variable data. 70% of the data were training sets, and 30% were test sets. The setting parameters of each algorithm are shown in Table 4. In the model training stage, we used the grid search method to search all possible parameter combinations of each algorithm. For each parameter combination, we used the k-fold cross-validation experiment to determine the optimal parameters of each algorithm according to the cross-validation results. We mainly implemented model training based on Python 3.7.7 and the Scikit-learn toolkit. The computer was configured with a dual Intel Xeon Scalable Silver 4210R@2.4 GHz Processor and 64 G memory. We used the optimal parameters of each algorithm for training. The training prediction of each algorithm was 100 times.
Classification algorithm setting parameters
Classification algorithm setting parameters
Take the results of the optimal prediction parameters of each algorithm, and the prediction results are shown in Fig. 8. The prediction results show that SVM’s prediction classification accuracy is the highest for EEG Features 1 and EM Feature variables, reaching 77.43%. However, for EEG Features 2 and EM Feature variables, KNN’s prediction classification accuracy is better than other algorithms, reaching 77.41%. For EEG Features 3 and EM Feature variables, the accuracy of all algorithms has been dramatically improved, which indicates that EEG Features 3 can better predict the classification results. For the third combination of this variable, the prediction result of Logistic is the highest, reaching 88.75%. Finally, all feature variables were combined and classified to predict, and the prediction results of all algorithms were significantly improved. The average accuracy of the XGBoost algorithm can reach 90.87% , the lowest value is 87.92% , and the highest value is 93.82% , which was better than that of other algorithms.
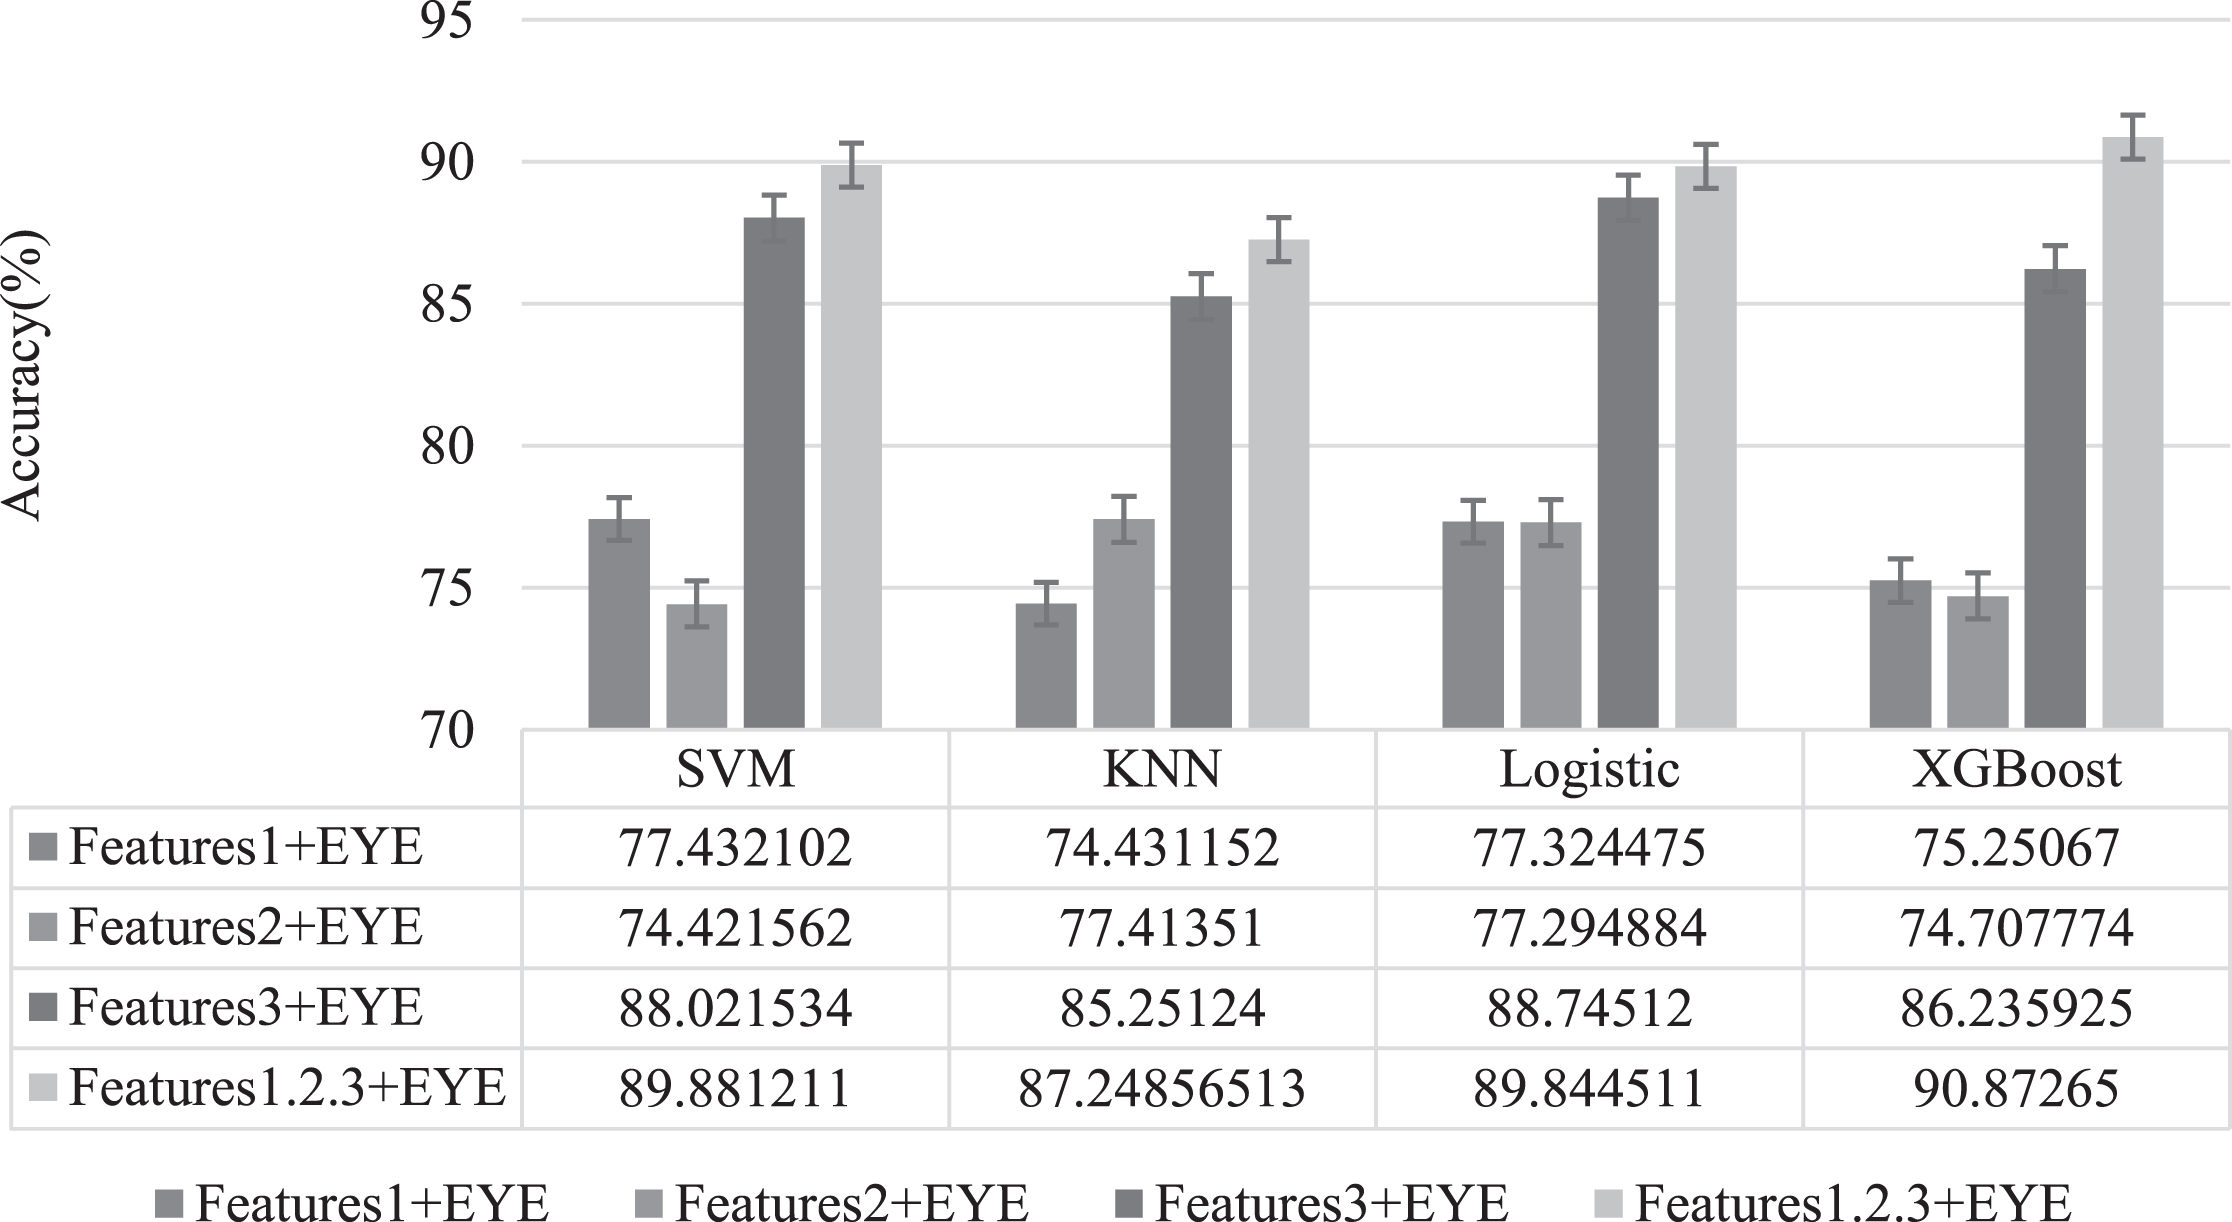
Classification algorithm classification and recognition accuracy.
In order to verify the effectiveness of the positive perceptual sample classification method proposed in this paper, based on the physiological signal classification model established by XGBoost, we extracted the prediction classification data information and verified the classification results. In order to reduce the chance of errors when subjects evaluated products and the deviation of algorithm prediction, we took the probability that the sample was predicted to be positive perceptual more than 90% as the screening standard. The obtained samples were the positive perceptual samples for the final prediction classification. The final prediction results are shown in Table 5.
Prediction results of positive perceptual samples
Prediction results of positive perceptual samples
User research
To verify the impact of the concept of positive perceptual samples proposed in this study on subsequent design innovation, we will conduct user research on the screened positive perceptual samples. Positive perceptual samples are selected by combining the designer’s experience and the user’s emotional needs. The concept of a positive perceptual sample is proposed to provide more service and design innovation and integrate the knowledge of designers and users. We conduct user research to determine the differences and advantages between positive perceptual samples and samples obtained by traditional methods. Therefore, we added two groups to conduct user research based on the experiment. The two groups are composed of designers and ordinary users, respectively. Both groups are recruited independently. The design team members are designers with more than 3 years of design experience (5), and the user team is college students aged 25 30 (5 non-design majors). The user research is conducted in the form of interviews. We provide the picture sets to two groups respectively and ask questions to the groups. Those pictures can be used as sample cases of the source of design innovation ideas. Discuss within the two groups, select the samples that each group believes can be used as the source of design innovation ideas, and record the principles and reasons for each group to choose these samples.
After each group’s discussion, the number of samples screened by the design group is 100, and the number of samples screened by the user group is 130. The number of samples screened by the two groups is quite different, and both are pretty different from the number of positive perceptual samples. In order to show the difference between the samples screened by the two groups and the positive perceptual samples, we compared the three groups of samples. We compared the three groups of samples in pairs. Among them, the same number of samples screened by the design group and positive perceptual samples is 71, the same number of samples screened by the user group and positive perceptual samples is 92, and the same number of samples screened by the design group and user group is 56. The relationship between the three groups of samples and the total sample is shown in Fig. 9. According to the comparative data of the three groups of samples, there is a large gap between the design group, the user group, and the positive perceptual samples, and the gap between the design group and the user group is noticeable. The screening gap between the design and user groups shows that designers and users pay attention to different factors and have different emotional preferences. If only one party’s needs are concerned, the final screening sample will be limited, proving the necessity of integrating the emotion and knowledge of designers and users in this study.
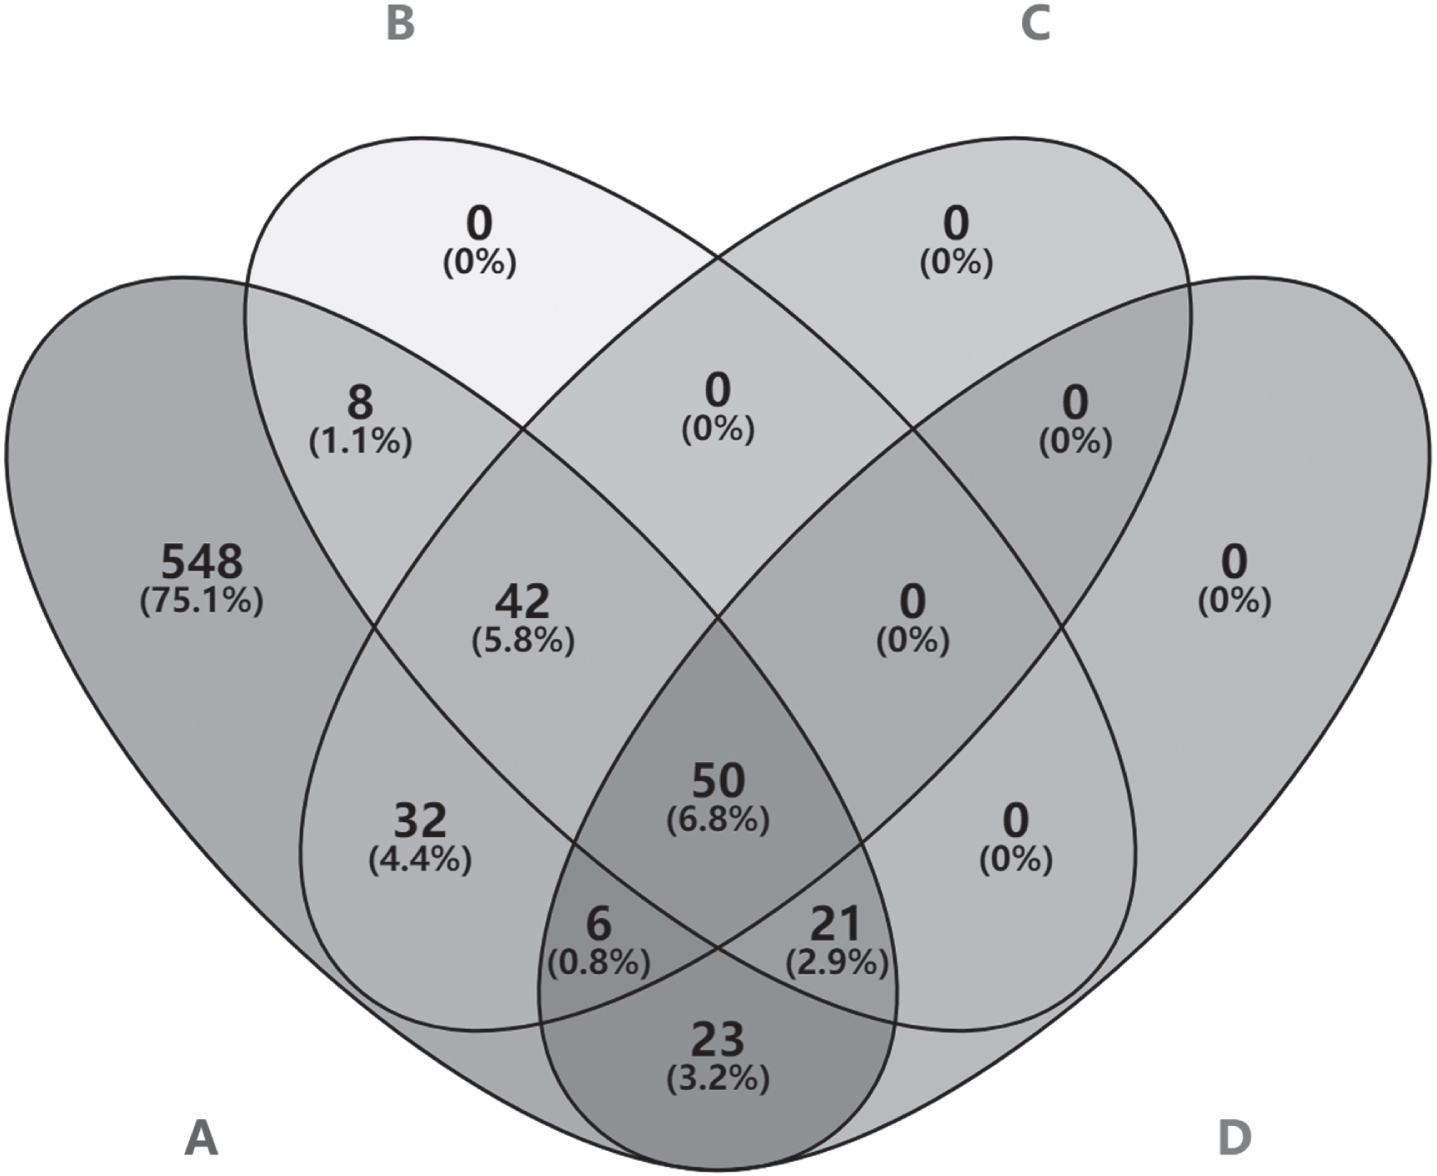
Group comparison Wayne diagram.
To verify the satisfaction of designers and users with positive perceptual samples, we will sort out the screening principles and reasons recorded by each group when screening samples and display the information to the other group respectively so that each group can understand the concerns of the other group. Then we brought the two groups together to communicate and fully understand each other’s ideas. We will show the positive perceptual samples to designers and users and let them judge whether the positive perceptual samples meet the views of the two groups and whether they meet the requirements of design objectives and reference needs. Finally, 119 samples meet the designer’s perceptual design reference after discussion. The satisfaction rate reaches 98.35% , proving that the classification method proposed in this paper is effective and meets the designer’s actual needs.
In this paper, we propose the concept of positive perceptual samples and screen positive perceptual samples according to the concept of positive perceptual. To verify the effectiveness of the classification framework of cognitive physiological signals and machine learning used to obtain positive perceptual samples, we further propose a verification experiment based on the positive perceptual sample screening experiment of UAV. We take the small passenger car as the experimental object in the validation experiment.
The validation experiment uses the same research framework as the previous experiment, as shown in Fig. 10. We collected 1200 pictures of small passenger cars on the Internet. In cooperation with the expert group, 15 design objectives were defined. Subsequently, 30 subjects (20–28 years old, college students, right-handed, 18 men and 12 women, with good cognition, normal vision, and corrected vision, in line with ethical requirements) were recruited, and the subjects were trained to understand the design objectives. After the training, the eye-brain cognitive experiment was carried out. The experimental process is the same as the previous experiment.

Research framework (validation experiment).
Similar to the data analysis of previous experiments, feature data are extracted first. We preprocess the obtained data. Our eye movement data is the same as the previous experiment, and the pupil diameter is used as the characteristic data information. For EEG data, we superimposed and averaged the EEG data of all subjects under different emotional judgment reactions, obtained the average event-related potential under users’ emotional responses under different judgments and decision-making, and drew the waveform. Then, we analyze it according to the waveform. As in the previous experiment, three types of feature data are extracted. Compared with the earlier experiments, the characteristic data indexes of the verification experiment have high similarities. There are 50 identical indexes and a total of 68 characteristic indexes. The extracted feature variables are shown in Table 6.
Feature variables (validation experiment)
Similar to previous experiments, we trained EEG feature data, eye movement feature data, and subjects’ selection data through SVM, KNN, Logistic, and XGBoost. The data information is 1200×twenty×66 data matrix. The accuracy and error of the prediction obtained by each training method are shown in Fig. 11. The data results show that the framework based on the model is effective. The subjects’ emotional preference for the sample pictures is analyzed in the two experimental cases based on the positive perceptual concept. The subjects’ judgment and choice are predicted through cognitive physiological data and a machine learning algorithm, which has sufficient accuracy.

Classification algorithm classification and recognition accuracy (validation experiment).
The premise of this study is that when the designer surveys the user’s emotional evaluation of the product, the sample cases selected come from the designer’s opinion. These sample cases cover the designer’s subjective ideas and design experience. Because of the designer’s occupation limitations have not integrated the user’s ideas, and the selected sample cases are not universally representative, only by the designer, a highly professional group. Because of the limitations of design sample screening, we put forward the concept of the positive perceptual sample. Through the framework of this concept, we can incorporate the user’s ideas so that the screening of sample cases is transferred from designers to designers-users to participate in the collaboration. Designers provide design goals and needs. Users can make reasonable screening and judgment based on the goals and needs provided by designers and combined with users’ experience, and finally obtain positive emotional samples.
The theoretical framework is transferable
This theoretical model is based on cognitive physiological data and machine learning methods. Cognitive physiological data can reflect users’ objective feelings, and machine learning algorithms quickly and accurately identify users’ judgments. We validate our approach through user research and validation experiments to consider the universality of the research framework proposed in this study for different products. We obtained effective results through the framework presented in the complete simulation study based on the UAV as the target product. Through user research, we verified that the final predicted positive emotional sample satisfaction rate reached 98.35%. However, this is only for UAV products, so we use a small passenger car as a case study. According to the research framework proposed in this study, we conduct repetitive experiments with the highest accuracy of machine learning prediction of 93.26% , verifying that the framework presented in this study is transferable.
Selection of characteristic data
Physiological cognitive data is complex and massive, and machine learning needs to be trained through feature data and labels, so screening physiological cognitive feature data is essential. This study used only pupil diameter to select eye movement data. We have tried to use data such as first fixation time and fixation points in our previous related studies. However, in this study, we use the pupil diameter as the eye movement feature data in the experiments based on UAVs and automobiles to obtain high accuracy. Because we only discuss the selected feature indicators, this does not mean that pupil diameter is the best feature data, which also needs to study further the impact of other eye movement feature data on accuracy. For EEG feature data, we found the same three types of feature data (features1, features, Features3) in two experiments, and each feature data type has different feature data indicators. The EEG characteristic data indexes of the two experiments were obtained through image analysis. Because the accuracy of EEG data in spatial resolution is low, the two experiments have different characteristic data indicators. According to the prediction results of the two experiments, fewer feature indexes (features1 + EYE, Features2 + EYE, Features3 + EYE) as feature data will seriously affect the accuracy of final prediction through machine learning. Therefore, the proposed method only applies to EEG indicators’ characteristics and has obvious characteristics.
Performance comparison of algorithms
We can see from experiments and validation experiments that XGBoost algorithm has obvious advantages in accuracy and classification effect. The problem of detecting binary classification does not only depend on the accuracy index. In the case of unbalanced data categories, the accuracy evaluation index can not objectively evaluate the advantages and disadvantages of the algorithm. To evaluate the performance of different algorithms, we use relevant statistical indicators, including True Positive Rates (TPR), False Negative Rates (FNR), Positive Predictive Value (PPV), False Discovery Rate (FDR), F1 Score, Kappa coefficient, etc.
In the feature data combination case, we verified each classifier’s performance indicators, as shown in Table 7. We can see from Table 7 that the TPR of the XGBoost algorithm is lower than that of other algorithms in the case of non-compliance and higher than that of other algorithms in the case of compliance. In PPV, the false-positive rate is high because of the uneven number of data. In the Kaapa coefficient evaluation, the XGBoost algorithm’s index is significantly higher than other algorithms, and the prediction is highly consistent. Through the performance analysis of the algorithm, we can see that the XGBoost algorithm can not only guarantee the accuracy of positive examples but also improve the classification accuracy of a few classes. At the same time, the XGBoost algorithm also has advantages in convergence speed and learning ability compared with traditional classifiers. This algorithm can meet the requirements of positive perceptual product attribute classification based on EMT and EEG tests.
Classifier performance index
Classifier performance index
This paper presents the concept of positive emotional samples for product development. We fully demonstrate the classification steps by objective measurement and machine learning algorithms to screen positive perceptual samples. The positive perceptual sample concept proposed in this paper is a new concept that integrates the knowledge and emotions between the designer and the user and provides a reference case for the designer when designing the product. Designers transfer design goals and knowledge to users. Users screen positive emotional samples according to their emotional needs. Record objective data of user’s eye movement and brain electrophysiological cognition during screening positive emotional samples. Characteristic data sets are obtained through cognitive data analysis. Relating the user’s judgment decision and cognitive data, the machine learning algorithm XGBoost is used to classify and recognize the characteristic data and obtain the prediction and classification of the cognitive data. Finally, the classification results predicted by the algorithm are used as the basis, and samples with a forecast probability of more than 90% are used as positive perceptual prediction samples. This research uses a new angle to screen reference samples, combines physiological cognition data with a machine learning algorithm, and applies the predicted results to the screening process of positive perceptual samples, thus providing a new source of ideas for user-centered new product development. In this paper, two cases of UAVs and cars are used for experimental verification, which proves that the method proposed can play a good auxiliary role in product design.
However, this paper also has some limitations. This paper proposes the concept of positive perceptual sample, which can input the user’s emotion into the sample selection process. Although the design process is more user centered, the design process is also added. It is necessary to evaluate whether this method is worth the ultimate design innovation, and consider the dynamic balance between time and labor costs and the realization of product design goals. In addition, more practical cases can be studied to improve the method proposed in this paper.
Footnotes
Acknowledgments
This work was supported by the National Natural Science Foundation of China (No. 51865003), the Guizhou Science and Technology Plan Project (NO.ZK[2021]055), the Guizhou Science and Technology Plan Project (No. QKHPTRC[2018]5781), and the Guizhou University Cultivation Project (NO.[2019]06).