
Abstract
This paper proposes an evolutionary ensemble model based on a Genetic Algorithm (GAEEM) to predict the transmission trend of infectious diseases based on ensemble again and prediction again. The model utilizes the strong global optimization capability of GA for tuning the ensemble structure. Compared with the traditional ensemble learning model, GAEEM has three main advantages: 1) It is set to address the problems of information leakage in the traditional Stacking strategy and overfitting in the Blending strategy. 2) It uses a GA to optimize the combination of base learners and determine the sub. 3) The feature dimension of the data used in this layer is extended based on the optimal base learner combination prediction information data, which can reduce the risk of underfitting and increase prediction accuracy. The experimental results show that the R2 performance of the model in the six cities data set is higher than all the comparison models by 0.18 on average. The MAE and MSE are lower than 42.98 and 42,689.72 on average. The fitting performance is more stable in each data set and shows good generalization, which can predict the epidemic spread trend of each city more accurately.
Introduction
Epidemics have become a global public health issue. As viruses mutate, they become more infectious, and infections become faster, resulting in very complex and nonlinear data. Traditional machine learning models are sensitive to data, making it difficult to fit the complex infectious disease data well [1].
Ensemble learning enables better prediction performance than traditional machine learning models by combining the prediction results of the base learners [2]. Due to the different ensemble strategies, various ensemble learning algorithms are generated. The main difference between each ensemble strategy is the combination of base learners, the training process and the process of combining their prediction results. However, the existing ensemble approaches have the following problems: For the data processing method: the traditional Stacking [3] ensemble method uses the whole training set for cross-validation of the base learners, quickly causes information leakage, while the Blending [4] ensemble method divides the training set and validation set uniformly and uses the training set for training different base learners without cross-validation, which is easy to cause overfitting compared to Stacking that produces fewer samples. For the base learner combination strategy: traditional ensemble learning models such as XGBoost, AdaBoost, CatBoost, Gradient Boosting Decision Tree(GBDT), LightGBM(LGBM), Random Forest(RF), Deepforest21(DF21) [5] simply combine base learners and do not have their combinations for optimization, and there is no a straightforward practice in the selection of sub-learners. For optimization tasks in ensemble learning: e.g. evolutionary algorithms can perform various optimization tasks in ensemble learning, such as sample selection, model structure optimization [6], fusion strategies, etc. However, a series of evolutionary algorithms such as genetic algorithm(GA) and particle swarm optimization(PSO) [7] have their characteristics, and it is also tricky to select the appropriate evolutionary algorithm for a specific problem.
This paper proposes an evolutionary ensemble learning model based on GA to address the above issues. Genetic algorithms have robust global search capability [8], and according to recent studies, they are preferred over other evolutionary algorithms for solving complex, realistic task optimization [9]. Therefore, GAEEM is proposed for the data task of epidemic transmission with significant complexity and nonlinearity using genetic algorithms. by comparing with traditional ensemble models based on Blending or Boosting strategies and DF21 proposed by Zhou in 21 years. It is shown that the ensemble approach of GAEEM can cope well with the epidemic’s complex and nonlinear data task. It can ensemble models adaptively and predict epidemic transmission trends more accurately.
In summary, we have made the following main contributions. A GAEEM model is proposed to predict epidemic transmission trends, which can adaptively adjust the combination of base learners and sub-learners for the automatic model ensemble. We reduce the risk of information leakage with the traditional Stacking strategy and the risk of overfitting of Blending strategy. Extending the feature dimension of the data used in this layer based on the optimal base learner combination prediction information data can reduce the risk of underfitting and increase prediction accuracy. Using the popular ensemble models as base learners, ensemble again based on ensemble and predicting based on prediction information, makes the model more stable and robust.
The rest of the paper is organized as follows. Section two presents the background of evolutionary ensemble learning and the prediction of infectious diseases, and Section three introduces the GAEEM model. The fourth section describes the experiments and their result analysis, containing the data preprocessing process, experimental parameter settings, and comparison experiments. Finally, the fifth session concludes the paper.
Related work
Evolutionary ensembled learning
Evolutionary ensemble learning combines the advantages of both ensemble learning and evolutionary algorithms and is widely used in machine learning, data mining and pattern recognition [10]. Moreover, evolutionary algorithms are mainly used for feature engineering, an ensemble of model parameters, and optimization search of model structures.
Sound feature engineering can make the model fit the data better [11], so there is much research in optimal feature engineering. Usman et al. [13] used the combination of information gain (IG), and cuckoo optimisation algorithm (COA), non-dominated sorting genetic algorithm (NSGA-III) as the evaluation metrics for filtering, and the feature data selected using it have good performance in most of the datasets. Sharma et al. [14] used GA, PSO and ant colony optimisation (ACO) in feature engineering to combine analysis and determine the best solution and showed in the prediction experimental results that using PSO for feature engineering can effectively improve the prediction accuracy. Moldovan et al. [15] proposed Horse Optimization Algorithm (HOA) and applied it to feature selection, which performs better than other evolutionary algorithms. Accuracy performance than other evolutionary algorithms.
In terms of optimization model parameters and structure, Dayalan et al. [16] proposed a new Stackelberg-particle swarm algorithm based on multi-stage excitation to optimize the demand response module of the model and achieve better results. Gu et al. [17] proposed an improved bagging ensemble surrogate-assisted evolutionary algorithm (IBE-CSEA) in solving the problem of approximation error accumulation and computational cost accumulation in solving multi-objective optimization problems. He assisted the evolutionary algorithm (IBE-CSEA) to solve the problem of approximation error accumulation and computational cost accrual in solving multi-objective optimization problems. IBE-CSEA is more competitive than the popular agent-assisted evolutionary algorithms. Ngo et al. [18] proposed an evolutionary bagging approach to ensemble learning to adjust bag diversity based on an evolutionary bagging approach. They found experimentally that their method is due to the traditional ensemble method (bagging and random forests). Guo et al. [19] addressed the ensemble structure redundancy, considerable computational cost and other multi-model optimization problems and proposed an evolutionary dual ensemble class imbalance learning method. By experimenting on seven datasets based on human localization, their results showed that the method provided the simplest ensemble structure with the best imbalance accuracy and outperformed other traditional ensemble methods in all metrics.
Ensemble learning applied to epidemics
Recently artificial intelligence has achieved much success in the field of epidemics. Padinjappurathu Gopalan et al. [20] performed disease prediction based on a deep-learning neural network with a herding genetic algorithm. Their experimental results improved prediction accuracy, privacy and security compared to existing methods. Ngabo et al. [21] used machine learning architecture for epidemics in intelligent cities. They studied the experimental results by comparing them with ensemble models and were able to propose corresponding epidemic solutions based on the performance evaluation. Nguyen et al. [22] constructed an evolutionary ensemble computing framework using KNN, SVM, RF, and XGB as base learners and using PSO to optimize the weights of the four learners. Their experimental results show that the method is a stable, robust, and practical framework. et al. optimized the optimization algorithm for ten base learners and a sub-learner SVM to find countermeasures against virus propagation. Yahia et al. [23] used Long Short Term Memory (LSTM), Deep Neural Networks (DNN) and Convolutional Neural Networks (CNN). Three models were an ensemble, their complementarity was used to predict the epidemic trends in China and Tunisia for forecasting, and better results were obtained.
Methods
Figure 1 depicts the general flow of the evolutionary ensemble model based on the genetic algorithm(GAEEM), which is divided into four steps. The first step is to filter the base learner combinations in the base learner layer by the GA layer. The filtered optimal base learner combinations are passed to the sub-learners layer in the second step. The third step is selecting the sub-learners from BOX to pass to the sub-learners layer. In the fourth step, the ensemble of the model is performed.

GAEEM Brief Process.
Figure 2 depicts the specific design of GAEEM, which has three layers, the base learner layer, the GA layer, and the sub-learner layer. The layers mainly perform the following tasks.

GA Evolutionary Ensemble Model(GAEEM).The fitness function is defined as in Equation 1.
In the base learner layer, the training set is denoted as
GA adaptive selection layer
The adjustment and selection of the base learner combination with the sub-learners are made at the GA layer. The base learners are first coded 0/1, after which a BOX is set up in the algorithm, which holds seven learners, XGBoost, AdaBoost, CatBoost, LGBM, GBDT, RF, and DF21. The 5-fold cross-validation index R2 of each learner is used as the fitness function to avoid overfitting and to accurately judge the effect of the selected population (base learner combination) accurately and stably. After inputting
Where, Model
k
: R2 represents the R2 calculation process for the n-fold cross-validation of the learner with the name k in the BOX: n denotes the n folded cross-validation: m denotes the number of samples: y(i) denotes the true value of the sample i:
Algorithm 1 describes the process of GA adjustment and selection of base learner combinations and sub-learners. There are three modules, and the first module performs the initialization of the GA, mainly initializes the population, encodes the base learners, sets the population size
The second stage performs genetic iteration. Firstly, the BOX is traversed, starting from
The third stage determines the optimal base learner combination and sub-learners. From the records, the optimal fitness values and their optimal solutions are filtered, the optimal solutions are decoded, and the decoded results are
Input:
maximum iteration
learners {
metric R2
Output: Combination of base learners:
1 Initialize the population and encode the base learner
2 For
3 While
4 The R2 of the current learner mi’s 5-fold
crossvalidation index is used as the fitness
function, and the formula is shown in equation (1) to
calculate the fitness value of each chromosome in the
current population.
5 The chromosomes in the population are sampled with
random probability, crossed with crossover probability
a new population, and the fitness value of each
chromosome in the current population is calculated.
6 End while
7 Record the name of the current learner mi, and the
corresponding optimal solution and optimal fitness value
8 End for
9 From the records, the optimal fitness value and its optimal solution
are filtered
10 Decode the optimal solution to the corresponding base learner
combination
to the optimal fitness value and return
In the sub-learning layer, the test set is denoted as
The new features and their data are constructed:
After training the sub-learners selected by the algorithm with
Symbols used and their description
Symbols used and their description
Complexity Analysis: Algorithm 1 is based on GA improvement, and the time complexity of the traditional GA is
Convergence analysis: According to [24–27], the convergence of genetic algorithms is influenced by parameters such as crossover probability, mutation probability, and population size. Increasing randomness and searchability by increasing the number of populations, crossover probability and mutation probability operations can avoid the algorithm’s premature convergence. However, these methods cannot guarantee the global convergence of the algorithm, and they cannot avoid falling into local optimum. Nevertheless, the searchability of the algorithm is still crucial and preferred in the research of scholars and practical industrial applications.
Experiment and results
Data sources and pre-processing
The dataset of this paper comes from the Baidu 2020 International Big Data Competition (https://aistudio.baidu.com). It contains 60 days of epidemic transmission in a total of 561 areas in 6 cities, precisely the number of new infections in each area on that day, the human flow index and migration intensity of each area at each time of day, the specific weather conditions (including temperature, humidity, wind direction, etc.) at each time of day, the population migration index between cities and so on. The details are shown in Table 2.
Data set distribution
Data set distribution
Missing value processing: In order to be realistic, the missing values in the six datasets included in the epidemic dataset are not filled using the mean or plural. Because the infectious data are time-sensitive and continuous, the missing value (e.g., weather data) is filled with data from the previous hour.
Feature transformation: the data in date format, in order to reduce the scale, will be converted from the original format (such as 21200501) to 1–60 accordingly; for wind direction (such as Southeast), wind speed (such as 16–24km/h), weather (such as sunny) remove the special characters and then carry out the unique thermal code; for the existence of a small number of unique values in the wind (such as 3-4) will be converted to 3.5.
Data merging: The time scales of the human flow dataset, the migration dataset of each region within the city and the weather dataset are accurate to the hour, but the task objective is to predict the infection in the region daily, so the three datasets are integrated to the unit of days respectively, and finally the six processed datasets are merged by date.
The data from the first 46 days of epidemics were used as the training set and the after 14 days of data as the test set. The GAEEM was used for comparison experiments with seven popular ensemble models. The experimental environment is shown in Table 3, and the parameters of each model are shown in Table 4.
Experimental environment Settings
Experimental environment Settings
Parameter settings of each model
The mean absolute error (MAE), mean squared error (MSE), and R2 are used as the performance evaluation indexes of the model. MAE and MSE are both commonly used loss functions of regression models, and MAE has better robustness to outliers compared to MSE, while MSE is easy to calculate. The formulas are shown in Equations (2), (3) and (4).
Where, m denotes the number of samples: y(i) denotes the true value of the sample i:
As shown in Fig. 3, feature importance analysis was performed on the epidemic dataset using XGBoost, LGBM, GBDT, CatBoost, and AdaBoost, respectively, and the comprehensive importance ranking filtered out 16 essential features.
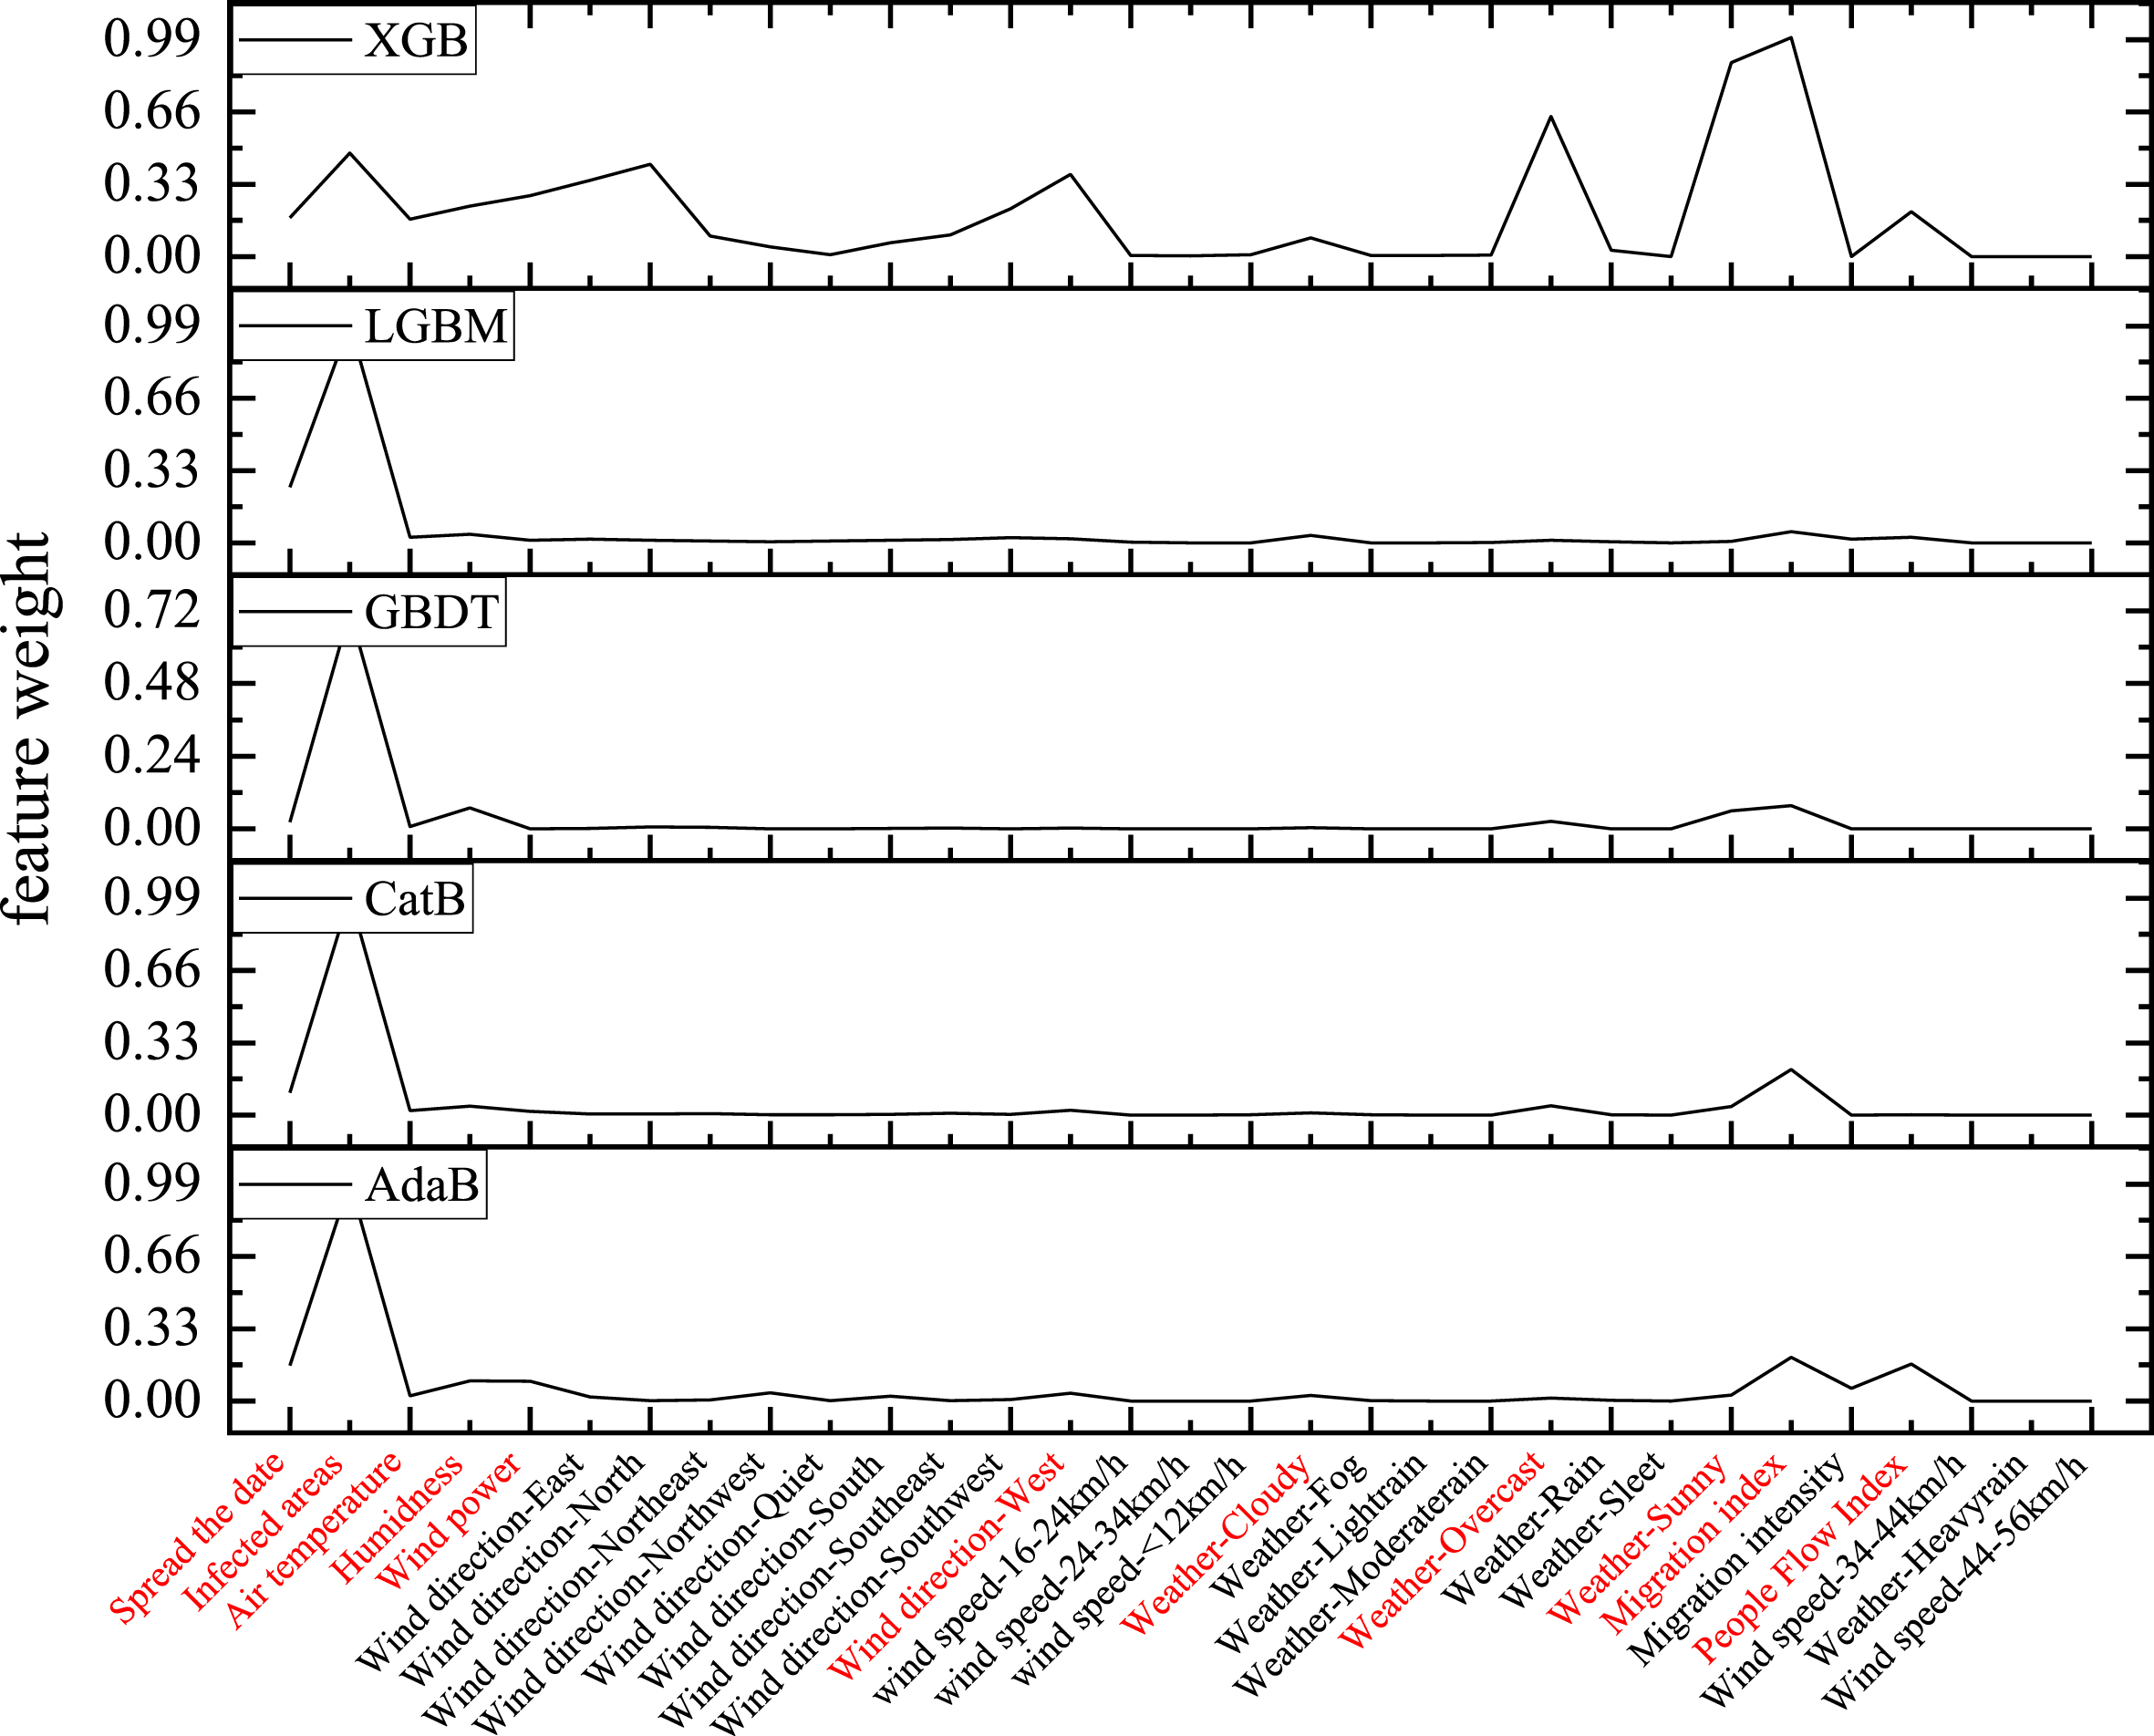
Comparison of the importance of model features.
In addition to the important features mined from the data itself, since the GA layer can filter the optimal base learner combinations that can fit the epidemic transmission data more accurately, the predicted data from the optimal base learner combinations are used as new feature data, so that these new feature data contain information based on the accurate prediction of the epidemic transmission data. Finally, the sub-learners dataset dimension is extended with these new feature data. Allow the sub-learner to build on the projections again. In summary, the important features affecting the spread of epidemics are shown in Fig. 4.
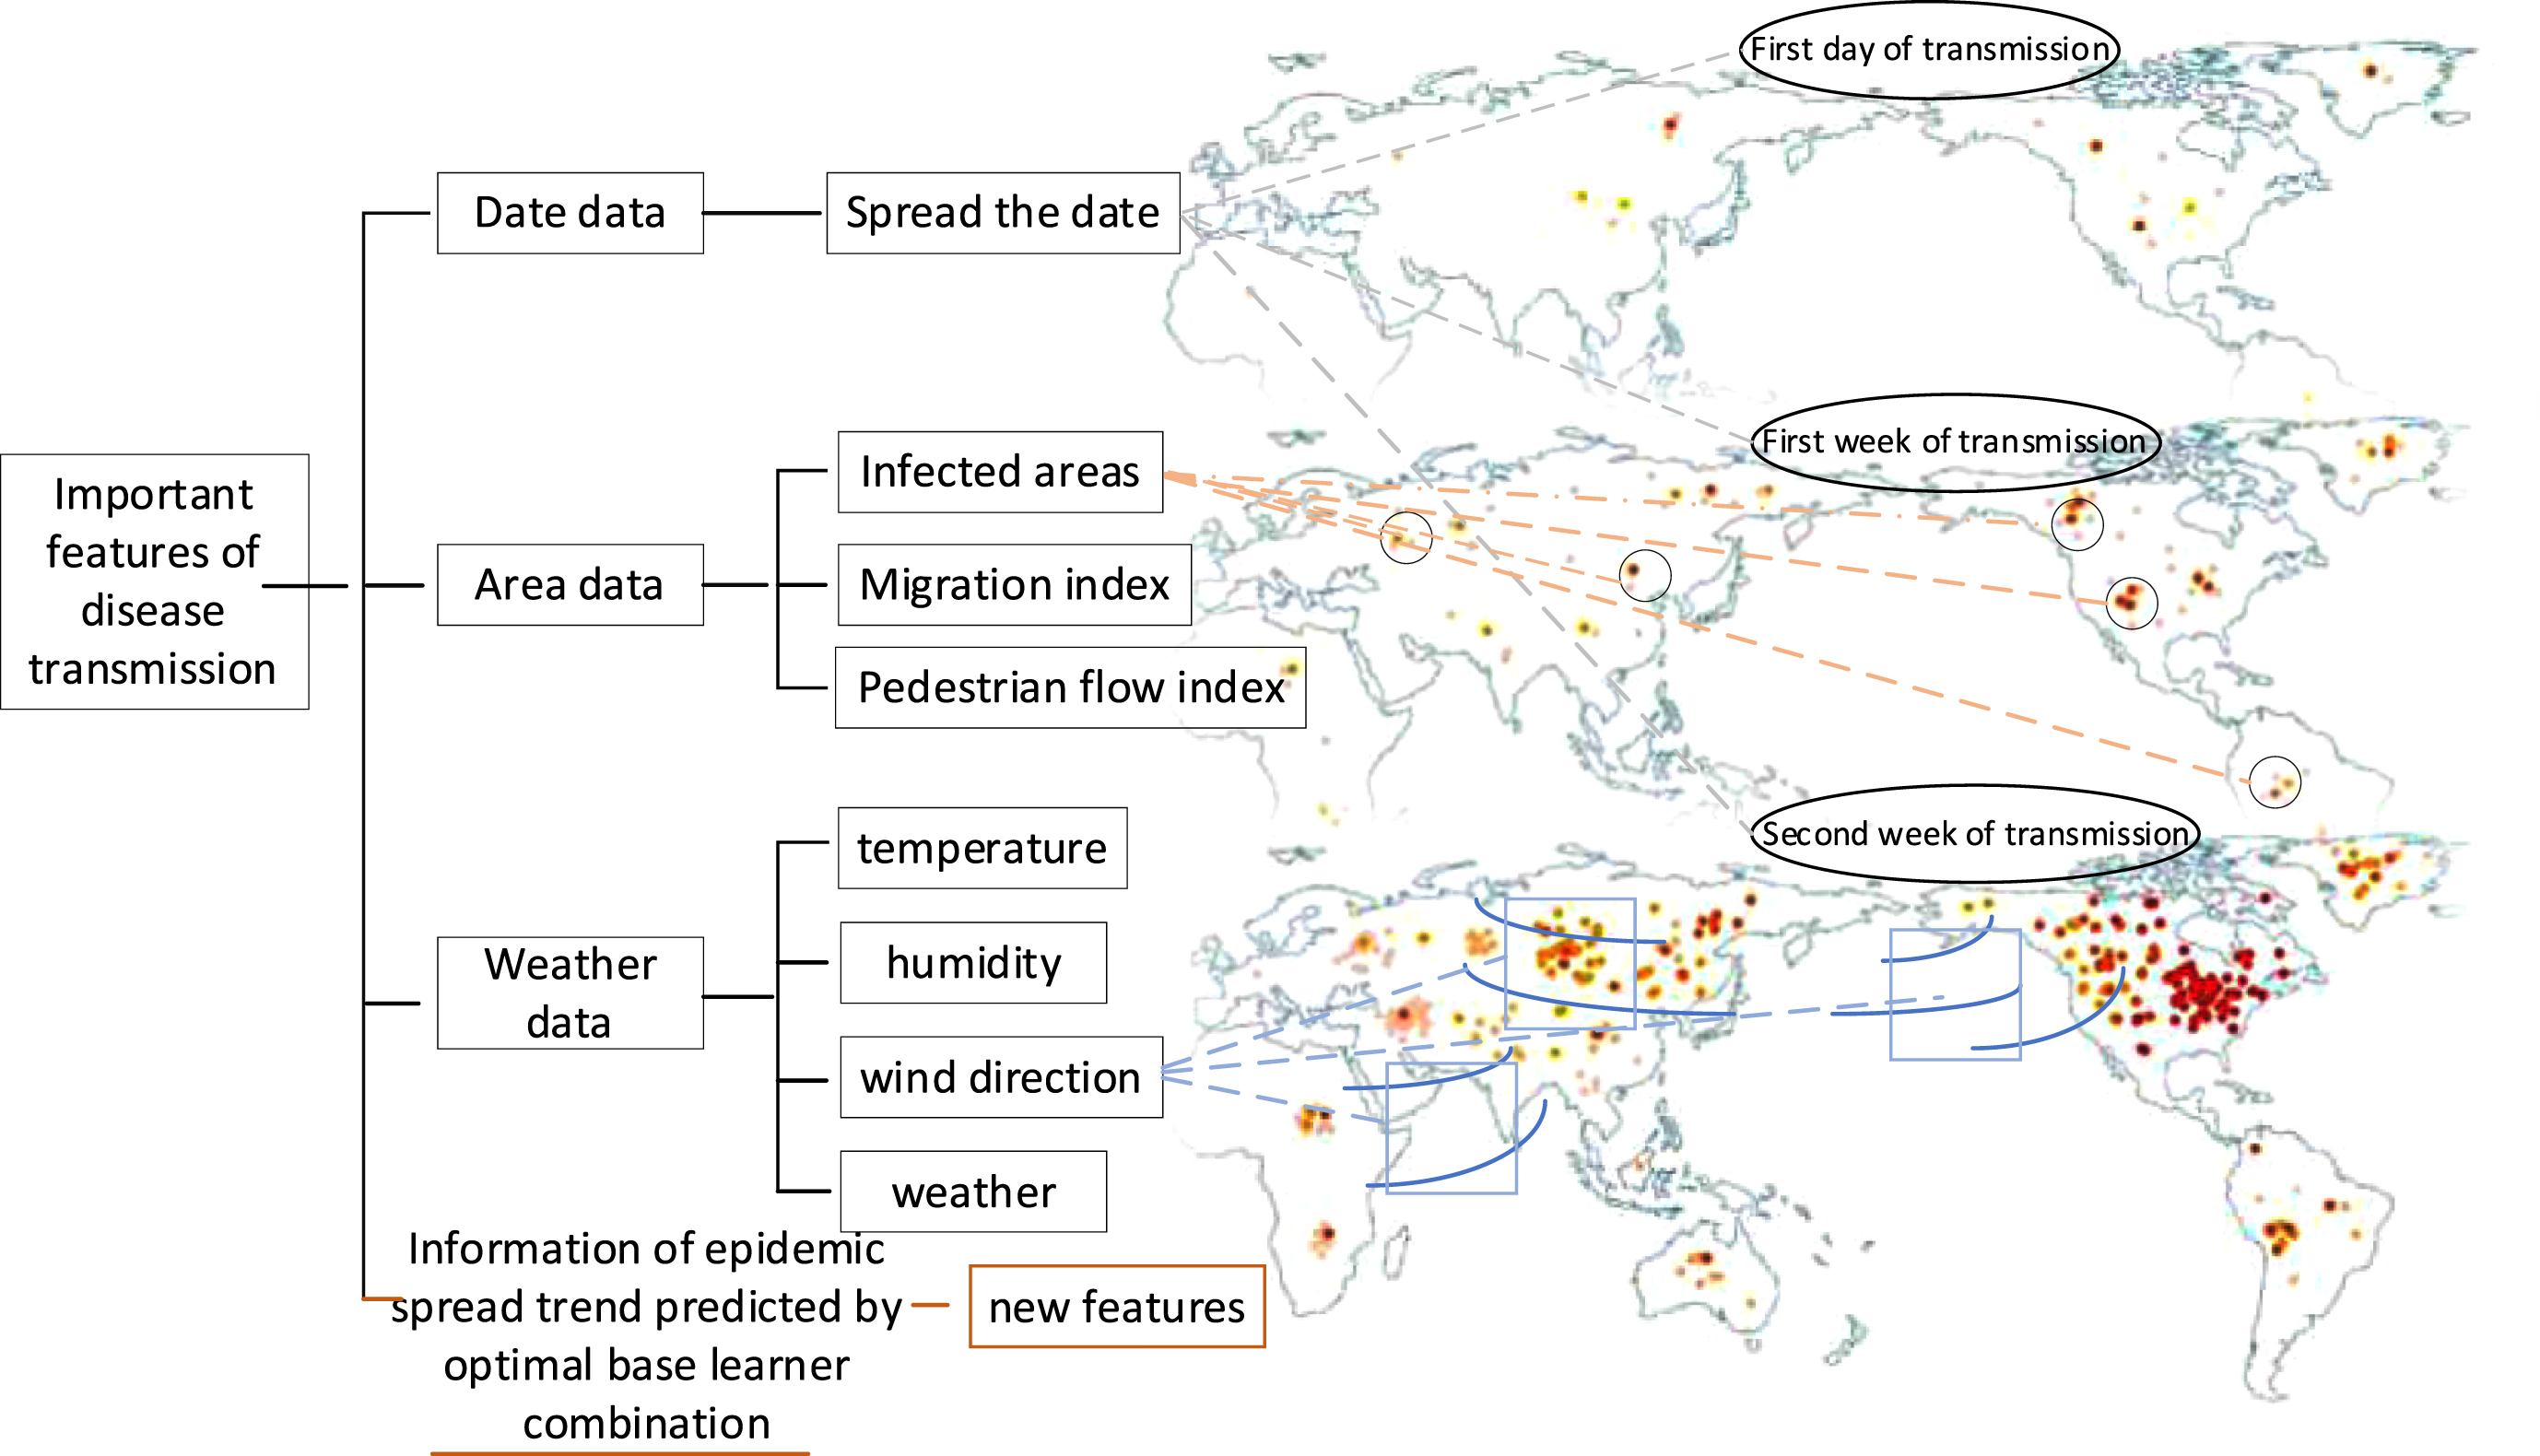
Important features.
To verify the effectiveness of the GA adjustment and merit-based learner combination, sub-learners, and extended sub-learners data dimension methods, the learners in the BOX of this model were used as sub-learners one by one to conduct comparison experiments with the traditional ensemble model for infectious disease transmission prediction. The experimental results are shown in Tables 5 (GAE-RF, GAE-XGBoost, . . . GAE-LGBM denote the GAEEM with RF, XGBoost, . . . GAE-LGBM in BOX as sub-learners, respectively).
Model prediction performance for data by city
Model prediction performance for data by city
Table 5(a) shows the performance of epidemic transmission prediction with any learner in the BOX as a sub-learner. The R2 differences between the sub-learners selected by the GA layer in GAEEM and the worst performing sub-learners on the six urban epidemic datasets are 0.071, 0.083, 0.076, 0.047, 0.112, and This indicates the stability of the GAEEM based ensemble and re-ensemble approach for fitting complex data such as an epidemic. Table 5(b) compares the prediction performance of the GAEEM and the traditional ensemble model. It is intuitive to see that GAEEM outperforms the traditional ensemble model in R2 for epidemic data in six cities and has more petite MAE and MSE, which further validates that GAEEM is based on GA adaptive ensemble-based re-ensemble and prediction-based re-prediction. Ensemble-based and prediction-based can fit the data well and predict the transmission of the epidemic.
GAEEM outperforms the traditional ensemble model for all evaluation metrics in the other city datasets. DF21 did not fit well enough on each city dataset, with an average R2 of about 0.395. However, GAE-DF21 fit well on each city dataset, with an average R2 of about 0.765, and was significantly improved compared to the performance of DF21 on each city dataset. The fit of AdaBoost to the city F data was poor, with an R2 of 0.171. However, when it was used as a sub-learner for GAEEM, its fit improved significantly, and the MSE decreased from 105492 to 37734. For city A, all models fit the epidemic transmission data of city A better than other traditional ensemble models, with the R2 of GBDT reaching 0.754, and the R2 of GAE-GBDT is 0.792 higher than that of GBDT, which has a better fitting performance. The R2 of GAE-LGBM and GAE-CatBoost exceeded 0.8, while the R2 of LGBM and The mean R2 of CatBoost was 0.736. The MAE and MSE of GAA-LGBM also reached the lowest in the modelled experiments.
Figure 5 shows the R2 performance of GAEEM and the traditional ensemble model on each city dataset. The fitting performance of DF21, AdaBoost, CatBoost, and LGBM models on each city dataset is unstable. GAEEM has stable, appropriate implementation on the city dataset compared with other ensemble models and shows good generalization. DF21, CatBoost, and LGBM fit on the city E dataset’s fitting performance vary more than other models. AdaBoost fit on the city F dataset performs much less than on other city datasets. This demonstrates that GAEEM positively improves the model’s fit by extending the data dimension by constructing new features at the sub-learner layer that contain information on the prediction of infectious diseases to predict again based on the forecast. It also improves GAEEM’s fitting effect compared with the traditional ensemble model and has a more stable and fit performance across datasets.
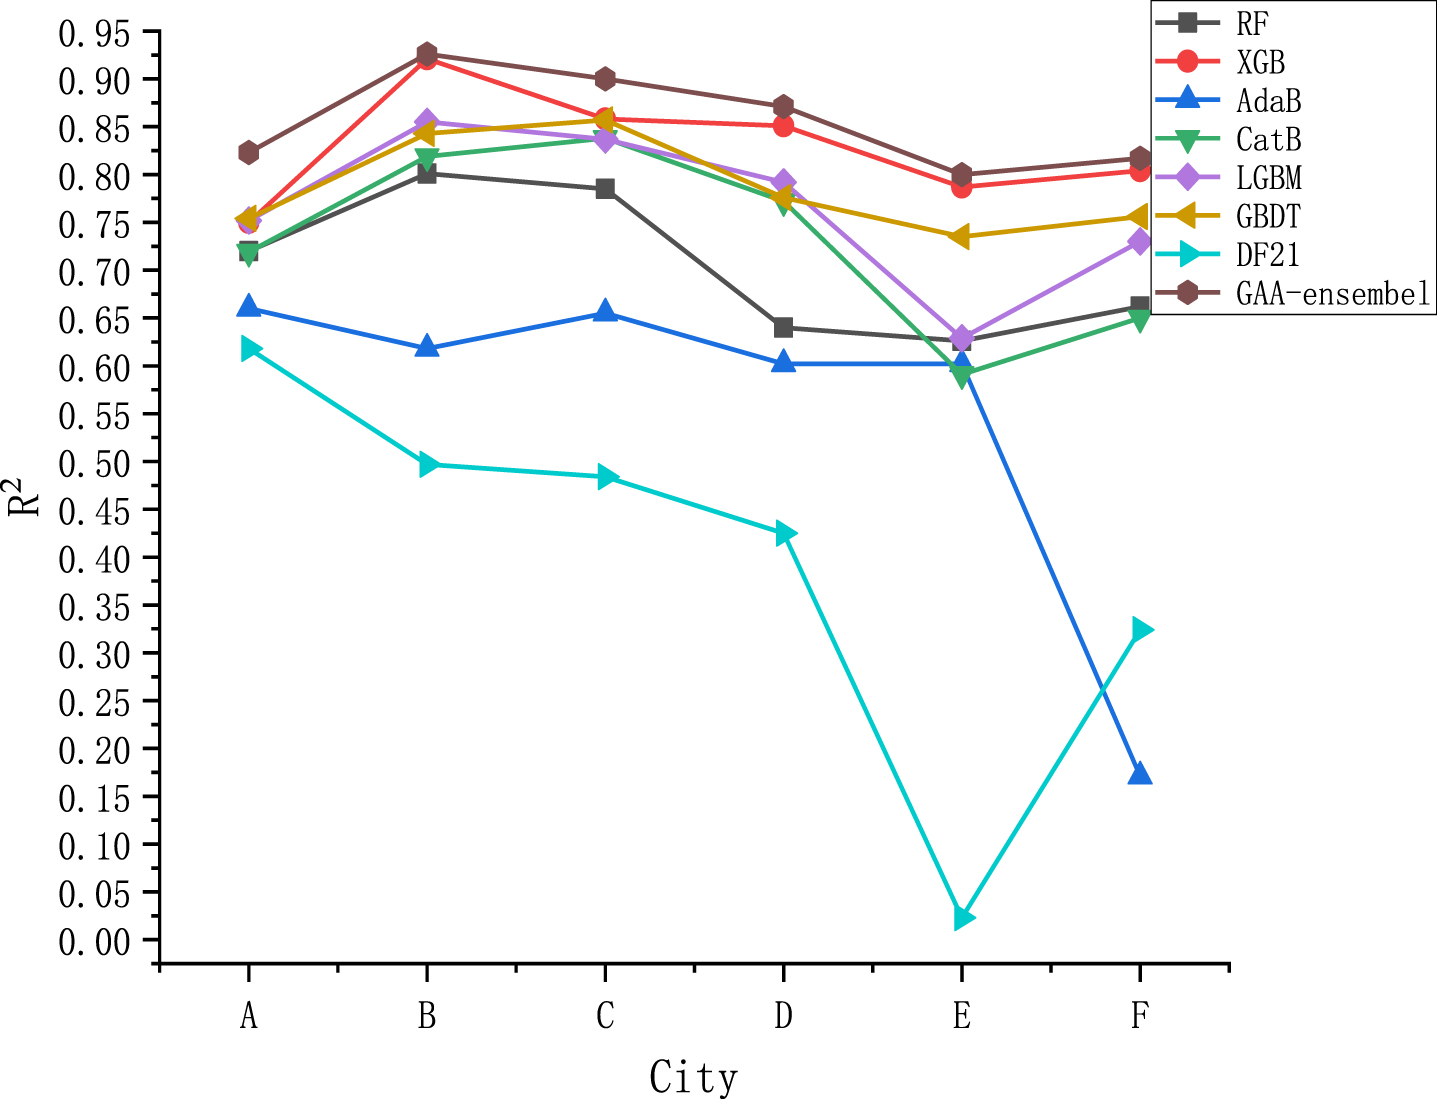
Fitting comparison of each model.
Figure 6 depicts the actual situation of daily epidemic transmission trends in the six cities compared with the GAEEM predictions, using the date of transmission as the independent variable and the number of new infections as the dependent variable. Four outbreaks of different sizes in the number of new conditions occurred during the 14 consecutive days of epidemic development in each of the six cities. The number of new infections continued to show an upward trend after the outbreak phase. In general, the number of new conditions increased explosively in these 14 days, and the epidemic rapidly spread. Six cities had different scales of growth in the number of new infections due to objective reasons such as the size of the urban population and various efforts to prevent and control the epidemic. During the outbreak phase, city C had the smallest number of new infections, maintaining a growth scale of about 100,000. The number of new conditions in cities A, B, E, and F remained in the range of several hundred thousand. The number of new infections in city D reached about one million.
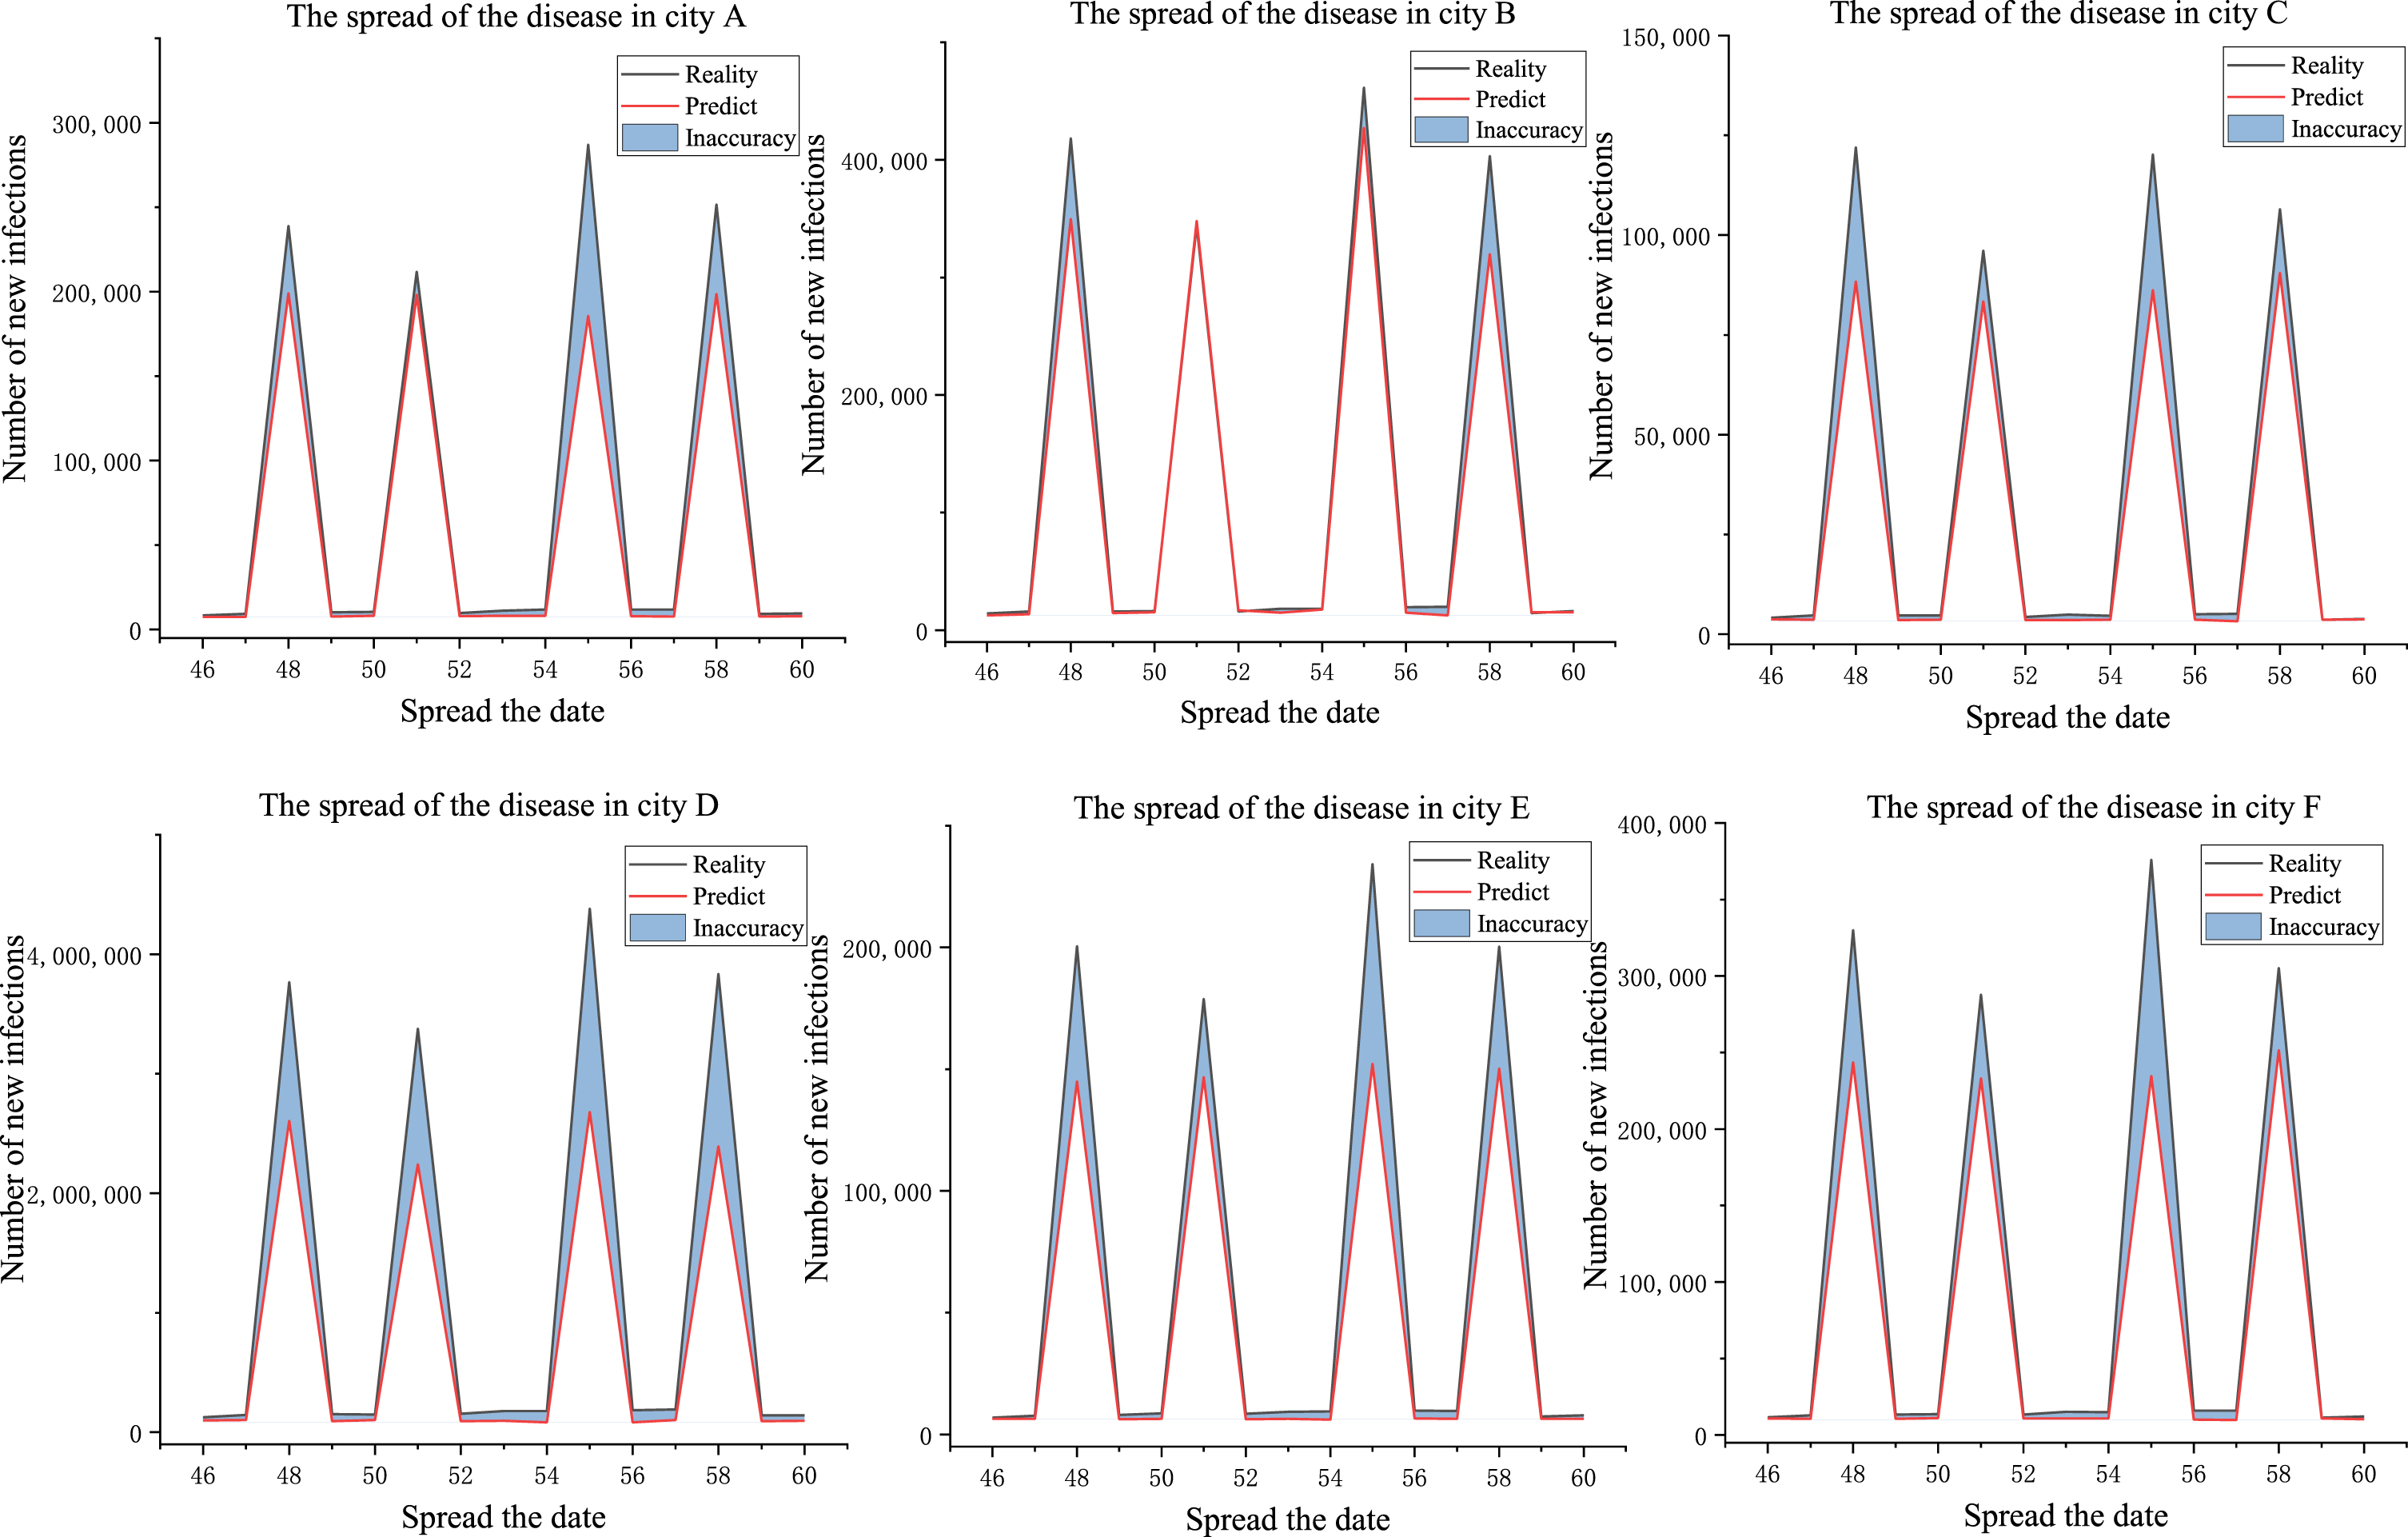
Comparison of trends in the spread of the epidemic.
From the perspective of epidemic transmission trend prediction, GAEEM can well predict outbreak periods and outbreak trends and can more accurately predict fluctuations in the number of new infections due to epidemic development. The number of new conditions in each city showed explosive growth four times during the 14 days, and although the growth rate slowed down after the explosive growth, the graph shows that GAEEM can accurately predict such fluctuations. From the perspective of data fitting, GAEEM indicates the number of new infections during an epidemic outbreak, although there are errors with the actual situation. The conservative prediction method of GAEEM does not accurately fit the number of new conditions. Still, it does not exaggerate the number of new infections, and this conservative prediction method makes GAEEM. This conservative prediction approach allows GAEEM to fit the transmission trend accurately. This is particularly evident in City B, where GAEEM accurately fits the number of new infections and the trend of new conditions during days 50 to 52 and 54 to 56, the two phases of the outbreak.
In summary, for the ensemble strategy: the GAEEM uses the traditional ensemble model as the base learner and adapts and chooses the best combination of base learners and sub-learners according to GA. This approach allows GAEEM to use any learner in the BOX as a sub-learner and outperform the respective comparative ensemble model on each city dataset. GAEEM can adaptively select sub-learners from the learner box based on the optimal fitness value, thus further improving the model performance. In terms of epidemic transmission prediction: the GAEEM can extend the data dimension with the prediction information of epidemic transmission with the optimal base learner combination as a new feature based on the traditional ensemble model. This enables the data in the model to be enriched with a large amount of predictive information about the direction of epidemic transmission, which helps the model to fit more accurately to the data of epidemics, which are complex and changing. The experimental results also validate that GAEEM is a good fit for all urban epidemic datasets and more accurately predicts the transmission trend of the epidemic.
In this paper, we propose an evolutionary ensemble model based on GA(GAEEM) to predict the transmission trend of the epidemic. It is demonstrated experimentally by predicting the transmission trend of the epidemic that the model can cope well with the epidemic’s complex and nonlinear data task based on ensemble and prediction again, and also reduces the risk of traditional ensemble strategies. It performs better than traditional ensemble models in predicting the trend of epidemic transmission.
Future experiments will consider the following. In the face of data with complexity and temporality, such as the epidemic, we consider introducing other techniques to improve our work so that our model can have a strong learning capability and, simultaneously, be real-time. Many novel evolutionary algorithms are being proposed for task optimization, and we will try to integrate them with novel techniques in the future. Since the content of this work is still in the context of traditional machine learning, the feature engineering work still needs to be integrated. We would like to further integrate this part with the model in the future so that the model can be generalized and extended to high-dimensional data tasks. Since the prediction of the epidemic is very dependent on time, weather, region, regional changes in human mobility, etc., and to accurately grasp the outbreak of infection, the time scale must be reduced to hours or even smaller, focusing on the analysis of data during the outbreak period. However, this dramatically increases the data analysis effort. Therefore, future work would like to include the above considerations for the more accurate outbreak and transmission trend predictions.
Credit authorship contribution statement
Declarations
Conflict of interest
The authors declared that they have no conflicts of interest to this work.
Footnotes
Acknowledgments
This work was supported by the Doctoral Program of Northern MinZu University (Grant No.2020KYQD48); the 2022 Ningxia Autonomous Region Key Research and Development Plan (Talent Introduction Special) Project(2022YCZX0013); the 2022 University Research Platform “Digital Agriculture Empowering Ningxia Rural Revitalization Innovation Team” of Northern University for Nationalities (2022PT_S10); and the major key project of school-enterprise joint innovation in Yinchuan 2022 (2022XQZD009).