
Abstract
Gini coefficient is a device to characterize dispersion of uncertain variables. In order to measure variation of uncertain variables, the concept of Gini coefficient for uncertain variables is proposed. By invoking inverse uncertainty distribution, we obtain a formula for calculating Gini coefficient for uncertain variables. As an application of Gini coefficient, portfolio selection problems for uncertain returns are solved via mean-Gini models. For better understanding, several examples are provided.
Keywords
Introduction
Mean-Gini portfolio selection model with random returns was proposed by Yitzhaki [29] and Shalit and Yitzhaki [22]. In fact, in this approach, Gini coefficient was considered as a risk measure rather than variance in mean-variance Markowitz model [18]. After that, several authors devoted their studies to the case of portfolio selection via considering other risk measures. Konno and Yamazaki [14] optimized portfolio selection problems of random returns via mean-absolute deviation models. Favre and Galeano [7] discussed about mean-modified value at risk optimization with hedge funds. By invoking value at risk, Agouram and Lakhnati [1] solved portfolio selection of random returns.
However, in an indeterminate economic environment, it is not possible to predict accurately the future returns and risks associated with the various financial assets, based exclusively on historical data. Fuzzy set theory can deal with indeterminacy and vagueness which are usual features of any stock market. Fuzzy logic [30] can express vague knowledge making it suitable for representing the inherent indeterminate nature of the portfolio optimization problem. Some scholars devoted their works to the case of portfolio selection problem, for instance [5, 24]. Furthermore, Sadjadi et al. [15] introduced different rates for borrowing and lending into the multi-period portfolio optimization model with fuzzy returns. Bertsimas and Pachamanova [4] handled the fuzzy multi-period portfolio optimization problem with the assistance of a computationally efficient robust optimization approach. Zhang et al. [32] proposed a mean semi-variance-entropy model for fuzzy multi-period portfolio selection. Qin et al. [20] introduced the concept of cross entropy for fuzzy variables and applied it to portfolio optimization model with fuzzy returns. Also, Wu et al. [25] studied multi-criteria group decision-making for portfolio allocation with consensus reaching process under interval type-2 fuzzy environment.
As described in [17], some authors have noted that human uncertainty is not adequately described by fuzziness. This fact was one of the reasons why Baoding Liu founded uncertainty theory. In fact, in many situations, we face with lack of data to derive empirical distribution functions. In order to model in these situations, Liu [16] proposed the concept of uncertain variables as a main devise in uncertainty theory rather than fuzzy variables in fuzzy set theory. Now, we recall some related papers in the case of portfolio selection for uncertain returns. Qin et al. [21] optimized the portfolio selection problems for uncertain returns via mean-variance models. By invoking risk curve, Huang [11] solved portfolio selection problems for uncertain returns via mean- risk models. After that, Huang [12] proposed the concept of risk index for uncertain returns and applied it to portfolio optimization. Kar et al. [13] optimized portfolio selection problems with uncertain returns by considering value at risk and sharp ration as the risk measures. By minimizing semi-absolute deviation, Qin et al. [19] solved portfolio problem for uncertain returns. Furthermore, Zhou et al. [33] obtained optimal portfolio-proportions of uncertain returns via mean-entropy models. Bhattacharyya et al. [3] applied mean-entropy-skewness to uncertain portfolio problems with transaction costs.
It is mentioned some risk measures such as variance and absolute deviation are strongly dependent to expected value(mean). Also, some other risk measures such as semi-variance, semi-entropy and semi absolute deviation are down risk measures and consider the values less than mean. Furthermore, other measures such as skewness is affected by symmetry of distributions. But, Gini coefficient can well reflect the dispersive degree of the portfolio return no matter if the uncertainty distributions are symmetric or not. In addition, in mean-Gini model, we encounter with linear programming rather than quadratic programming in mean-variance model.
In this paper, we present the concept of Gini coefficient for uncertain variables and obtain a formula via inverse uncertainty distributions. Also, we explain Gini coefficient of uncertain variables as an expectation of random variables and apply this property to compute Gini coefficient via Monte-Carlo simulation. As an application of Gini coefficient, we optimize portfolio selection problems with uncertain returns via mean-Gini models.
This paper is organized as follows. Some preliminaries about uncertain measure, uncertain variable, expected value, variance and covariance are recalled in Section 2. Definition of Gini coefficient for uncertain variables is proposed and some properties of this concept is investigated in Section 3. As an application of Gini coefficient, portfolio selection problem is optimized via mean-Gini models in Section 4. Finally, some conclusions are derived in Section 5.
Preliminaries
In this section, we recall some preliminaries about uncertain measure, uncertain variable, uncertainty distribution, operational law, expected value and so on.
Axiom 1: (Normality Axiom) M {Γ} =1.
Axiom 2: (Normality Axiom) M {A} + M {A
c
} =1 for any event
Axiom 3: (Subadditivity Axiom) For every countable sequence of events A1, A2, ⋯ , we have
Axiom 4: (Product Measure Axiom) Let Γ
k
be nonempty sets on which Mk are uncertain measures, k = 1, 2, ⋯ , n respectively. Then the product uncertain measure M is an uncertain measure on the product σ-algebra
It is clear that a regular uncertainty distribution Φ (x) has an inverse function on the range of x with 0 < Φ (x) <1, and the inverse function Φ-1 (α) exists on the open interval (0, 1).
The following theorem provides an operational law for calculating the uncertainty distributions of strictly increasing function.
Expected value is the average value of uncertain variable in the sense of uncertain measure.
The variance of uncertain variable provides a degree of the spread of the distribution around its expected value.
Gini coefficient for uncertain variables
In this section, we present the concept of Gini coefficient for uncertain variables. Also, a formula for calculating Gini coefficient of uncertain variables is obtained via inverse uncertainty distributions. It is mentioned that Gini coefficient is a single number that demonstrates a degree of inequality in a distribution of income. As similar to variance, Gini coefficient measures dispersion of income variables.
First, we recall the concept of Gini coefficient for random variables which presented by Dorfman [6].
By inception of relation (1), we propose the concept of Gini coefficient for uncertain variables.
In many situations, we encounter with some new markets and we have not enough frequency to estimate empirical distribution function. Therefore, we assign uncertain variables to the securities. Also, we invoke uncertainty distribution functions rather probability distribution functions.
Suppose we have n securities with uncertain returns τ1, τ2, ⋯ , τ
n
, respectively. Also, consider x
i
’s as investment proportions in security i, i = 1, 2, . . . , n . We consider
Therefore, the above mean-Gini models can be converted to the following optimization problems.
Uncertain Securities
Uncertain Securities
Now, we want to optimize portfolio selection of uncertain returns via maximizing mean under constrained Gini coefficient. Thus, model (1) can be converted to the following crisp model. Optimal solutions are displayed in Table 2.
Optimal Values in Model (3)
Here, we want to optimize portfolio selection of uncertain returns via minimizing Gini coefficient under constrained expected value. Thus, model (2) can be converted to the following crisp model. Optimal solutions are displayed in Table 3.
Optimal Values in Model (4)
Furthermore, we want to compare above model with mean-variance model. Thus, we consider portfolio selection problem via minimizing variance under constrained expected value.
By using linearity property of expected value and Theorem 2, above model converted to the following quadratic model.
It is mentioned that several authors invoked performance ratio for compared their proposed model with other models, for instance [2, 27]. Therefore, for comparing mean-variance and mean-Gini models with together, we recall the performance ratio as follows:
For same fixed δ in model (4) and (5), we obtain optimal proportions and its related performance ratio in model (4) and (5). Also, we iterate this procedure for the same value of δ in model (4) and (5). In fact, we consider the pair (PRMG, PRMV) for any fixed δ, where, PRMG and PRMV are performance ratio in model (4) and (5), respectively. Finally, we invoke Wilcoxon-nonparametric test for related samples in SPSS software for detecting significant difference between performance ratio in model (4) and (5). Figure 1 implies there is not significant difference between performance ratio in model (4) and (5). It is mentioned that we encounter with linear programming in mean-Gini model rather than quadratic programming in mean-variance model. Also, variance of total return has
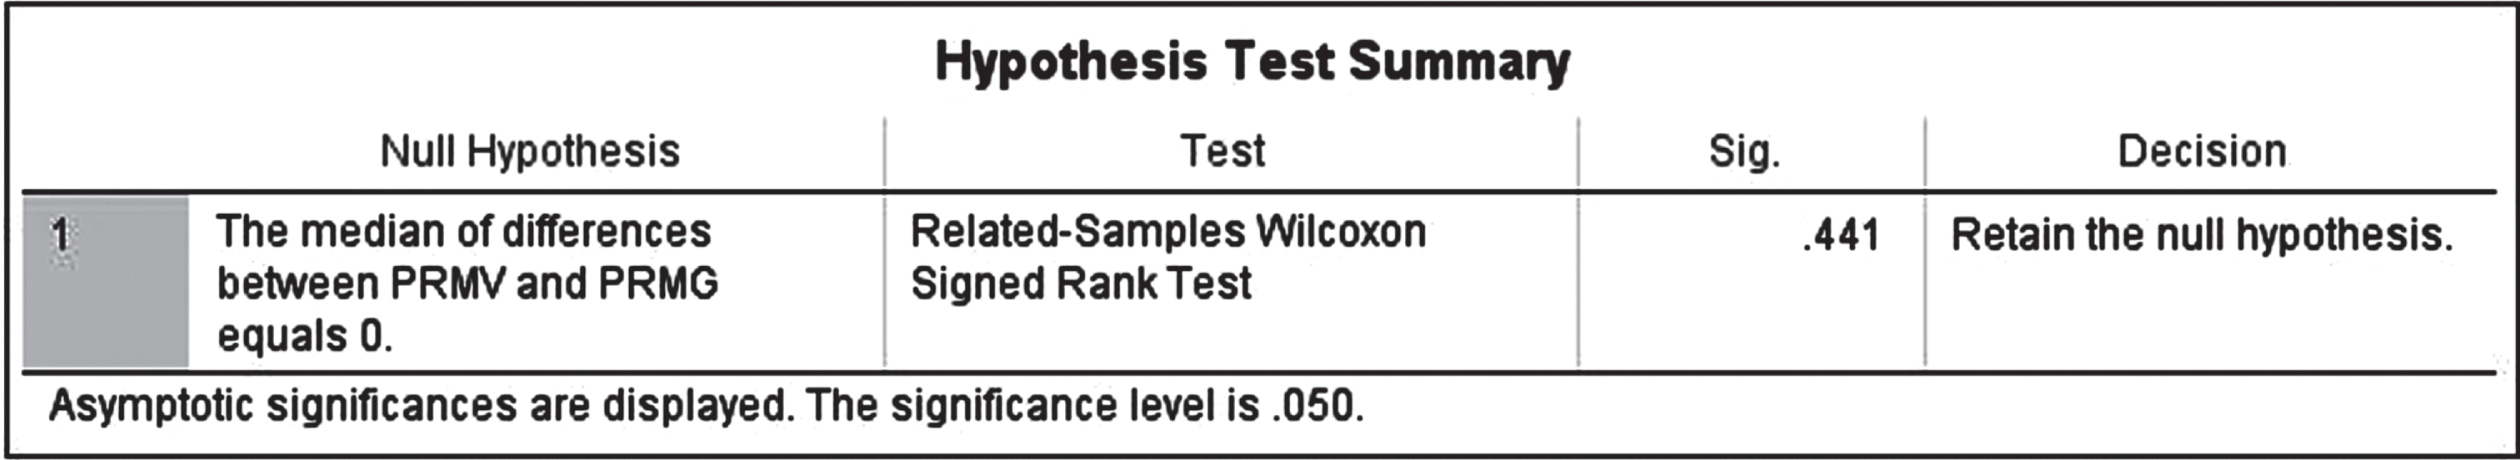
Comparative analysis of difference between performance ratio for same values of δ in model (14) and (15).
This paper proposed the concept of Gini coefficient for uncertain variables as a risk measure, and investigated its properties. Also, Monte-Carlo simulation was presented for calculating Gini coefficient of uncertain variables. For better illustration of main results, we showed how portfolio selection of uncertain returns can be solved by invoking mean- Gini model, and provided several examples. In order to compare mean-Gini model with mean-variance one, Wilcoxon nonparametric test was applied to the pair of performance ratio in mean-Gini and mean-variance model. Although, there was not significant difference between performance ratio in mean-Gini and mean-variance models. Since, Gini coefficient of total return has n terms, whiles, variance of total return has
Footnotes
Acknowledgements
This work was supported by National Natural Science Foundation of China (Grant No. 72101080), Natural Science Foundation of Hebei Province (Grant No. F2020202056), and the Key Project of Hebei Education Department (Grant No. ZD2020125).
Compliance with ethical standards
Conflict of interest
The authors declare that they have no conflict of interest.
Ethics statement
This work did not involve any active collection of human data.
Competing interests statement
The author declares that there is no conflict of interests regarding the publication of this paper.