
Abstract
Models prediction is done for accurately anticipating metal removal rate (MRR), machine power (MP), and estimated tool life (ETL), which are vital in the industrial setup for better precision and higher speed. Cutting speed (CS) and feed rate (FR) were employed as controlling parameters for machining of P8 material on the SBCNC 60. By maintaining one of the two parameters constant at the mid-level, data from drilling experiments are sampled and examined. Application of ANOVA yields that the feed rate is 52.61 percent significant and the cutting speed is 46.49 percent significant for MRR, while cutting speed contributes 57.59 percent and feed rate contributes 41.77 percent to the machine power, and the same cutting speed contributes 83 percent to ETL’s output. The analysis results that CS at 190 m/min and FR at 0.3 mm/rev are optimal combinations of input control parameters for all output of drilling operations. The development of prediction models is done by fuzzy and its comparison is carried out with classical regression method for the achievement of optimum MRR, MP and ETL. Numerical parameters for establishing the optimum model are calculated for MAPE, RMSE, MAD, and correlation coefficient between experimental values and the values obtained from regression, and fuzzy logic predictions. MAPE, RMSE, MAD, and correlation coefficient calculated 1.27%, 2.43, 1.89, and 0.99 for MRR,0.97%,0.10, 0.09 and 0.997 for MP and 5.12%,1.01,0.67 and 0.99 for ETL respectively. Hence, the proposed fuzzy logic rules effectively predict the MRR, MP, and ETL on P8 material with optimized performance.
Keywords
Introduction
On the industrial demand for increased accuracy, quicker processing rates, and a high-quality surface finish, there is an overwhelming need to develop models that can effectively forecast metal removal rate (MRR), which is a significant aspect in process industries. Higher metal removal rates are a constant need in the manufacturing sector. Metal removal is achieved in different ways, which depend on the desired outcome. This is accomplished by the use of various turning, drilling, reaming, boring, and honing techniques. Surface roughness, a crucial criterion for quality, goes hand in hand with the increased removal rates of metal. Product pricing as well as quality and quantity are all critical factors in manufacturing when it comes to industrial satisfaction. The high-end machines come with a variety of choices to fulfil all of these critical needs. Five-axis mill turns, which combine milling and turning on the same machine, are also available in the market. Three-axis CNC machines are widely used to address the general machining needs in more than 90% of all industrial sectors. The SBCNC 60 HMT machine is taken into account for our investigations since we are interested in helping a large portion of industries. However, this CNC machine is limited to turning and drilling operations due to its inability for performing milling operations. Drilling is a common manufacturing procedure. CNC machine uses cylindrical rod or billet as a raw material which is mounted on a clamping chuck and its cutting tools are clamped on the turret. Rotating the chuck and cutting the workpiece through tools mounted on the turret through programming for obtaining the desired product. Machine power, estimated tool life, and MRR are examined on final outcomes in metal cutting procedures to obtain the optimum model. To ensure that the machined surface has a large MRR and ETL with moderate machine power, the process parameters must be carefully selected. With optimal cutting parameters, machining processes can be more profitable. P8 material was subjected to a machining (drilling operation) experiment using SBCNC 60 and parameters like cutting speed and feed rate are examined to better understand its functions. Artificial intelligence (AI) was utilized to construct models of a reliable nature for generating predictions to identify the model of MP, ETL, and MRR. The other excellent way to understand information that isn’t totally obvious, the fuzzy logic theory is a useful tool. Fuzzy logic (FL) is used in this study to create a prediction model that may be used to improve machine power, estimated tool life, and MRR responses. Uncertain information can be understood using the fuzzy logic theory. By deconstructing the predictive model, the author of this research is able to improve MP, ETL, and MRR responsiveness using fuzzy logic. Using an FL technique of modeling for determining optimal or nearest optimal cutting conditions for metal cutting has yielded intriguing resultant outcomes. To put it another way, FL has a distinct advantage over a standard controller in terms of how quickly it responds to complex inputs. Most research disciplines can now benefit from FL, especially those characterized by high complexity and uncertainty. This design can easily construct portray of a complicated interaction with less resources and equipment than the other types. Membership function (MF) with values between zero and one replaces the typical capacity of a set in Zadeh’s 1965 extension of the set hypothesis [1]. Fuzzy logic is used in this research to make predictions about the MP, ETL, and MRR of drilling operations. We test the efficacy of the suggested fuzzy logic models by comparing their predictions to both the observed experimental data and a regression model. By calculating the MAPE, RMSE, MAD, and correlation coefficients between experimental data and the values obtained through regression model forecasts, and fuzzy logic predictions, the predictive efficacy of the FL model could be better analyzed. This work is on a broad spectrum that involves the optimize MRR which effectively reduces cycle time, and by optimizing effective tool life achieves low tool cost and by optimize machine power helps to lower power consumption which greatly helps industries in increasing overall effectiveness. The best features of the paper are highlighted by dividing it: Fuzzy logic and overall introduction are discussed in Section 1; writing reviews and inspirational ideas to the current work are discussed in Section 2; SBCNC60, experimental data, ANOVA, regression, and fuzzy rule-based modeling are discussed in Section 3; the results, experimental and predictive value of MAPE, MAD, RMSE, and correlation coefficient are discussed in Section 4; the paper is concluded in Section 5 with futuristic scope.
Literature survey
Research into machining optimization has been ongoing using different optimization techniques. For a single-pass turning operation, W.W. Gilbert [2] employed an analytical approach to determine the cutting speed that minimizes the machining price. R C Brewer worked on Lagrangian multipliers to solve the constraint of the unit cost problem, with the primary constraint being reduced power [3]. According to Bhattacharya et al [4], cutting power and SR restrictions can be used to optimize turning unit cost. Geometric programming was discussed by Walvekar and Lambert [5]. Change in the CS and FR for the manufacturing process could save money. Geometric programming was used in Petros G. Petropoulos [6] to determine the appropriate machining rate variables. The efficiency of a turning difficulty was improved by using an ISO P-10 grade cemented carbide tool and an SAE 1045 steel shaft. Sivam et al. establish optimal machining conditions for the production of magnesium products, particularly AM60 magnesium alloy. Predefined input parameters are applied to the drilling operation, and the resulting data is analyzed. One of the inputs is the tempering cycle used on the cryogenically treated drill bit. To test the efficiency of the drilling process at regulated input parameters like cutting speed, feed, time, and drill bit treatment, we analyze these responses with ANOVA [7]. The effect of boron carbide powder (B4 C) in dielectric fluid on electrical discharge machining (EDM) of Inconel X-750 alloy is studied by BASHA Shaik Khadar et al. MRR, Surface Roughness, and Recast Layer Thickness were measured as a function of process parameters discharge current (Ip), pulse on time (Ton), pulse off time (Toff) and B4 C powder concentration (RLT). The outcomes of multi-objective optimization showed that Ip and Toff are more important, while V and Ton are less so. Taguchi-TOPSIS, a multi-optimization method, was subjected to an analysis of variance (ANOVA). Based on findings from Taguchi-TOPSIS performance characteristics, a mathematical equation was developed [8]. Polymethylmethacrylate contact focal point polymer machining limits were discussed by Muhammad Mukhtar et al. (2019). Using the fuzzy logic framework, they demonstrate that normal prediction error for Ra (1.495 percent), as well as ESC (1.78 percent) and MRR (5.80 percent), using inflexible PMMA contact focal point polymers in automated optical assembly settings for higher accuracy [9]. It has been shown that the hypothesized fuzzy model is extremely successful for thrust force and torque. R. Vinayagamoorthy et al. exhibited the thrust force and torque analysis using fuzzy logic and found that the average error was 0.77 percent for thrust force and 1.22 percent for torque [10]. The regression and fuzzy logic methods were used by P. Kovac et al. to develop a model for SR in face milling. When it comes to surface roughness, the fuzzy logic modeling method was found more accurate than regression analysis with a 7.41 percent average deviation [11]. When it comes to improving Inconel 825’s manufacturing quality, FL, GRA, and TOPSIS were utilized by Neel Sanghvi et al. to evaluate the MRR and SR optimized values [12]. They discovered TOPSIS, an order preference method based on resemblance to the ideal solution that outperforms fuzzy and GRA in terms of the difference index. AISI 4140 grade steel was subjected to a comparison of the mean squared errors of three different surface roughness prediction models developed by Harun Akkus et al. using fuzzy logic, ANN, and regression analysis. They found that the optimal fuzzy prediction model has a minimum MSE of 0.0173166 [13]. Drilling experiments were conducted on PMMA to assess the impact of process parameters (drill diameter, spindle speed, and feed rate) on the hole-quality characteristics (surface roughness, circularity error, and cylindricity error) according to Susan et al. An artificial neural network (ANN) was used to analyze drilling data. It was found that drilling of PMMA requires lower spindle speeds and high feed rates when the integrity of the drill hole is the main quality criterion [17]. It was proposed by Mozammel Mia et al. that RSM, fuzzy logic, and simulated annealing (SA) techniques be used to improve the numerical model for SR turning of AISI 1060 grade steel with carbide tooling in the absence of coolant. They discovered 99.64 percent accuracy in the RSM model, 79.82 percent accuracy in the forecasts using the FIS model, and above 70 percent accuracy in the forecasts using the SA model [15]. The experimental method for gauging electrical discharge performance and geometric defects in machining was presented by Abderrahim Belloufi et al. A fuzzy logic-based multi-output system has been recommended as a means of determining machining parameters. The goal of that research was to determine the factors that affected machining performance and the associated geometric mistakes. They demonstrated that the fuzzy model can produce accurate predictions that closely match observed data. Material removal rate error was about 1.51 percent, tool wear rate error was about 3.386 percent, wear rate error was about 2.924 percent, surface roughness error was about 5.285 percent, the radial overcut error was about 4.004 percent, circularity error was about 4.381 percent, and cylindrical error was about 2.937 percent [31].The processing of ceramics with high material removal rate and high surface integrity was described by V Pardha Saradhi et al. Among the many methods employed in modern industry for processing challenging materials, LAM is a standard method. Using the proposed model, one may anticipate the SR and MRR with an error of 15.76 and 7.69 percent [32]. Due to their outstanding mechanical properties and high corrosion resistance, NI-based alloys, specially Monel 400TM, are becoming more and more important in a variety of applications, as stated by Rajamani Devaraj et al. Due to their propensity for quick work hardening and reduced heat conductivity, these materials are incredibly tough to machine by the conventional manufacturing technique [33]. The MRR and average SR of Nimonic 80A during abrasive-mixed electro-discharge diamond surface grinding (AMEDDSG). are predicted using fuzzy logic artificial intelligence by Deepak Rajendra Unune et al. However, despite being widely accepted in the aerospace industries for its strong resistance to corrosion, fracture toughness, oxidation, and temperature, Nimonic 80A superalloy is notoriously difficult to machine. Hybrid machining techniques, such as AMEDDSG, can be used to machine this superalloy. Here fuzzy logic model can be used to accurately predict the performance of the AMEDDSG process, as evidenced by the high concordance (93.89 percent) between the fuzzy model and experimental data obtained from confirmation trials [34].
Motivation behind the present study
The research presented in this paper helps the industry by educating people on how to adjust settings in real-time to get the best possible result—a higher MRR, higher ETL with high-quality features.
The author reviewed earlier comparable predictive modeling work utilizing several techniques, which are included in Table 1. From the results it is obvious that AI-based predictive models produce superior outcomes than conventional Regression-based predictive models as studied in prior research work which is reflected in Table 1. The choice of appropriate drilling parameters is still a difficult issue that is difficult to model. Processes like drilling materials, where the nature of the process is unknown and requires the expertise of professionals, can be implemented using fuzzy set theory. Fuzzy logic offers efficient and adaptable ways to handle the nonlinear, imprecise character of real decision-making. The goal of the current effort is to build a relationship between drilling parameters such cutting speed and feed rate and the MRR, MP, and ETL that are developed during the drilling process. For that the author was inspired to create a predictive model for MRR, MP, and ETL of drilling operations for P-8 material using the fuzzy logic method. This is accomplished through the use of regression analysis and fuzzy logic in the predictive modeling of SBCNC 60.
Related research on prediction models with machining parameters and responses, taken into account by the previous researcher
Related research on prediction models with machining parameters and responses, taken into account by the previous researcher
Listed below are the most significant summaries of work done: The optimum values of the input control parameters for MRR, MP and ETL are observed for drilling operation at FR = 190 mm/rev and CS = 0.30 m/min. The fuzzy predictive model is developed using 18 rules. Regression model is predicted for 18 experimental machine run results. From Table 7, reveals that MAPE is 1.27% for MRR,0.97% for MP and 5.12% for ETL. These errors are within acceptable limits for the predicted modeling of the system using fuzzy logic. Whereas for predicting modeling using regression analysis, MAPE is high in the case of MRR and ETL. The correlation coefficient is computed as 0.99,0.997 and 0.99 for MRR,MP and ETL for the fuzzy predicted model. Correlation coefficient R is almost equal for MRR and MP in predictive modeling using regression and fuzzy logic. MAD is calculated at 1.89,0.09 and 0.67 for MRR,MP and ETL respectively for fuzzy predicted model. Similarly, MAD is calculated 2.11,0.04 and 5.65 for the regression predicted Model. RMSE is calculated 2.43,0.10 and 1.01 for MRR, MP and ETL respectively for fuzzy predicted model. Similarly, RMSE is calculated 2.78, 0.07 and 6.35 for regression predicted Model. RMSE is high in the case of MRR and ETL for regression analysis. Tables 6 7 offer the analysis and assessment of the simulation results. According to the study, experimental findings supported the expected fuzzy modeling outputs’ efficiency, which has been determined to be quite high.
Experimental Values (EV), Regression Error Predicted Values (RPV), Fuzzy Predicted Values (FPV) and Error for Drilling Operation
Experimental Values (EV), Regression Error Predicted Values (RPV), Fuzzy Predicted Values (FPV) and Error for Drilling Operation
Comparison of different performance parameters of the Regression and Fuzzy Predicted Model
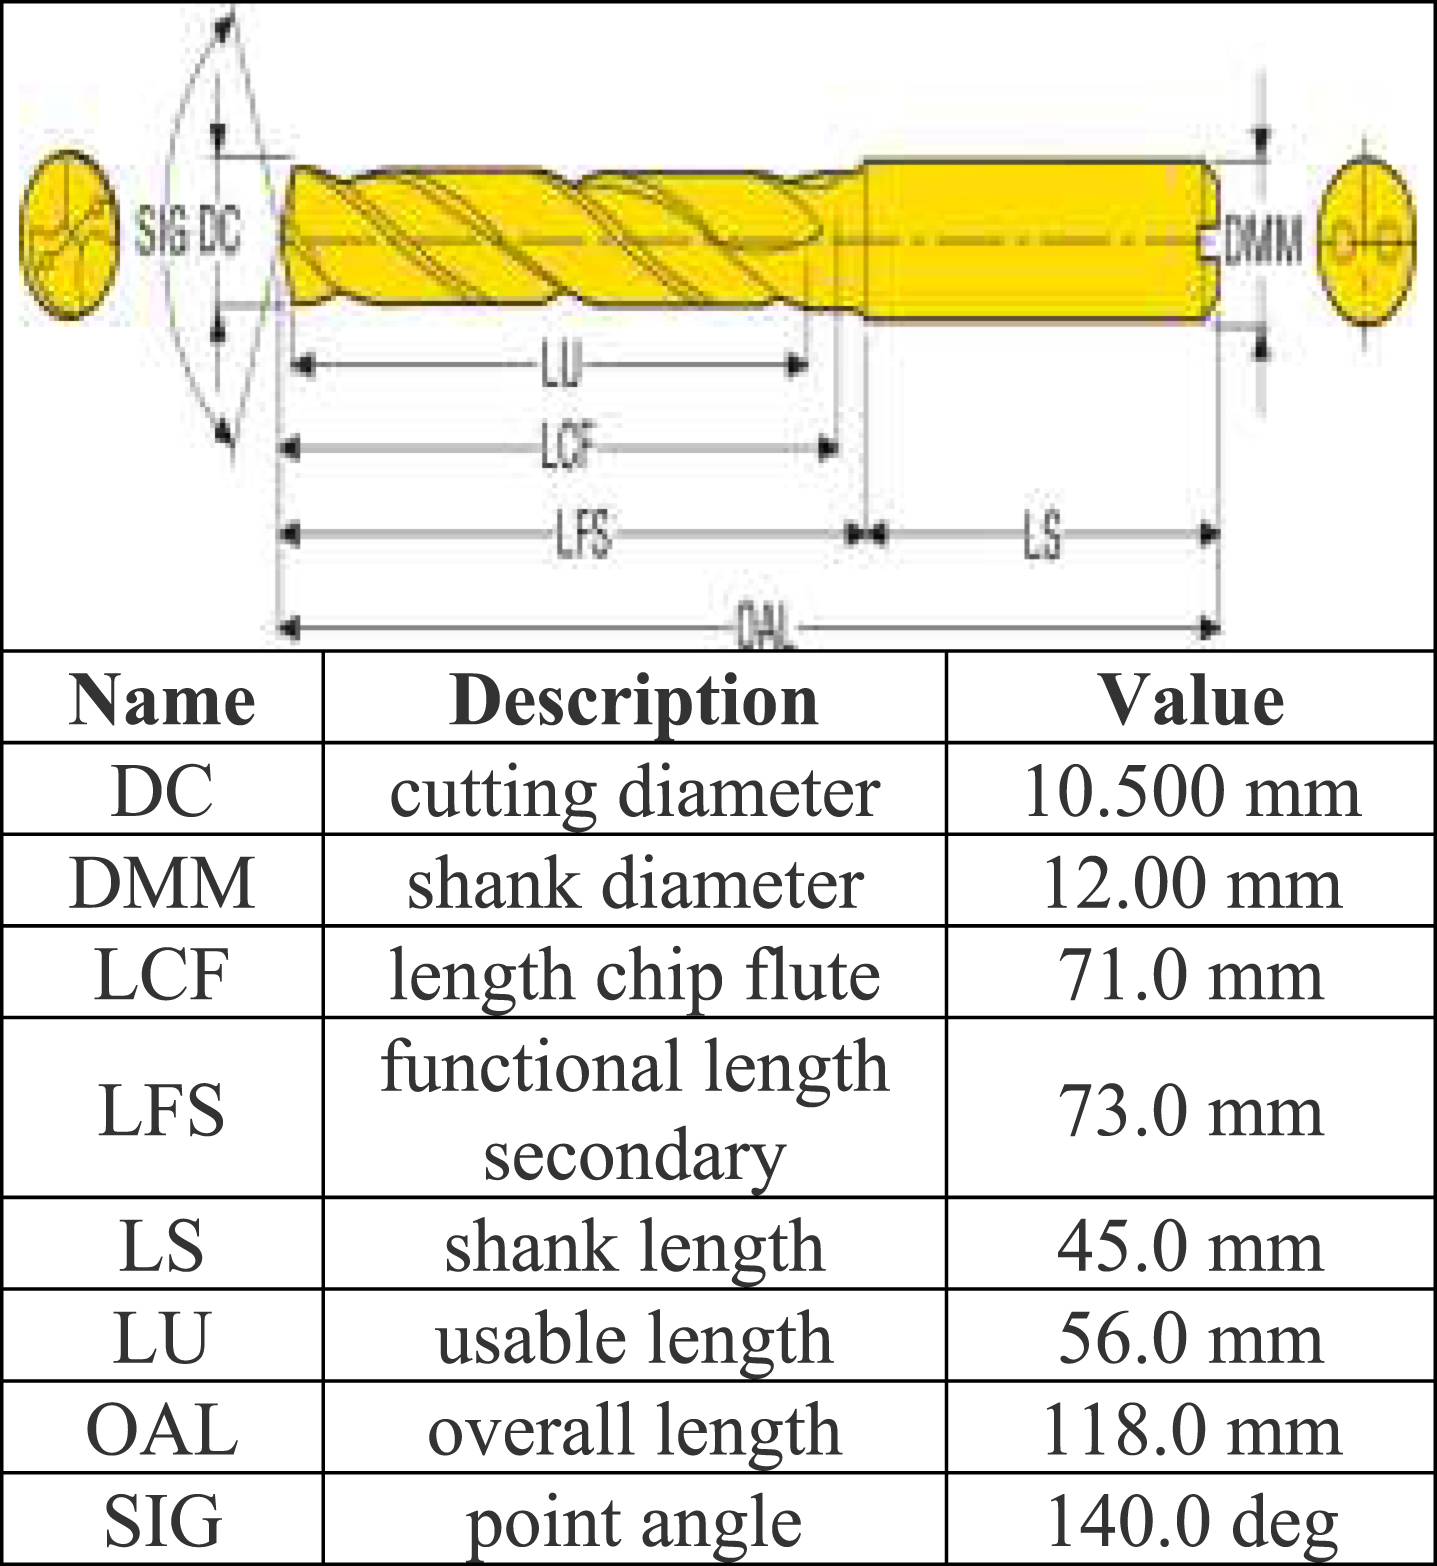
Cutting tool details
Drilling operations on round billets were carried out in real time by the author in this paper. Round carbide inserts, DNMG inserts, and CNMG inserts are among the cutting inserts available. Figure 1 shows a drilling CNMG insert SD205A-1050-056-12R1-P from Seco, which was used in this study.
Pictorial view of Drill tool SD205A-1050-056-12R1-P.
Figure 2 shows P8 grade (HSS) material for performing the drilling operation with in this paper. 600-1200 N/mm2 is the ultimate tensile strength of this material.
Image of P8 Round Bar.
With its sturdy design, this CNC is ideal for a wide range of general turning and drilling tasks. Internal and external threading, internal bore and variety of different operation can be done on this machine. Shaft and bar turning operations are optimally performed on this machine. Machines with 20-degree vertical beds, a 1500 mm bed length, maximum swing over the bed length of 800 mm, and the ability to turn 600 mm between centres are used in this study. The machine’s spindle side has a chuck of the same diameter as the spindle. As needed, 12 different cutting tools can be positioned on the turret’s 12 stations. An adequate load can be handled by the machine spindle’s 22 (up to 60) Kw of power.
Manufacturing companies have access to heavy-duty machines. Figure 3a depicts the pictorial view of machine that consists of three parts: the spindle side chuck, the turret, and the tailstock. When performing various machining operations on bar-type workpieces, a chuck is used to hold the workpiece. The other side is the turret where various cutting tools are placed as per requirement in provided slots. This is made of cast iron and has a cross slide to keep it in place.Turret-mounted angular encoders are used to determine the precise location of the station’s for different cutting tools. Tail stocks are third and can be moved forward and backward by a hydraulic cylinder. Tail stock is used to hold a workpiece that is of longer size whose other side is clamped to the chuck. Figure 3b is shown the real time drilling operation with the machine parts marked.
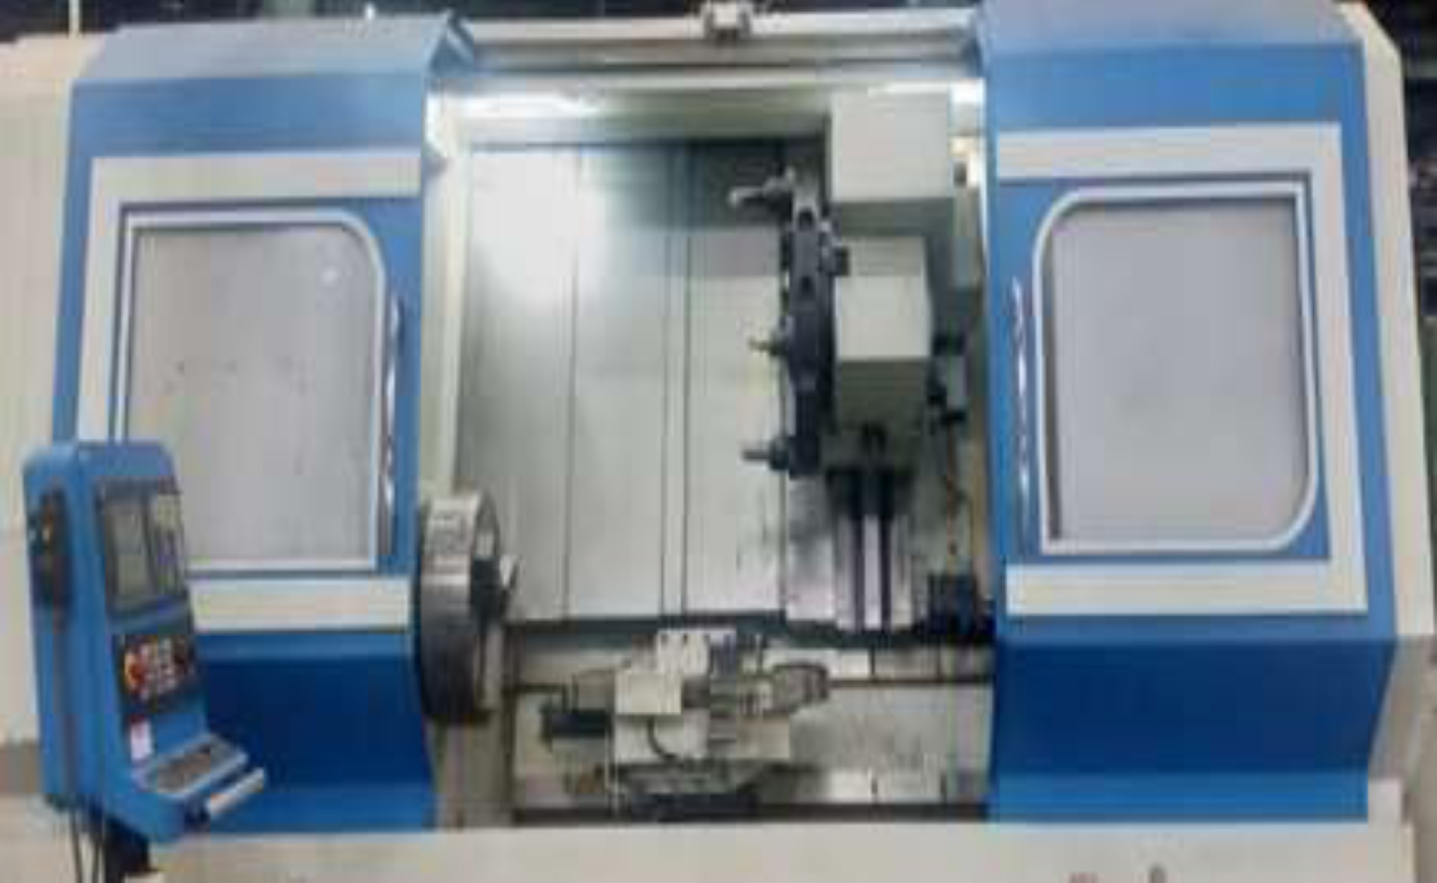
SBCNC 60 Machine.
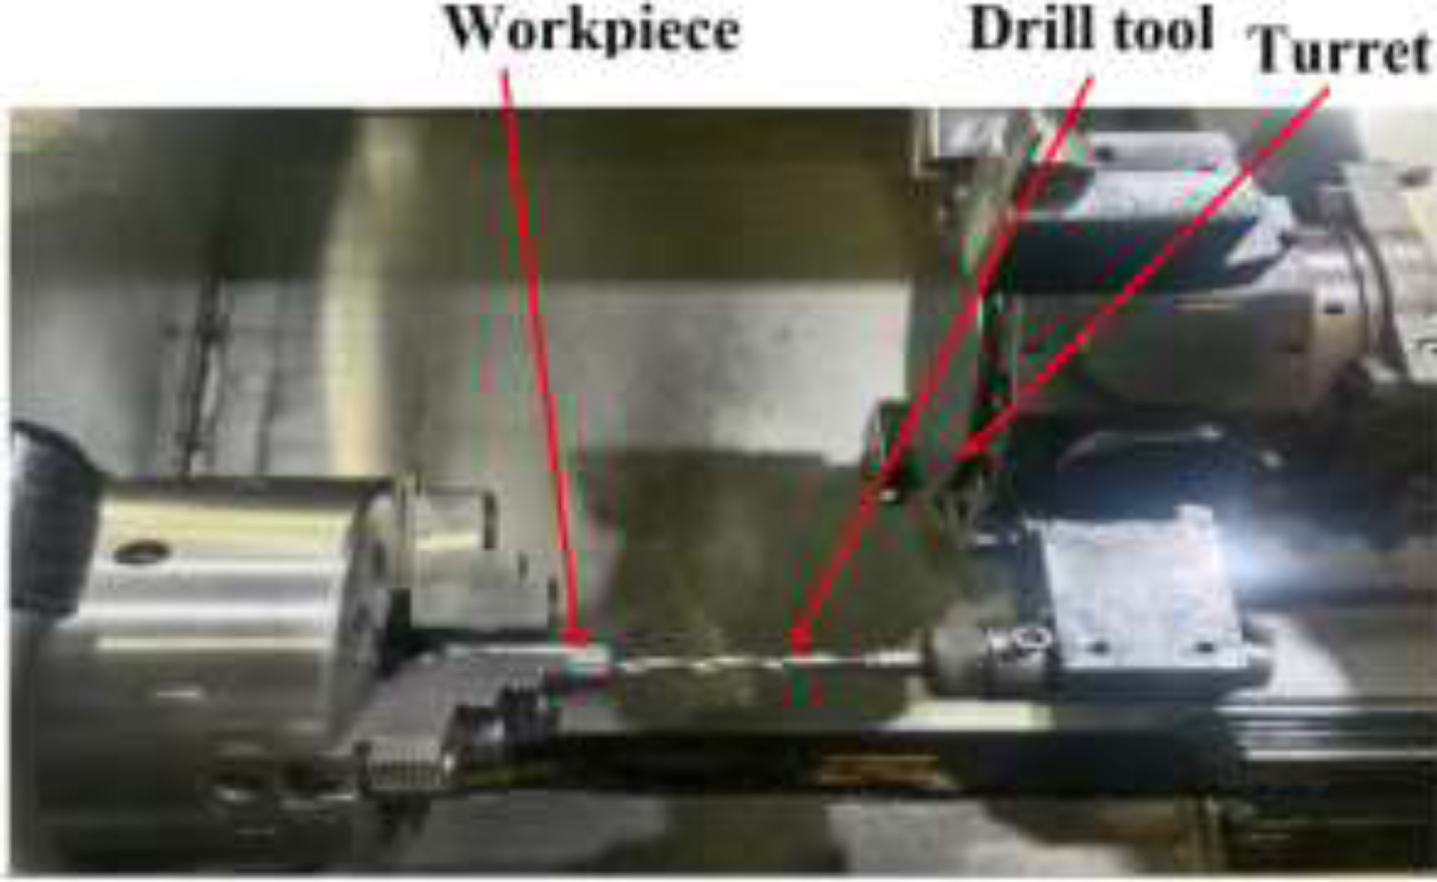
Drilling Operation on SBCNC 60 Machine.
CS and FR are the input parameters that control this paper’s output. Low, average, and high levels are assigned to each boundary. The two control input parameters, one fixed at the middle level and the other variable, are used to design the array of experiments. Table 2 shows the results of 18 experiments on the SBCNC60 machine using the SD205A-1050-056-12R1-P drilling tool for P8 material. Each experiment is repeated three times. It is shown in Table 3, the level assignments for a variety of drilling operations, while Table 2 shows the experimental values for 18 drilling operations in terms of MRR, MP, and ETL.
Drilling operation machining parameters, linguistic values and experimental outcomes
Drilling operation machining parameters, linguistic values and experimental outcomes
Drilling parameters (MRR, MP and ETL) for the experiment
MRR, machine power, and predicted tool life are three performance metrics that might affect drilling operations. When the MRR rises, surface roughness rises along with it, which reduces tool life and increases the cost, and decreases the quality of the tool. When the cutting speed is fast, the cutting tool gets hotter and the quality of the final product suffers. At this point, the Taguchi method is used to optimize the control parameters for drilling operations. The ideal values for the cutting parameters of a machining process are determined using a variety of methods, including Taguchi and analysis of variance (ANOVA), in accordance with Aamir et al. [37], Zerti et al. [38], Mudhukrishnan et al. [16], Pathak et al. [39], Aslantas et al. [40], Amin et al. [41], Sivaraman et al. [43], Kuram and Ozcelik [42], Furgan et al. [44], Manoj et al. [45], Hong et al. [46] and Bayraktar et al. [47]. As can be seen in Table 4, the P-value for drilling operations is determined by ANOVA, and the significance level is set at P < 0.05. The results of the computations suggest that the feed rate is 52.61 percent significant for MRR, while the cutting speed is 46.49 percent significant. Machine power output is shown to be dependent on cutting speed (57.59%) and feed rate (41.77%) according to the results ANOVA. The contribution of CS in ETL is exceptionally large in comparison to that of FR.
ANOVA for MRR, machine power, and estimated tool life
ANOVA for MRR, machine power, and estimated tool life
One of the most popular methods employed by researchers is regression analysis. Its simplest application is in determining the relationships between a single independent and a single dependent variable. Here, MINITAB-17 is used to create the regression model that predicts the MRR, MP, and ETL. Using regression analysis, the relationship between cutting parameters and their responses to drilling operations is examined and reported in this article. Modeling for different performance parameters (MRR, ETL, and MP) can also be done using a linear regression model, as shown in Equations (1)–(3), with input control parameters CS and FR for drilling operations taken into consideration. For this reason, a linear regression model is used to estimate an individual’s level of fitness. The regression model’s equation is discussed further below. As per Mudhukrishnan M. et al., higher R2 values indicate that the developed model is successful. The model is completely efficient if the obtained value is 1 [16]. Related to this context, R2 values on higher side are always required. Results for drilling operations are quietly complying to Equations (1)–(3) with R2 values greater than 99 percent for MRR and MP and 88.5 percent for predicted tool life.
For predicting the rate of material removal during drilling, there are some studies of the models available in the literature. Ultrasonic machining of titanium and its alloys was modeled by Singh & Khamba (2007a), who suggested and used the Taguchi method [35]. Machining titanium and its alloys have been studied extensively, and a macro model for the MRR, the rate of tool wear, and the SR have been developed (Singh & Khamba, 2007b) [36]. However, many working engineers appear dissatisfied with them, with practical inoperability and poor outcomes during actual machining being two of the most common complaints. As a result, engineers in practice still rely heavily on the expertise of the machine operator. It is not necessary to have an absolute model that can provide a high rate of material removal in a production process, but rather a relative online model that can provide findings that are useful in the real world. This research introduces a fuzzy model in an effort to solve some of these real-world issues, particularly with regard to the prediction of MRR, MP, and ETL. According to the Zadeh (1973) principle of incompatibility, “as the complexity of a system increases, our ability to make precise and yet significant statements about its behaviour diminishes until a threshold is reached beyond which precision and significance (or relevance) become almost mutually exclusive characteristic”. That is to say, the solution to a real-world problem gets more elusive the more closely one examines it. The drilling process is incredibly intricate, yet fuzzy logic methods could be the key to unlocking its secrets. Lofti A. Zadeh’s “fuzzy logic” improvement strategy was proposed in the 1990 s, and it was based on the ability to make logical judgments. Through the use of this interaction, the framework’s complexity is reduced by making it more ambiguous or fuzzy. With fuzzy, you get what you pay for in terms of mental capacity. The fuzzy plan makes use of capacity assessment by arranging reasonable rubrics according to membership functions (MF) and linguistic labels [23]. In the fuzzy logic, fuzzification, fuzzy-rule base, fuzzy-inference mechanism, and defuzzification are all sub-categories [24, 25]. Using fuzzy interference, the yield vector is used to decipher input vector values based on predetermined rules. Fuzzy frameworks like Mamdani and Takagi-Sugeno-Kang [24, 26] are examples of this. When it comes to thinking, the fuzzy assuming standard is always looking for ways to approximate.
The fuzzy rule base is a collection of if-then rules based on the fuzzy rationale framework. Defuzzification is the process of extracting a representative value from a fuzzy set. The FL technique begins by defining the scope of boundaries. Using Table 3 as a guide, the most and least extreme benefits of input/output boundaries were presented. Figure 4 shows a fuzzy MRR, machine power and estimated tool life model. Table 5 lists the minimum and maximum numerical values for input and output of the experimental conditions. The identification of process parameters is an appropriate MF structure for algorithm development. Eventually, the output responses are determined by the MF, which defines the valuable input cross-over. Because of its high computational efficiency and wide application in real-time functioning, triangular MF is taken for the evaluation of fuzzy logic assessments. The triangular membership function is chosen because of its high performance [27]. Input (CS, FR) and output (MRR, MP, ETL) variables were represented by three and five sets of fuzzy expressions, ranging from low to high. Low (L), medium (M), and high (H) language variables were used to denote input limits, while significant low (VL), low (L), medium (M), high (H), and extraordinarily high (VH) linguistic variables were used to denote output borders. MF considered for CS and FR are portrayed separately in Figs. 5 6. The modeled values of MRR, MP, and ETL for the drilling operation are shown visually in Fig. 7. Like in Figs. 7, 8 depicts the drilling operation’s MRR, MP, and ETL fuzzy rules being executed.
Input and output FLM parameter ranges for drilling operations, in terms of their minimum and maximum values
Input and output FLM parameter ranges for drilling operations, in terms of their minimum and maximum values

Drilling Operations Model Based on FIS for MRR, MP and ETL
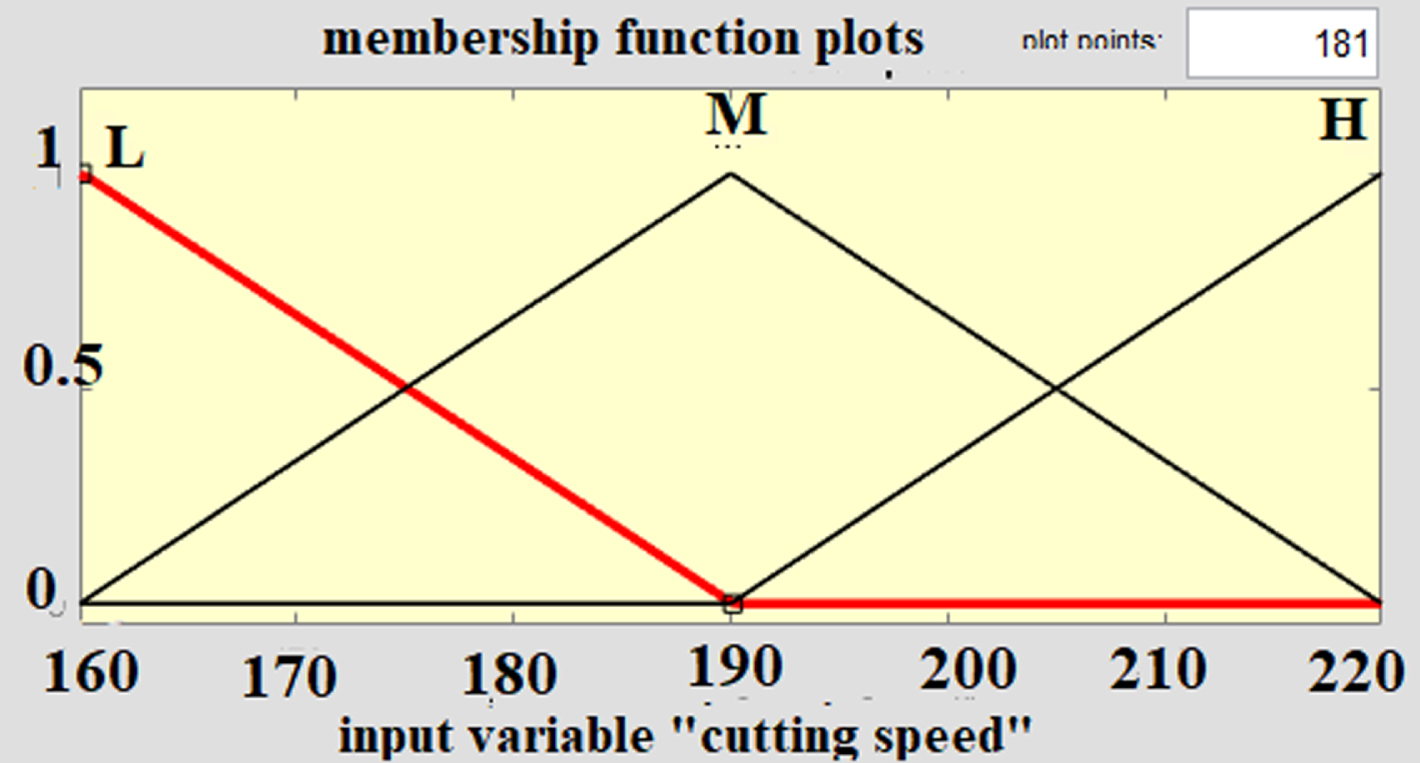
MF Plot for Cutting Speed.

MF Plot for Feed Rate.

Estimated Drilling Operation MRR, MP, and ETL from Models.
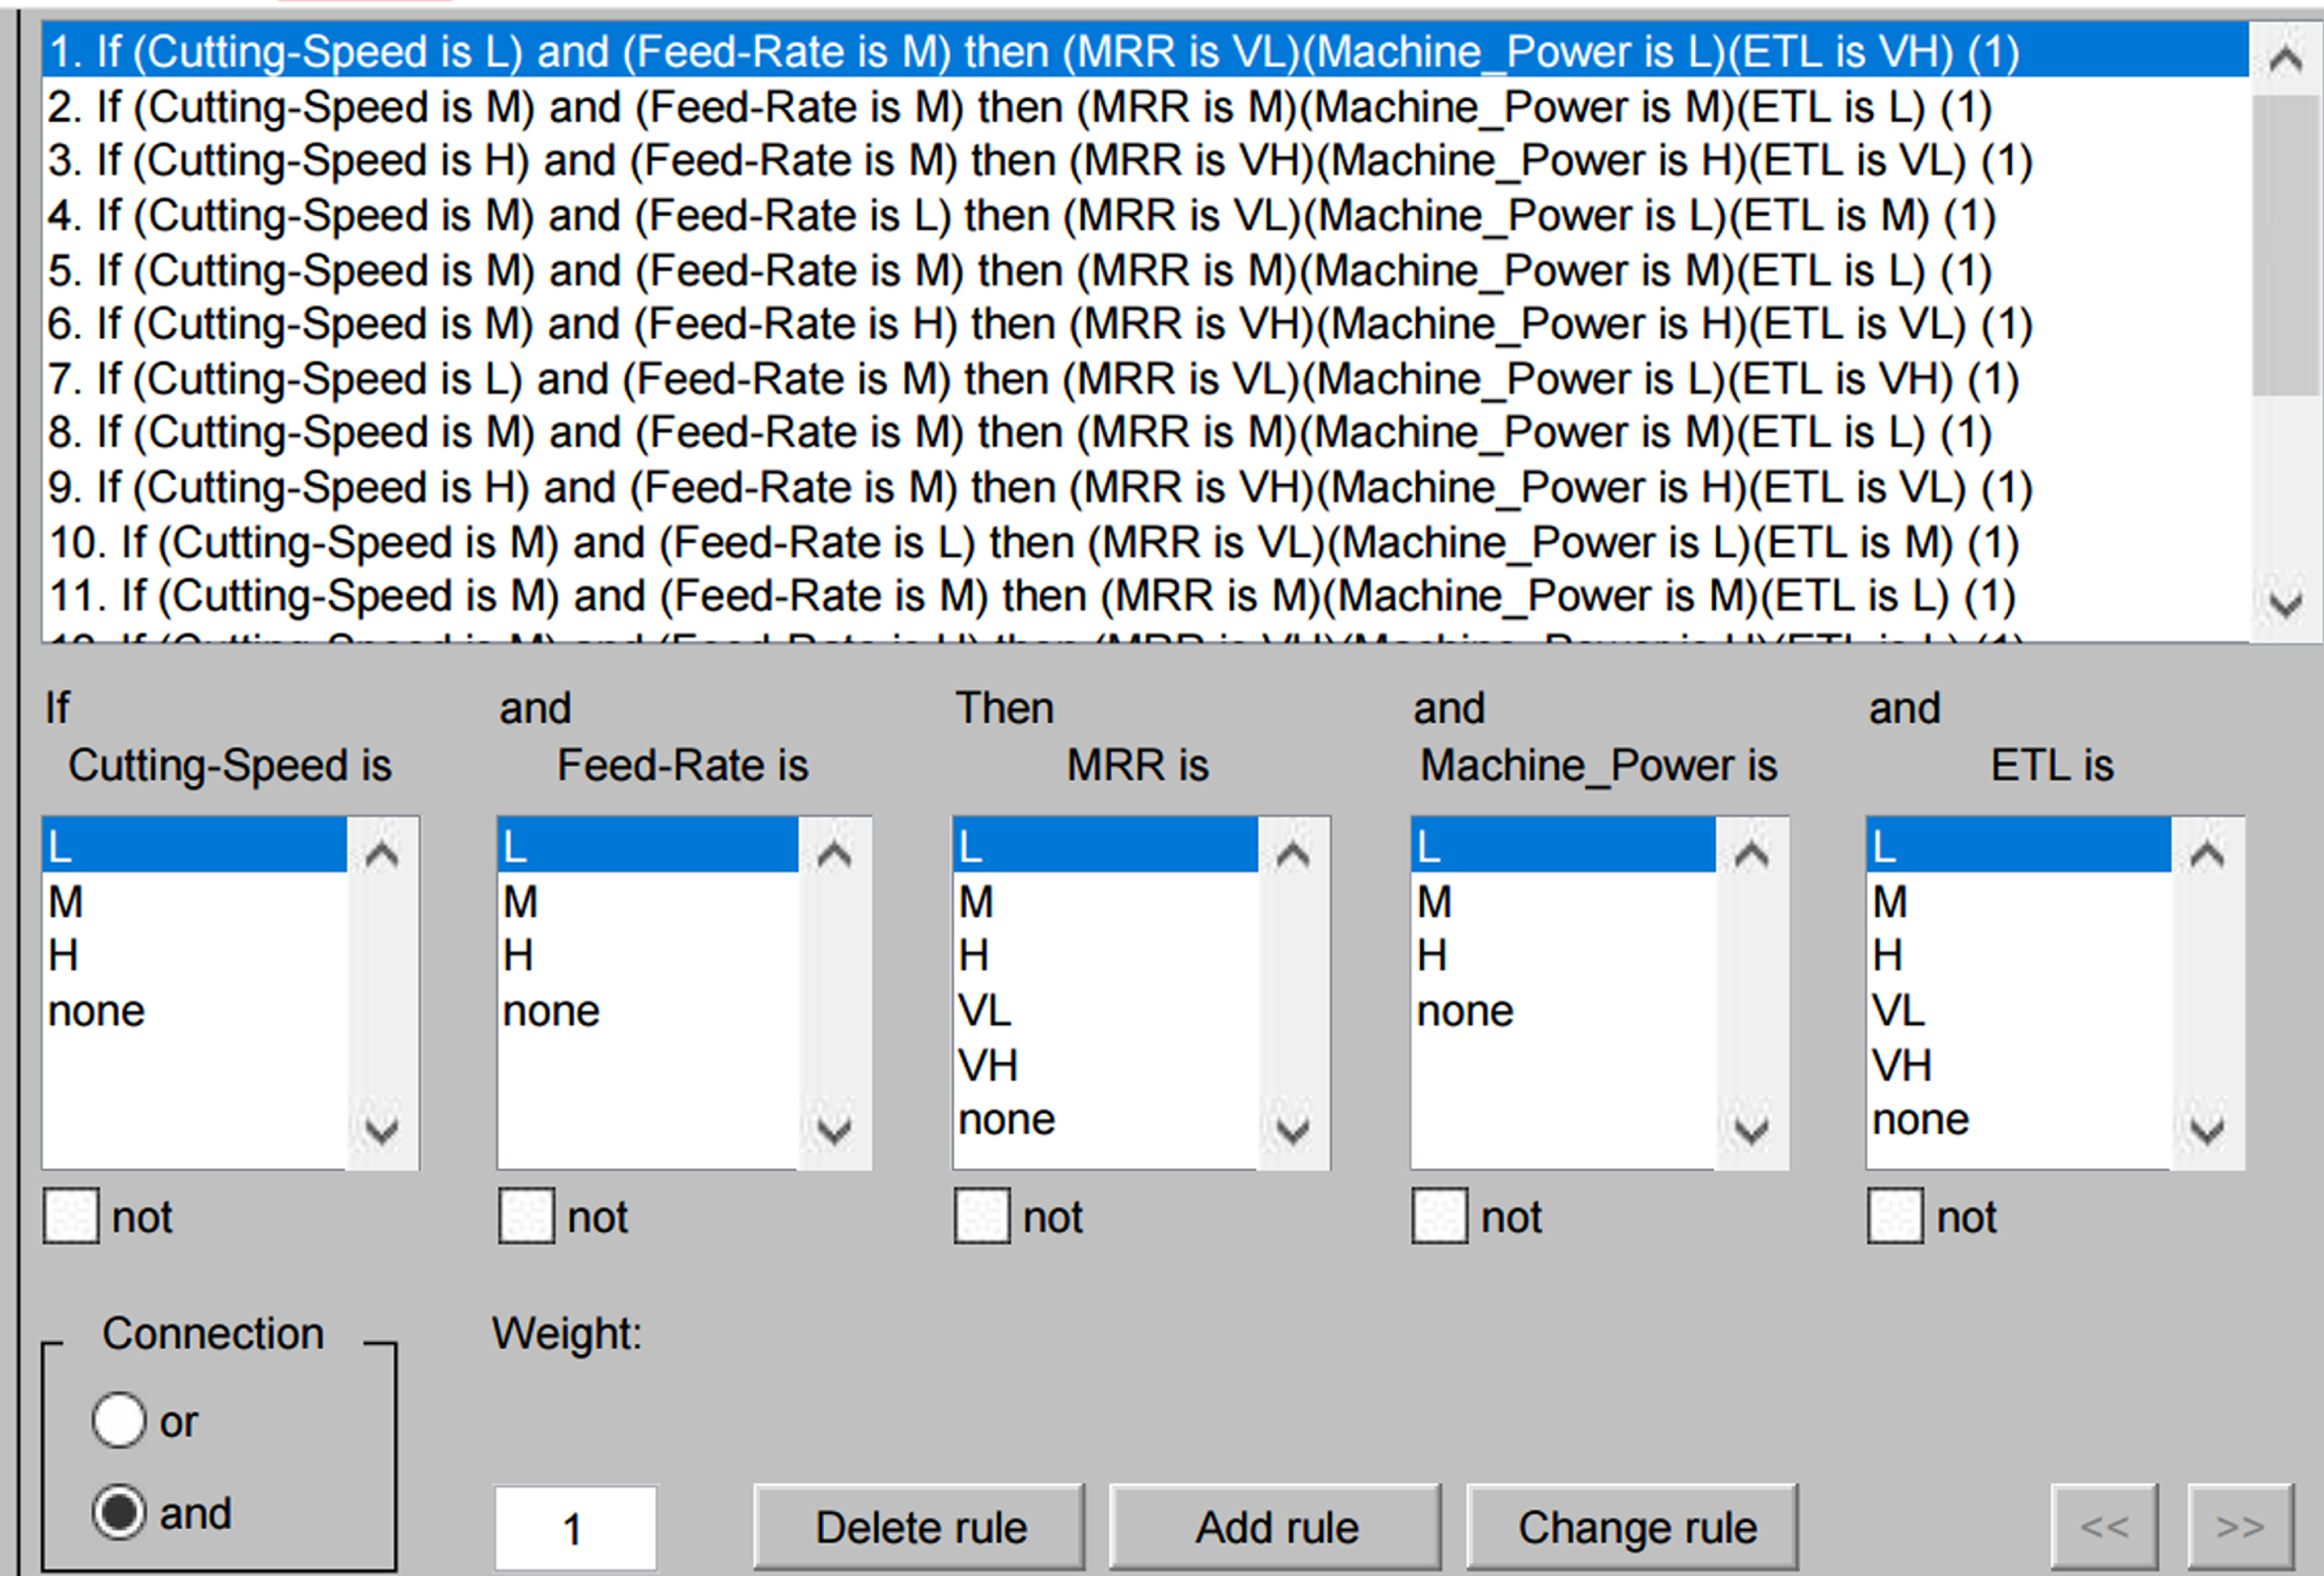
Fuzzy Rules Fired for MRR, MP, and ETL.
As shown in Table 2, we took into account the appropriate influencing parameters and their levels for the experiments. The Taguchi L18 orthogonal array was used to acquire the levels of combinations of the input design parameters for each experiment, and the results for MRR, MP, and ETL are displayed in Table 2. Using the S/N ratio and ANOVA [44, 45], the optimal value and relative importance of each parameter is calculated. S/N analysis is used to determine the optimal machining parameters based on the results of the experiments. A plot of the S/N ratio versus MRR, machine power, and estimated tool life is shown in Figs. 9–11. The influence of cutting parameters for MRR on drilling operation is depicted in Fig. 9; the best S/N ratio of MRR is achieved at CS (L3 = 220 m/min) and FR (L3 = 0.35 mm/rev), Fig. 10 shows that for machine power highest signal-to-noise ratio is achieved at CS(L1 = 160 m/min) and FR(L1 = 0.25 mm/rev), where smaller values indicate more efficient use of machine power, as shown in the Fig. 11, shows the best S/N ratio for ETL is achieved at CS (L1 = 160 m/min) and FR (L1 = 0.25 mm/rev).It has been observed from Figs. 9–11 that the MRR is highest at CS (L3) and FR (L3), the machine power is highest at CS (L1) and FR (L1), and that the ETL is highest at CS (L1) and FR (L1). For drilling operations, the optimal input control parameters for MRR, predicted tool life, and machine power are FR(L2)=190 mm/rev and CS(L2)=0.30 m/min. Using the machine with these input control parameters optimized for maximum output and acceptable quality can improve productivity and quality considerably. When planning a new machine or optimizing the performance of an existing one, it is optimal to aim for a higher MRR, a higher ETL, and a lower power consumption.
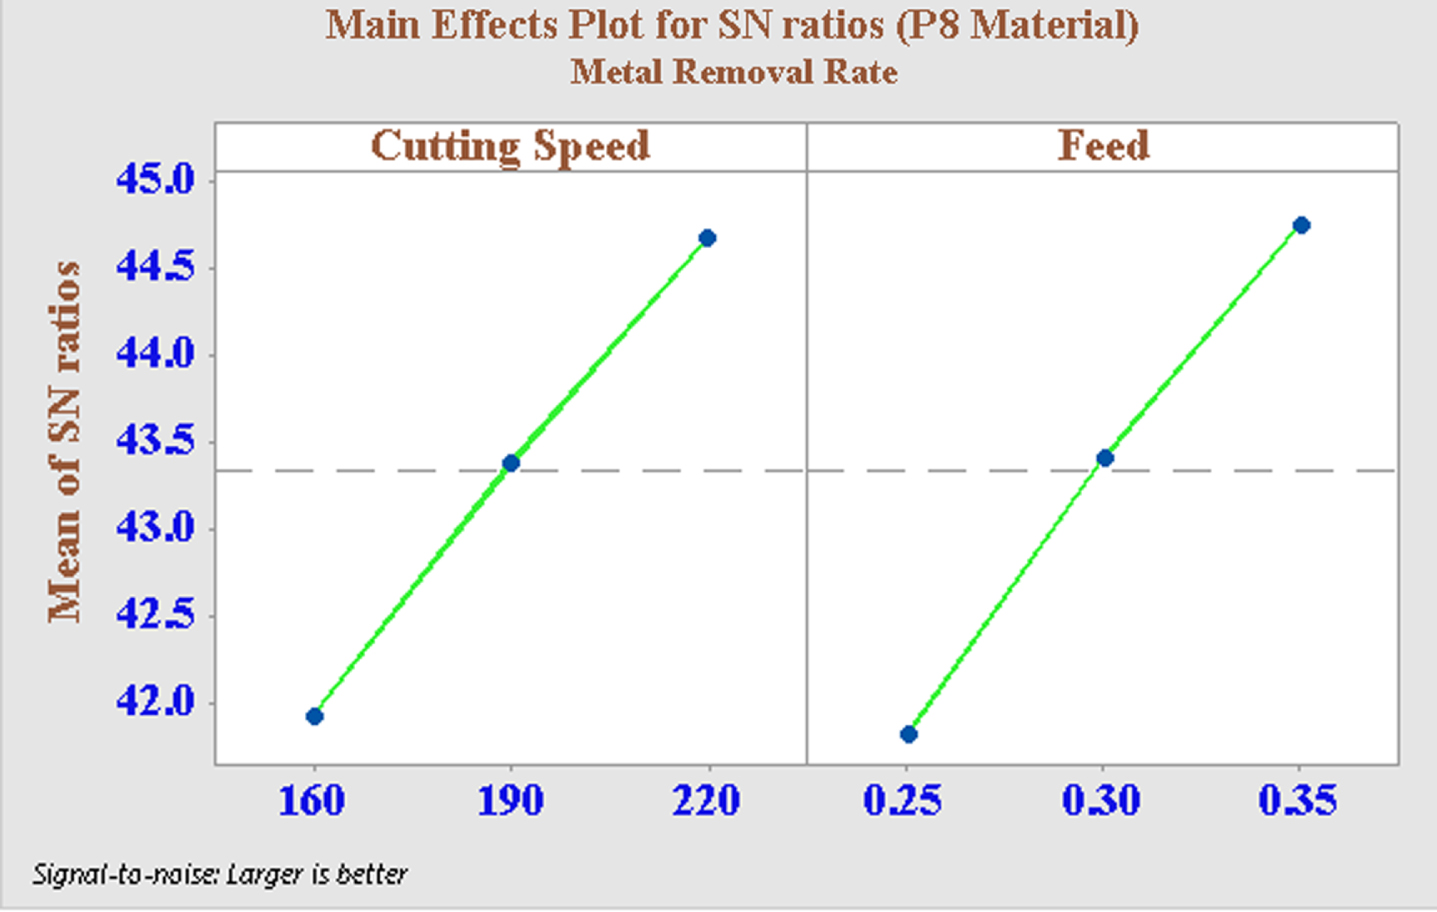
MRR_S/N Ratio Main Effect Plot.
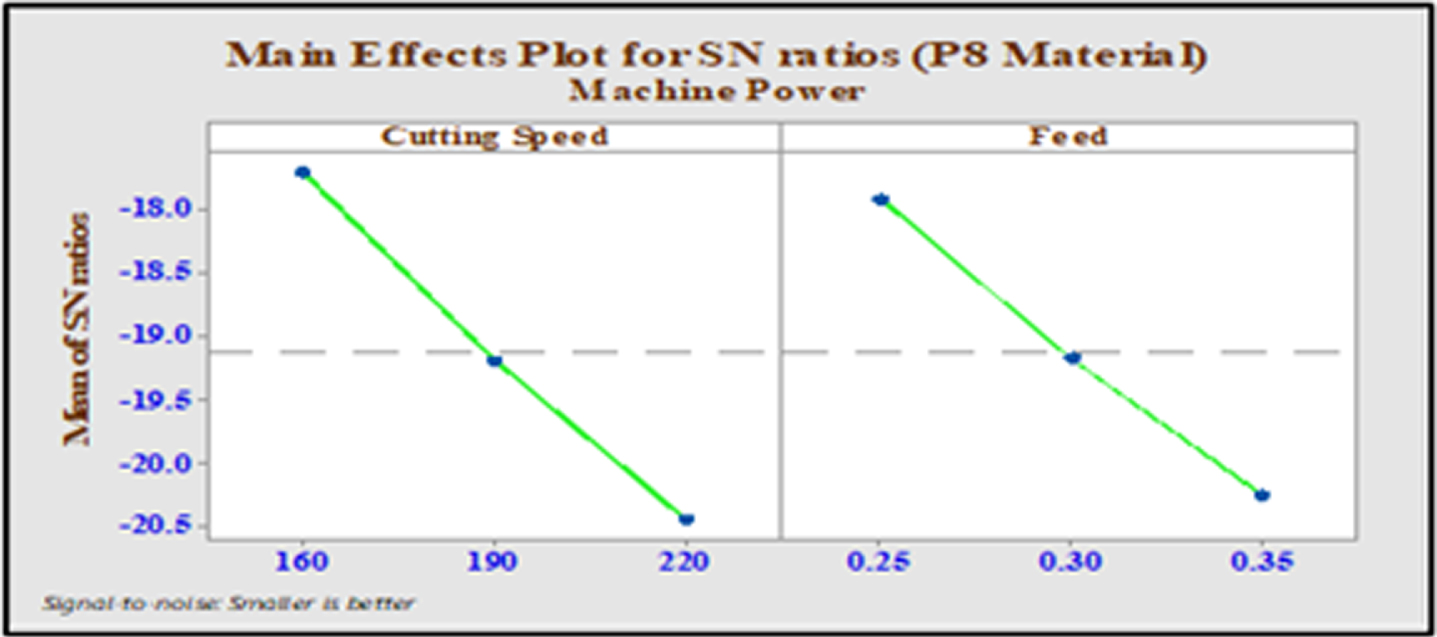
MP_S/N Ratio Main Effect Plot.
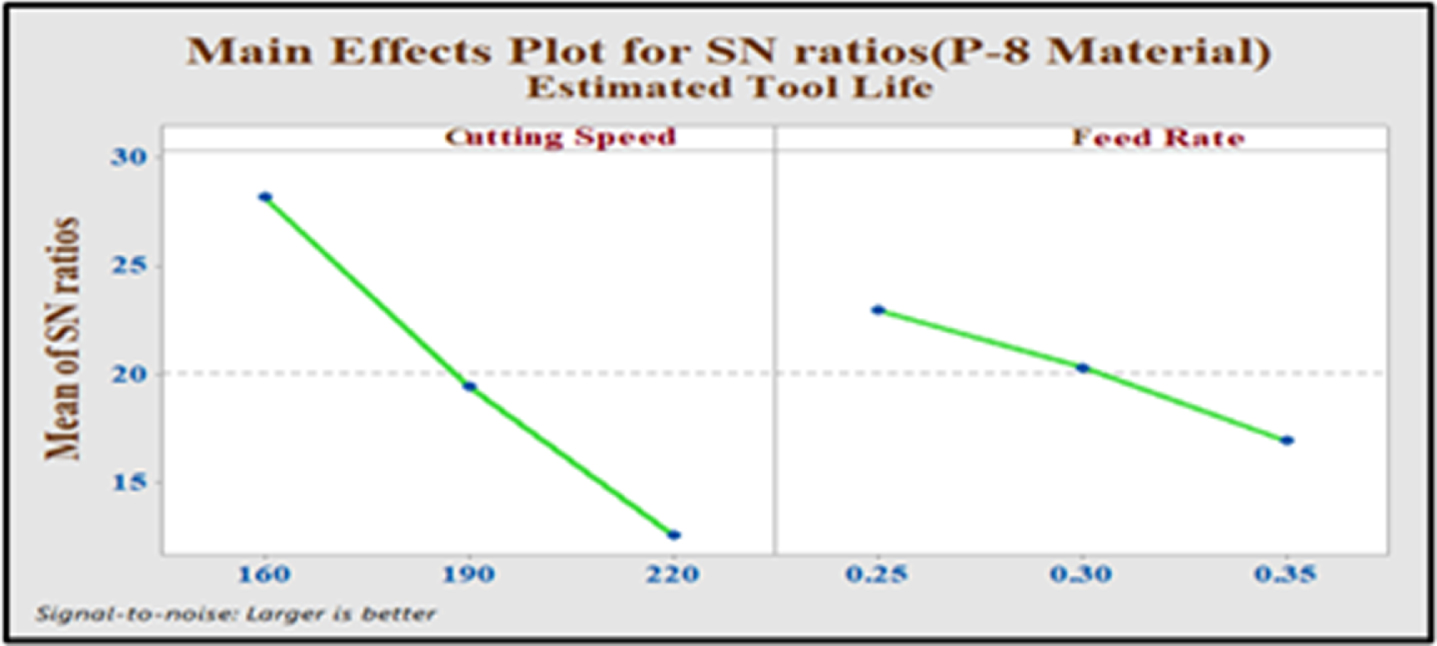
ETL_S/N Ratio Main Effect Plot.
In light of the experimental data, we thought about using regression and fuzzy approaches to model the SBCNC 60. It has been discussed how mathematical models can be used to explain experimental findings. Drilling of P-8 material with SBCNC 60 is modeled the MRR, MP, and ETL using two control parameters, CS and FR, as inputs. Table 6 displays experimental and anticipated values for MRR, MP, and ETL using the fuzzy and regression technique. Figures 12–14 displays 3-D interface result of the controlling parameters (CS and FR) on ETL, MRR, and MP. Figures 15–17 is graphically shown the experimental, regression, and fuzzy predicted values of MRR, MP, and ETL for drilling operation. With the help of Figs. 15–17, it is easily shown that fuzzy model predictions more resemble with experimental study than the regression model.
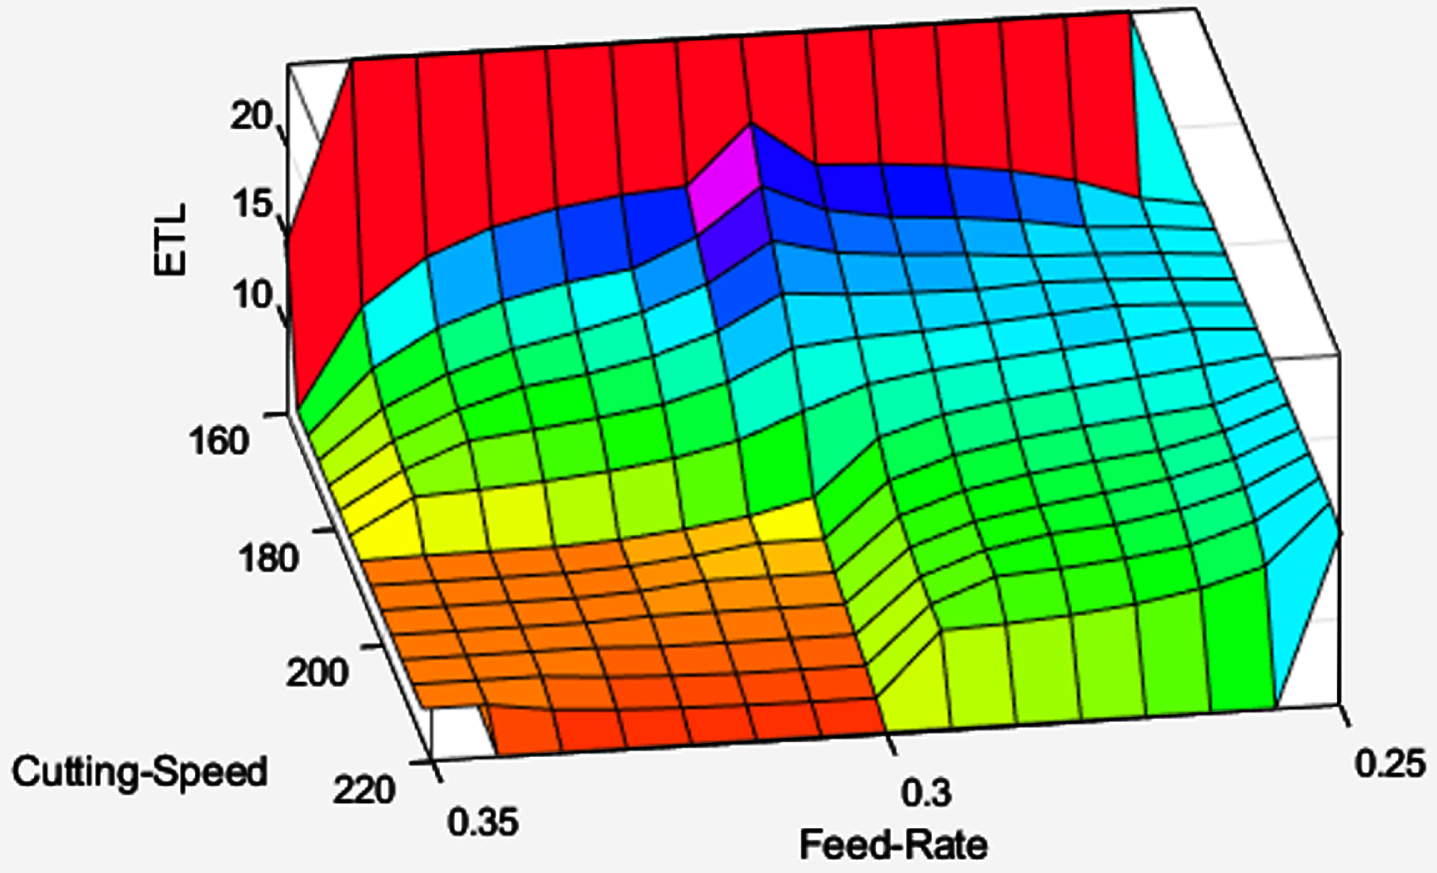
Effects of CS and FR on ETL from Drilling with a Three-dimensional Interface.
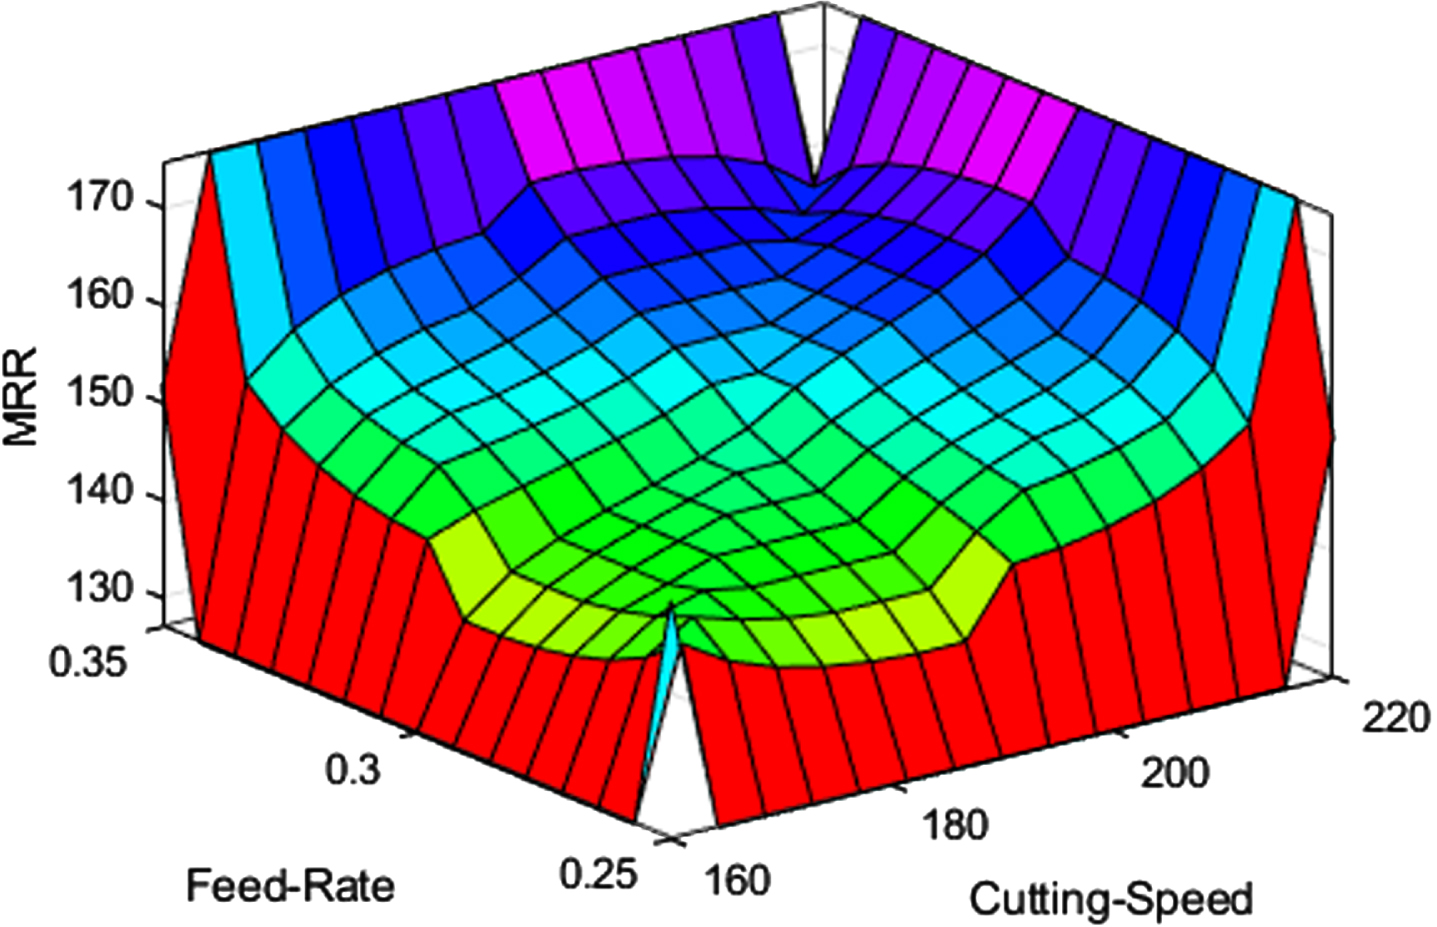
Effects of CS and FR on MRR from Drilling with a Three-dimensional Interface.
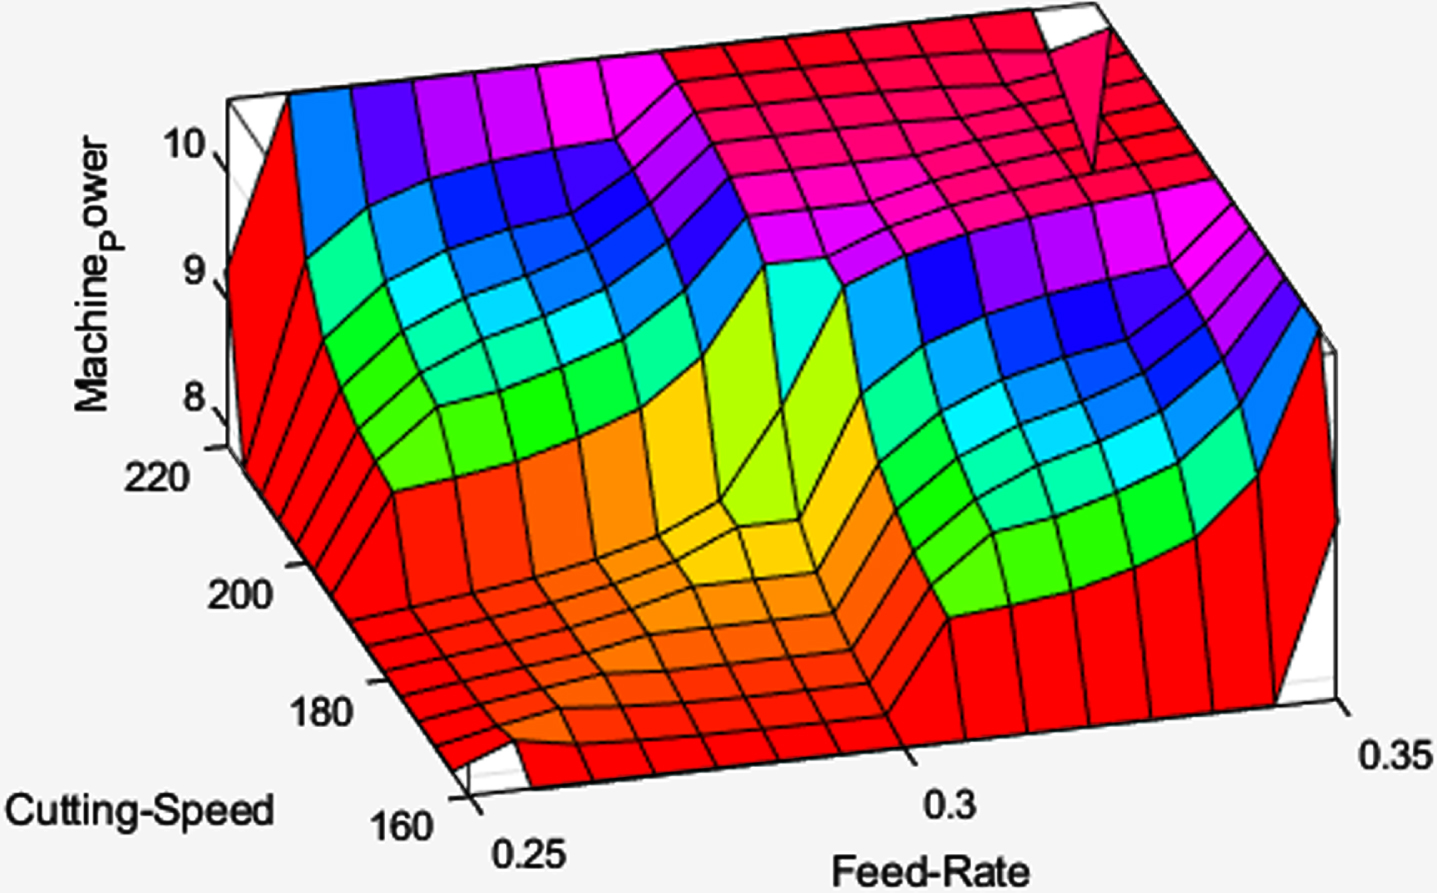
Effects of CS and FR on MP from Drilling with a Three-dimensional Interface.
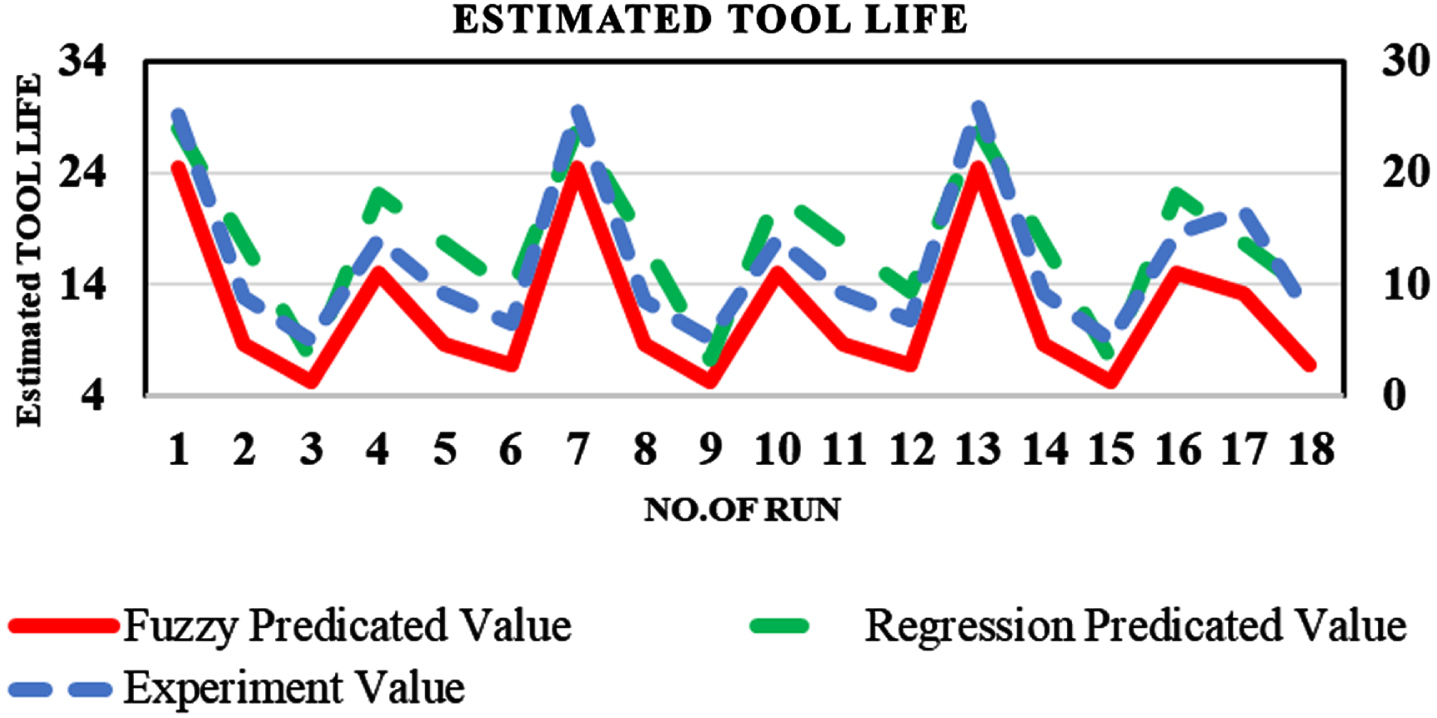
Values of the ETL for Drilling Operations as Calculated by Experimental, Regression, and Fuzzy Models.
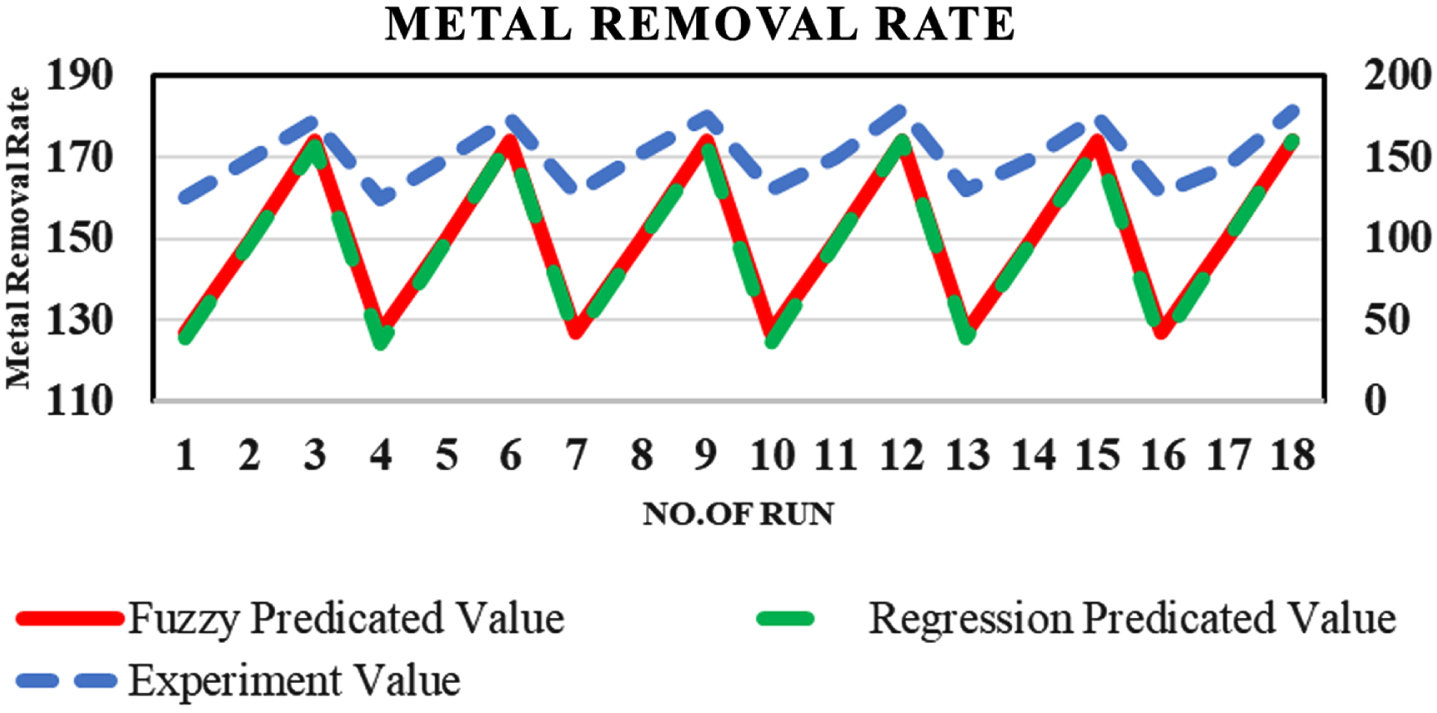
Values of the MRR for Drilling Operations as Calculated by Experimental, Regression, and Fuzzy Models.
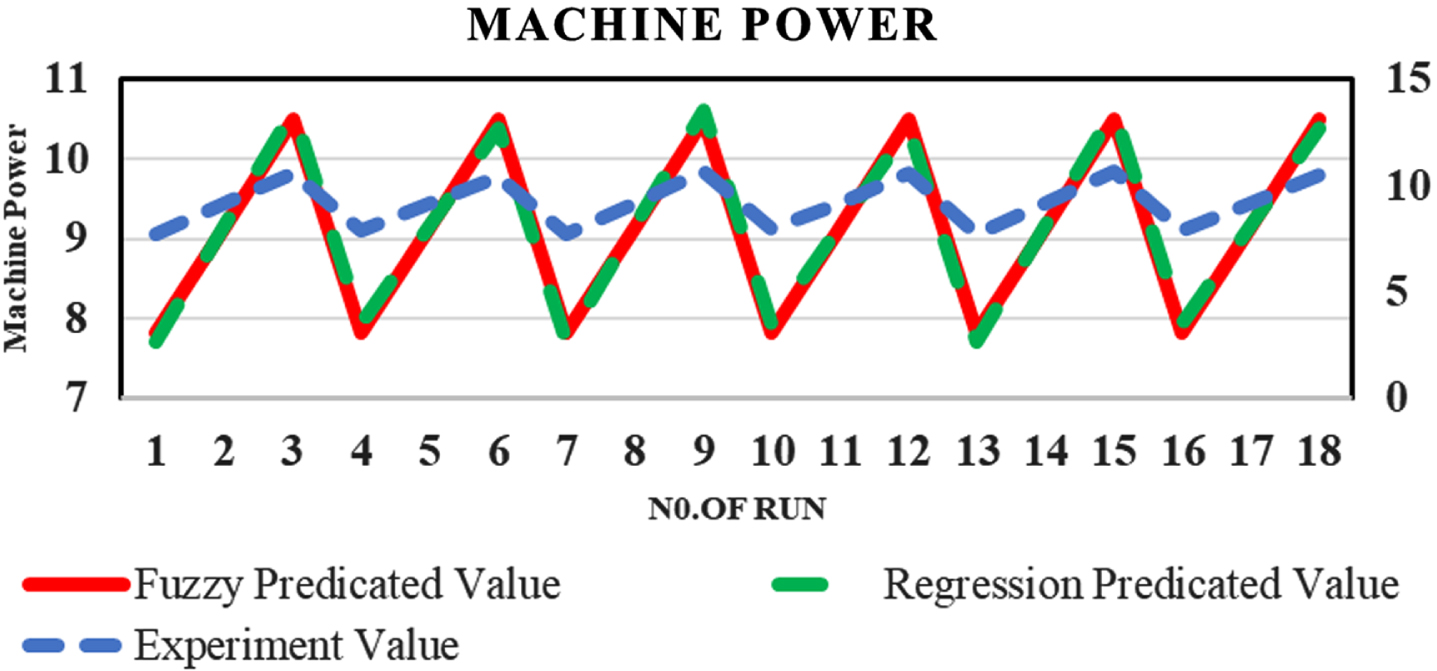
Values of the MP for Drilling Operations as Calculated by Experimental, Regression, and Fuzzy Models.
The coefficient of correlation (R), mean absolute percentage error (MAPE), root mean square error (RMSE), and mean absolute difference (MAD) were calculated [28–30] for the evaluations of prediction performance of constructed models using the following fundamental mathematical formulas represented by Equations (4)–(7).
Using direct machine run and expected values, respectively, EV and PV are the experimental and predicted values of MRR, MP, and ETL. Theoretically, a good prediction model would have a R of 1, MAPE, RMSE, and MAD of 0%. Table 7 displays the performance indices’ anticipated values.
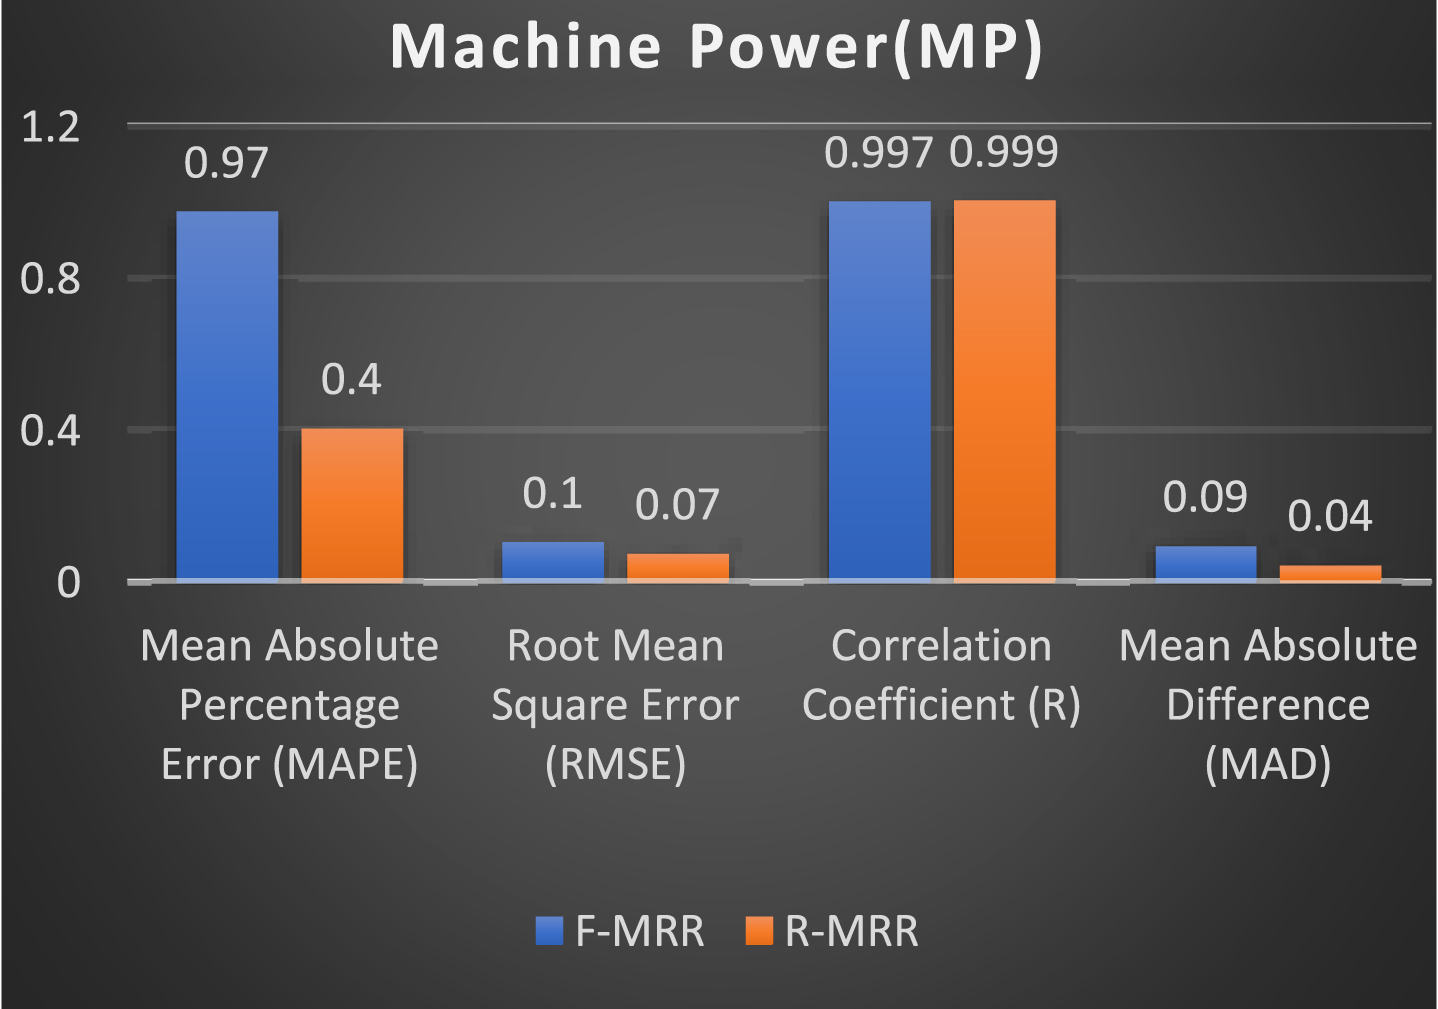
The author predicts the MRR, MP, and ETL when drilling P8 material using regression analysis and the Mamdani approach of fuzzy logic modeling. The tests were designed for a wide spectrum of cutting speeds and feed rates used in actual drilling operations. Figures 18–20 display the results of the fuzzy predicted model, showing a MAPE of 1.27 % for MRR, 0.97 % for MP, and 5.12 % for ETL; an RMSE of 2.43 for MRR, 0.10 for MP, and 1.01 for ETL; a correlation coefficient of 0.99 for MRR, 0.997 for MP, and 0.99 for ETL; and a mean absolute deviation of 1.89 for MRR, 0.09 for MP and 0.67 for ETL, Parallel findings of the model predicted by regression are shown in Figs. 18–20.
Different Performance Parameters values for Regression and Fuzzy Predicted model of MRR for Drilling Operation.
Different Performance Parameters values for Regression and Fuzzy Predicted model of MP for Drilling Operation.
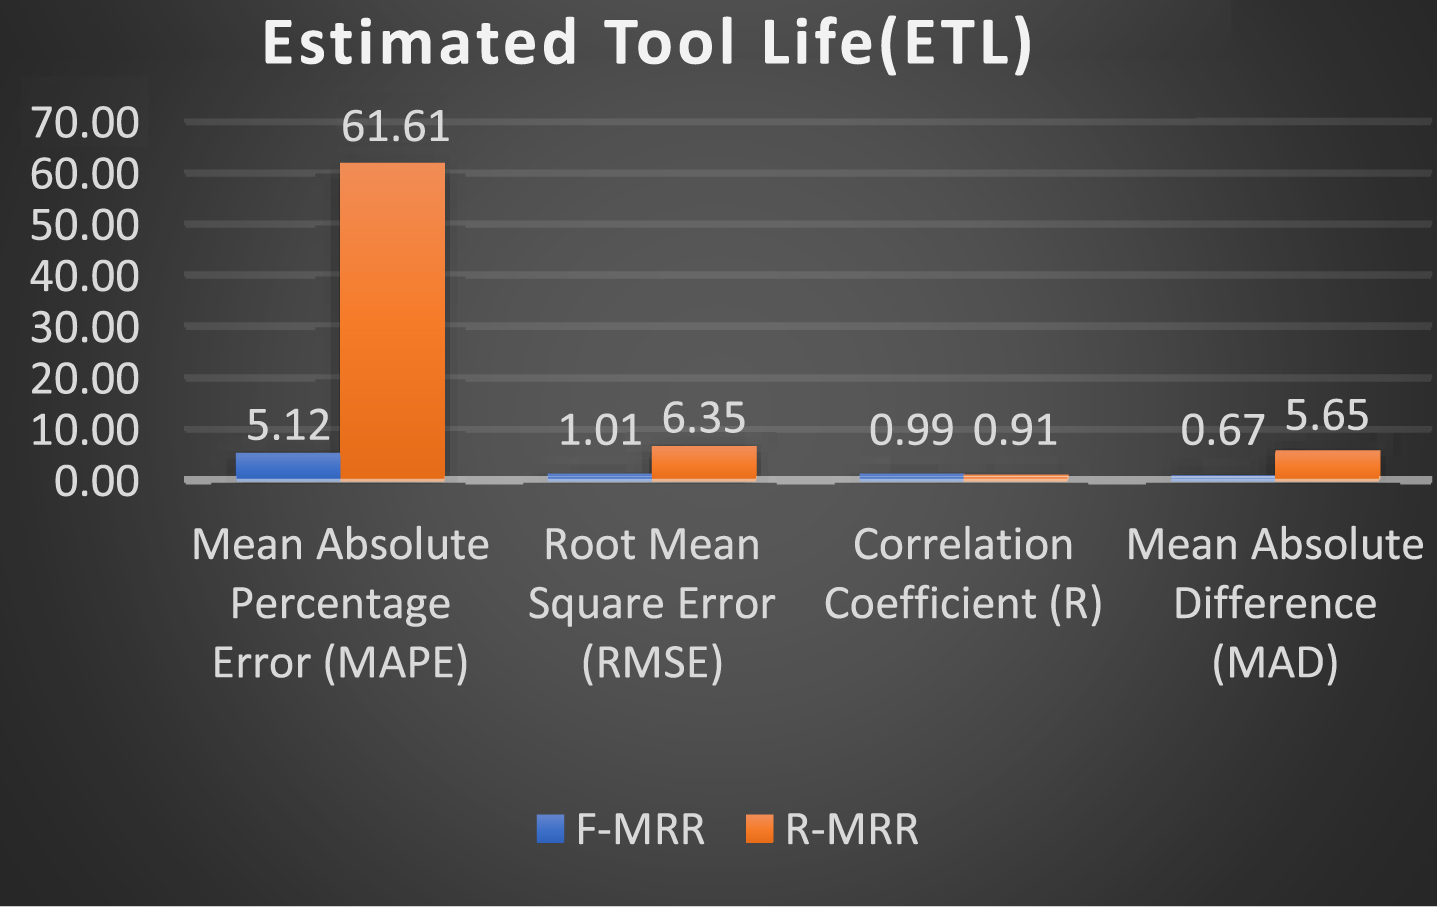
Different Performance Parameters values for Regression and Fuzzy Predicted model of ETL for Drilling Operation.
MRR has a MAPE of 1.44 percent, MP of 0.40 percent, and ETL of 61.61 percent; MRR has an RMSE of 2.78, MP of 0.07, and ETL of 6.35; MRR has a correlation coefficient of 0.99, MP of 0.99, and ETL of 0.91; and MRR has a MAD of 2.11, MP of 0.04 and 5.65 for ETL. By comparing R, MAPE, RMSE, and MAD, it was found that the fuzzy model performs predictions more accurately than the regression model, it is easily shown by Figs. 18–20.
To improve precision and output, it is necessary to determine the machining parameters and their general relationship. Mathematical and statistical modeling approaches developed during the past few decades have helped to tackle this complexity. Regression and fuzzy models are two common types of models used to represent machining parameters. The goal of the current work was to construct an empirical model for the SBCNC60 machine’s drilling process using regression analysis and fuzzy logic. In order to predict the MRR, MP, and ETL, a fuzzy model was created using the MATLAB program R2018a.The final findings are now elaborated from this experimental study as follows. According to the results of an ANOVA, the feed rate (52.61 percent) plays crucial role in MRR, then followed by the cutting speed (46.49 percent). According to the ANOVA results of tests conducted for the machine power, cutting speed (57.59%) is more important than FR (41.77%). The findings of the ANOVA suggest that cutting speed (83 percent) plays most crucial role in determining tool life. Fuzzy modeling outputs were verified using experimental data, and the results were, show quite excellent outcomes as compare to regression predicted model in case of MRR and ETL. The proposed predicated fuzzy model is shown to have a lower MAPE (1.27% for MRR and 5.12% for ETL), which means that its prediction accuracy is higher. The high correlation coefficient near about 0.99 in each case of fuzzy predicted model indicates that the EV and PV have a strong association. For drilling P8 material, the suggested fuzzy logic model was found to accurately predict the MRR, MP and ETL performance characteristics. To aid in CNC drilling operations, Drilling for P8 material is currently being explored using fuzzy prediction, which contributes significantly because to its unique nature. The prediction performance of fuzzy models is also substantially superior than regression predictive models when MAPE, RMSE, MAD, and R are compared for each analysis. The present findings of these workout try to achieve optimum output in SBCNC 60 machine. Any one part enhancement may affects other parameters which are taken care of in predictive modelling. If MRR increases drastically and due to less ETL if drill tool break then workpiece will reject due to its quality aspects depends on criticality. Hence predictive modelling saves these vital issues while machine is performing. The current investigation shows that, depending on the field conditions and requirements, the created fuzzy models can be used to optimize the SBCNC 60. The usage of the suggested fuzzy model predicts the MRR, MP, and ETL in SBCNC 60 for the specified machining parameters with improved accuracy.
Future scope
ANFIS, PSO, and Gray analysis can be used to further analyze this work for optimize predictive modeling of a system. In future, the system identification approach ARX /ARMAX can be used to modeling of the SBCNC 60 machine. We’ll be able to compare other alternative algorithms in the future to acquire the best predictive model of SBCNC 60 machine with optimized controlling parameters.