
Abstract
New energy integration is thought to be one of the most potential solutions to support the power system with a sustainable energy infrastructure. However, new energy is an uncertain power generation resource, and the electricity generated by it has the characteristics of randomness, intermittency and reverse peak regulation. Its large-scale integration into the power grid makes the operation and reliability scheduling of the power system more challenging. It was important to build a wireless sensing and monitoring network to monitor the power and change trend of the new energy field (station) in real time. The energy consumption of wireless sensing monitoring network is an important factor to improve the reliability of new energy scheduling. Based on the energy consumption of the wireless sensing monitoring network built by the new energy scheduling, the compression sensing technology was integrated and the network routing protocol (I-LEACH protocol) was optimized. The sampling data was transmitted by the cluster head node at the compression rate of 0.6, the improved OMP (Orthogonal Matching Pursuit) algorithm was reconstructed to achieve reliable data transmission, and the network energy consumption was further reduced. Compared with the I-LEACH routing protocol network, the experiments show that the network residual energy of the proposed method increased by 22% and the life cycle increased by about 30%. This method is helpful to improve the reliability of new energy power dispatching system and it can provide reference for realizing the reliability scheduling of new energy power system.
Keywords
Introduction
Facing the common problems of human beings, it has become the basic consensus and coping strategy of countries all over the world to vigorously develop and utilize new energy sources such as wind, solar and biomass, improve the efficiency of traditional energy use and develop a smart grid. In China, the acceleration of energy transformation and the achievement of environmentally friendly and low-carbon development have also been upgraded towards a national strategy. Up to now, the installed capacity of wind power and solar photovoltaic power generation connected to the grid in China ranks first in the world. However, the on-grid power does not match the installed capacity, and the phenomenon of wind and light abandonment is very serious. how to solve the problem of new energy power consumption has become the primary problem facing Chinas’ energy development. From the root, wind and solar energy as primary energy can not be stored. its generated electricity has random, intermittent and anti-peak characteristics., its large-scale integration into the power grid will lead to the power system operation and scheduling control becoming difficult, which is the fundamental reason why Chinas’ new energy power consumption difficulties are increasingly highlighted [1].
Compared with traditional energy forms, wind energy, solar energy and other new energy types are uncontrollable as primary energy sources, so advanced analysis and prediction based on meteorological information, historical data and a priori knowledge are effective means to realize its system modeling and simulation and be controllable [2]. The realization of real-time information and operation monitoring of new energy station resources helps to improve the regulation and control power of the power grid, increase the flexibility of the power grid operation, so as to realize the optimization and utilization of resources, and reduce the total cost of the system. Therefore, real-time monitoring of the field (station) power and change trend, prediction of wind power (photovoltaic) power generation power, realization of station data collection and processing, monitoring, operation abnormal alarm, operation trend analysis, comprehensive statistical analysis and theoretical power calculation are the necessary conditions for new energy scheduling [3].
New energy stations are established in relatively remote places and are usually relatively scattered. In order to realize the real-time collection, monitoring and calculation of their power generation status information, it is necessary to build a wireless sensor network for data transmission. Due to the remoteness and treacherous terrain of the sites, the wireless sensor network system is usually operated by batteries, whose service life is an important factor in determining the reliability of the system, so it is of great value to study the energy consumption of the system to improve the reliability of new energy dispatch. Based on the demand for real-time dispatching of new energy, this paper conducts a study on the energy loss of the wireless sensor network built with data acquisition nodes for real-time monitoring of the working status of new energy field stations, and intends to improve the service life of the monitoring system, so as to improve the reliability of new energydispatch.
In wireless sensor networks, the data collection method based on compression perception is perception data during transmission, the use of dimension reduction observation matrix for data compression, and generating a small number of measured values, and then pass it to the gateway node, and then by the gateway node through a reconstruction algorithm with less accurate measurements to restore the original data [4]. This method can realize data compression, reduce the number of packets transmitted over the network, and achieve the purpose of reducing network energy consumption.
Literature [5] proposes wireless sensor network clustering and compression forwarding methods based on distributed similarity, using dual prediction framework structure to reduce communication, achieving significant data reduction in intra-cluster and inter-cluster communication, making the collected data with optimal data accuracy. Literature [6] proposed a clustering algorithm based on compressibility, and the algorithm can achieve higher reconstruction accuracy with fewer measurement values. Literature [7] proposes a new weighted compressed data aggregation (WCDA) scheme. The scheme first focuses on the load balancing problem, the energy-efficient routing tree is formed by using the power control capability of sensor nodes. Then proposed the cluster-based weighted compression data acquisition (CWCDA) algorithm, and the CWCDA algorithm is applied to each cluster, to significantly reduce the number of sensor nodes involved in the process of each compressed sensing measurement. In summary, although the compressed data collection based on cluster structure can effectively reduce the energy consumption of data transmission, this method has high hardware requirements and no practical significance.
Literature [8] puts forward a kind of based on compressed sensing (CS) and efficient data collection method of data aggregation CN - MSTP (nodes) based on minimum spanning tree and interest, random projection nodes, and each projection node set to the root node, and the nodes interested in the combination structure into a minimum spanning tree, load balancing, so as to prolong the network lifetime, to some extent. Literature [9] proposes a data acquisition scheme based on compressed sensing (CS). This scheme regards the problem of building the aggregation tree as the Mixed integer linear programming (MILP) problem, and proposes the corresponding algorithm to make the energy load distribution of the network more uniform and minimize the total energy consumption of the network. In conclusion, although the compressed data collection based on the tree structure can reduce the number of data packets, improve the transmission efficiency, and accomplish the goal of balanced energy consumption, but this method has poor stability, and cannot fully achieve reliable transmission.
Literature [10] proposed a compression reconstruction algorithm based on the hierarchical connected tree structure of wavelets, which ensured the reconstruction accuracy and improved the reconstruction efficiency on the basis of the same measured value, and could collect data in a faster manner. Literature [11] adopts the data collection method of RW, which can collect large amounts of data in a short time with relatively low energy consumption. Literature [12] uses a greedy distribution data collection tree, which combines RW and CS to study the single-jump and multi-jump cases, respectively, by showing that the multi-jump cases are more energy-saving. In conclusion, such methods can collect a large amount of data and have low energy consumption, but ignore the consideration of the packet loss problem, and the reconstruction accuracy still needs to beimproved.
Literature [13] proposed a circular routing data model (RBCDR). In this model, the nodes with sufficient energy form a closed loop with minimum hop routing, aggregate all the data along the loop, and then transmit the aggregated data to the gateway node with minimum routing. Literature [14] proposes a method that applies compressed Data Gathering (CDG) and a sleep scheduling mechanism to wireless sensor networks. This method does not require message transmission between nodes to conduct sleep scheduling, and can achieve accurate information reconstruction and extend networklife.
To sum up, the fusion of the compressed sensing technology with the wireless sensor network can reduce the network energy consumption, but there are also some problems. This paper studies the typical layered routing protocol-Leach protocol commonly used in wireless sensor network. To reduce energy consumption of wireless sensor network monitoring system arranged according to new energy dispatching requirement, we have optimized, improved and innovated the compression sensing technology. The specific work done in this paper is as follows:
The method of collecting information at the cluster head is optimized. Before entering the information into the transmission between the clusters, the filtering link is introduced to filter the transformed data, to reduce the difficulty of the reconstruction and improve its quality,. In order to reduce the time and energy overhead, it is determined that when the number of nodes in the cluster is less than 20% of the average nodes in the cluster, the information in the cluster does not need to be compressed. A random feedback comparison link is proposed in the data transmission stage. Through feedback comparison, the purpose of random detection can be achieved, and the reliability of data transmission and the accuracy of signal reconstruction are improved. In the data reconstruction stage, the concept of backtracking is first introduced, the relationship between the measurement matrix and the new residual is calculated, and the correlation coefficient difference between the old and new residual and the observation matrix is compared to determine the reconstruction signal and the iteration cutoff.
Introduction to compressed perception theory
This paper comprehensively considers the problems of time, space and energy in the process of data collection, integrating it with compressed sensing on the basis of the optimized LEACH routing protocol (I-LEACH [15]), and proposes a dynamic data collection method I-LEACH-CS This method uses compressed sensing to compress the cluster head nodes, and finally transmits the compressed data to the gateway node through multi-hop routing. The gateway node accurately recovers the collected data with the improved OMP algorithm for balanced energy consumption and extended network lifecycle.
The compressed sensing theory can customize the compression rate according to the actual needs, and then reconstruct the compressed data accurately through the corresponding reconstruction algorithm. Compressed sensing theory, as a new sampling theory, can effectively make use of signal sparsity to reduce the amount of signal data [16].
Compressed sensing is also known as compressed sampling or sparse sampling [17]. The premise of its application is that the original signal has compressibility. In this way, the original problem can be transformed into an optimization problem and the original signal can be reconstructed by the OMP algorithm with a small number of samples [18].
The theory of shrinking perception is mainly composed of sparse transformation, random projection and reconstruction algorithm. The theoretical framework of compressed sensing is shown in Fig. 1.
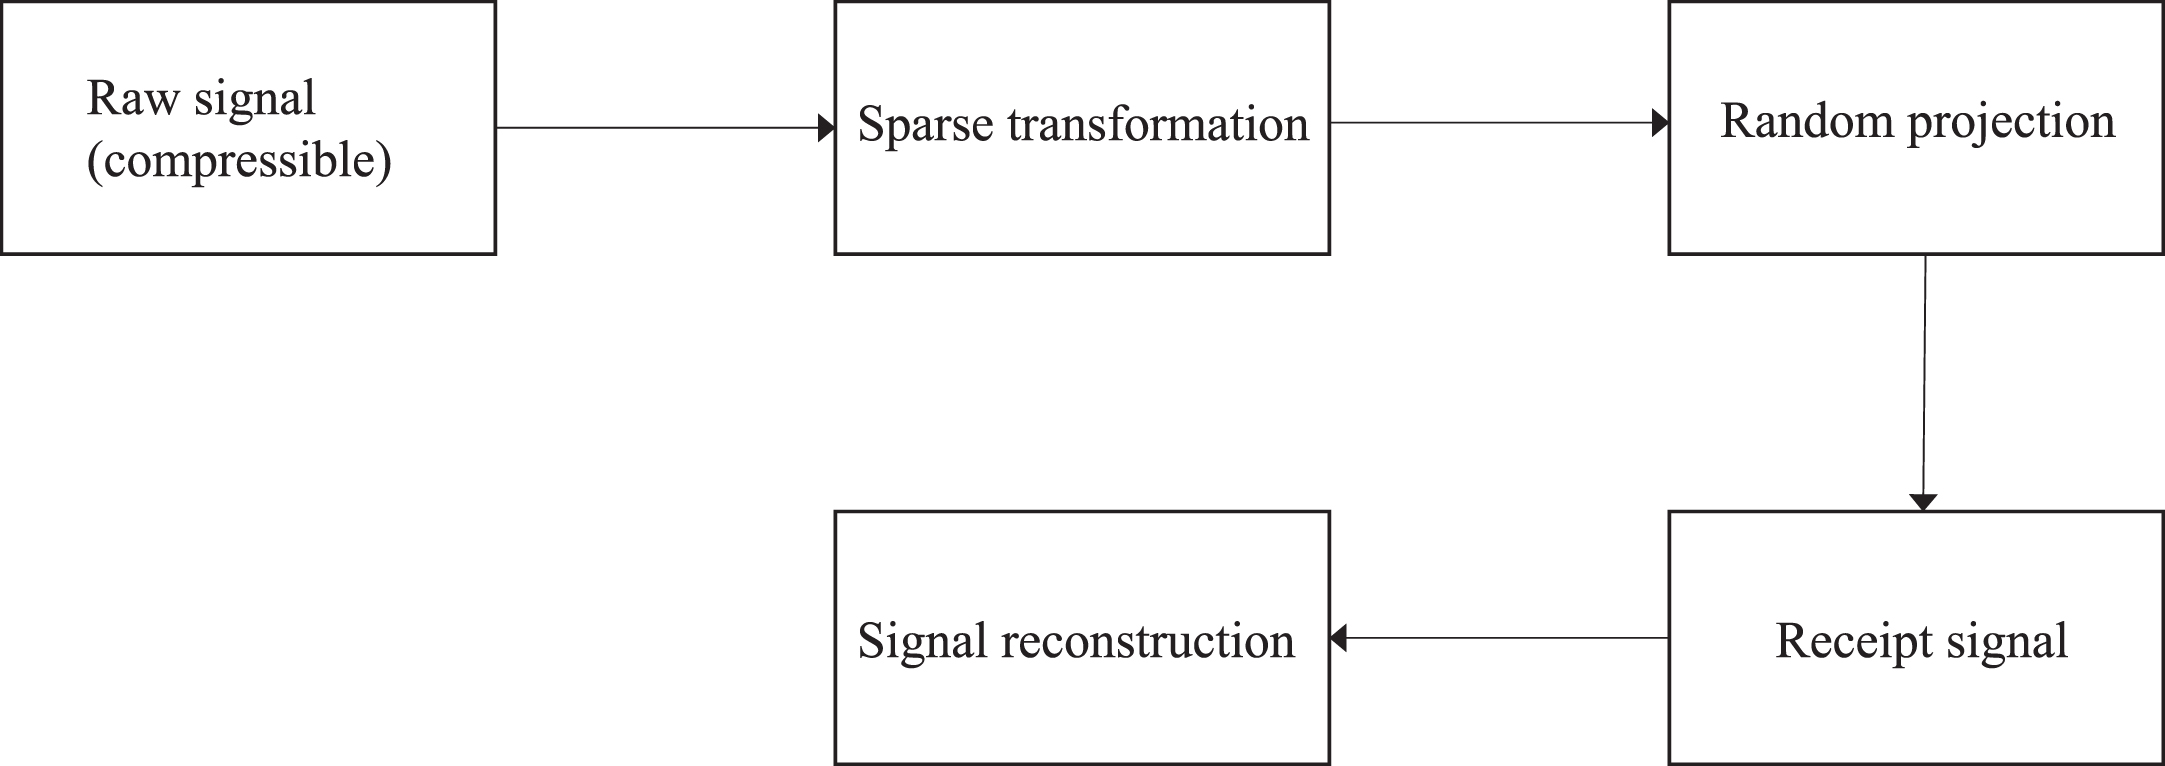
Schematic diagram of compression theory.
The goal of sparse transformation is to find an suitable transformation basis to enable signals to be sparsely represented. With the removal of zero values and smaller values, the number of signals will be reduced as much as possible without distortion. [19].
It is known that the signal is represented as x in time domain, and the signal is thinned by Fourier transform ψ = [ψ1ψ2 … . ψ
n
] ∈ RN×N, as shown in Fig. 2, then the sparse coefficient θ can be expressed linearly by the original signal X under Fourier transform:
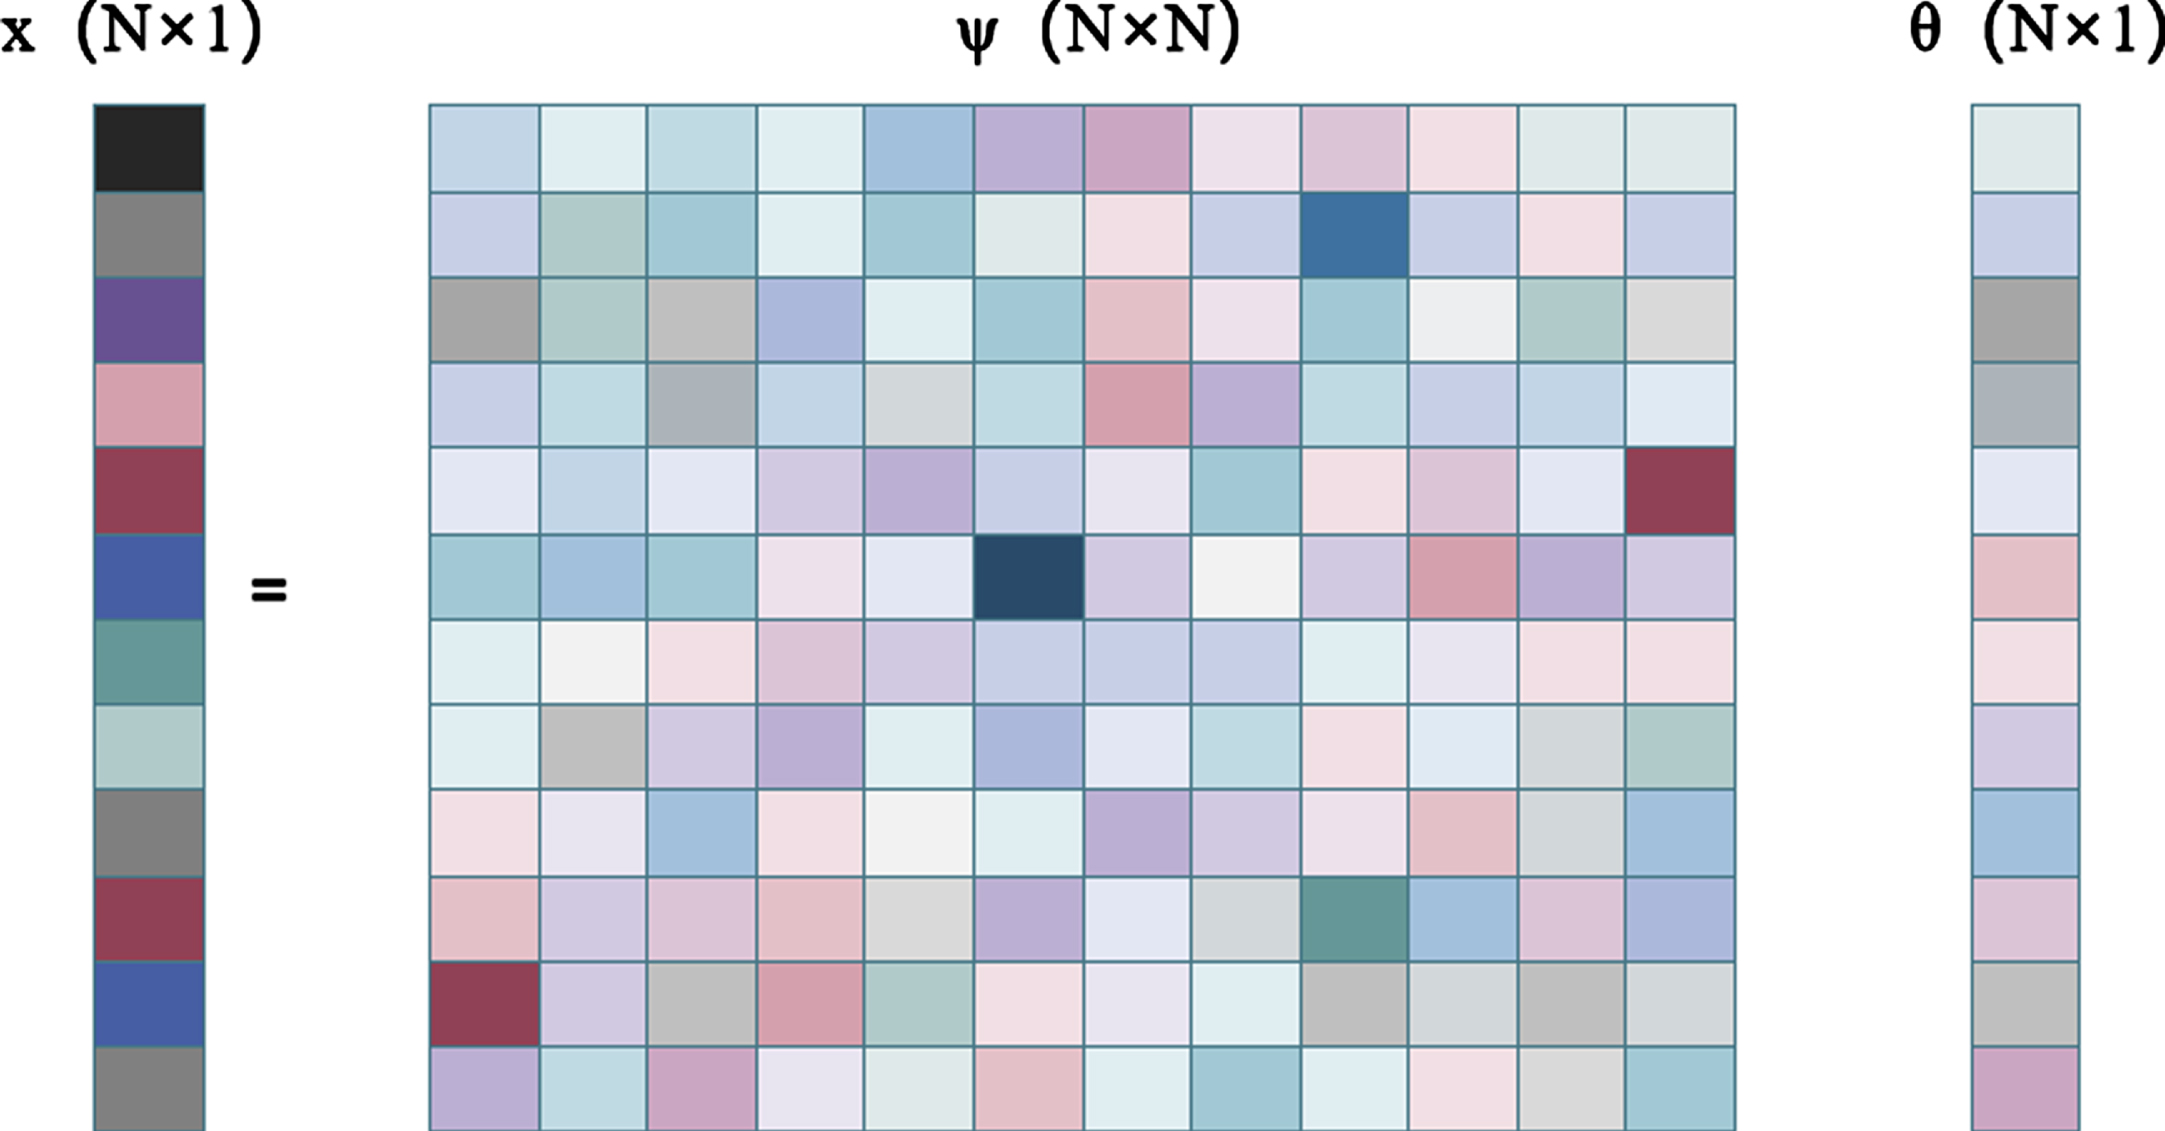
Data sparse.
In Equation (1), ∥θ ∥ 0 represents the number of non-0 values in θ, and the sparsity is K.
In Equation (1), since ψ is an orthogonal matrix, the inverse transformation matrix of ψ can be represented by ψT. According to Equation (1), it is not difficult to find that signal X is expressed in the time domain, while θ is the expression of signal x in the frequency domain after Fourier transform. In both expressions have the same meaning and different forms of expression.
Random projection is a process of dimensionality reduction of sparsely transformed signals by using an observation matrix to obtain a small number of measured values [20]. For compressed perception theory, it is necessary to find an observation matrix Φ ∈ RM×N unrelated to the sparse matrix (where M is far less than N). By rational design the observation matrix, a one-dimensional measurement vector y = [y1, y2, … yM] T with length M can be obtained, and the collected signal can be expressed as follows:
In Equation (2), Φ is the observation matrix, y is the one-dimensional measurement value vector, and x is the signal represented in the time domain.
The design and selection of the observation matrix Φ, which can reduce the dimension from N to M, is the core of compressed sensing. The process of data compression and projection is shown in Fig. 3.
By combining Equations (1) and (2), we obtain Φx = Φψθ = Acsθ, where Acs is the M×N dimensional random projection matrix. The combined data dimensionality reduction diagram is shown in Fig. 4.

Signal dimension reduction operation process.
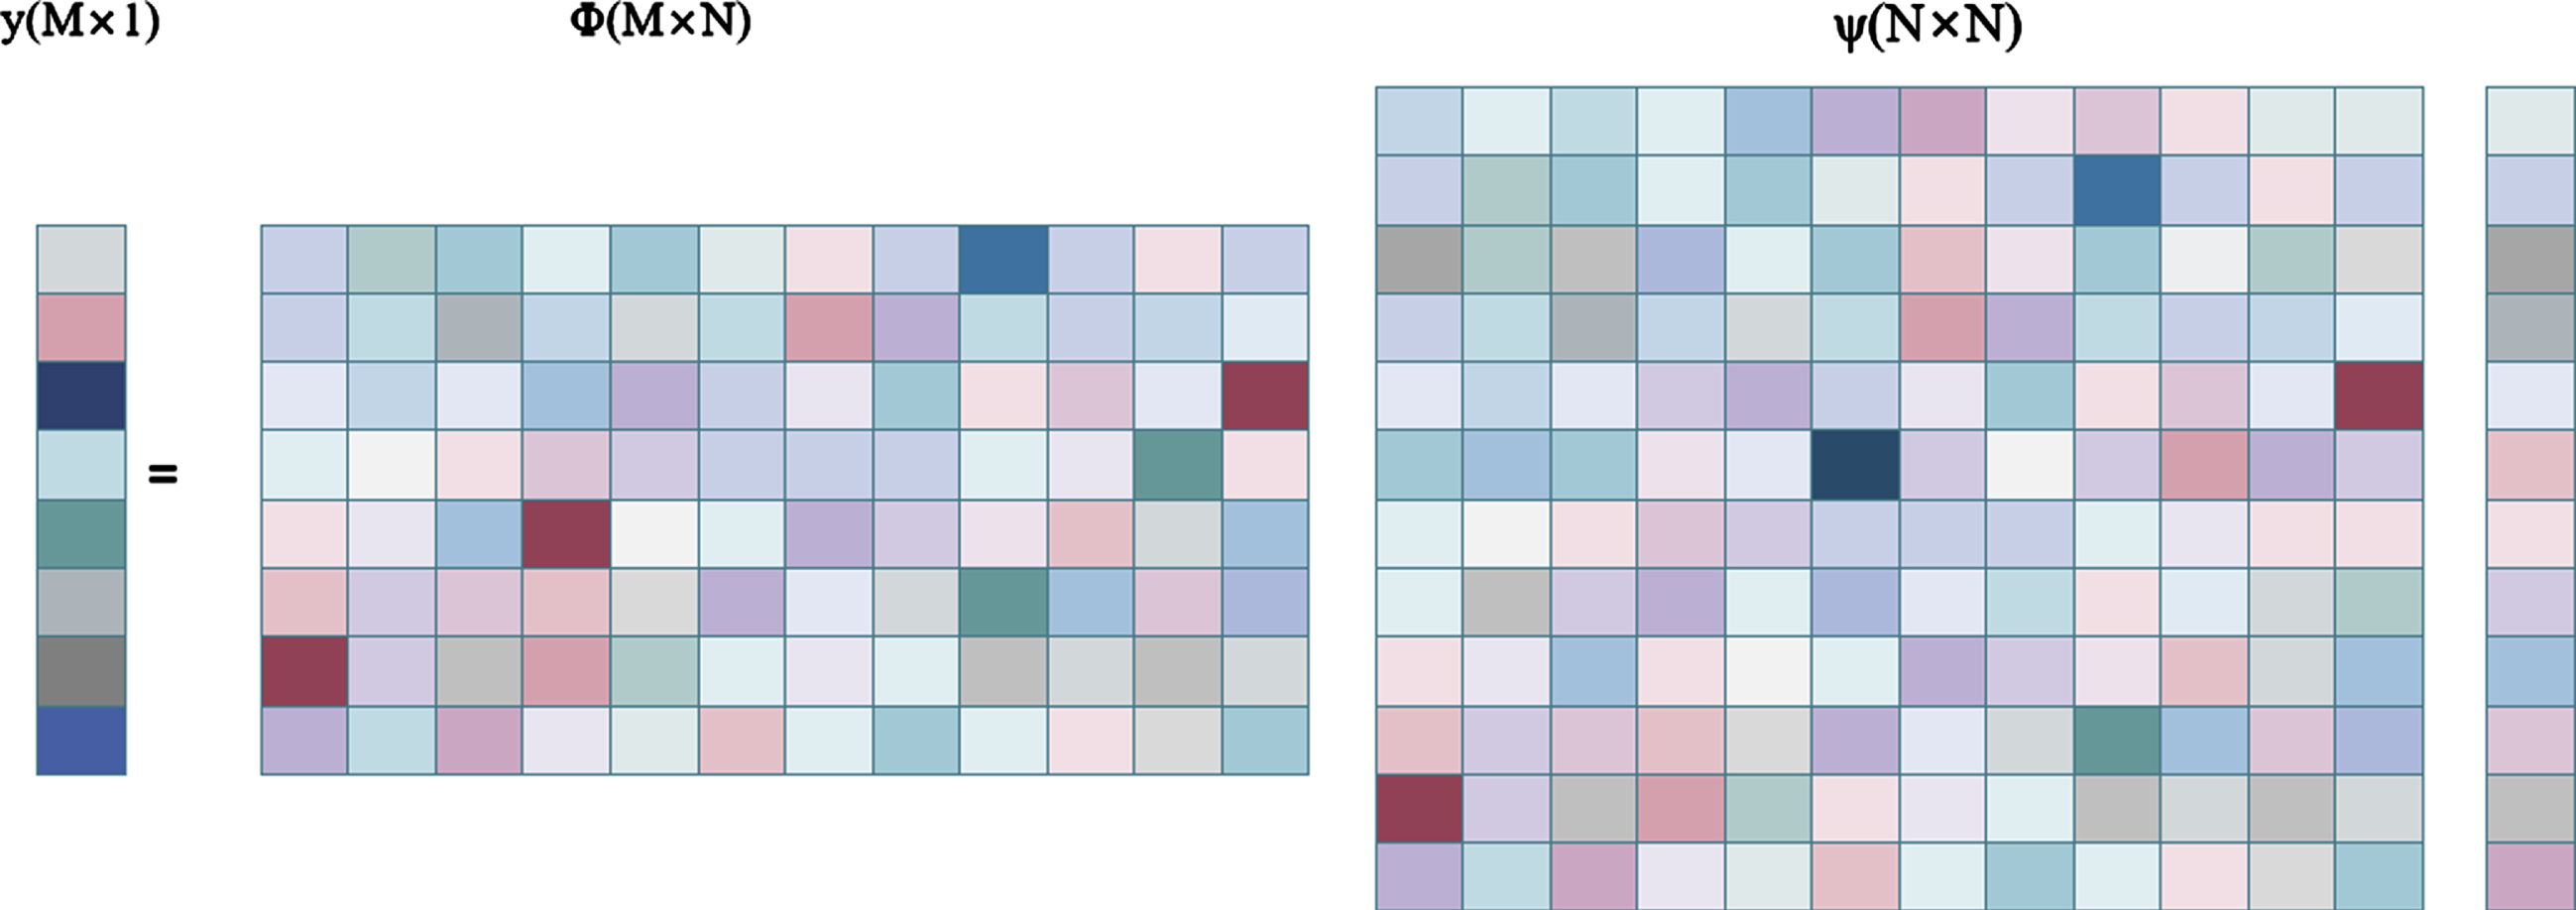
Signal dimension reduction extension diagram.
Given the observation matrix Φ, solving the original signal is a linear programming problem. Since M is far less than N, the above equation has numerous solutions (which cannot be solved directly). In this case, Restricted isometric Property (RIP) must be satisfied for the observation matrix [21]. For any signal x with sparse degree K, if there is a constant δk ∈ (0, 1), and thus the following Equation (3) is true, then the φ matrix satisfies the RIP property, namely:
If there is a constant δk ∈ (0, 1), then:
In Equation (3), the observation matrix Φ satisfies the effective isometric property of parameter δk with the set size of K, and the number of rows M indicates the number of measured values to be collected. In general, the measured value M and sparsity K satisfy Equation (4):
After the signal is compressed and transmitted, it usually needs to be reconstructed at the receiving end in order to restore the original data beforecompression.
Firstly, the signal was sparsely processed, and the correlation coefficient between residuals and the observation matrix was calculated according to Equation (5). Then, the atom corresponding to the maximum correlation was found in the observation matrix, and its index (corresponding column index of the observation matrix) was obtained according to the correlation coefficient, and normalized. Finally, the least square method is used to complete signal reconstruction as shown in Equation (6). If the condition is not satisfied, iterations are repeated, continuously reducing the residual until the number of iterations reaches the sparse number K to complete the exact reconstruction. The corresponding algorithm steps are shown in Table 1.
Step diagram of OMP algorithm
Step diagram of OMP algorithm
In Equation (5), r is the residual, the JTH column in Φj observation matrix Φ, and Equation (5) is to obtain the index λk of the atom corresponding to the maximum correlation with the estimated signal.
As shown in Equation (6),
As mentioned above, new energy stations are established in relatively remote places and are usually scattered. To achieve the reliability of new energy dispatch, real-time collection,, monitoring and calculation of their power generation status information, real-time data collection, and transmission of the wireless sensor network are needed. Integrating compressed sensing technology with the wireless sensor network can effectively reduce network energy consumption.
Fusion of compressed sensing technology with WSN routing protocol
In order to fuse compressed sensing and the I-LEACH routing protocol, assuming that the network has J clusters and the signals are sparse, the amount of information received by the gateway node can be expressed as:
In Equation (7), x is the information collected by the cluster-head node, and Φ is the observation matrix. That is, the information collected by the common nodes in each cluster is aggregated to the cluster-head node. After information fusion, the cluster-head node obtains a measured value through sparse transformation and random projection based on compressed sensing theory. The measurements for each cluster are obtained by multiplying the observation matrix M×N with x. The cluster head transmits the compressed information to the gateway node, where the data is finally reconstructed by a reconstruction algorithm out of the gateway node. The realization idea of the dynamic data collection method I-LEACH-CS is shown in Fig. 5.
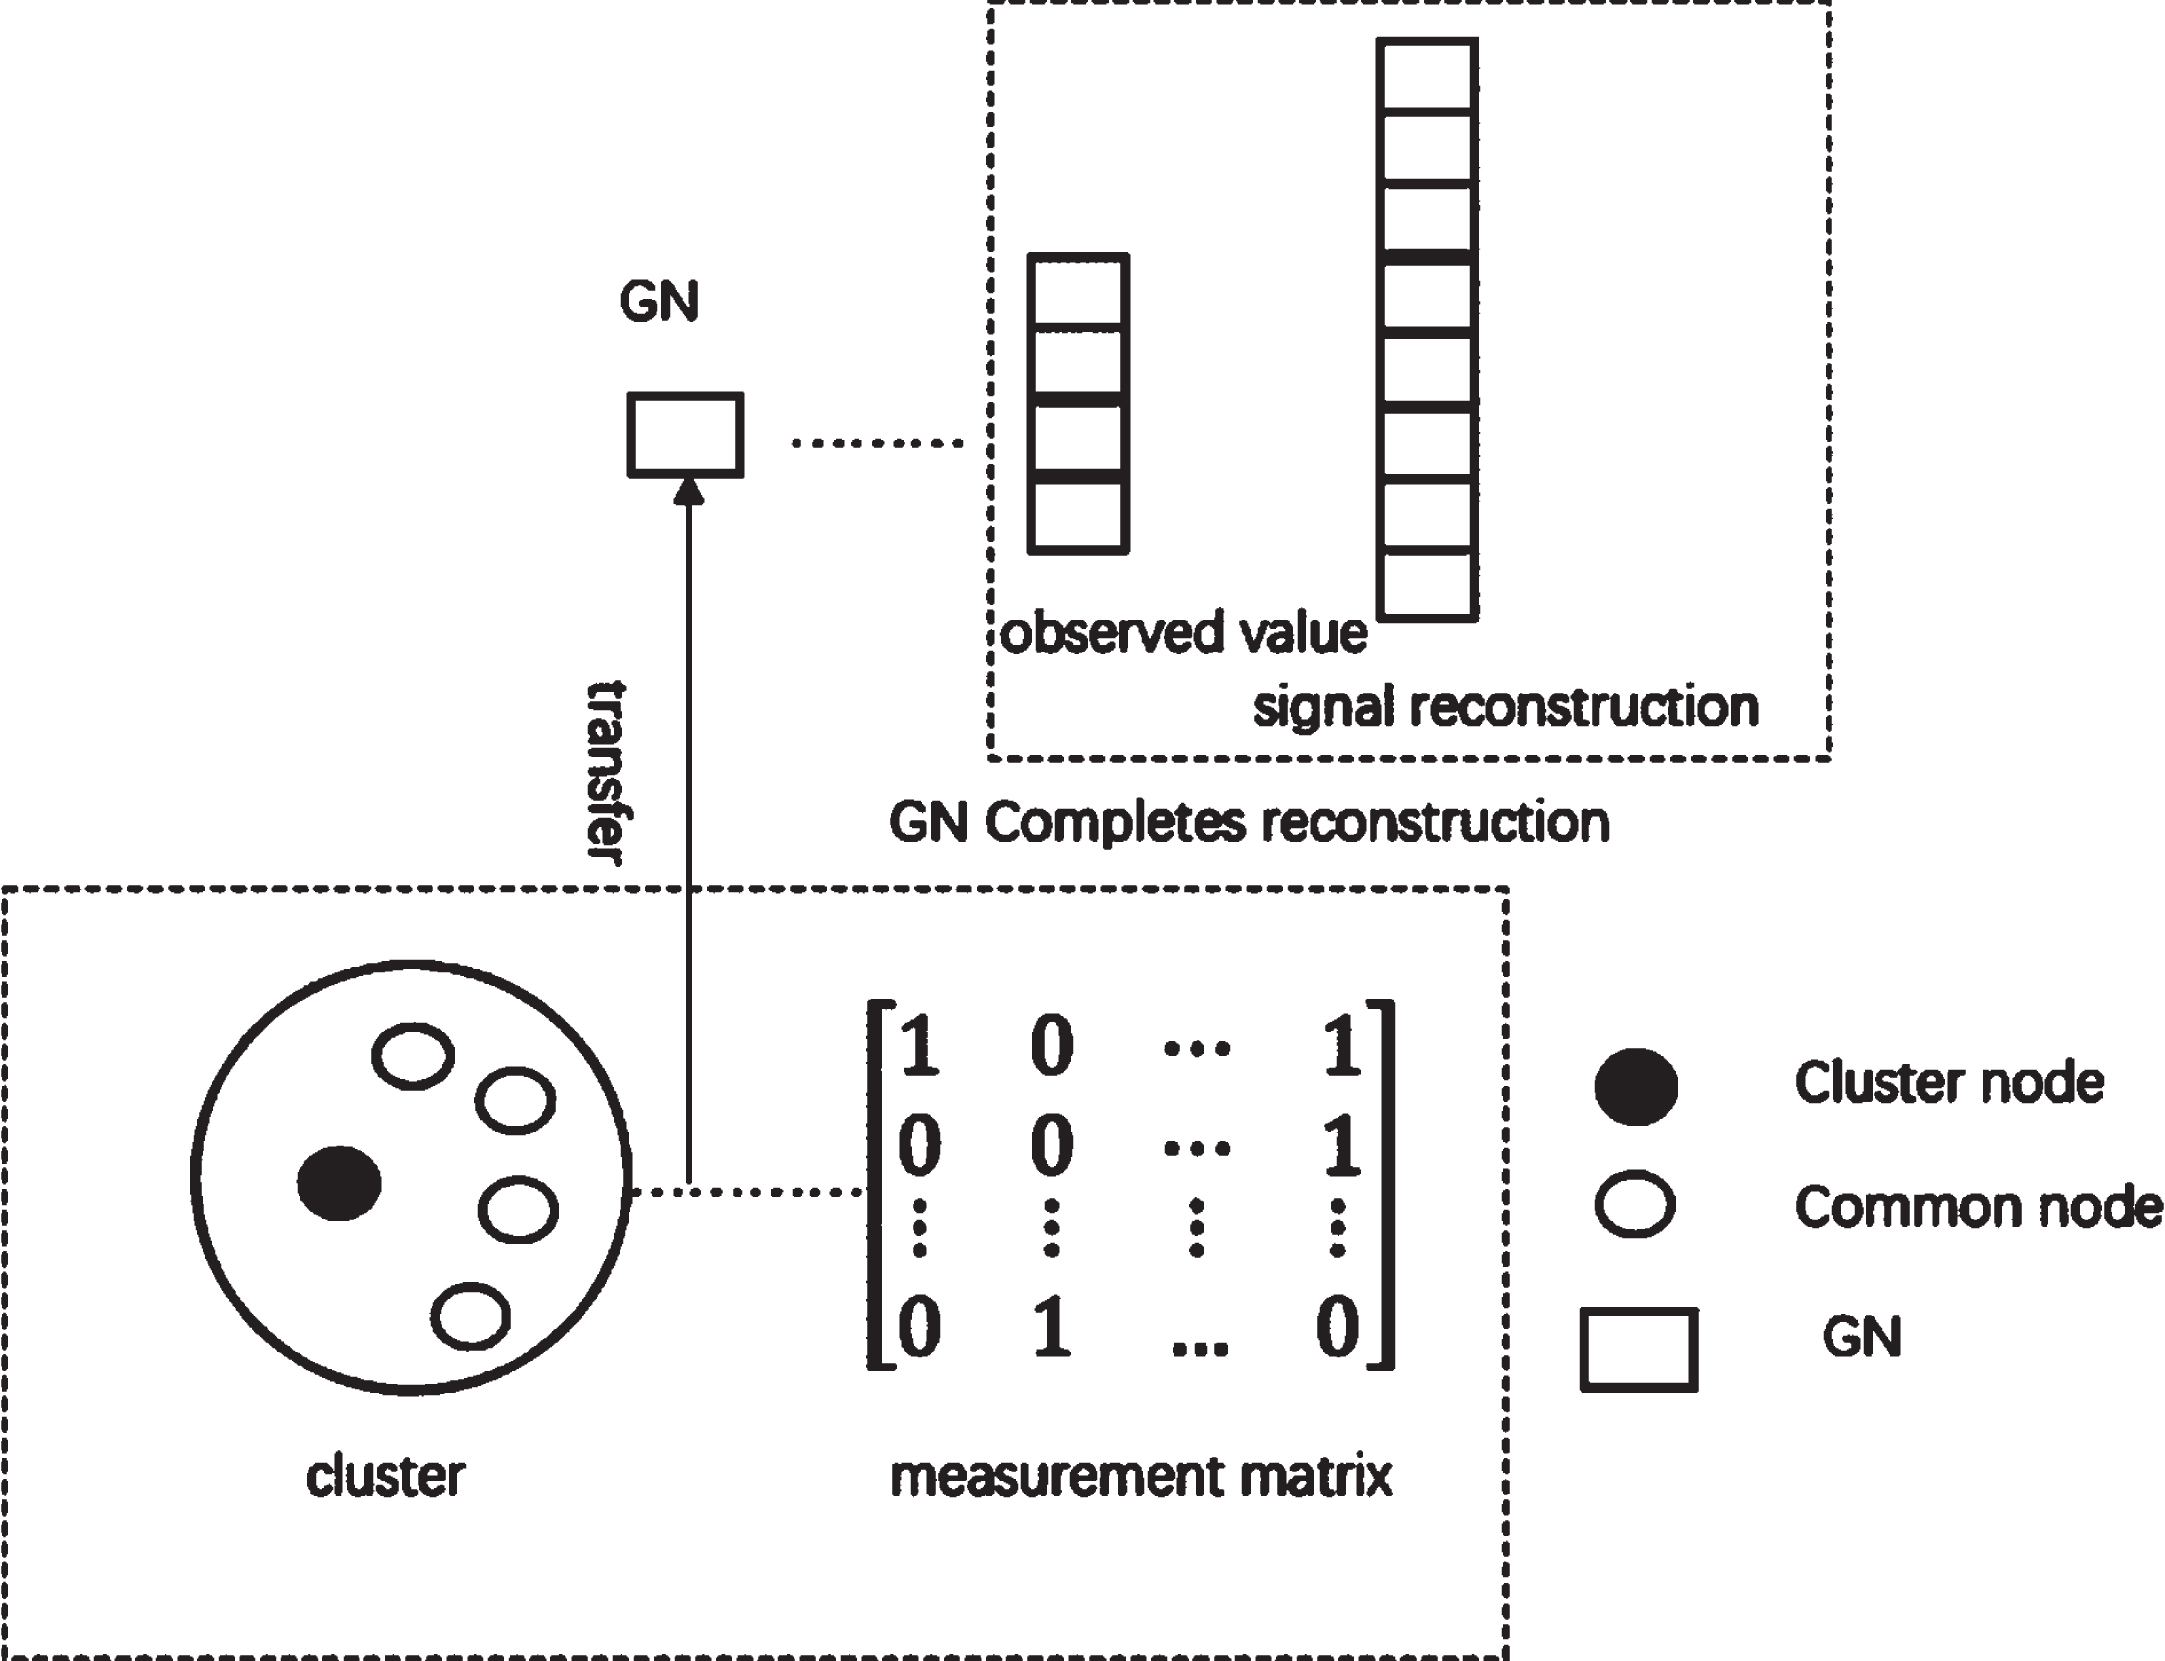
Implementation idea of I-LEACH-CS method.
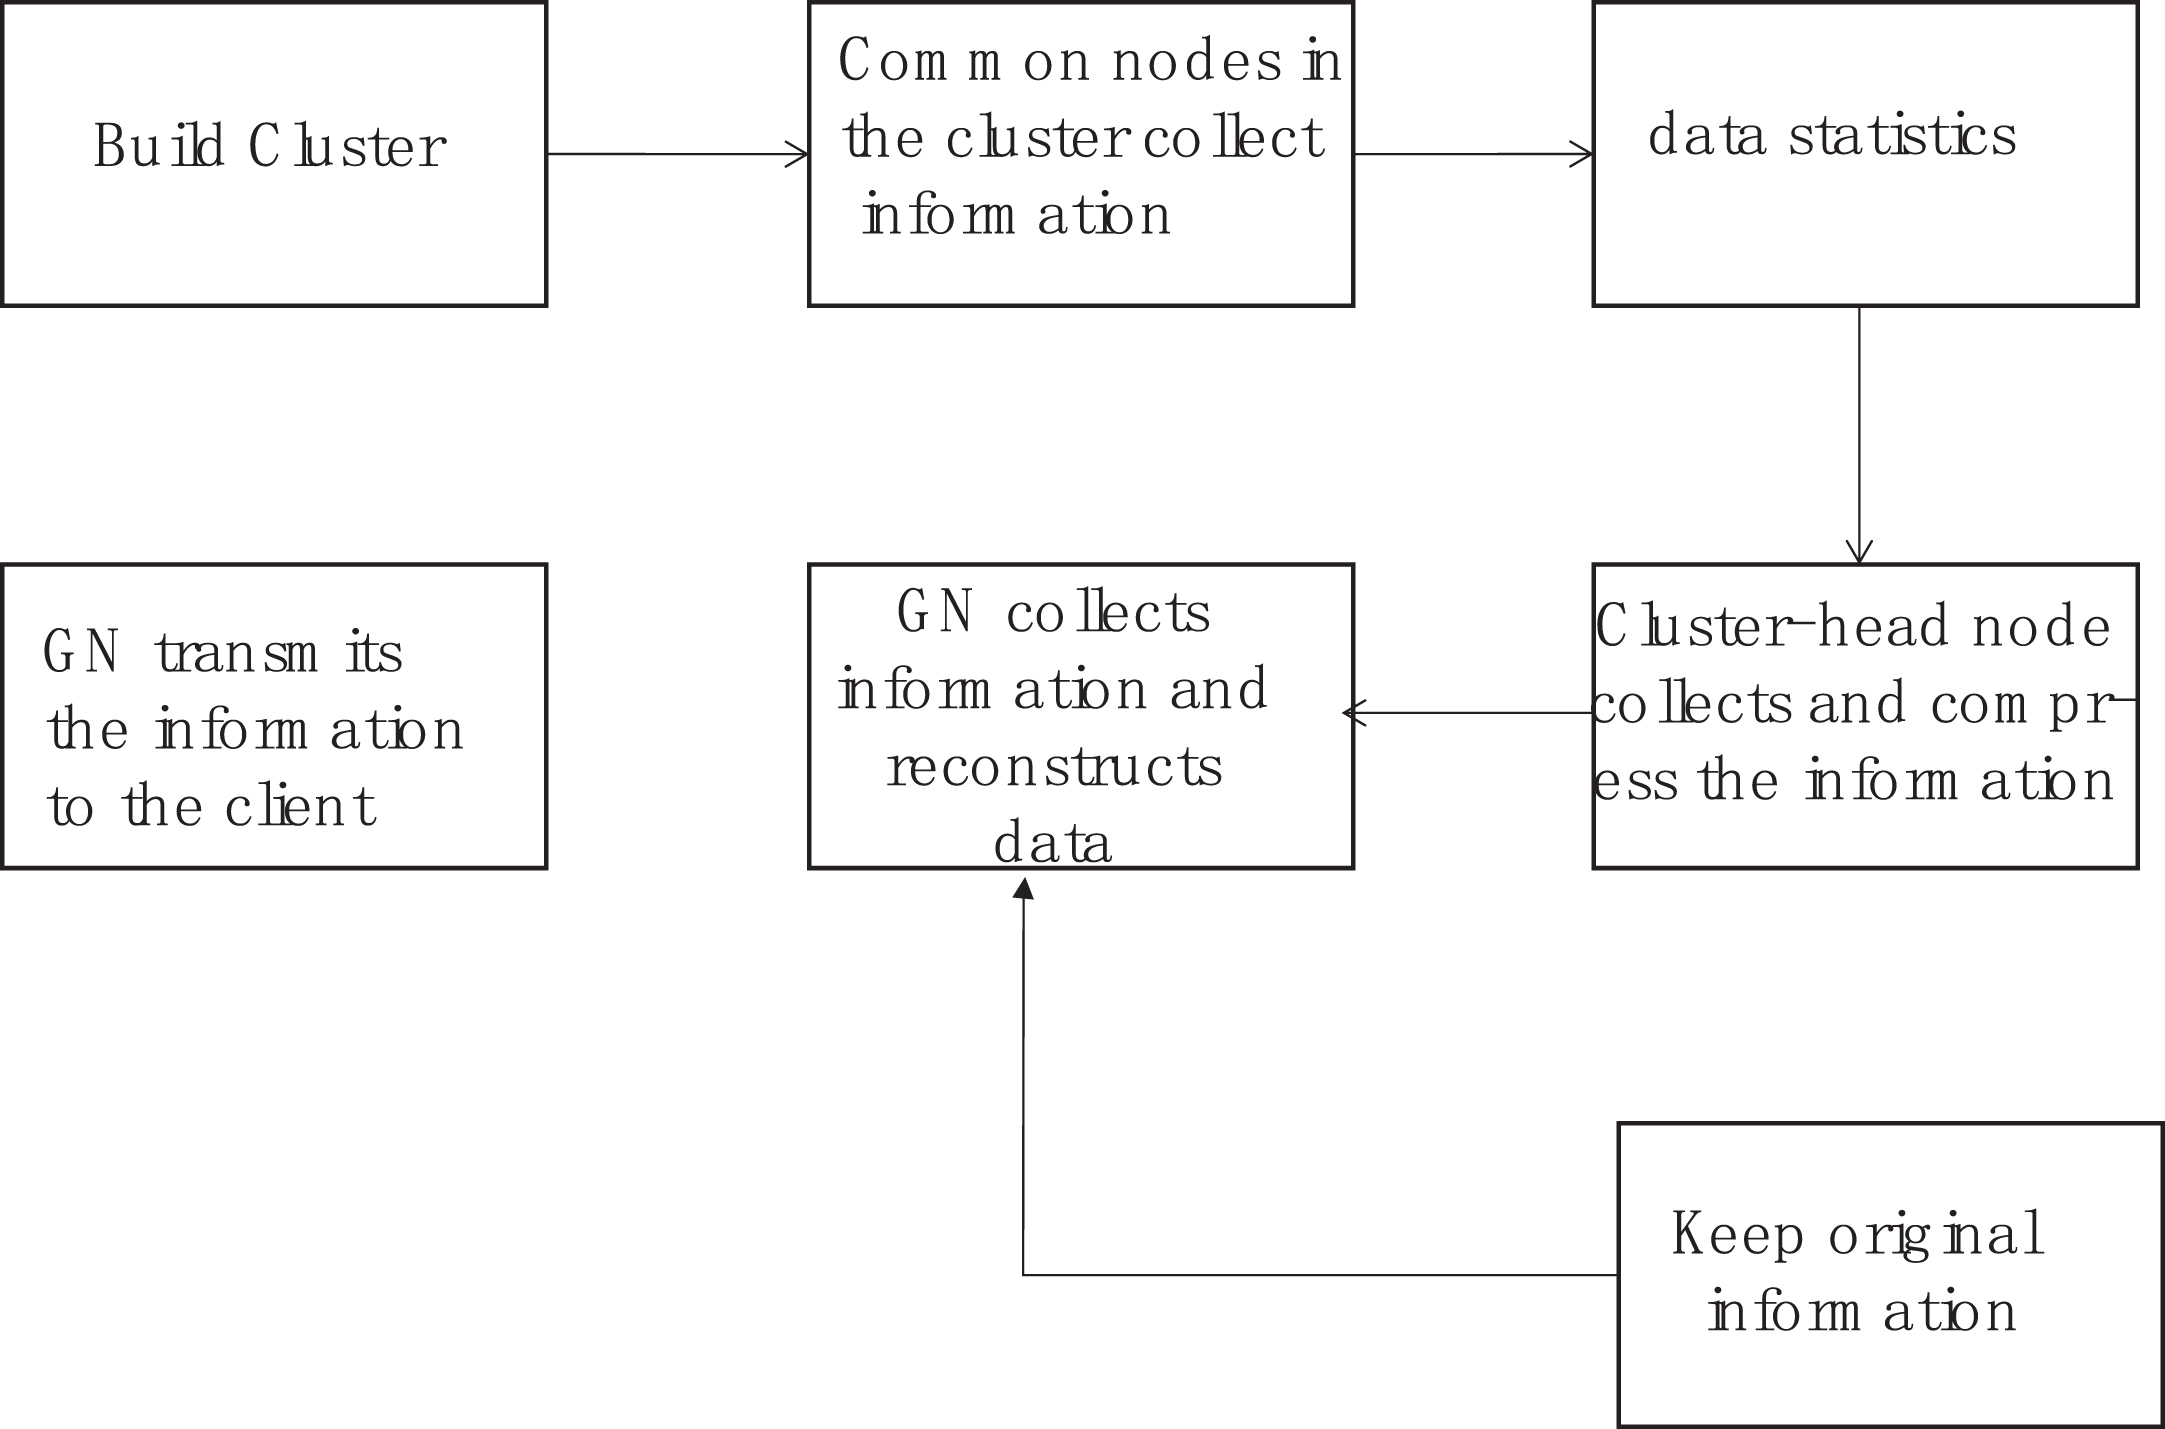
I-LEACH-CS method takes “wheel” as the unit of time. One “wheel” is mainly composed of five parts: cluster establishment, information collection by common nodes in the cluster, information collection and compression by cluster head nodes, collection and reconstruction by gateway nodes, and data transmission by gateway nodes to clients. The implementation process is shown in Fig. 6.
As can be seen from Fig. 6, after the I-LEACH routing protocol is clustered, the common nodes in the cluster gather the collected information to the cluster-head node. The cluster-head nodes compress the collected information according to a certain compression rate, and then transmit the compressed information successively until the gateway node. The gateway node takes the compressed data from the cluster head and uses the OMP reconstruction algorithm to recover it exactly before the next round of transmission.

I-LEACH-CS method overall step diagram.
The I-LEACH-CS method can reduce the amount of data transmission and complete data compression and reconstruction at the same time. However, this method also has some problems, such as poor reconstruction accuracy and packet loss rate. This paper will analyze this method and optimize it next.
(1) Optimization of cluster head collection information
Considering the sparsity requirements of the signal and the difficulty caused by the high frequency signals and the low frequency signals appearing during the sparse transformation, and the impact on the accuracy of the reconstruction. Therefore, this paper introduces a filtering link (band-pass filter, which sets the band range according to the random variation of the signal and the user-side requirements) to filter the transformed data before the information is transmitted between clusters, in order to reduce the reconstruction difficulty and improve its reconstruction accuracy.
(2) Compression process optimization
Since compressed sensing itself will also increase energy consumption, its advantages are more obvious when it is applied to large clusters. However, for small clusters, the amount of data needed to transmit is less, so there is no need for compression. Therefore, the compression flow of I-LEACH-CS method needs to be improved. Generally, when the cluster head compressively transmits the position and information of nodes in the cluster to the gateway node, it needs to be multiplied by a weight coefficient L (see Equation (8)). The cluster head 1 is L1, which can be deduced accordingly. According to the method described above, in each round the transmitted information from all cluster heads will be compressed, which will lead to significant time and energy consumption. According to the literature [22], after several attempts, it is determined that the number of nodes in the cluster is less than 20% of the average number of nodes in the cluster, i.e., n⩽ raise0.7exM / - lower0.7exN × 20 %, the information in the cluster does not need to be compressed. Where M is the number of all nodes and N is the number of clusters in each round.
In Equation (8), Φ is the observation matrix, Lj is the weight coefficient of the JTH cluster, xj is the signal collected in the JTH cluster, and Equation (8) is the total information transmitted to the gateway node.
(3) Data transmission reliability optimization
To solve the problem of packet loss, this section adds a system for random feedback comparison, as shown in Fig. 7. The system randomly selects a network according to a certain probability of a cluster. At this point, the cluster heads work points into three steps: the first step is to put the cluster head fusion information through random projection, the measured value of the generated compressed, and then through the transmission between cluster finally transmitted to the gateway nodes, and then through the OMP to refactor algorithm to compress the signal accurately. The second step is for the cluster head node to save the original signal backup, not for transmission) before compression. Step 3 Set the ratio. After many experiments, choosing of the contrast ratio is 90% the first step is to accurately reconstruct the signal and the signal of comparison. If to contrast ratio, then the system task is complete. Otherwise according to the weight coefficient of Equation (8), positioning a bunch of information and transmitting the backup information directly to the gateway node, the round of information transmission is complete.
Comparison diagram after adding feedback.
Random detection can be achieved through feedback comparison, which effectively avoiding the interference of large distorted signals caused by packet loss during reconstruction and improving the reliability of data transmission and the accuracy of signal reconstruction.
A regularized orthogonal matching pursuit (ROMP) algorithm is introduced to select multiple column vectors most relevant to residual for information reconstruction, so as to reduce iteration time and extend the network life cycle. For the ROMP algorithm, the sparsity of the signal needs to be known in order to reconstruct the compressed signal accurately.
The ROMP reconstruction algorithm is optimized for the OMP algorithm. Unlike OMP, ROMP takes the inner product of the residuals R and each column of the observation matrix φ and obtains its absolute value, thus obtaining N correlation coefficients, μ as shown in Equation (9).
In Equation (9), μ is the correlation coefficient, r is the current residual, Φj is the JTH column of the observation matrix, and Equation (9) is to find N correlation coefficients.
The realization process is as follows: first arrange N correlation coefficients in descending order, and then select the first K maximum values to find out the corresponding atoms and add them to the candidate set. Secondly, according to the regularization idea, the candidate set is screened twice, as shown in Equation (10), and half of the maximum correlation coefficient is taken as the constraint condition to group the atoms in the candidate set. After grouping, the corresponding atoms of the group with the highest energy value are added to the support set and become the matching atoms. According to the above iterative process, the support set was finally obtained through K cycles and the original signal was reconstructed. By obtaining the support set, the least square method is used to approximate the original signal (as shown in Equation (11)), and the residual value is updated as shown in Equation (12).
As shown in Equation (12), the
Equation (12) is to find the new residual, where rnew represents the new residual.
For the Table 2 displays a step-by-step diagram of the algorithm.
Steps diagram of ROMP algorithm
The regularized orthogonal matching pursuit algorithm (ROMP) adopted in this section carries out accurate data reconstruction of the original signal. The reconstruction algorithm must meet the requirements of known signal sparsity, so as to accurately restore the original signal.
Although ROMP algorithm has lower iteration times and time complexity compared with OMP algorithm, it still has some disadvantages. Sparsity K. When the number of iterations of the ROMP algorithm reaches sparsity K, the iteration is forced to stop, and the reconstruction accuracy is reduced due to the improper choice of K value. If the value of K is too small, the reconstruction accuracy is not enough. If K is set too large, the residual will saturate in advance, so a criterion is needed to limit the number of iterations to reduce the iteration time and reduce the network energy consumption. Regularization. Regularization can select multiple related column vectors, but this rough classification can also cause problems. If the atomic energy of one or several groups after grouping is not different from the maximum energy group, these groups will be selected to form a new candidate set in the subsequent iteration process, which will increase the number of data reconstruction iterations and cause redundancy in the whole process.
To address the problems in ROMP, this paper improves it: Firstly, the concept of backtracking is introduced, whose essence is to obtain the union by solving the newly selected atom and the support set obtained in the previous iteration, so as to obtain the new candidate set. According to Equation (9) and Equation (10), the correlation coefficients λk and λk-1 corresponding to the new residual rk (after backtracking) and the old residual rk-1 (before backtracking) and the observation matrix are calculated, and then the difference between the two is calculated. If the difference between the two is not significant,, the support set is updated, the iteration is stopped, and the reconstruction signal is obtained. If the difference is large, it will iterate again and keep comparing until it finds the correlation coefficient with a small difference and starts to reconstruct the signal. In this way, the iteration time is significantly reduced, the energy consumption is also reduced, and the quality of reconstruction accuracy is guaranteed. The steps of the ROMP algorithm optimization are shown in Table 3.
Steps diagram of optimized ROMP algorithm
By calculating the relationship between the measurement matrix and the new residual, the improved ROMP algorithm compares the correlation coefficient difference between the old and new residual and the observation matrix. If the difference is not significant, the reconstructed signal is obtained and the iteration is stopped. If the difference is large, a new round of iteration is started, and the next residual is selected for comparison until the difference is not large, and the reconstruction signal is obtained. Thus greatly reduce the number of iterations, remove redundant information, avoid unnecessary time cost, and improve the reconstruction accuracy of thealgorithm.
According to the literature [24], when the information transmission distance is d, the energy consumption E
f
of k-bit information transmission is:
In Equation (13), when d ⩽ d0, the network is a free-space model; when d ⩾ d0, the network is a multipath attenuation model. In general, d2 is used for intracluster calculation, d4 is used for intercluster transmission, ɛ fs is the amplification energy related to the sensitivity of the receiver, ɛ amp is the amplification energy related to the received noise image, E elec is the electrical energy related to digital coding and other factors, and k is the binary number of the transmitted information.
Receiving energy consumption Er can be defined as:
According to the above energy consumption model. The optimization algorithm proposed in this chapter is simulated by MATLAB. The simulation environment is shown in Table 4, and the compression rate is 0.6 with reference to the conclusion in the literature [23]. Among them, the LEACH routing protocol, LEACH-C routing protocol and I-Leach routing protocol are the comparison objects. The I-LEACH-CS method is a fusion and optimization method of the I-LEACH routing protocol and compressed sensing.
Simulation experiment parameters
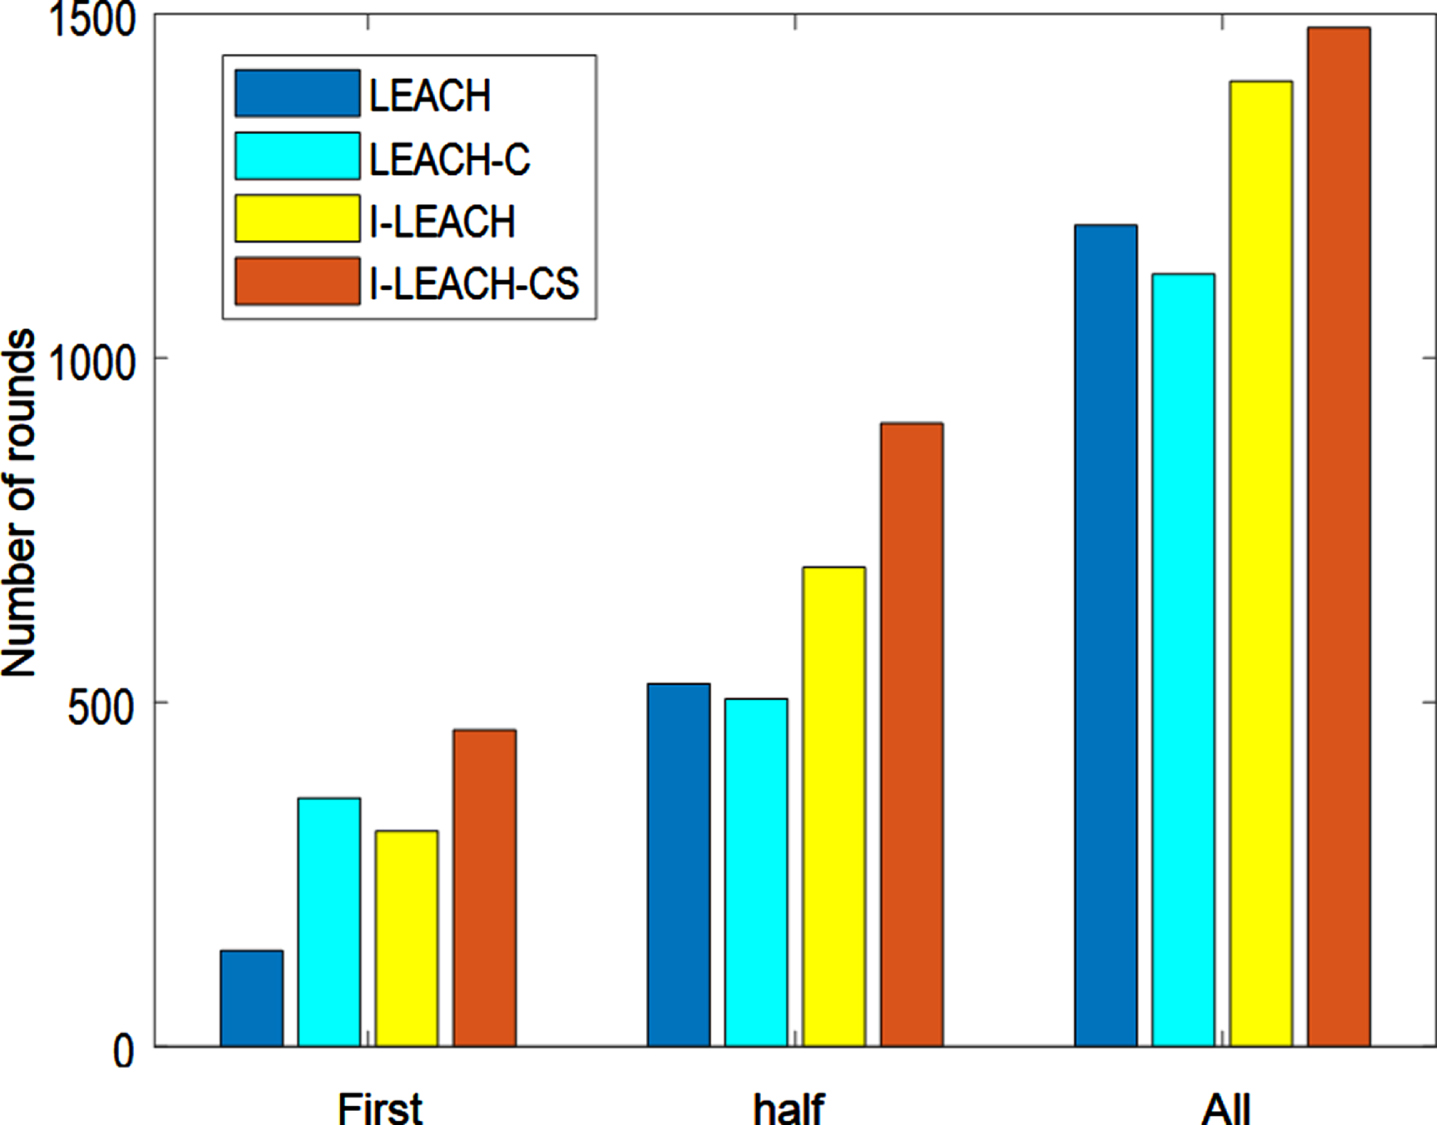
(1) Comparison of the number of death nodes under the three evaluation criteria
As shown in Fig. 8, the bar chart shows the comparison of the number of rounds under the four protocols when the first node dies, half of the nodes die, and all nodes die during 1500 rounds of cluster head election in the network. The abscissa is the number of dead nodes, and the ordinate is the number of time rounds. In terms of the number of deaths of the first node, the I-LEACH routing protocol has the first death node in 313 rounds, while the I-Leach-Cs method has the first death node in 460 rounds, and the I-LEACH-CS method has the performance of about 46% higher than in the i-Leach routing protocol. From the perspective of half nodes, in the I-LEACH routing protocol half of the nodes died in 696 round, I-LEACH-CS method half of the nodes died in 905 round. The I-LEACH-CS method is 30% longer than the I-LEACH routing protocol lifetime. According to the death index of all nodes, the I-LEACH routing protocol all died around 1400 rounds, while the I-LEACH-CS method died around 1460 rounds with an improved life cycle. The difference in the number of dead nodes between the I-LEACH-CS method and the I-LEACH routing protocol was not significant in the early optimization results.. After half of the nodes, the gap is widened, and the larger the number of rounds, the advantage of the I-LEACH-CS method is more obvious. This is because the energy of nodes in the early network is sufficient, so the optimization effect is not obvious. After the middle stage, the data transmitted by cluster-head nodes is compressed to protect the life cycle of cluster-head nodes and prolong the life of the whole network. In the later stage, the energy of each node is insufficient, so the optimization effect of the I-LEACH-CS method is no longeroutstanding.
Comparing the network life cycle in terms of the number of dead nodes.
(2) Total remaining energy
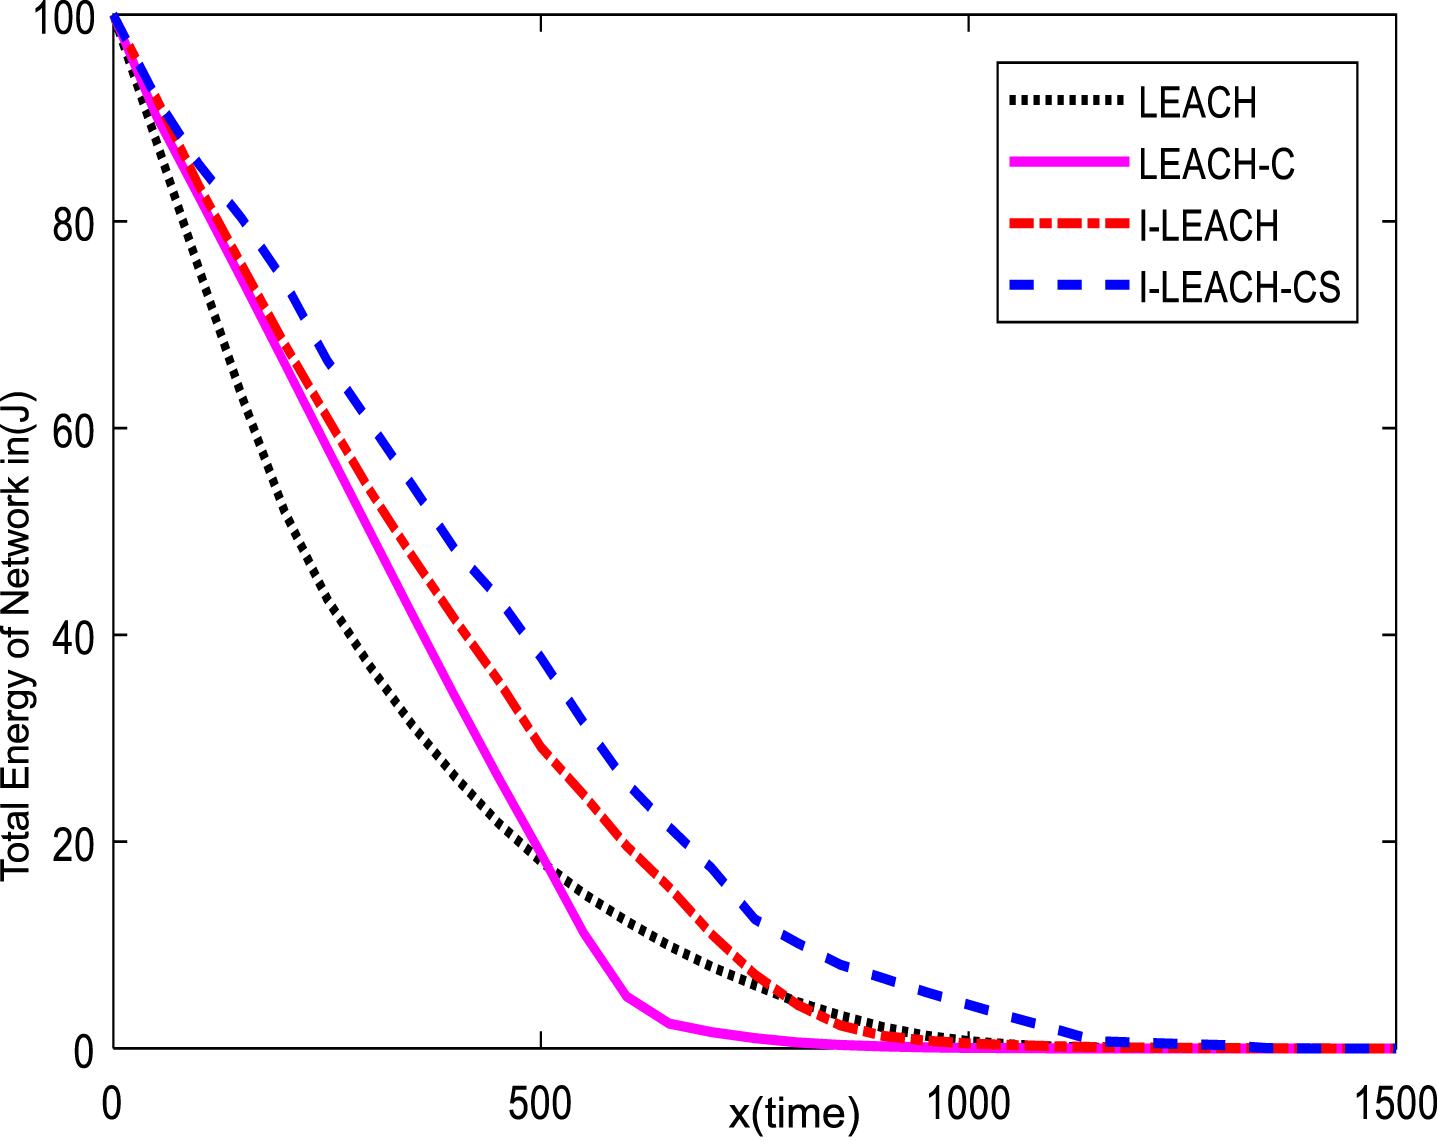
As shown in Fig. 9, with the passage of time, the wireless sensor network is constantly collecting information from the monitoring area, and the energy of the whole wireless sensor network is constantly decreasing. The horizontal axis of Fig. 9 is time and the vertical axis is the total residual energy of the entire wireless sensor network. As can be seen from the four curves in Fig. 9, with the increase of time, the energy transformation trends of wireless sensor networks are different, and the total residual energy of the network using the I-LEACH -CS method is always higher than the multi-factor weighted I-LEACH routing protocol proposed in chapter 1. After 400 rounds, the trend of higher network residual energy than the I-LEACH routing protocol becomes more and more obvious. In the early stages there is little difference in energy as each node has enough energy in the early stages. The advantage of the I-LEACH-CS method, however, gradually becomes apparent in the middle and late stages as the distance between nodes in the entire network increases. As a result, the energy consumption of the nodes increases, while the residual energy of the network decreases. In 1400 rounds of the I-Leach routing protocol, the residual energy of the network gradually tends to zero, while the residual energy of the I-LEACH -CS method remains. This is because the compressed sensing technology (CS) is applied to compress the information of cluster head nodes, protecting the energy of cluster head nodes and balancing the energy consumption of clusters. Improves the life cycle of the entire network. Therefore, it can be concluded that the I-LEACH -CS method can further reduce energy consumption and effectively prolong the life cycle of wireless sensor networks at the same time. Compared with the LEACH routing protocol, I-LEACH -CS proposed in this paper not only balances the energy consumption of the network, but also has better scalability and is more suitable for large-scale wireless sensor networks.
Residual energy of the network under the four protocols.
(3) Signal reconstruction effect comparison
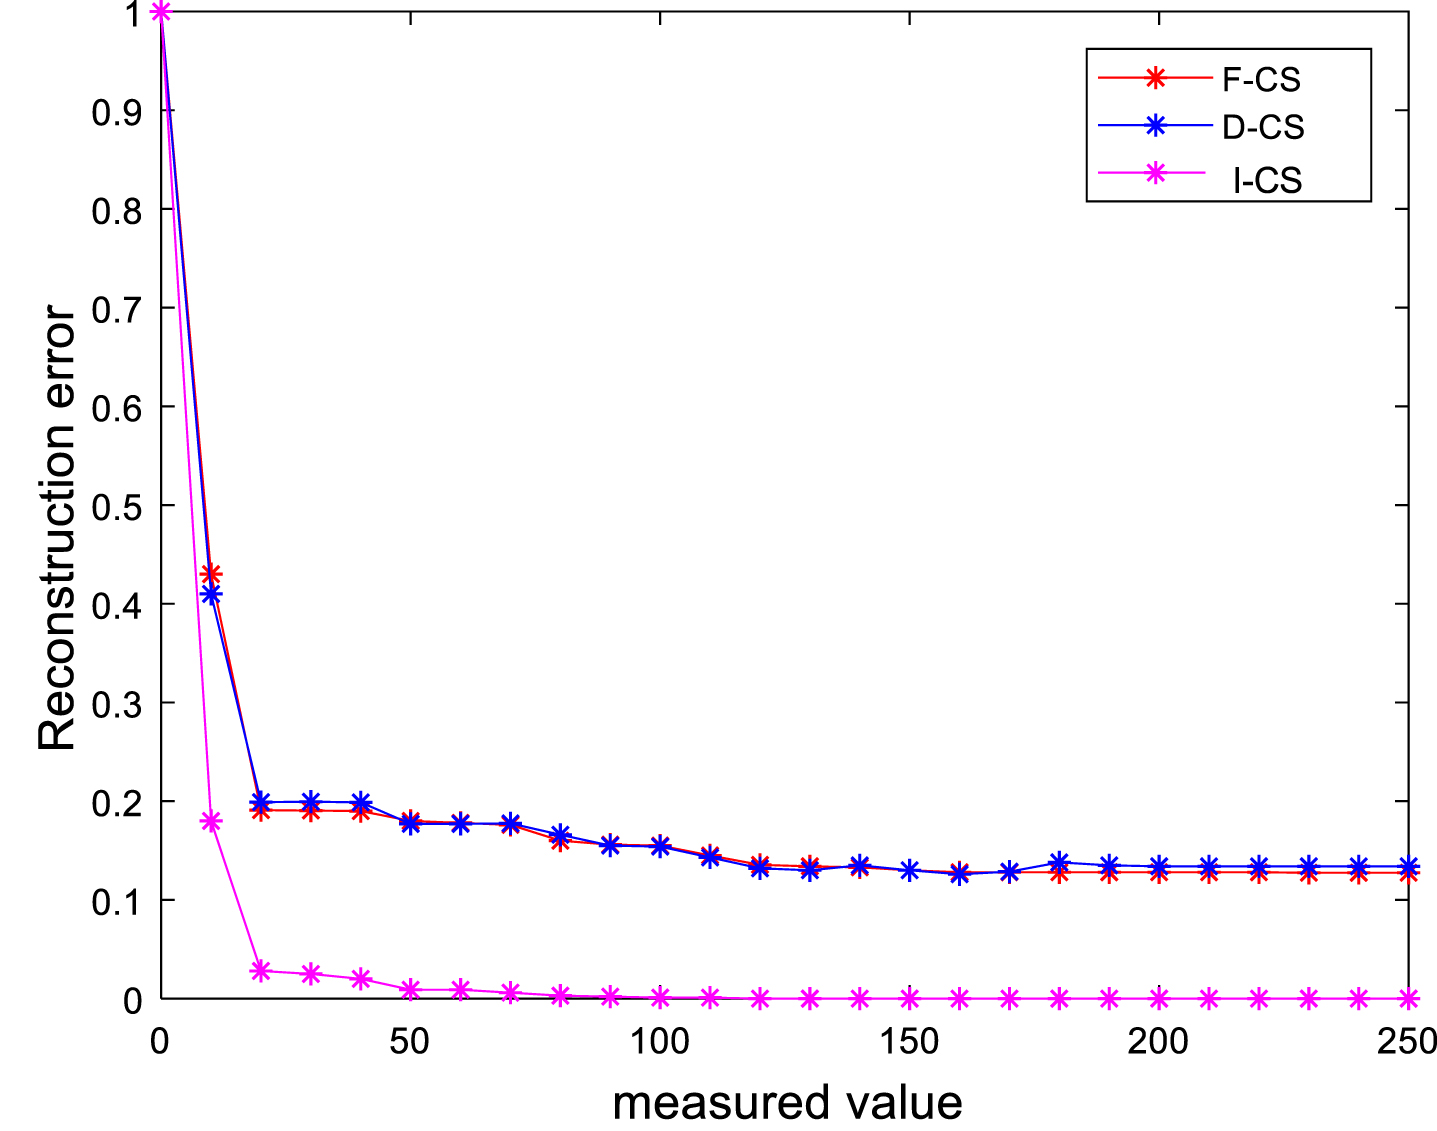
As shown in Fig. 9, the reconstruction error becomes smaller and smaller as the number of measured values increases. In the I-LEACH-CS data collection method, the fourier transform matrix is used as sparse basis, the gaussian random matrix is used as measurement matrix, and the OMP is used as compressed sensing (F-CS) of reconstruction algorithm. A discrete cosine transform matrix was used as a sparse basis, the gaussian random matrix was used as a measurement matrix, the OMP was used as a compressed sensing (D-CS) of reconstruction algorithm. And in the optimized I-LEACH-CS method, The Fourier transform matrix is used as sparse basis and the improved OMP is used as compressed sensing reconstruction algorithm. This paper focuses on comparing the relationship between the required the measured values and the reconstruction error for three compressive sensing reconstruction algorithms. The reconstruction error is defined as:
Assume that x in Equation (15) is the raw data, and the estimated data of
Reconstruction error graph under three methods.
In this paper, we propose a wireless sensor network data collection method that integrates the I-LEACH routing protocol with compressed sensing for the energy consumption problem of the wireless sensor monitoring network built by the new energy dispatch. The cluster head node uses compressed sensing to compress the collected data, while the gateway node uses the enhanced OMP algorithm to reconstruct the collected data accurately. The experimental results show that the method proposed in this paper, compared with the I-LEACH routing protocol method, can transmit fewer data packets, has lower network energy consumption, a long network life cycle, better network scalability, and is more suitable for the application of large wireless sensor networks. Compared with the traditional compressed sensing, the proposed method can accurately reconstruct the original signal on the basis of relatively few measured values.
In conclusion, the network energy consumption optimization method adopted in this paper can effectively reduce the network energy consumption, improve the service life of the real-time monitoring system of new energy scheduling, and then improve the reliability of the system, which is conducive to the real-time scheduling of new energy.
Although the feasibility of the method has been verified theoretically, no relevant tests have been carried out in the project, which will be carried out in the future.
Footnotes
Acknowledgment
This work was supported by Natural Science Foundation of Hunan Province under Grant NO: 2021JJ31142.