
Abstract
Cross-efficiency evaluation is an extension of data envelopment analysis (DEA), which can effectively distinguish between decision-making units (DMUs) through self- and peer-evaluation. The cross-efficiency of each DMU in a set of DMUs is measured in terms of intervals when the input–output data are represented by the number of intervals. Based on the interval cross-efficiency matrix, the interval entropy is defined in terms of the likelihood. Then, considering the influence of peer evaluation, the interval conditional cross-efficiency entropy is proposed and an aggregation model of the interval conditional cross-efficiency entropy is presented to create a ranking index for DMUs. Finally, a simple example is provided to illustrate the effectiveness of the proposed method, which is applied to the evaluation of forest carbon sink efficiency in China. The results indicate that the final cross-efficiencies of all 30 provinces range from 0 to 0.6. Among these provinces, those with a relatively high efficiency include Guangdong, Guizhou, Hainan, Shandong, and Qinghai.
Introduction
Data envelopment analysis (DEA) is a non-parametric method that can evaluate the relative efficiency of a set of decision-making units (DMUs) with multiple inputs and outputs. Its essential principle is the comprehensive analysis of the input and output data of DMUs, obtain the relative index of each DMU efficiency, and then rank all of the DMU efficiencies to determine the most effective DMUs. Charnes et al. [1] first proposed a DEA model to measure the relative efficiencies of DMUs. Their model simply divided the DMUs into effective and non-effective units; however, it could not distinguish between DMUs with equal efficiencies. The traditional DEA method is based on the concept of self-evaluation, and it evaluates its own efficiency value from the perspective that is most beneficial to ensure that its own efficiency is relatively optimal. As a result, the DMU being evaluated may overestimate its own advantages and avoid its disadvantages. To solve this problem, Sexton et al. [2] introduced the concept of peer evaluations and proposed a cross-efficiency evaluation method in which all DMUs used their input and output self-evaluation weights to evaluate each other. The cross-evaluation method could effectively avoid the disadvantages of the traditional DEA method, and thus it has since attracted the attention of many scholars.
The relevant research can be divided into the following main categories. The first type of research has mainly focused on formulating strategies for cross-efficiency. When evaluating the efficiencies of DMUs, there will be multiple groups of weights for the optimal cross-efficiency obtained using the cross-efficiency evaluation method. To solve this problem, Doyle and Geen [3] proposed aggressive and benevolent strategies. However, aggressive and benevolent strategies may lead to two different evaluation results, and the choice of strategy is a difficult problem. To avoid the above problems, Wu et al. [4] developed a bargaining game model for cross-efficiency evaluation. In the bargaining game model, each DMU is regarded as an independent participant, and the bargaining solution between the CCR efficiency and cross-efficiency is obtained using the classic Nash bargaining game model. The results show that the bargaining efficiency is a Pareto solution. Wang and Chin [5] proposed a neutral model. In this model, the DMU does not consider the efficiency evaluation of other DMUs but only determines the weight from its own perspective. The cross-efficiency calculated in this manner is more neutral and logical. Based on the target recognition model, Wu et al. [6] considered the ideal and non-ideal cross-efficiency targets of all DMUs to build several secondary target models.
The second type of research involves the aggregation of cross-efficiency matrices. The entropy weight method is the mainstream method for aggregating cross-efficiency matrices. Extensive research has been conducted on the aggregation of cross-efficiency matrices using the entropy weight method. Wu et al. [7] extended information entropy theory to solve the ranking problem of the cross-efficiency matrix. Qi and Guo [8] calculated the Shannon entropies of the input and output weights. The different optimal weight sets were aggregated into a common weight set, which was then used to determine the importance of different DMUs. Song et al. [9] introduced the Shannon entropy to obtain public objective weights for cross-efficiency matrix aggregation to avoid subjective factors. Song and Liu [10] proposed a variance coefficient method based on the Shannon entropy to weight the interval cross-efficiency of DMUs by considering the mean and variance of the information entropy. Si and Ma [11] combined the relative entropy evaluation and grey relational analysis methods to rank the efficiency of DMUs. Lee [12] determined the final ranking of DMUs by calculating the information entropy of the cross-efficiency scores for each DMU in different models. Scholars have also used other methods to aggregate the cross-efficiency matrices. Oukil and Amar [13] developed two programs based on OWA to aggregate the cross-efficiency using the positive attribute of the preference voting matrix. Wu et al. [14] used the entropy weight method to aggregate the index weights, further generate a group of public weights, and then use the measurement of alternatives and ranking according to compromise solution (MARCOS) method to rank the DMUs. Their method has been used in a wide range of fields, such as advanced manufacturing technology selection [15], economic–environmental performance measurement [16], performance measurement of nations participating in the Olympic Games [17], public resource management evaluation [18], portfolio selection [19], baseball player ranking [20], sustainable development efficiency evaluation [21], and university research evaluation [22].
The traditional DEA model assumes that the input–output data of all DMUs are specific numbers, but there are often many uncertain factors in the actual efficiency evaluation activities, such as measurement error and data noise. Therefore, it is more practical to study interval efficiency in uncertain environments. Cooper and Yu [23] first discussed the solution of DEA models with interval data and developed the IDEA method, in which IDEA models can be transformed into ordinary linear programming forms. Scholars have since conducted more in-depth studies. Liu et al. [24] combined AHP to study DEA models with interval data and used the AHP method to construct a preference cone to reflect the preference of DMUs. Wu and Huang [25] also considered the optimism and pessimism of DMUs with interval data to measure the interval efficiency. The lower limit of efficiency was obtained by calculating the worst relative efficiency of the ADMU. Interval DEA is also widely used, such as in performance evaluations of the manufacturing industry under the constraint of environmental pollution [26], performance evaluations of banks [27], post-earthquake studies of reservoir dams [28], and measurement of hospital efficiency [29].
Scholars have also conducted in-depth research on cross-efficiency in uncertain environments. These studies can be divided into two main categories: the construction of interval cross-efficiency matrices and the aggregation of interval cross-efficiency matrices. In the construction of interval cross-efficiency matrices, An et al. [30] constructed an interval multiplicative preference relations (IMPRs) matrix of DMUs based on pairwise comparisons of the dominant relations of the relative efficiency between each pair of DMUs. Liu [31] used the cross-efficiency results of the benevolence and aggressiveness as the upper and lower bounds, respectively, to construct the interval cross-efficiency. Liu et al. [32] combined interval possibility degree theory and group decision-making theory to realise the cross-evaluation based on intuitionistic fuzzy preference under the best frontier to achieve full sorting of DMUs. Wu et al. [33] modified the aggressive cross-efficiency model and used a new MARCOS method to calculate the utility score of DMUs.
In terms of the aggregation of interval cross-efficiency matrices, Yang et al. [34] constructed interval cross-efficiencies of DMUs by considering the ownership weight information of each DMU in the cross-evaluation and aggregating them using the SMAA2 method. Wu et al. [35] proposed a new TOPSIS method to rank interval cross-efficiencies. This improved TOPSIS technique could change subjective weights into objective weights through an optimisation model. Wang et al. [36] proposed a cross-efficiency entropy model to calculate the aggregation weight of the interval cross-efficiency matrix to solve the problem of inaccurate input or output data of DMUs. Lu and Liu [37] constructed a numerical index for DMUs with interval cross-efficiency by searching for the minimum information entropy of the DMUs within the upper and lower bounds of the interval cross-efficiency. Liu [31] transformed the signal-to-noise ratio originally used for optimising industrial processes into a basis for integrating the interval cross-efficiency matrix. Wang et al. [38] developed a new integrated ranking technique for cross-efficiency intervals using the plant growth simulation algorithm to generate the generalised Fermat–Torricelli point and aggregate the interval cross-efficiency matrix. In recent years, interval cross-efficiency has also been applied to the selection of the best web services [39], the evaluation of biomass materials [40], the selection of suppliers [41], and performance evaluations of tourist hotels [42].
In the context of global warming, the issue of energy conservation and emission reduction has received great attention, for example, Nikjoo et al. [43] focuses on green communications, Mohajer et al. [44] on green networking. Global carbon sinks are a core issue in global climate change re-search, and carbon sinks in forest ecosystems are an important component of global carbon sinks. In recent years, numerous studies have focused on the development of forest carbon sinks. Many scholars have focused on measuring forest carbon sink efficiency, and the most important method is DEA. Long et al. [45] calculated the carbon sink efficiency using the CCR model. Ao et al. [46] measured the production efficiency of carbon sequestration in bamboo forests using a three-stage DEA model, which eliminated the impact of environmental factors on the efficiency. He et al. [47] discussed carbon sink efficiency from the perspective of resource allocation. They determined that the province with the largest increase in forestry carbon sinks is Guangdong, which has increased by 169,362 megatons, while the province with the smallest increase is Tianjin, which has only increased by 619 megatons. Wei and Shen [48] used the DEA-SBM model to calculate the efficiency of forest carbon sinks in 30 provinces in China from 2005 to 2018. They concluded that the average annual forest carbon sink efficiency in China was only 0.29. Wang et al. [49] used the DEA–Tobit panel regression model to measure carbon sink efficiency. The mean values of comprehensive efficiency for the seventh to ninth forest inventory periods were 0.421 and 0.336, respectively.
In addition, scholars have studied the factors affecting forest carbon sinks and the measurement of carbon sinks. Shao et al. [50] measured the forest car-bon sinks of 13 provinces in northern China, of which Inner Mongolia, Xinjiang, Heilongjiang, and Shanxi had the best development of forest carbon sinks. Lin and Ge [51] investigated the relationship between institutional freedom and forest carbon sinks. They found that when economic development is high, institutional freedom has a positive impact on forest carbon sinks. Zhu et al. [52] studied the impact of cross-sectoral climate policy on forest carbon sinks. The results showed that cross-sectoral climate policies had a positive impact on forest carbon sinks in the region and its neighbouring areas.
Based on the above literature, three problems can be identified. (i) Entropy information is a good method for determining uncertainty in cross-evaluation, but reasonably describing entropy information in an interval environment is a problem. (ii) Most of the existing literature only considers the relationship between self-evaluation and peer evaluation while ignoring comparisons of the relationship between peer evaluation and peer evaluation to aggregate the cross-efficiency matrix. (iii) Evaluation of forest carbon sink efficiency is complex and diverse, and thus more rational methods to evaluate forest carbon sink efficiency are needed. Moreover, there may be cases in which the data are not real, and it is necessary to develop methods by which the efficiency of forest carbon sinks can be evaluated in such cases.
To address the above problems, this study includes the following elements. (i) To address the first problem, a likelihood degree is introduced to extend the information entropy to the interval domain. (ii) To address the second problem, the interval conditional entropy method is proposed to further modify the relationship between peer assessment and self-assessment using peer-to-peer assessment. (iii) To address the third problem, the proposed interval conditional entropy method is used to evaluate the efficiency of forest carbon sinks.
The contributions of this study are as follows.
Contribution to the interval cross-efficiency set. The likelihood is introduced to define the interval information entropy, which not only considers the uncertainty of cross-efficiency but also reduces the information loss in the process of converting interval data into exact data. Furthermore, to consider the relationship between peer evaluations, an interval conditional entropy method is proposed based on the interval information entropy method. This method further revises the relationship between self-evaluation and peer evaluation using peer-to-peer evaluation. It combines the perspectives of self-evaluation and global peer evaluation to better match the diverse characteristics of the evaluated DMUs in interval cross-efficiency evaluation. Moreover, it makes full use of all of the cross-efficiency evaluation information to accurately measure the uncertainty information of the DMU evaluation results, produce a more realistic interval cross-efficiency assembly scheme, and achieve a complete ranking of DMUs. Contribution to forest carbon sink efficiency analysis. Compared with the CCR model or other self-evaluation models commonly used in the existing literature, the interval conditional entropy method for evaluating forest carbon sink efficiency in this study is not only able to evaluate the cross-efficiency under uncertain environments but also takes into account the relationship between self-evaluation and peer evaluation and the relationship between peer inter-evaluations. Therefore, the evaluation results are more reasonable and objective.
The remainder of this paper is organised as follows. Section 2 introduces the methods and definitions covered in this study in terms of both precise numbers and interval numbers. Section 3 aggregates the cross-efficiency evaluation results of the DMUs based on the interval conditional entropy and gives the aggregation solution based on the fuzzy consistency matrix. Section 4 applies the innovative aggregation method in this study to an arithmetic example used by others and compares the results with other aggregation methods to demonstrate the superiority of the proposed method. Section 5 presents an application of the forest carbon sink efficiency assessment, and Section 6 presents conclusions.
Preliminaries
Traditional work on precise numbers
Suppose there are n DMUs and each DMU
j
(j = 1,2, ... , n) has m inputs and s outputs. Then, x
ij
(i = 1,2, ... , m) represents the i-th input of DMU
j
and y
rj
(r = 1,2, ... , s) represents the r-th output of DMU
j
. The CCR efficiency of DMU
a
(a = 1, ... , n) can be obtained using the following CCR model [1]:
Let
In management, entropy primarily expresses the amount of information obtained. As an important tool for information measurement, the information entropy method proposed by Shannon solves the problem of quantifying information.
An information system can be expressed as IS = (U, A = C ∪ D, V, f), where
U is a non-empty finite set of objects, U = { x1, x2, …, x
n
}; A is a non-empty finite set of attributes, A = C ∪ D, where C is the conditional attribute set and D is the decision attribute; f : U × A → V
a
is an information function, and the value of x for attribute a is f (x, a) ∈ V
a
for ∀x ∈ U.
Let
Moreover,
To compare two interval numbers, we introduce the likelihood to express the priority between them. Here,
It is clear that
Some useful properties of the likelihood are as follows [56, 58]:
For three interval numbers
Properties (a) and (b) indicate that the two interval numbers do not overlap. Property (c) describes the relationship between the likelihood and the midpoint of the interval number. Property (d) defines the transitivity of likelihood.
In an uncertain environment, traditional cross-efficiency evaluation methods are no longer applicable. Therefore, the interval cross-efficiency model proposed by Wang et al. [59] is introduced. Because of the uncertainty, the input and output data of DMU
j
are represented by the interval numbers
In Equations (5) and (6), DMU
j
is evaluated.
The interval cross-efficiencies of DMUs are calculated using the benevolent interval DEA cross-efficiency evaluation model proposed by Huang and Wang [60] to perform the cross-efficiency evaluation of DMUs using interval numbers.
The core idea of Equation (7) is to maintain the condition in which the self-evaluated efficiency of DMU
a
is optimal and then maximise the cross-efficiency value. The first and second constraints of Equation (7) ensure that the self-evaluated efficiency of DMU
a
is equal to the optimal efficiency,
Using the optimal weight solution of Equation (7) to evaluate DMU
j
, the interval cross-efficiency of DMU
j
evaluated by DMU
a
is obtained to solve for n-time linear programming and obtain the interval cross-efficiency matrix,
Similarly, when both DMU
a
and DMU
j
are in the worst state, the maximized cross-efficiency value of DMU
j
is:
Here, we evaluate DMU
j
by using the optimal weight solution of Equation (8). Similarly, we solve for n-time linear programming to obtain the interval cross-efficiency matrix,
Finally, the corresponding elements of the interval cross-efficiency matrices
Comprehensive interval cross-efficiency matrix,
Entropy based on the interval cross-efficiency
Information entropy is a measure of the degree of disorder in a system, and it can be used to determine the degree of change in a given indicator. The degree of change in an indicator reflects the amount of information it provides. The greater the entropy, the greater the change; the greater the amount of information, the greater the uncertainty, the greater the role played in the comprehensive evaluation, and the greater the corresponding weight. Therefore, this study introduces information entropy to determine the weights.
However, this study is concerned with the information entropy in an interval environment. To express the information relationships between interval numbers, the likelihood method is introduced.
Based on the definition of entropy in Section 2.1 and the definition of likelihood in Section 2.2, the information system, IS = (U, A = C ∪ D, V, f), in the interval cross-efficiency setting can be redefined as follows:
U is the set of all DMUs, where U = { DMU1, DMU2, …, DMU
n
}; C is the set of DMUs to be evaluated, D is the set of evaluated DMUs, and A = C ∪ D;
Therefore, we define the interval entropy as follows.
It is clear that the higher the value of H(DMU a ), the greater the amount of information provided by DMU a and the greater its role in the evaluation will be, larger evaluation weight of DMU a .
However, the interval entropy method only considers the evaluation results of DMU
a
on DMU
j
. However, the objectivity of the evaluation result of DMU
a
on DMU
j
needs to be analysed from a global perspective; therefore, the evaluation scores of DMU
a
on DMU
j
must be compared with the evaluation scores of all DMUs on DMU
j
. The following formulais uesd:
Clearly, the larger the value of
It is necessary to consider the relationship between the evaluation results of DMU a and other DMUs on DMU j with the amount of information carried by the results of the evaluation of DMU a during the interval cross-efficiency matrix aggregation. The relationship between DMU a and DMU j can be defined using the conditional entropy theory. Therefore, the interval conditional entropy is defined using Equation (10) to improve Equation (9).
Huang et al. [61] constructed a fuzzy consistency matrix based on the cross-efficiency evaluation results, so as to distribute weights to the DMUs and complete the aggregation of the cross-efficiency matrices. In this paper, according to the thoughts of Huang et al. [61], the consistency preference of experts for DMUs can be obtained from the interval conditional entropy of the DMUs. Thus, definition 5 is constructed as follows.
Aggregating the fuzzy consistency preference matrix by column gives the weights of multiple indicators, and the decision maker ranks the indicators according to these weights. Xu [62] proposed a minimum variance method for the aggregation of fuzzy consistency preference matrices as follows:
Consequently, the final interval cross-efficiency of DMU
j
can be aggregated as follows:
The weight vector
The evaluation results of the cross-efficiency matrix are used to construct a fuzzy consistency matrix with a certain degree of objectivity. And the consistency of fuzzy preference and the displacement invariance and strong order-preserving nature of the ranking results brought about by the allocation of indicator weights are able to make the decision results more reasonable and stable.
As described by the theoretical analysis, the main steps for the interval cross-efficiency matrix aggregation based on the interval condition entropy method are as follows.
Calculation results and analysis
To illustrate the application of the conditional entropy model proposed in this study to the evaluation of interval cross-efficiency, the data from Kao and Liu [63] is used to evaluate the efficiency of 24 banks (DMUs) in Taiwan. The inputs and outputs are expressed in intervals. There are three input and three output indicators, as follows:
X1 = total deposits, X2 = interest expenses, X3 = non-interest expenses, Y1 = total loans, Y2 = interest income, and Y3 = non-interest income.
Equations (5) and (6) are used to obtain the optimal CCR efficiency scores
For the interval cross-efficiency matrix aggregation, the following two aspects are considered: (1) the relationship between peer-evaluation and self-evaluation and (2) the relationship between peer-evaluation and the remaining DMUs peer-evaluation to obtain a global perspective. Equation (9) is used for the first aspect, and Equation (11) is used for both aspects. Table 2 lists the results of the calculations using Equations (9) and (11). A comparison of the results of this calculation is shown in Fig. 1.
Entropy values of DMU
a
Entropy values of DMU a

Entropy values obtained by different methods.
The results in Table 2 indicate that the interval conditional entropy of each DMU is greater than its interval entropy because, from a global perspective, the entropy values of these DMUs are increased. For example, the interval entropy values of DMU4 and DMU24 are relatively similar, even though the interval entropy value of DMU4 is greater than that of DMU24. However, with the interval conditional entropy method, the entropy value of DMU4 is much smaller than that of DMU24. This is because, from a global perspective, the entropy value of DMU4 is no longer determined by the relationship between the self-evaluation interval and peer-evaluation interval, but should be considered in accordance with the evaluation of the other DMUs. It is clear that the relationship between the results of the evaluation of DMU24 and the results of the evaluation of other peers plays an important role. Moreover, the distribution of the entropy values in the two different models can be explore. Figure 1 indicates that the entropy value calculated using Equation (3) fluctuates around approximately 10 with a linear distribution. Compared with the results of Equation (3), the value of the conditional entropy calculated using Equation (10) shows fluctuating waves distributed between 20 and 100, and the value of the interval entropy of each DMU varies widely. This indicates that the improved conditional entropy has a stronger distinguishing ability than the original entropy, and its values are more discrete. The conditional entropy values exhibit greater differences because the interval conditional entropy method is considered from a global perspective, comparing peer evaluations between DMUs based on both self-evaluation and peer evaluation. This is equivalent to adding global uncertainty to the information entropy, which can lead to a greater difference in entropy values and thus to a greater ability to distinguish between the conditional entropy.
It can be observed from the above analysis that the interval conditional entropy method is superior to the interval information entropy method. Therefore, the calculation results for the information entropy are not given below, and only the calculation results for the interval conditional entropy method are provided, as listed in Table 3. In Table 3, the DMU with the maximum efficiency based on the interval conditional entropy is DMU24, and the DMU with the minimum efficiency is DMU23. Meanwhile, the evaluation weight of DMU24 is the largest among all DMUs, and the DMU with the smallest evaluation weight is DMU23. This shows that the evaluation weight and efficiency are positively correlated, but this positive correlation is not absolute. Taking DMU1 as an example, its efficiency ranking is second; however, its weight ranking is fourth rather than second. Therefore, the efficiency value of DMUs with high weights is often large. Because the self-evaluation efficiency of DMUs is the highest, DMUs with a larger evaluation weight can experience a certain advantage in the efficiency aggregation process. This reflects an important advantage of the interval conditional entropy method, i.e. the self-evaluation efficiency is much more important than the peer evaluation efficiency.
Efficiency results based on interval conditional entropy
To better illustrate the effectiveness of the above method, the aggregation method proposed by Guo and Mu [64] is selected to aggregate the interval cross-efficiency values in this case. This method aggregates the cross-efficiency matrix using only the likelihood. In the following analysis, an aggregation method that utilises only the degree of likelihood is compared with one that combines entropy and the likelihood. A comparison between the values of the interval conditional entropy and the likelihood is shown in Fig. 2.
As shown in Fig. 2, the values calculated using only the degree of likelihood are similar to the values calculated using only the information entropy in Fig. 1. The values are all distributed between 0 and 10 with little differentiation, but the degree of fluctuation in the degree of likelihood values is slightly greater than that of the information entropy values. Again, the dispersion of the interval conditional entropy values is much greater than that of the degree of likelihood values, which allows a clearer distinction between DMUs and simplifies the subsequent efficiency ranking problem. The interval conditional entropy values for DMU5, DMU9, DMU14, DMU19, DMU20 and DMU23 are much lower than those of the other DMUs, which indicates that these DMUs are much less efficient. However, this conclusion cannot be drawn from the method proposed by Guo and Mu because the likelihood of the efficiency of these DMUs does not show a tendency to be biased toward lower values between the likelihood of the efficiency of all decision units. In addition, the interval conditional entropy method also introduces conditional entropy to modify the information entropy, i.e. the comparison between peer evaluations is taken as a conditional reference value to correct the relationship between self-evaluation and peer evaluations.
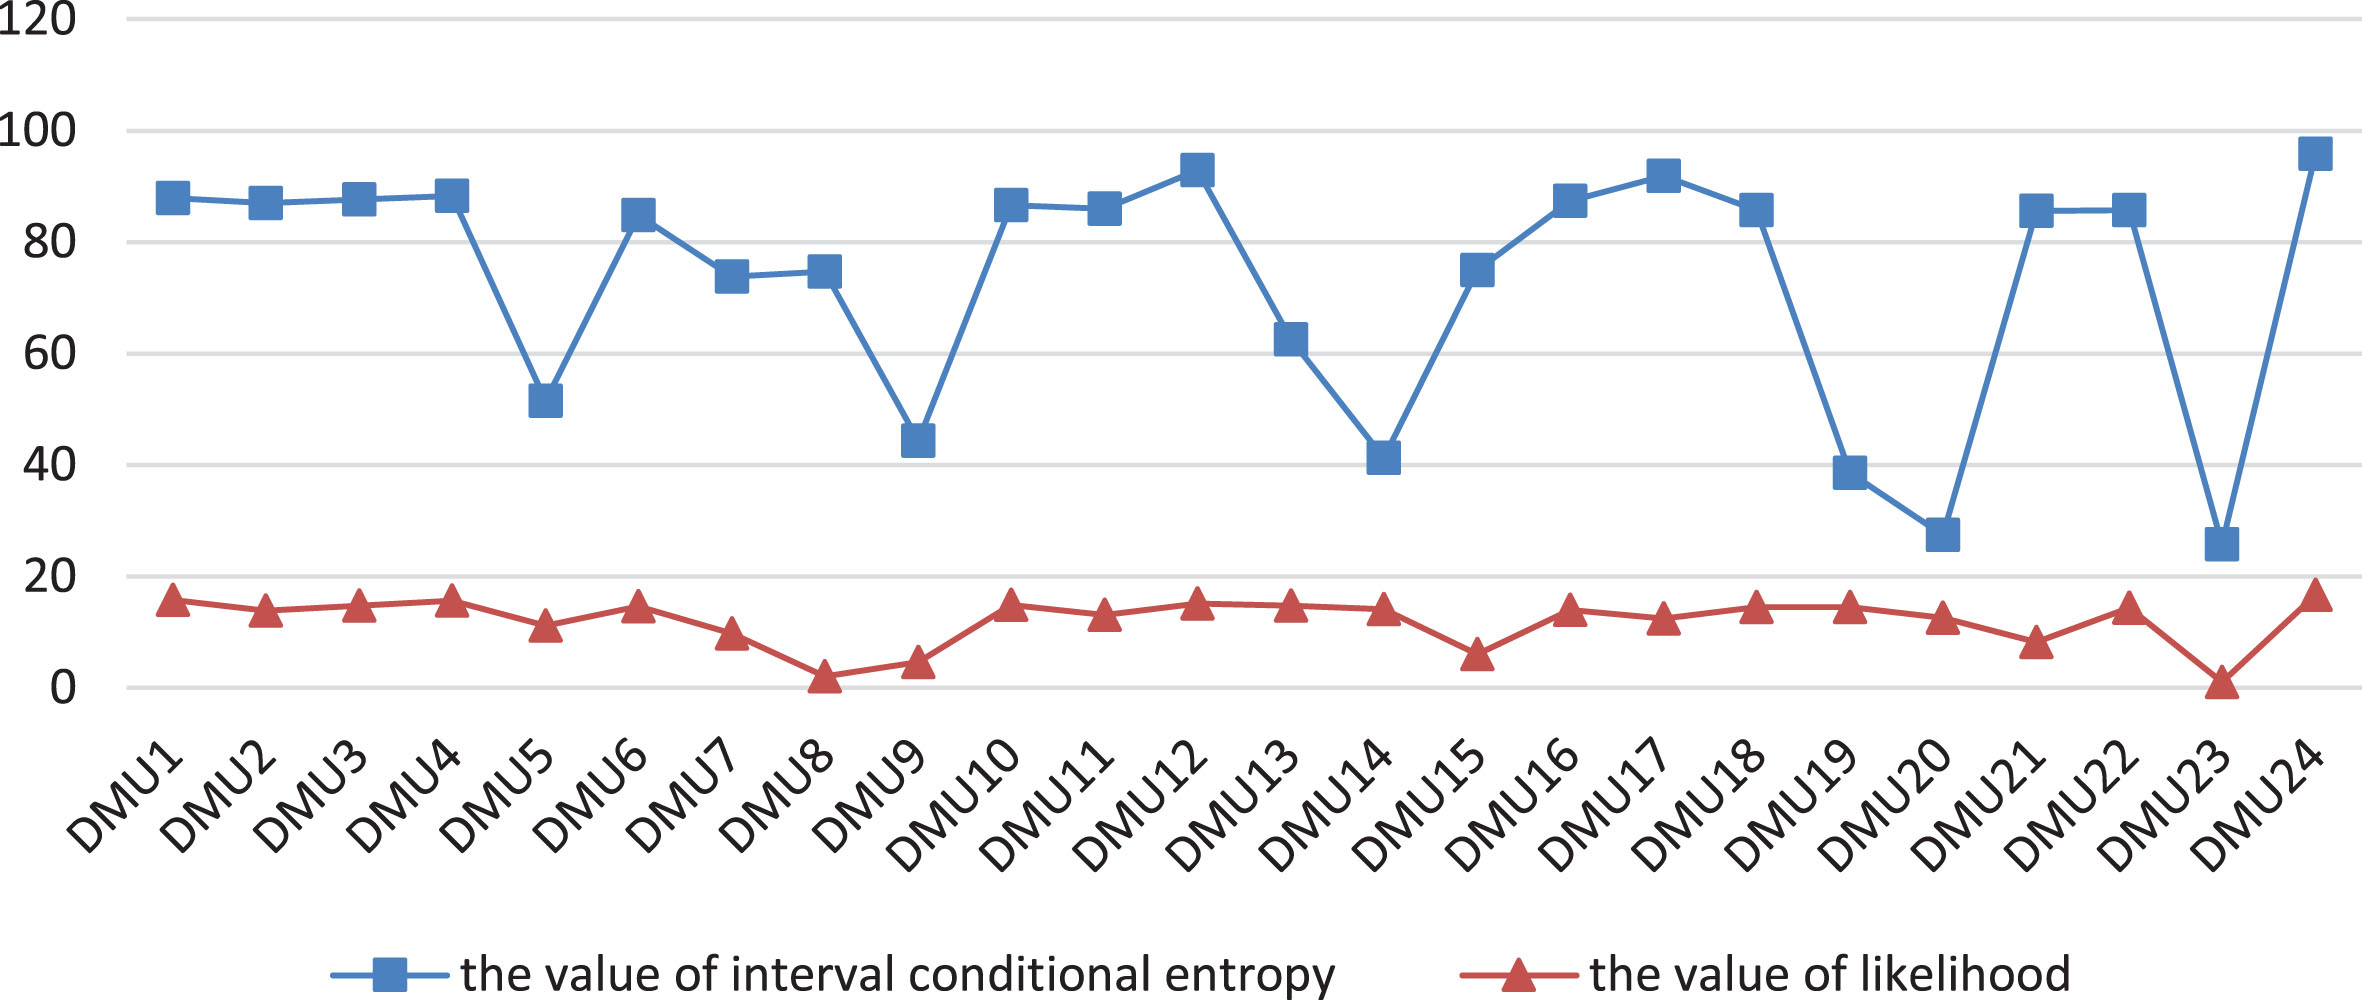
Comparison between interval conditional entropy and likelihood.
The evaluation weights and final cross-efficiency scores of the DMUs obtained using the two methods are shown in Figs. 2 and 3, respectively.
The ranking results of the two methods are also compared, as summarised in Table 4. It can be seen from Table 4 that the final cross-efficiency rankings calculated by these two methods are quite different; for example, DMU11 ranks 15th and 9th respectively, and DMU16 ranks 13th and 4th, respectively. The rankings of these two DMUs obtained by the two methods thus differ by nine places. The method proposed by Guo and Mu converts uncertain data into deterministic data, and the obtained data may be too rigid and lead to the loss of decision information, thereby reducing the flexibility of the fuzzy decision and the reliability of the decision results. Moreover, the likelihood matrix generated by the method proposed by Guo and Mu is a fuzzy complementary judgment matrix that does not meet the consistency, which leads to inaccurate weight allocation. The interval conditional entropy method directly generates a fuzzy consistency matrix through ranking of the likelihood, which reduces the information loss of the weight and makes the system more stable. Therefore, the weight assignment of the interval conditional entropy method is more reliable than that of the method proposed by Guo and Mu.
Cross-efficiency comparison of two methods
In summary, compared with the method proposed by Guo and Mu, the interval conditional entropy method has the following advantages.
The interval conditional entropy method defines the entropy based on the likelihood of the interval number, which improves the description of the interval number uncertainty. From a global perspective, the interval conditional entropy method takes the effect of peer-to-peer evaluation as a precondition for considering the relationship between self-evaluation and peer evaluation. In other words, for the effect of DMU
a
’s evaluation of DMU
j
, instead of considering only the uncertainty between DMU
j
’s self-evaluation efficiency and DMU
a
’s peer evaluation efficiency of DMU
j
, the uncertainty between DMU
a
’s peer evaluation efficiency of DMU
j
and the evaluation efficiency of all decision units of DMU
j
is first calculated, and then incorporated into the uncertainty between DMU
j
’s self-evaluation efficiency and DMU
a
’s peer evaluation efficiency of DMU
j
. The fuzzy preference matrix generated by the interval conditional entropy method in the process of efficiency aggregation meets the consistency, which makes the weight distribution results more reliable.
In this section, the interval efficiency of forest carbon sinks is evaluated for 30 provinces in China. According to three production factors (manpower, capital, and land), the forest land area, forestry personnel, and total forestry fixed investment are selected as input indices. The data are obtained from the China Statistical Yearbook (2017). The output index is the forest carbon sink. These data are obtained from Chen et al. [65]. Owing to certain errors in the input indicators, such as a lack of accurate accounting for private capital in the total investment, the lack of urban forest area in the land area, and the fact that forestry practitioners mainly refers to the staff on the payroll, interval treatment is performed on the forestry input indicators. The forest area and forest land area are used as the upper and lower limits of the interval, respectively. The data collected by forestry practitioners are the lower limit of the interval, and the upper limit of the interval is based on the lower limit plus the rural population multiplied by a certain ratio. The forestry investment uses the original data as the lower limit, and the upper limit of the interval is increased by 10% based on the lower limit. At the same time, there are measurement errors in the data collection of the forest carbon sinks. Chen et al. [65] noted that such errors are in the range of at least 10%. To unify the standard, all of the data are multiplied to obtain the interval data of the input and output, as indicated in Table 5.
Input and output interval data of forest carbon sink efficiency
Input and output interval data of forest carbon sink efficiency
Table 6 presents the final efficiency values calculated using the interval conditional entropy method. The results show that the final cross-efficiencies of all 30 provinces ranged from 0 to 0.6, which indicates that there is still much room for the development of forest carbon sinks in China.
Comparison of the efficiency results
Among these provinces, the more well-developed include Guangdong, Guizhou, Hainan, Shandong and Qinghai. Guangdong is controlled by a humid marine monsoon climate and has excellent natural conditions that are ideal for plant growth and conducive to the development of forest carbon sinks. Guizhou, with a forest cover of 62.12%, has the advantage of abundant forest resources, thus laying a good foundation for the development of forest carbon sinks. Hainan is located in the tropics and is rich in tropical rainforest resources, with good water and heat resources, providing unique conditions for the development of forest carbon sinks. Shandong is actively engaged in afforestation and forestry industry development. Its forestry resources are poor, but its forestry industry is developing rapidly, with less than 1% of the country’s forest resources, creating more than 10% of the country’s forestry output value, which is known as the “Shandong phenomenon” in the industry.
The most poorly developed provinces include Shaanxi, Heilongjiang, Guangxi, and Beijing. Shaanxi has serious soil erosion problems, which can lead to drought phenomena; moreover, water resources are more dispersed, and the sandiness of the land has skyrocketed, leading to serious desertification problems. Because of the shortage of water resources, plant growth is difficult, making it more difficult to develop forest carbon sinks. The forestry industry in Heilongjiang is relatively underdeveloped and needs increased investment and a gradual improvement in the forestry market conditions. Guangxi is one of the most serious forest biohazards in China, which is detrimental to the development of forest carbon sinks. The forest area of Beijing is dominated by planted forests, with a small area of natural forest and a lack of forest resources. Although it has a strong economy, its forestry industry lags behind and should be driven by other developed industries.
The development of forest carbon sinks in the remaining provinces is at an intermediate level. Among them, Fujian, Jiangxi, and Jilin have abundant forest resources, but they are not very efficient. These provinces have high forest stocks, but because of tree species and forest management, their carbon sink capacity has not yet been fully utilised, and more investment is needed to improve the efficiency of carbon sinks.
In the aggregation of interval cross-efficiency matrices, efficiency aggregation from only the perspective of information entropy often leads to information loss. This study eliminates this defect and considers the application of conditional entropy in the interval cross-efficiency matrix aggregation. The following aspects are summarised through analysis of this method.
In this study, the information entropy is first defined based on the likelihood, which not only considers the uncertainty of the cross-efficiency but also reduces the loss of information in the process of converting interval data into accurate data. However, information entropy only considers the relationship between self-evaluation and peer evaluation, thus ignoring the impact of peer-to-peer evaluation. Therefore, this study proposes an interval conditional entropy method based on the interval information entropy method. This method further corrects the relationship between self-evaluation and peer evaluation by using mutual evaluations among peers. It combines the perspective of self-evaluation and the perspective of global peer evaluation, which is more consistent with the diversified characteristics of the evaluated DMUs in interval cross-efficiency evaluation. This method can make full use of all of the cross-efficiency evaluation information to measure the uncertainty information of the DMU evaluation results accurately, produce more realistic interval cross-efficiency aggregation schemes, and implement the full ranking of the DMUs.
In addition, the cross-efficiency aggregation in this study is conducted in an interval environment. Future research can be carried out in the following two directions: (1) this study starts from the two endpoints of interval numbers to conduct cross-efficiency aggregation, and future studies can further consider the variability within the interval; (2) further consideration should be given to how cross-efficiency aggregation can be carried out in a fuzzy number setting.
Footnotes
Acknowledgments
This research was supported by the National Natural Science Foundation of China (Nos. 72001042 and 72001043), the China Postdoctoral General Science Fund (No. 2021M700781) and Fujian Agricultural and Forestry University Science and Technology Innovation Special Fund Project (Social Sciences) (NO. CXZX2021029).