
Abstract
Multi-agent collaborative manufacturing, high energy consumption and pollution, and frequent operation outsourcing are the three main characteristics of large complex equipment manufacturing enterprises. Therefore, the production scheduling problem of large complex equipment to be studied is a distributed flexible job shop scheduling problem involving operation outsourcing (Oos-DFJSP). Besides, the influences of each machine on carbon emission and job scheduling at different processing speeds are also involved in this research. Thus the Oos-DFJSP of large complex equipment consists of the following four sub-problems: determining the sequence of operations, assigning jobs to manufactories, assigning operations to machines and determining the processing speed of each machine. In the Oos-DFJSP, if a job is assigned to a manufactory of a group manufacturing enterprise, and the manufactory cannot complete some operations of the workpiece, then these operations will be assigned to other manufactories with related processing capabilities. Aiming at solving the problem, a multi-objective mathematical model including costs, makespan and carbon emission was established, in which energy consumption, power generation of waste heat and treatment capacity of pollutants were considered in the calculation of carbon emission. Then, a multi-objective improved hybrid genetic artificial bee colony algorithm was developed to address the above model. Finally, 45 groups of random comparison experiments were presented. Results indicate that the developed algorithm performs better than other multi-objective algorithms involved in the comparison experiments not only on quality of non-dominated solutions but also on Inverse Generational Distance and Error Ratio. That is, the proposed mathematical model and algorithm were proved to be an excellent method for solving the multi-objective Oos-DFJSP.
Keywords
Introduction
Research background
Under the traditional manufacturing mode based on single core manufacturing enterprise (CME), the imbalance between manufacturing resource (MR) and manufacturing capacity leads to waste or shortage of MR in different manufacturing enterprises [1]. Under the background mentioned above, collectivization becomes an important manufacturing mode and development direction for CMEs to adapt to the market demands, in which multiple manufactories of a group enterprise formed close cooperation and sharing relationship. Based on the relationship, their on-time delivery capacity, capacities of manufacturing process tracking and control have been greatly improved. At the same time, each manufactory in a group enterprise can take orders independently [2], which enriches the market channel of the group enterprise.
Large complex equipment (LCE) production provides large-scale processing equipment for other industries [3]. Generally, LCE industry is made to order, and produced as customized, such as offshore oil equipment and cement equipment. The characteristics of LCE are complex structures with large sizes, long manufacturing cycles and frequent design changes, which lead to high uncertainty of the manufacturing process, difficulty in on-time delivery and diverse demands for MRs [4]. Because of the characteristics of LCE and its manufacturing process mentioned above, it is difficult for a single core manufacturing enterprise to complete all operations of the product independently. Even if it can, it will greatly increase the operating costs of the enterprise, and the enterprise’s delivery capacity on schedule will also be insufficient. Therefore, collaborative manufacturing as shown in Fig. 1 has become the main manufacturing mode in the LCE industry. At the same time, in order to improve market competitiveness, many enterprises have formed group enterprises through merger and reorganization to further improve their collaborative manufacturing capabilities. Under the above group manufacturing mode (GMM), MR management and scheduling become more complex than a single CME, and optimizing manufacturing task scheduling becomes one of the key issues to be solved by group enterprises of LCE, which is also an important way to optimize their utilization of MRs and on-time delivery capacity. Because LCE enterprises have the above characteristics of manufacturing collaboration and manufacturing process flexibility, the production scheduling problem for LCE enterprises is a kind of distributed flexible job shop scheduling problem (DFJSP).
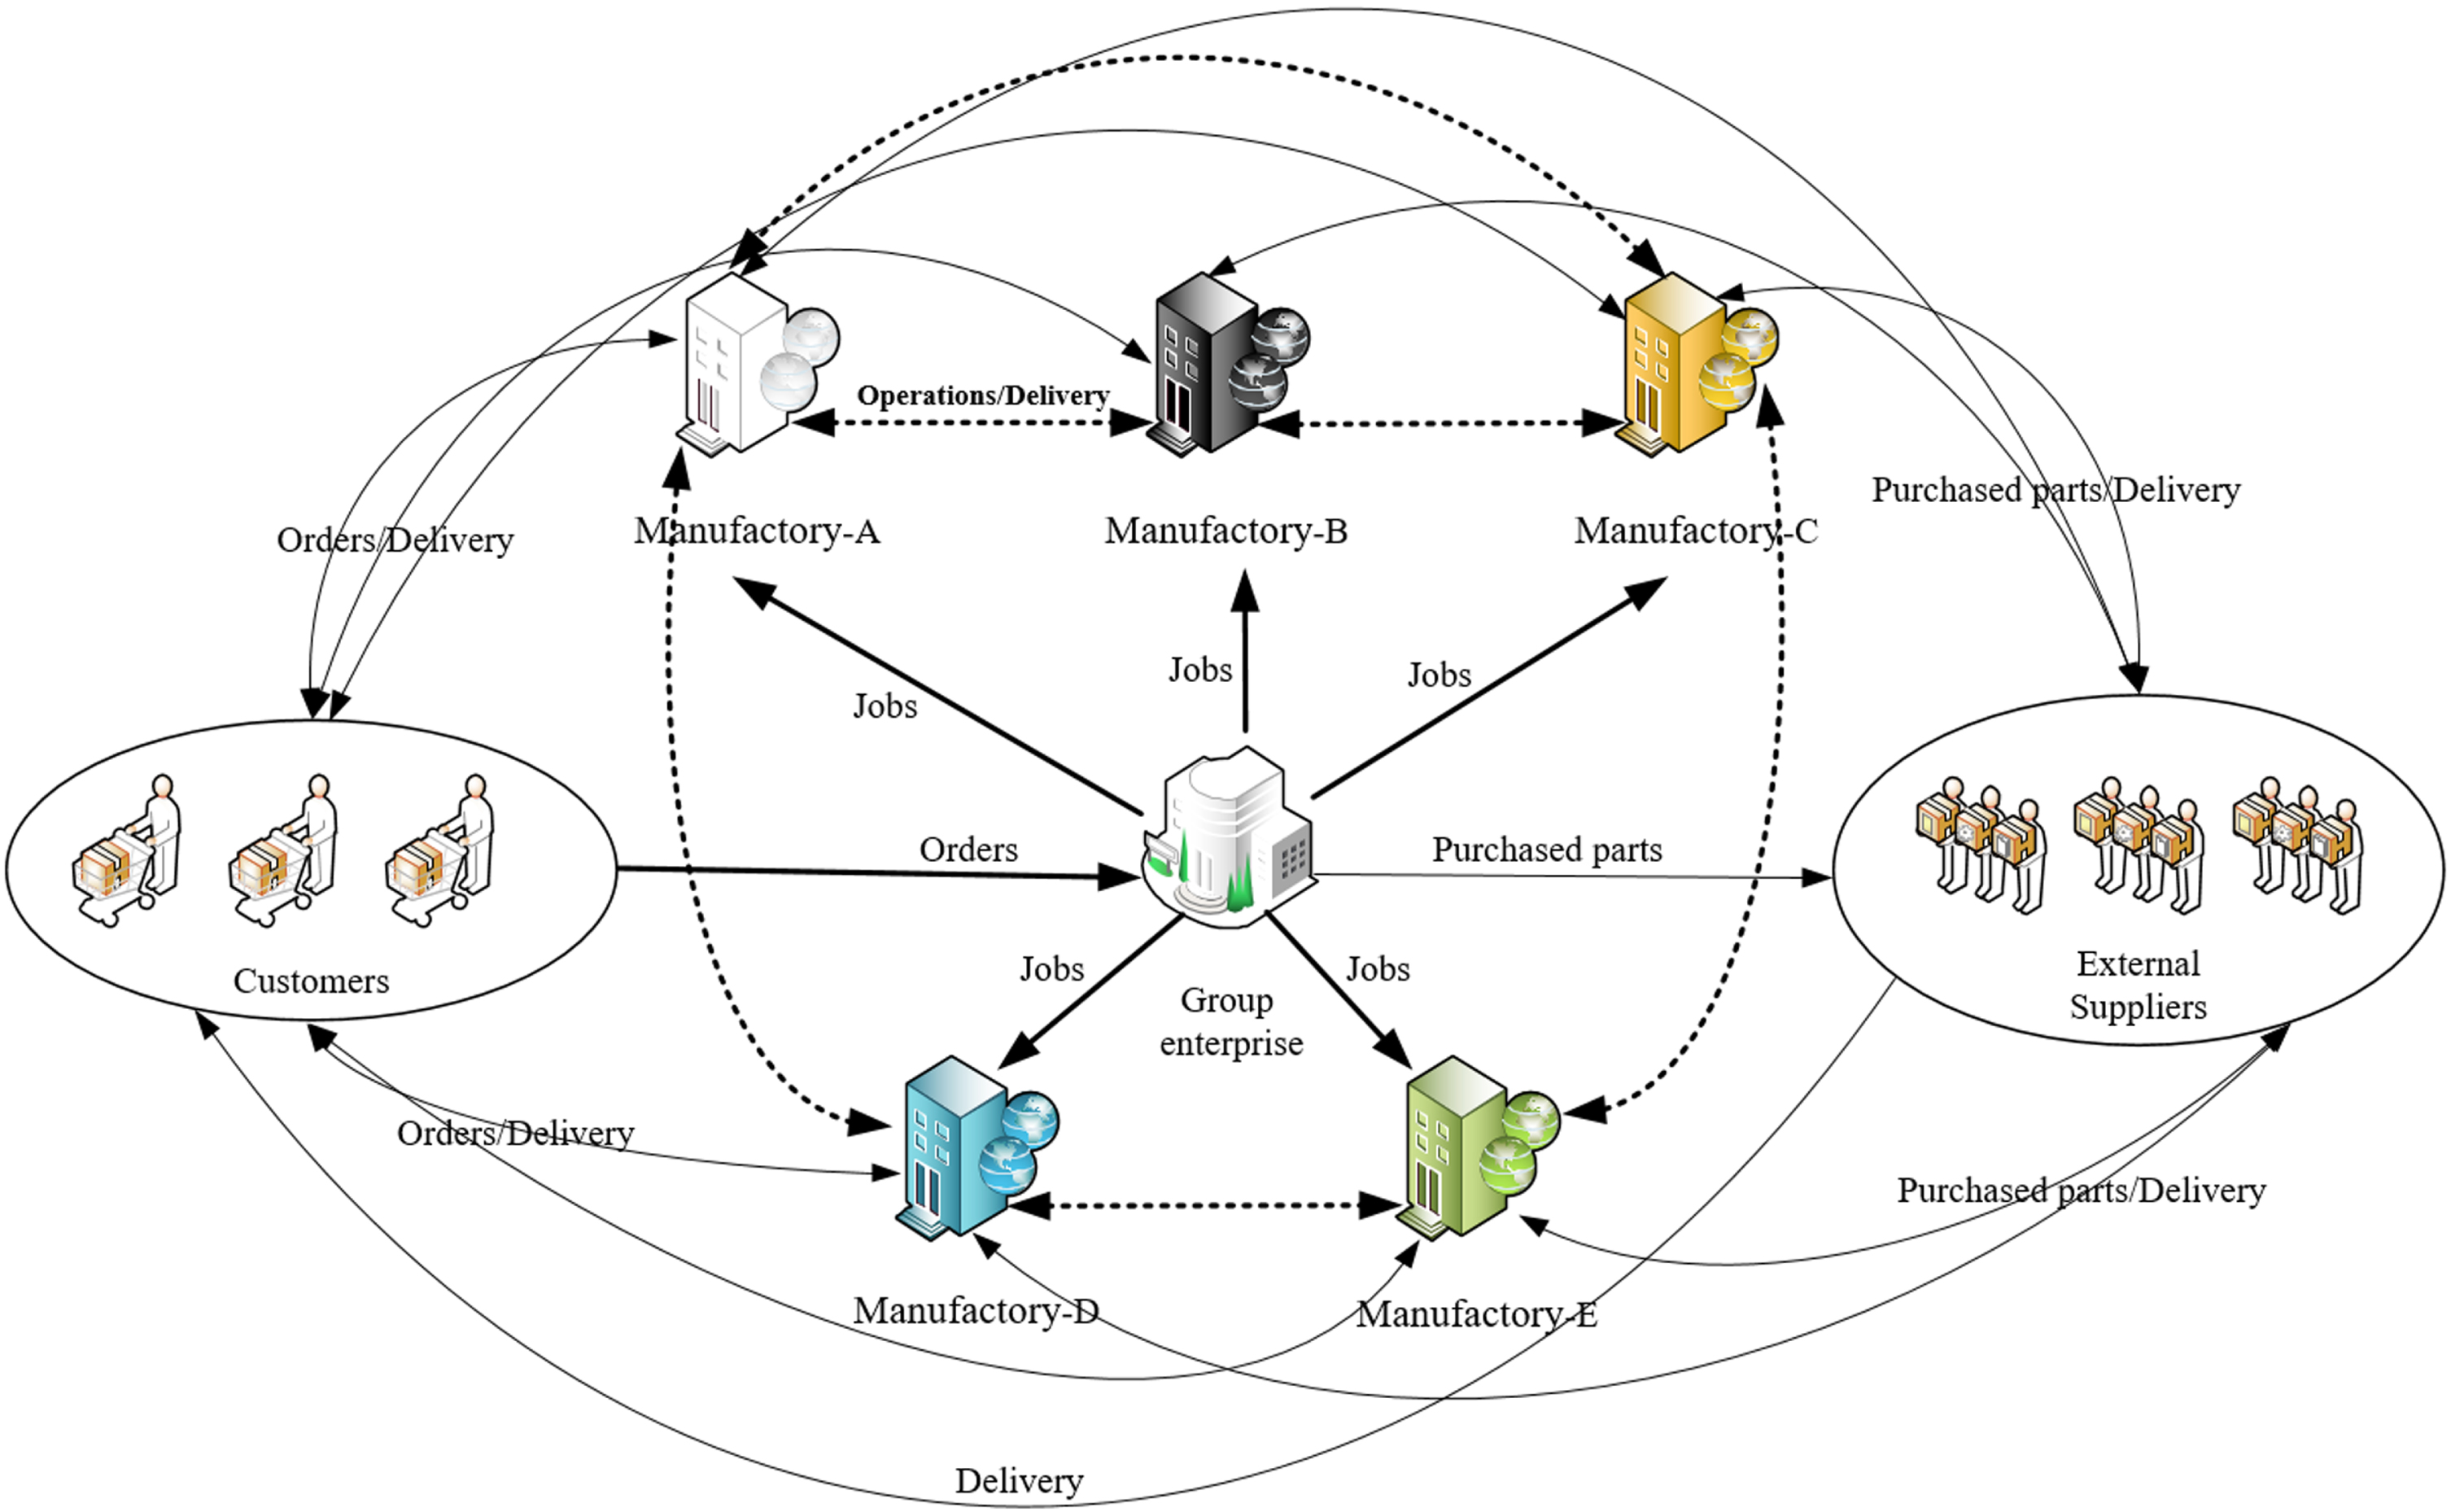
Manufacturing mode of LCE group enterprises.
As FJSP has been proved to be NP-hard, so DFJSP is a more difficult combinatorial optimization problem for considering selection of workshop on the basis of the FJSP [5, 6]. Large-scale problems of NP-hard problem or strong NP-hard problem are rather difficult to be dealt with by exact methods. Due to such difficulties, evolutionary and swarm-based meta-heuristics have been the main approaches for a long period [7], such as genetic algorithm (GA) based algorithms [8–11], particle swarm optimization (PSO) based algorithms [12, 13], artificial bee colony (ABC) based algorithms [14, 15], tabu search (TS) based algorithms [16, 17] and teaching-learning optimization (TLO) based algorithms [18, 19]. In the existing studies, minimizing makespan and costs are the most common optimization objectives in solving scheduling problems [20–22]. With the rapid growth of energy demand and increasingly serious environmental pollution, green manufacturing has gradually become an important factor to be considered by manufacturing enterprises [23, 24]. LCE manufacturing is a high energy consumption industry with serious pollution. Therefore, to solve the DFJSP for LCE industry, makespan, costs and carbon emission should be taken into consideration comprehensively. Aiming at solving this kind of multi-objective optimization problems, the general method is to obtain the non-dominated solution (Pareto solution), which has been studied by many researches [16, 25–28]. Besides, some solutions based on the weighted value method were also carried out [2, 30].
In summary, although a lot of valuable results have been provided in the existing researches, these methods cannot well applied to deal with the DFJSP in LCE group enterprises. This mainly includes the following three reasons: The general DFJSP consists of three sub-problems: determining the sequence of operations, assigning jobs to manufactories and assigning operations to machines, where all the operations of a job will be finished by the manufacturing unit that the job is assigned [31]. The manufacturing mode of LCE group enterprises is shown in Fig. 1. It can be observed that, different from the general DFJSP described above, the DFJSP for LCE group enterprises needs to consider many requirements of operation outsourcing in the manufacturing process. Thus the problem to be studied is a DFJSP considering operation outsourcing (Oos-DFJSP). In addition, LCE is a kind of heavy product with large size, and the distance between customers and manufacturers are often located in different regions. Therefore, transportation should be taken into account in solving the Oos-DFJSP. In most existing studies, processing energy consumption and carbon emission of machines are the main components of green indicators. However, in the real manufacturing environment of LCE group enterprises, many other factors affect the green indicators to a great extent, such as residual-heat utilization of processing machines, energy consumption of transportation, treatment of pollutants and different processing speeds available for machines. Suppose that all those factors were shown with carbon emission, a new applicable calculation model of carbon emission needs to be developed. There are few researches on the scheduling problems with three or more optimization objectives. To solve the Oos-DFJSP described above, the encoding method and algorithm still need to be further studied.
Therefore, the key issues to be solved in this paper are as follows: In the Oos-DFJSP, four sub-problems and operation outsourcing is taken into account, thus the encoding and decoding approaches of designed algorithm need to be redesigned. The composition of manufacturing cost and carbon emission of LCE products are diverse and influenced by many factors. Therefore, it is another important work to build a practical multi-objective optimization model considering manufacturing cost and carbon emission. The proposed Oos-DFJSP is a strong NP-hard problem, which is more difficult than the general DFJSP. So designing an efficient algorithm with more clear search direction is one of the key problems to be solved.
Main work and innovation of this research
In terms of the Oos-DFJSP for LCE group enterprises, a multi-objective mathematical model with minimizing costs, makespan and carbon emission was provided in this research. In this model, the value of carbon emission mainly consists of two parts: 1) Conversion calculation of electrical energy consumption of processing machines; 2) Conversion calculation of pollutants generated by other energies or processing ways, such as welding, spray paint, gasoline and diesel oil. Residual-heat utilization of processing machines, energy consumption of transportation, treatment of pollutants and different processing speeds available for machines were taken into account to calculate the comprehensive carbon emission, where the influence of processing speed of a machine tool on energy consumption has been researched [32]. To deal with the model, a multi-objective improved hybrid genetic artificial bee colony algorithm (MOH-GA-IABC) was developed. In the MOH-GA-IABC, ABC and GA are the main algorithm and the assistant algorithm respectively, and the probability selection mechanism of simulated annealing algorithm (SA) was introduced to replace the greedy selection mechanism of ABC. GA and probability selection mechanism of SA can effectively enhance the diversity of bee colony, so as to improve its global search capability. Since the importance of carbon emission is difficult to judge strictly compared with that of costs and makespan, the pareto-based method was used to address the multi-objective problem. Finally, effectiveness verification experiments of different components in MOH-GA-IABC were carried out. Meanwhile, 45 groups of random comparison experiments were presented using six algorithms including multi-objective particle swarm optimization (MOPSO), non-dominated sorting genetic algorithm-II (NSGA-II), multi-objective artificial bee colony algorithm with a Local Search Method (MOABC_LS), multi-objective grey wolf optimization (MOGWO), efficient memetic algorithm (EMA) and MOH-GA-IABC to obtain Pareto-optimal solutions, so as to verify the effectiveness of the studied mathematical model and algorithm for solving the Oos-DFJSP.
The results of the effectiveness verification experiments of different components indicate that the operators of GA, SA-based acceptance strategy of solutions and the population initialization strategy can effectively improve the optimization ability of the proposed algorithm in solving Oos-DFJSP, in which the operators of GA has the greatest impact on the performance of it. In the 45 groups of comparison experiments, the proposed algorithm is dominant on Inverse Generational Distance (IGD) in 34 of them, while it is dominant on Error Ratio (ER) in all of them. In addition, it is dominant on both the two indicators in 34 of them. In addition, the scatter plots of different experiments indicate that the quality of solutions obtained by MOH-GA-IABC is better than other five algorithms. Therefore, the multi-objective model and algorithm proposed in this paper is effective for solving the Oos-DFJSP, and has performance advantages over some existing algorithms.
The main contributions of this study are as follows: An Oos-DFJSP for LCE group enterprises was researched, in which operation outsourcing and different processing speeds of each machine were taken into account. Therefore, the studied problem consists of the following four sub-problems: determining the sequence of operations, assigning jobs to manufactories, assigning operations to machines and determining the processing speed of each machine. Besides, in Oos-DFJSP, a factory may not be able to complete all the operations of an assigned job. If the enterprise cannot complete some of the operations of this job, these operations will be assigned to one of other competent factories for execution. A new applicable calculation model of carbon emission was developed. In the model, the residual-heat utilization of processing machines, energy consumption of transportation and treatment of pollutants were considered simultaneously, which is more in accordance with the characteristics of LCE group enterprises. A MOH-GA-IABC was designed, which combines the advantages of ABC, GA and SA, and was used to solve the Oos-DFJSP with three objectives to obtain Pareto-optimal solutions, which was verified to have better optimization ability than other existing algorithms in solving the proposed Oos-DFJSPs, especially in solving medium-scale and large-scale Oos-DFJSPs.
Literature review
Distributed shop scheduling problem related studies
It is an important feature and development trend of manufacturing industry that production tasks are completed by the collaboration of multiple manufacturing entities, which makes the scheduling model oriented to a single manufacturing agent unsuitable for current production mode. Therefore, distributed shop scheduling problem (DSSP) attracted the attention of many researchers, and many solutions were carried out. Among them, distributed flow shop scheduling problems (DFSP) were studied most. In the research of Sauer et al., a solution was provided to address the coordinated scheduling problem of multisite system [33]. Fernandez-Viagas et al. presented a new heuristic rule for the special structure of distributed permutation flow shop, and the rule was verified to be better than other heuristic rule by the comparison experiments [34]. Wang et al. developed an innovative distributed estimation algorithm to deal with permutation DFSP, in which minimizing machine breakdown and makespan are taken as the optimization objectives [35]. Besides, the no-wait DFSP [36], re-entrant permutation DFSP [37] and blocking constraints DFSP [38] were also studied.
As the extension of FJSP, DFJSP has becomes a hotspot in DSSPs, and some valuable results have been made. For instance, De et al. studied DFJSP, and designed an improved GA to minimizing the makespan of it [39]. In the research of Wu et al., performances of GA for solving DFJSP with different chromosome representations was carried out, and extending from this line, a GA with a new chromosome representation was developed [40]. Lu et al. studied DFJSP considering three optimization dimensions and proposed an effective solution algorithm and encoding structure [31]. Some expanded DFJSPs were also studied, such as the DFJSP with E/T Criteria [16] and the DFJSP with transfers [41].
In addition to the above studies, some heterogeneous distributed scheduling problems were also researched, among which distributed assembly permutation flow shop problem (DAPFSP) was studied most. A two stages DAPFSP was researched by Hatami et al., and a variable neighborhood descent (VND) algorithm was developed to address it [42]. In the research of Li et al., a no-wait constraint DAPFSP was studied, in which more than one assembly enterprise was included [43]. Zhang et al. presented a constructive heuristic (TPHS) and two hybrid meta-heuristics (HVNS and HPSO) to address DAPFSP [44]. Aiming at solving the DAPFSP, Wu et al. developed an improved algorithm combined differential evolution (DE) and SA to minimizing the costs and earliness/tardiness of DAPFSP [5].
In summary, to deal with DSSP, a lot of valuable approaches and models were carried out. However, the low carbon Oos-DFJSP described in Section 1 of this study has not been researched, and existing models and algorithms are difficult to apply to it, so it should be further studied.
Scheduling problem considering green indicators related studies
As an important direction of green manufacturing research, scheduling problem considering green indicators is a current research hotspot. Some studies with theoretical or practical value were carried out by researchers. In these studies, the processing energy consumption or carbon emission of machines are the main cleaner production factors to be considered. For example, Yang et al. studied a bi-objective FJSP, in which energy consumption and makespan were involved [45]. Aiming at solving the above problem, Luo et al. also carried out research by considering the variety of processing speeds of each machine [46]. Gong et al. proposed an original double FJSP by considering the flexibility of machines and workers simultaneously. To deal with the issue, a green scheduling model with three objectives was developed and solved by a hybrid GA [23]. In the research of Lei, minimizing total carbon footprint was included in the proposed mathematical model of FJSP [47]. To address the small-scaled and large-scaled DFJSP, Meng et al. proposed different approach to minimizing the total energy consumption [48]. Pan et al. studied energy-efficient fuzzy FJSP (EFFJSP), in which an evolutionary algorithm with feedback and bi-population (FBEA) was designed to solve it [49].
In addition to above researches, some methods considering comprehensive indicators for green manufacturing were also presented. Aiming at realizing the low carbon FJSP, Zhang et al. put forward three aspects of carbon efficiency including machine, part and processing to measure the carbon emission of the problem [50]. In the research of Liu et al., an FJSP integrated with crane transportation was presented, and a green scheduling model considering comprehensive energy consumption and a hybrid algorithm were developed to deal with the problem [24]. Guo et al. established a multi-objective model with costs of carbon emission, noise and makespan to deal with the blocking flow-line scheduling problem model of panel block of ship, which was addressed by an improved algorithm based on gray wolf optimization (IGWO) [51]. Besides, the green scheduling mathematical model considering different input power of machine in different processing state [52] and hybrid cleaning scheduling policy [53] were also studied.
To summarize, for the scheduling problem considering green indicators, a lot of models and solutions were put forward. However, the researches of mathematical models including analysis of green indicators for practical manufacturing is insufficient, it remains to be studied furtherly.
Description and assumption of problem
Problem description
In a LCE group enterprise, the key jobs are generally assigned to its manufactories, while others are purchased from external suppliers. The key jobs determine the real delivery time, these jobs are also the main research objects of this paper. Because some jobs have high requirements for the capability and variety of processing equipment, a single manufacturing enterprise often can only complete part of its operations. Therefore, enterprise managers need to outsource some operations to manufacturing enterprises with corresponding processing capabilities. Because operation outsourcing will not only increase transportation cost, running cost and the complexity of manufacturing task allocation, but also increase the uncertainty of delivery time and generate some unreasonable manufacturing task allocation solutions. Therefore, in LCE manufacturing enterprises, only when the enterprise undertaking a manufacturing task cannot complete some of the operations, will they outsource these operations to the competent enterprises. To sum up, compared with the general DFJSPs, the main feature of the production scheduling problem of LCE manufacturing enterprises is to consider dealing with the necessary operation outsourcing in manufacturing task allocation (As shown in Fig. 2), that is, Oos-DFJSPs defined previously.
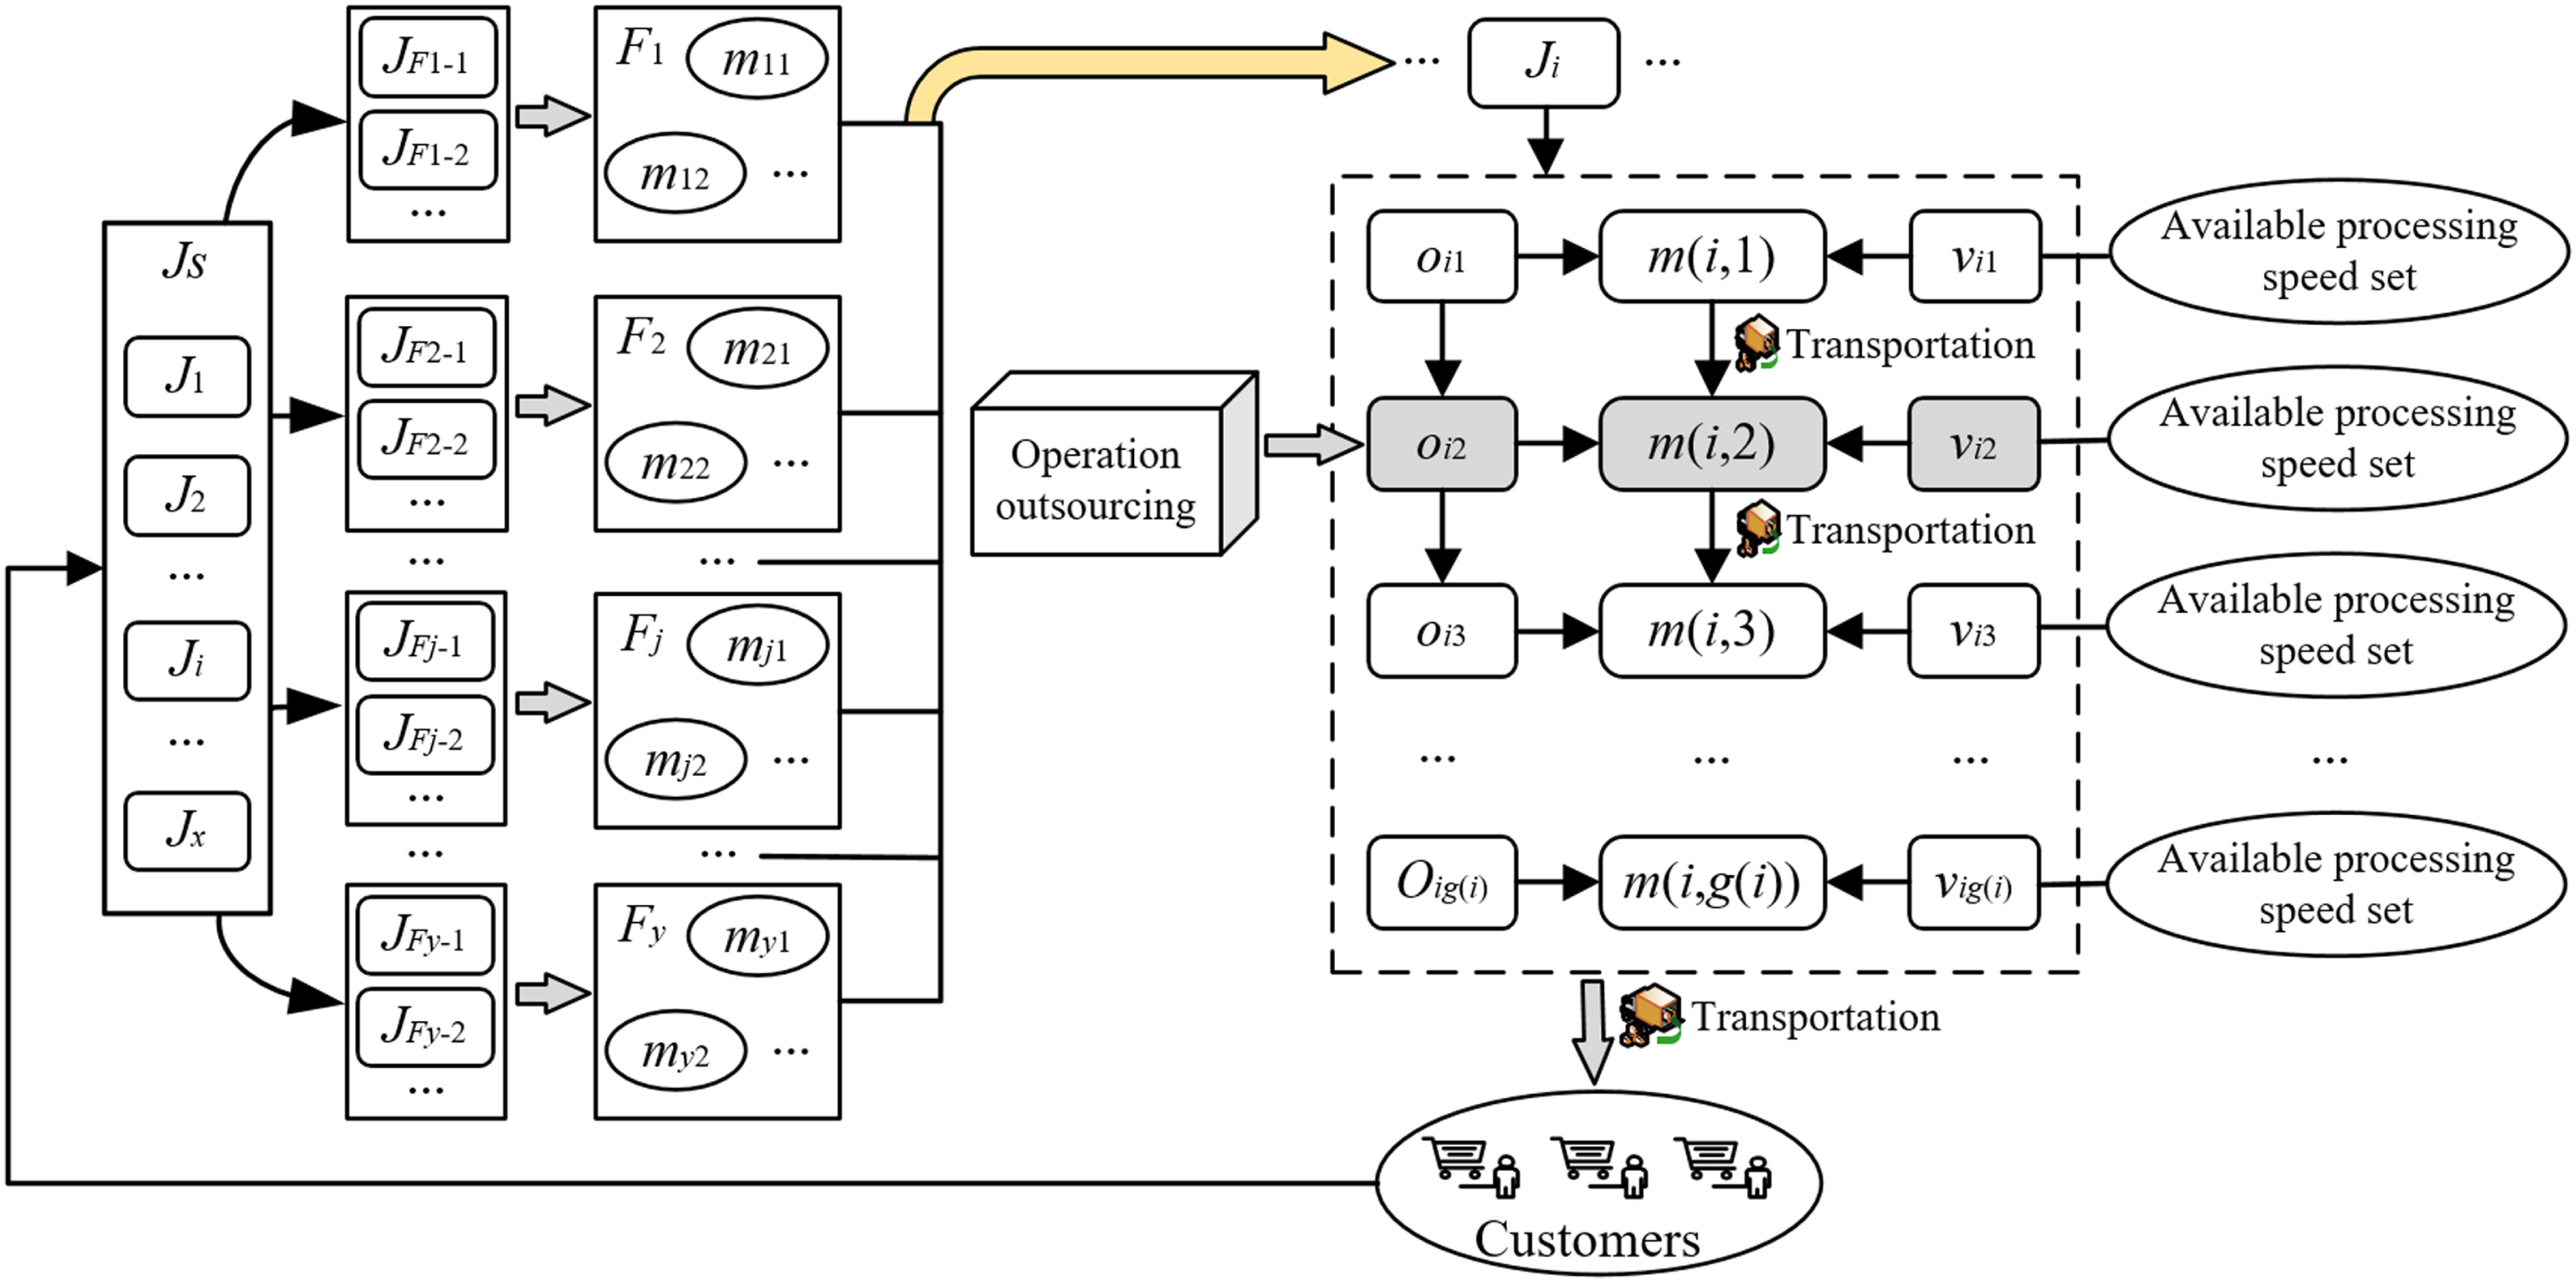
Schematic diagram of Oos-DFJSP for LCE manufacturing.
The above Oos-DFJSP proposed in this study can be described as follows: Suppose that there are x key jobs Js = {J1, J2, …, J
i
, …, J
x
} to be executed at time 0, and each manufacturing includes g
i
operations J
i
= {oi1, oi2, …, o
ir
, …, oig(i)} to be finished. There are y suitable manufactories Fs = {F1, F2, …, F
j
, …, F
y
} in different regions to finish the jobs. In F
j
, there are n
j
available machines M
j
= {mj1, mj2, …, m
jk
, …, mjn(j)} with different processing capacities and functions. And O
ir
can be completed by at least one machine in Fs. Among the machines, one machine can process one related operation at one or more speeds. The time and equivalent carbon emission are different when an operation is processed by a machine at different speeds. Considering the characteristics of LCE, operation outsourcing is involved. In summary, the Oos-DFJSP consist of three sub-problems Ps = {P1, P2, P3} in general DFJSP, and two special operations SPs = {SP1, SP2} as follows: SP1: Determining the processing speed of a machine for each assigned operation. SP2: If an operation of a job cannot be finished by the machines in the assigned manufactory, then the operation will be allocated to a machine of another manufactory with corresponding capacity.
Figure 2 describes the Oos-DFJSP of this research, where JFj-l represents the job l assigned to F j , m (i, r) represents the machine finished o ir , v ir represents the processing speed of m (i, r). In particular, the available processing speed set of a machine varies with different operations.
To research the problem rigorously, some assumptions of the Oos-DFJSP studied in this paper are presented as follows: All needed resources are ready at time 0. An operation can only be assigned to one machine. The processing of each operation is continuous. The processing time, auxiliary time, energy consumption and pollutants of completing an operation by a machine at a certain processing speed are fixed. Transportation in a manufactory is not taken into account.
Mathematical model
Notation of parameters
i: Index of a job
j: Index of a manufactory
J i : Job i
F j : Manufactory j
x: Number of jobs
y: Number of manufactories
r: Index of an operation in a job
g i : Number of operations of J i
k: Index of a machine in a manufactory
n j : Number of machines in F j
o ir : Operation r in J i
m jk : Machine k in F j
q: Index of a processing speed for completing an operation by a machine
a jkir : Number of available processing speeds for completing o ir by m jk
Cus i : Customer corresponding to J i
tp jkir (q): Processing time of m jk processing o ir with speed q
ta jkir (q): Auxiliary time of m jk processing o ir with speed q
t jkir : Total time of m jk completing o ir
trtir(r+1): Transportation time between o ir and oi(r+1)
trt i (Cus i ): Transportation time from the last operation of J i to Cus i
st ir , et ir , wt ir : Start time, end time and waiting time of o ir respectively
T i : Completion time of J i
PT i : Planned completion time of J i
Ms: Makespan of all jobs
pec jkir (q): Processing energy consumption of m jk processing o ir with speed q
aec jkir (q): Auxiliary energy consumption of m jk processing o ir with speed q
ece jkir (q): Equivalent carbon emission of pollutants of m jk processing o ir with speed q, which is not caused by energy consumption
RHU jk : Ratio of residual-heat utilization of m jk in energy consumption
RTP jk : Treatment rate of pollutants of m jk
ɛ: Conversion coefficient from energy consumption to carbon emission
tece jkir : Total equivalent carbon emission of m jk completing o ir
utrce i : Transportation equivalent carbon emission of J i in unit time
trce i : Transportation equivalent carbon emission of J i
TCE: Total equivalent carbon emission
mc jkir (q): Costs of m jk completing o ir with speed q
utrc i : Costs of transportation of J i per unit time
ucd i : Costs of delay penalty of J i per unit time
pc: Total costs of production
trc: Total costs of transporting workpieces
dc: Total costs of delay penalty
C: Total costs
h jkir (q): If o ir is not executed by m jk with speed q, then h jkir (q) =0, else h jkir (q) =1
dir(j): If o ir is not completed by F j , then dir(j) = 0, else dir(j) = 1
cir(r+1,j): If o ir and oi(r+1) are not both completed by F j , then cir(r+1,j) = 0, else cir(r+1,j) = 1
b i : b i = 0 (PT i < T i ), b i = 1 (PT i ≥ T i )
Measurement approach of optimization objectives
Considering the characteristics of LCE, minimizing Ms, C and TCE are involved in this research, which is formulated as follows:
(1) Makespan (Ms)
In LCE group manufacturing enterprises, on time delivery is one of their main concerns, so minimizing the makespan of all the jobs is an important objective. It is formulated as follows:
Where the transportation time, processing time and auxiliary time are taken into account. Equation (2) is used to calculate the makespan, and it is explained by Equations (3)∼(6).
(2) Total costs (C)
In this research, the value of C is calculated by the following formulas:
Where Equations (10) are the calculation methods of production costs, transportation costs and delay penalty costs respectively.
(3) Total equivalent carbon emission (TCE)
In this study, residual-heat utilization, equivalent carbon emission of transportation, treatment of pollutants and equivalent carbon emission of processing machines are taken into account to measure the total equivalent carbon emission in LCE group manufacturing enterprises. Thus the calculation method of TCE is formulated as follows:
In Equation (11), the TCE is equal to the sum of the equivalent carbon emission of production and that of transportation, which are explained by Equations (13) respectively. The ɛ in Equation (12) is usually taken as 0.7559 [47].
(4) Constraints
In order to avoid the conflicts in the mathematical model and calculate the three objectives accurately, some constraints are defined as follows:
Equation (14) defines a constraint that an operation can only be finished by one processing machine at one speed. Equation (15) is used to ensure that only after the operation r of job i has been finished and transported can the operation r + 1 of job i be processed. Equation (19) define the range of relevant index variables and decision variables.
ABC is a new swarm intelligent algorithm, which are widely used to address different production scheduling problems [14, 54]. It searches optimal solutions by simulating the foraging process of bee colony, in which a population is composed of three kinds of individuals, namely, employed bees, onlooker bees and scout bees. An employed bee finds new nectar sources according to the information of the old nectar sources. An onlooker bee uses the information shared by employed bees to search new nectar sources. The work of the scout bees is to search randomly for expanding the search scope of ABC. In the simple ABC (SABC), although ABC searches both locally and globally, its search speed is slow in the early stage, and the algorithm is easy to fall into local optimization for its greedy acceptance strategy. At the same time, because of the randomness of scout bees in global search, although it can help ABC jump out of local optimum, it is difficult to ensure the quality of solutions.
GA is another swarm intelligent algorithm, which searches optimal solutions by simulating the survival mechanism of the fittest in the biological world. In this algorithm, multiple points of an individual can evolve simultaneously, so GA is of great global search ability [55]. SA is an evolutionary algorithm inspired by the annealing process of solid materials. The probability selection strategy of SA can avoid local optimization effectively on the basis of insuring a reasonable convergence speed, so it was applied in this research.
It is difficult to get ideal Pareto solution of the studied Oos-DFJSP by a single algorithm. Therefore, we proposed a MOH-GA-IABC based on SABC to solve it. In MOH-GA-IABC, the introduced crossover and mutation operators of GA can improve its search efficiency at initial stage, diversity of population and accuracy of global search. Besides, the selection mechanism based on probability in SA is introduced to replace the greedy selection mechanism in SABC to keep the population diversity in the iteration process, so as to avoid premature convergence of MOH-GA-IABC. Figure 3 shows the main steps of MOH-GA-IABC, and they are explained by the following description:
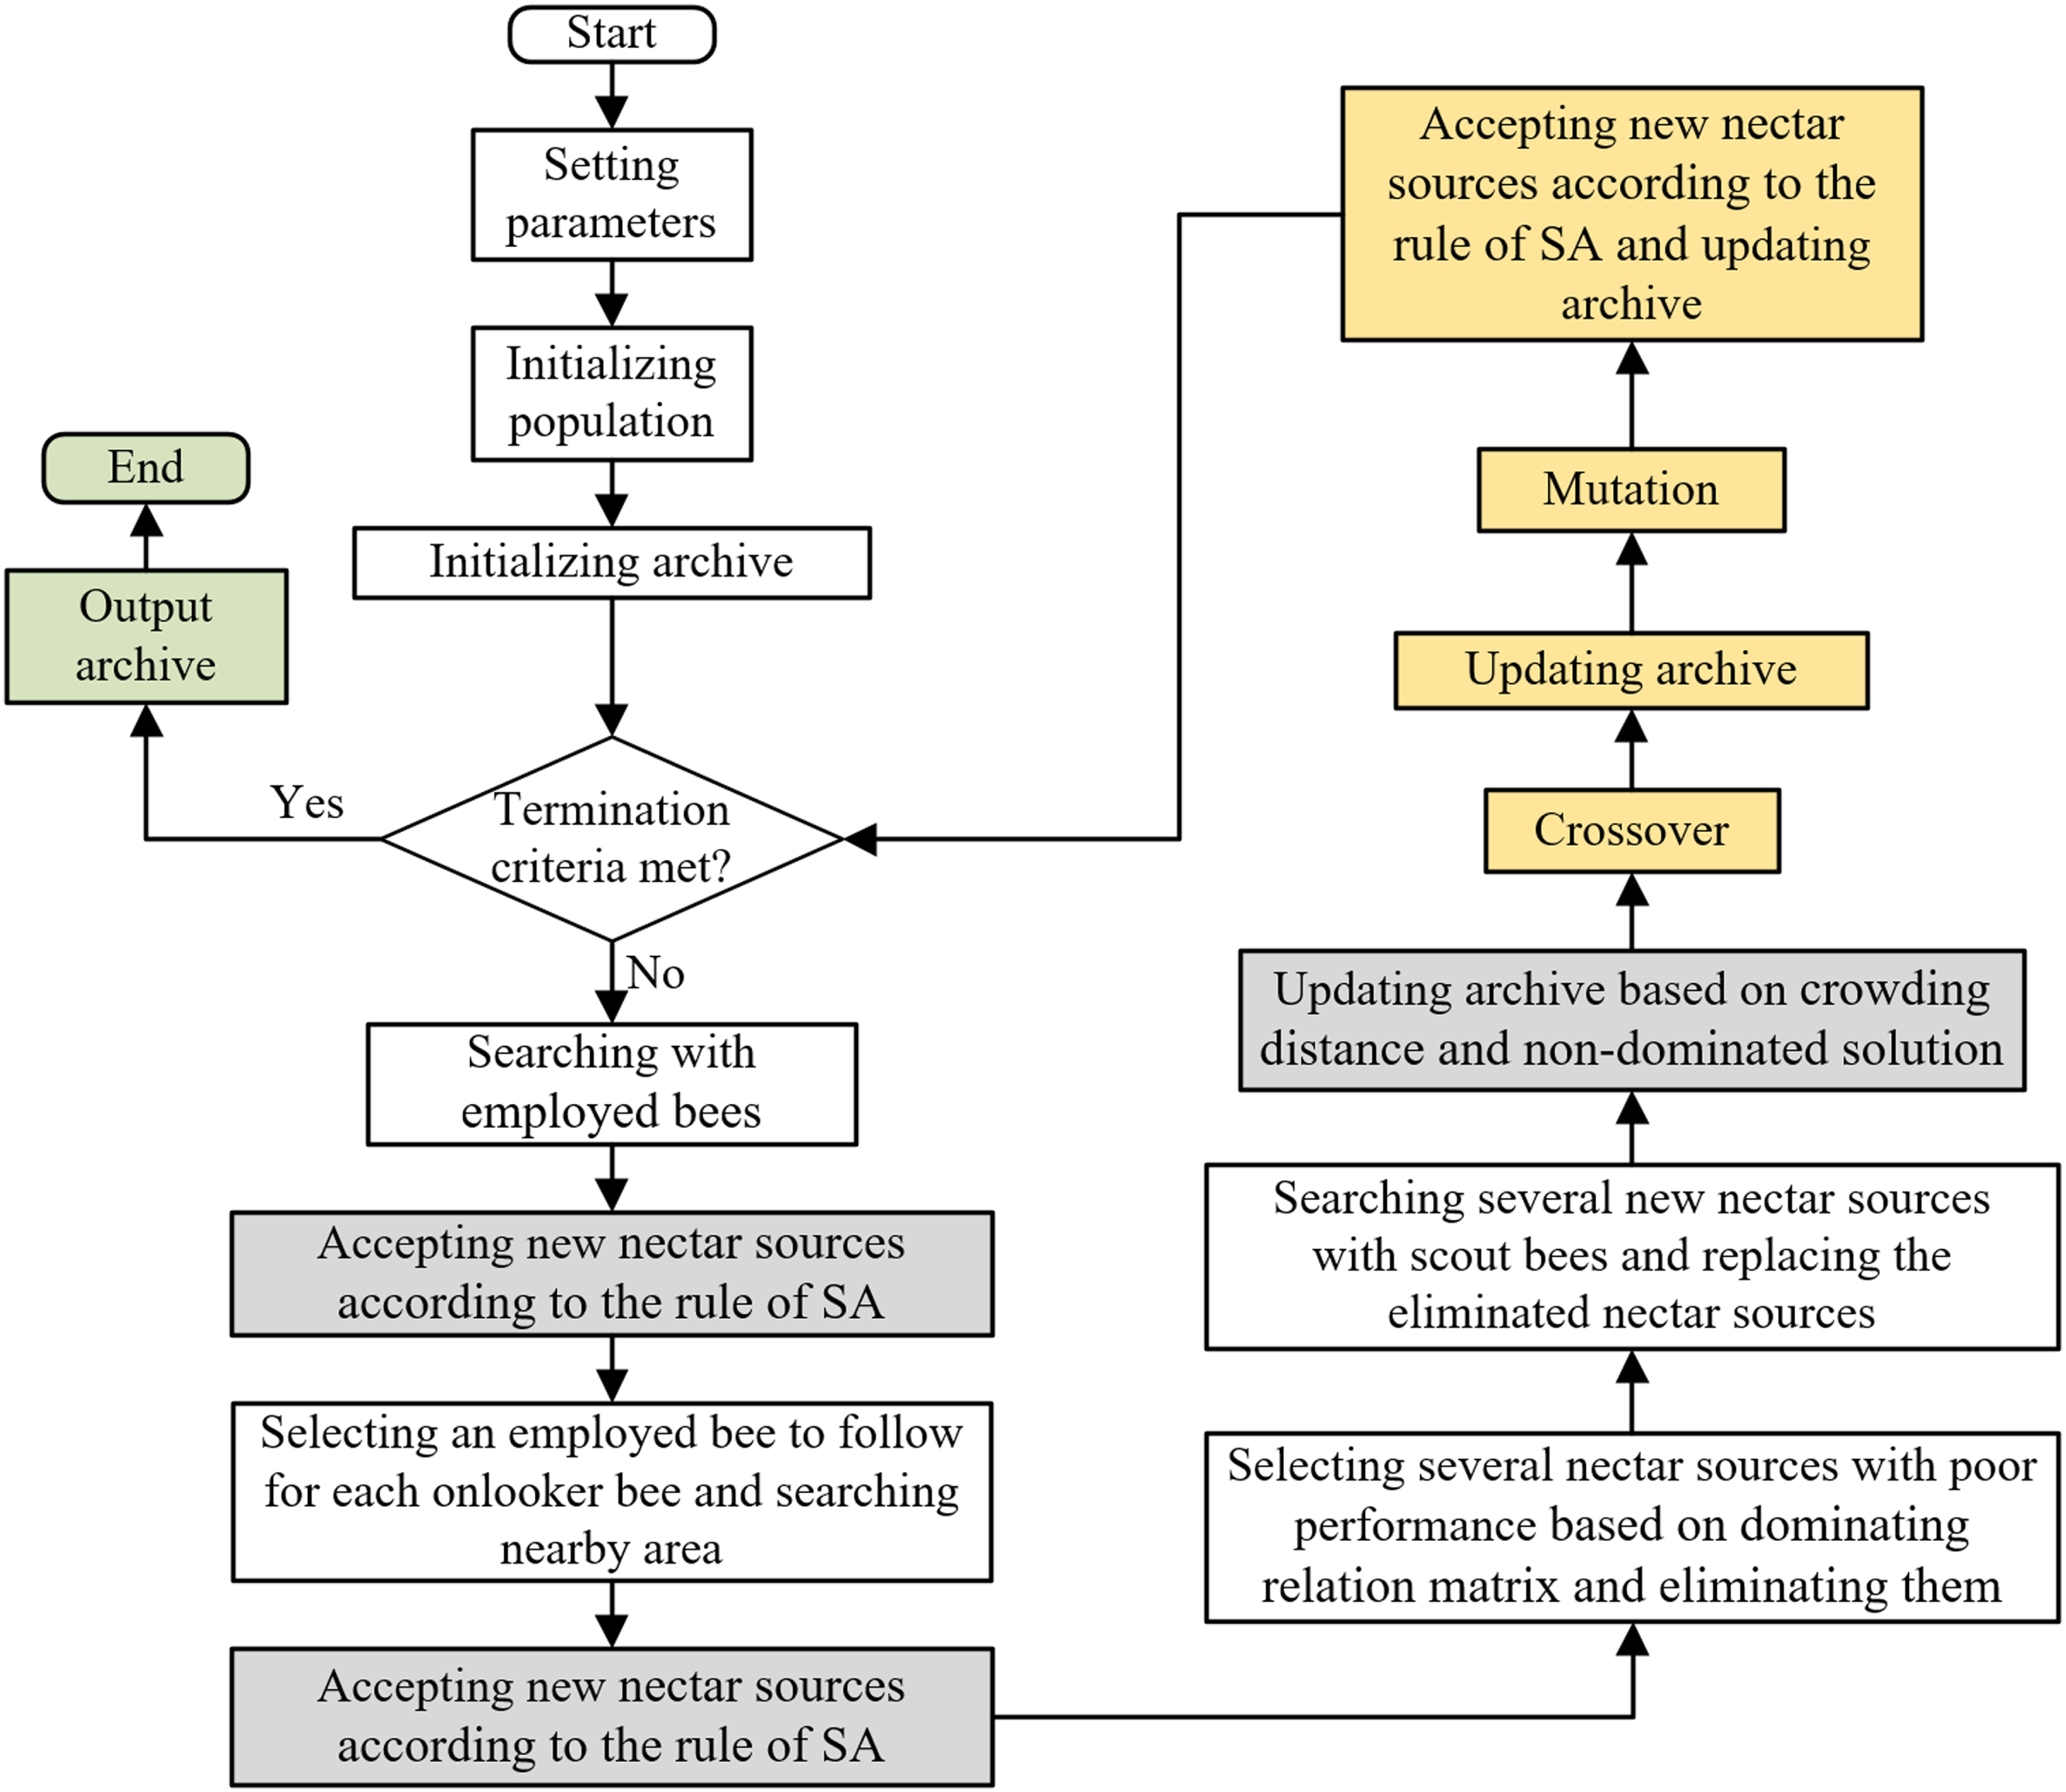
Main processes of MOH-GA-IABC for solving Oos-DFJSP.
To explain the MOH-GA-IABC more clearly, an example with three jobs (J1, J2, J3: {o11, o12, o13}, {o21, o22, o23, o24}, {o31, o32}) from different customers {Cus1, Cus2, Cus3}, six machines in three manufactories (F1 = {m11, m12}, F2={m21, m22}, F3={m31, m32}) is presented. The abilities of manufactories to undertake jobs are shown in Table 1, where the “–” indicates that the job cannot be assigned to the corresponding manufactory, and the “#” indicates that the job can be assigned to the corresponding manufactory. The processing capabilities of the machines are shown in Table 2, where the “–” indicates that the operation cannot be processed by the related machine, the “#” indicates that the operation can be finished by the related machine. Js and Os represent jobs and operations respectively. In addition, a value of q is only used to describe the index of a candidate processing speed for completing an operation by a machine, not the actual processing speed of a machine.
Abilities of manufactories to undertake jobs in the example
Processing capabilities of the machines in the example
According to the problem description in Section 3.1, the Oos-DFJSP can be summarized into four sub-problems as follows: Determining the sequence of operations, assigning jobs to manufactories, assigning operations to machines and determining the processing speed of each machine. Therefore, we use a real encoding scheme with four-layer codes to represent a solution in MOH-GA-IABC, and all real codes should be in interval [0, 1]. The encoding scheme cannot only describe the situations of the nectar sources and search process of bees directly in MOH-GA-IABC, but also reduce the operations of converting codes.
Figure 4 shows a decoding and encoding example of MOH-GA-IABC according to the data shown in Tables 1 2. In this example, the codes of an individual are divided into OS layer, JTC layer, OTM layer and SL layer, which correspond to the above four sub-problems respectively. Since the Oos-DFJSP is a typical discrete optimization problem, it is necessary to change the real codes of the individual into a set of integer codes shown in Fig. 4 for decoding. To solve the problem, a smallest position value (SPV) rule [55] and a discrete interval (DI) rule [29] are introduced in this study.

Decoding and encoding approach of MOH-GA-IABC.
Generating a good initialization population can effectively improve the convergence speed and results of an algorithm. In this research, four different initialization strategies are designed to generate different layers of initialization population. They are generated in the order of OS layer, JTC layer, OTM layer and SL layer. The codes of each layer will be generated in order.
In the above strategies, SPV rule and DI rule should be applied in the process of generating the initialization population for clarifying the different semantics of the real codes, so as to use different initialization strategies in each layer.
Search strategy of employed bees
The purpose of search with an employed bee is to find better new nectar source near the old nectar source corresponding to the target employed bee. In the search phase of employed bees, some dimensions of a solution (Xi) will be selected randomly for updating the positions of these dimensions. The maximum number of the selected dimensions is set to the number of jobs to be assigned. The method of updating the positions of the selected dimensions of Xi is expressed by
Where new_X i (j) represents the position of dimension j of the new nectar source, and X i (j) represents that of X i . Xbest - k(j) represents a non-dominated solution selected in archive randomly. After obtaining the new nectar source, the positions of employed bees will be updated according to the strategy described in Section 5.4.
In basic ABC, the greedy selection strategy is applied to accept the new nectar source obtained by updating the position of the corresponding old nectar source. However, since we studied a multi-objective problem in this paper, the general greedy selection strategy is not suitable. Aiming at solving the problem, an innovative strategy of accepting new nectar source based on the probability selection mechanism of SA is proposed. The applied methods of the strategy under different conditions are as follows: If the old nectar source X
old
is dominated by the new nectar source X
new
after a search operation, X
new
will be accepted, while X
old
will be abandoned. If X
old
and X
new
are not dominated by each other, adding X
new
to the archive first based on its maintenance strategy will be tried. After that, if the operation of adding X
new
to the archive fails, X
new
will be accepted with 50% probability, else X
old
will be replaced by X
new
. If X
new
is dominated by X
old
, X
new
will be accepted with probability e(-1/T), where e is the natural logarithm, T represents the current temperature. The updating method of T is as follows:
Where β is the cooling coefficient, and 0 < β< 1, Iter and T0 are the current iterations and the initial temperature respectively.
The search process of an onlooker bee is to select an employed bee to follow with a certain probability, and search for a new nectar source adjacent to the selected employed bee. In the search phase of onlooker bees of this study, all of the employed bees will turn into onlooker bees, that is, the employed bee followed by an onlooker bee is a nectar source obtained by it. Since the researched Oos-DFJSP is a problem with three objectives, the calculation approach of the probability of an employed bee of a population being followed by onlooker bees in classic ABC is not suitable. In terms of this issue, a method based on dominating relation matrix is proposed to determine the probability of an employed bee being followed by onlooker bees. The dominating relation matrix can be expressed by
Where dr
ij
represents the dominating relation between the ith employed bee (X
i
) and the jth employed bee (X
j
) in current population, a represents the number of employed bees in the population. If i = j, then dr
ij
= 0.5, else if i ≠ j and X
j
is dominated by X
i
, then dr
ij
= 1, else if i ≠ j, X
j
is not dominated by X
i
, and X
i
is not dominated by X
j
, dr
ij
= 0.5, else dr
ij
= 0. The probability of an employed bee being followed is calculated by
The employed bees are capable of searching for new nectar source in a wide range, while it is deficient in fine local search. Therefore, four neighborhood search methods corresponding to the four sub-problems in the Oos-DFJSP are designed. One of the four methods will be chosen randomly and used to one search operation of an onlooker bee. The operation methods of the four neighborhood search methods are as follows (Xi is assumed to be the selected employed bee followed by the current onlooker bee):
Searching with scout bees is an effective way for ABC and the corresponding hybrid algorithm to jump out of local convergence. The following steps describe the search procedures of scout bees of this research:
Step 1: The dominating relation matrix as shown in Equation (22) will be calculated. Then the probability of each nectar source being eliminated will be calculated by
Step 2: Several nectar sources corresponding to the largest probabilities of being eliminated will be selected and eliminated, and the number of selected nectar sources is generated randomly in [1, 3]. In this research, the above strategy for eliminating nectar sources with poor performance is verified to perform better than the strategy of roulette by a group of experiments.
Step 3: The eliminated nectar sources will be replaced by the nectar sources randomly searched by scout bees.
An external archive with fixed size is established to store the obtained non-dominated solutions by MOH-GA-IABC, which is maintained according to non-dominated relationships and crowding distances. The archive is initialized after initializing population, then it will be maintained in the process of running the algorithm. The main methods to maintain the archive include updating the crowding distances, adding individuals as well as removing individuals, their specific operation are as follows:
(1) Updating crowding distances. The crowding distances should be updated in each iteration for maintaining the archive correctly. And the calculation method of crowding distances can be expressed by the following pseudo-code.
(2) Adding individuals. If a nectar source is an excellent individual in an iteration, then it will be added to the archive by considering the existing solutions in the archive as well as the dominating relationships between the target individual and solutions in the archive. The operation process of adding an individual to the archive is shown in Fig. 5.

Operation process of adding an individual to the archive.
(3) Removing individuals. After the operation of adding new solutions to the archive, the number of individuals in the archive may exceed the total capacity of the archive, so it is necessary to remove some individuals. The following steps show the approach of removing individuals in this research: Firstly, the crowding distances of the archive before removing individuals will be updated; Secondly, the individuals should be sorted according to the crowding distances in ascending order; Finally, individuals with small crowding distances will be removed until the number of solutions reach the maximum capacity of the archive.
Crossover is a general operator of GA. It generates a new individual by randomly exchanging some elements of two selected parental individuals. Since the Oos-DFJSP studied in this research is so complex that it is important to expand the search range and use the existing information of the algorithm. As a result, we involved both the current population and the individuals in the archive to the mating pool, and two crossover strategies as follows were employed: In 60% of crossover operations, four random crossover points will be generated in OS layer, JTC layer, OTM layer and SL layer respectively. The operation method of this crossover strategy is explained by an example as shown in Fig. 6. In other 40% of crossover operations, one or two crossover point will be randomly generated in an individual. The operation method of this crossover strategy is presented in an existing literature [29].
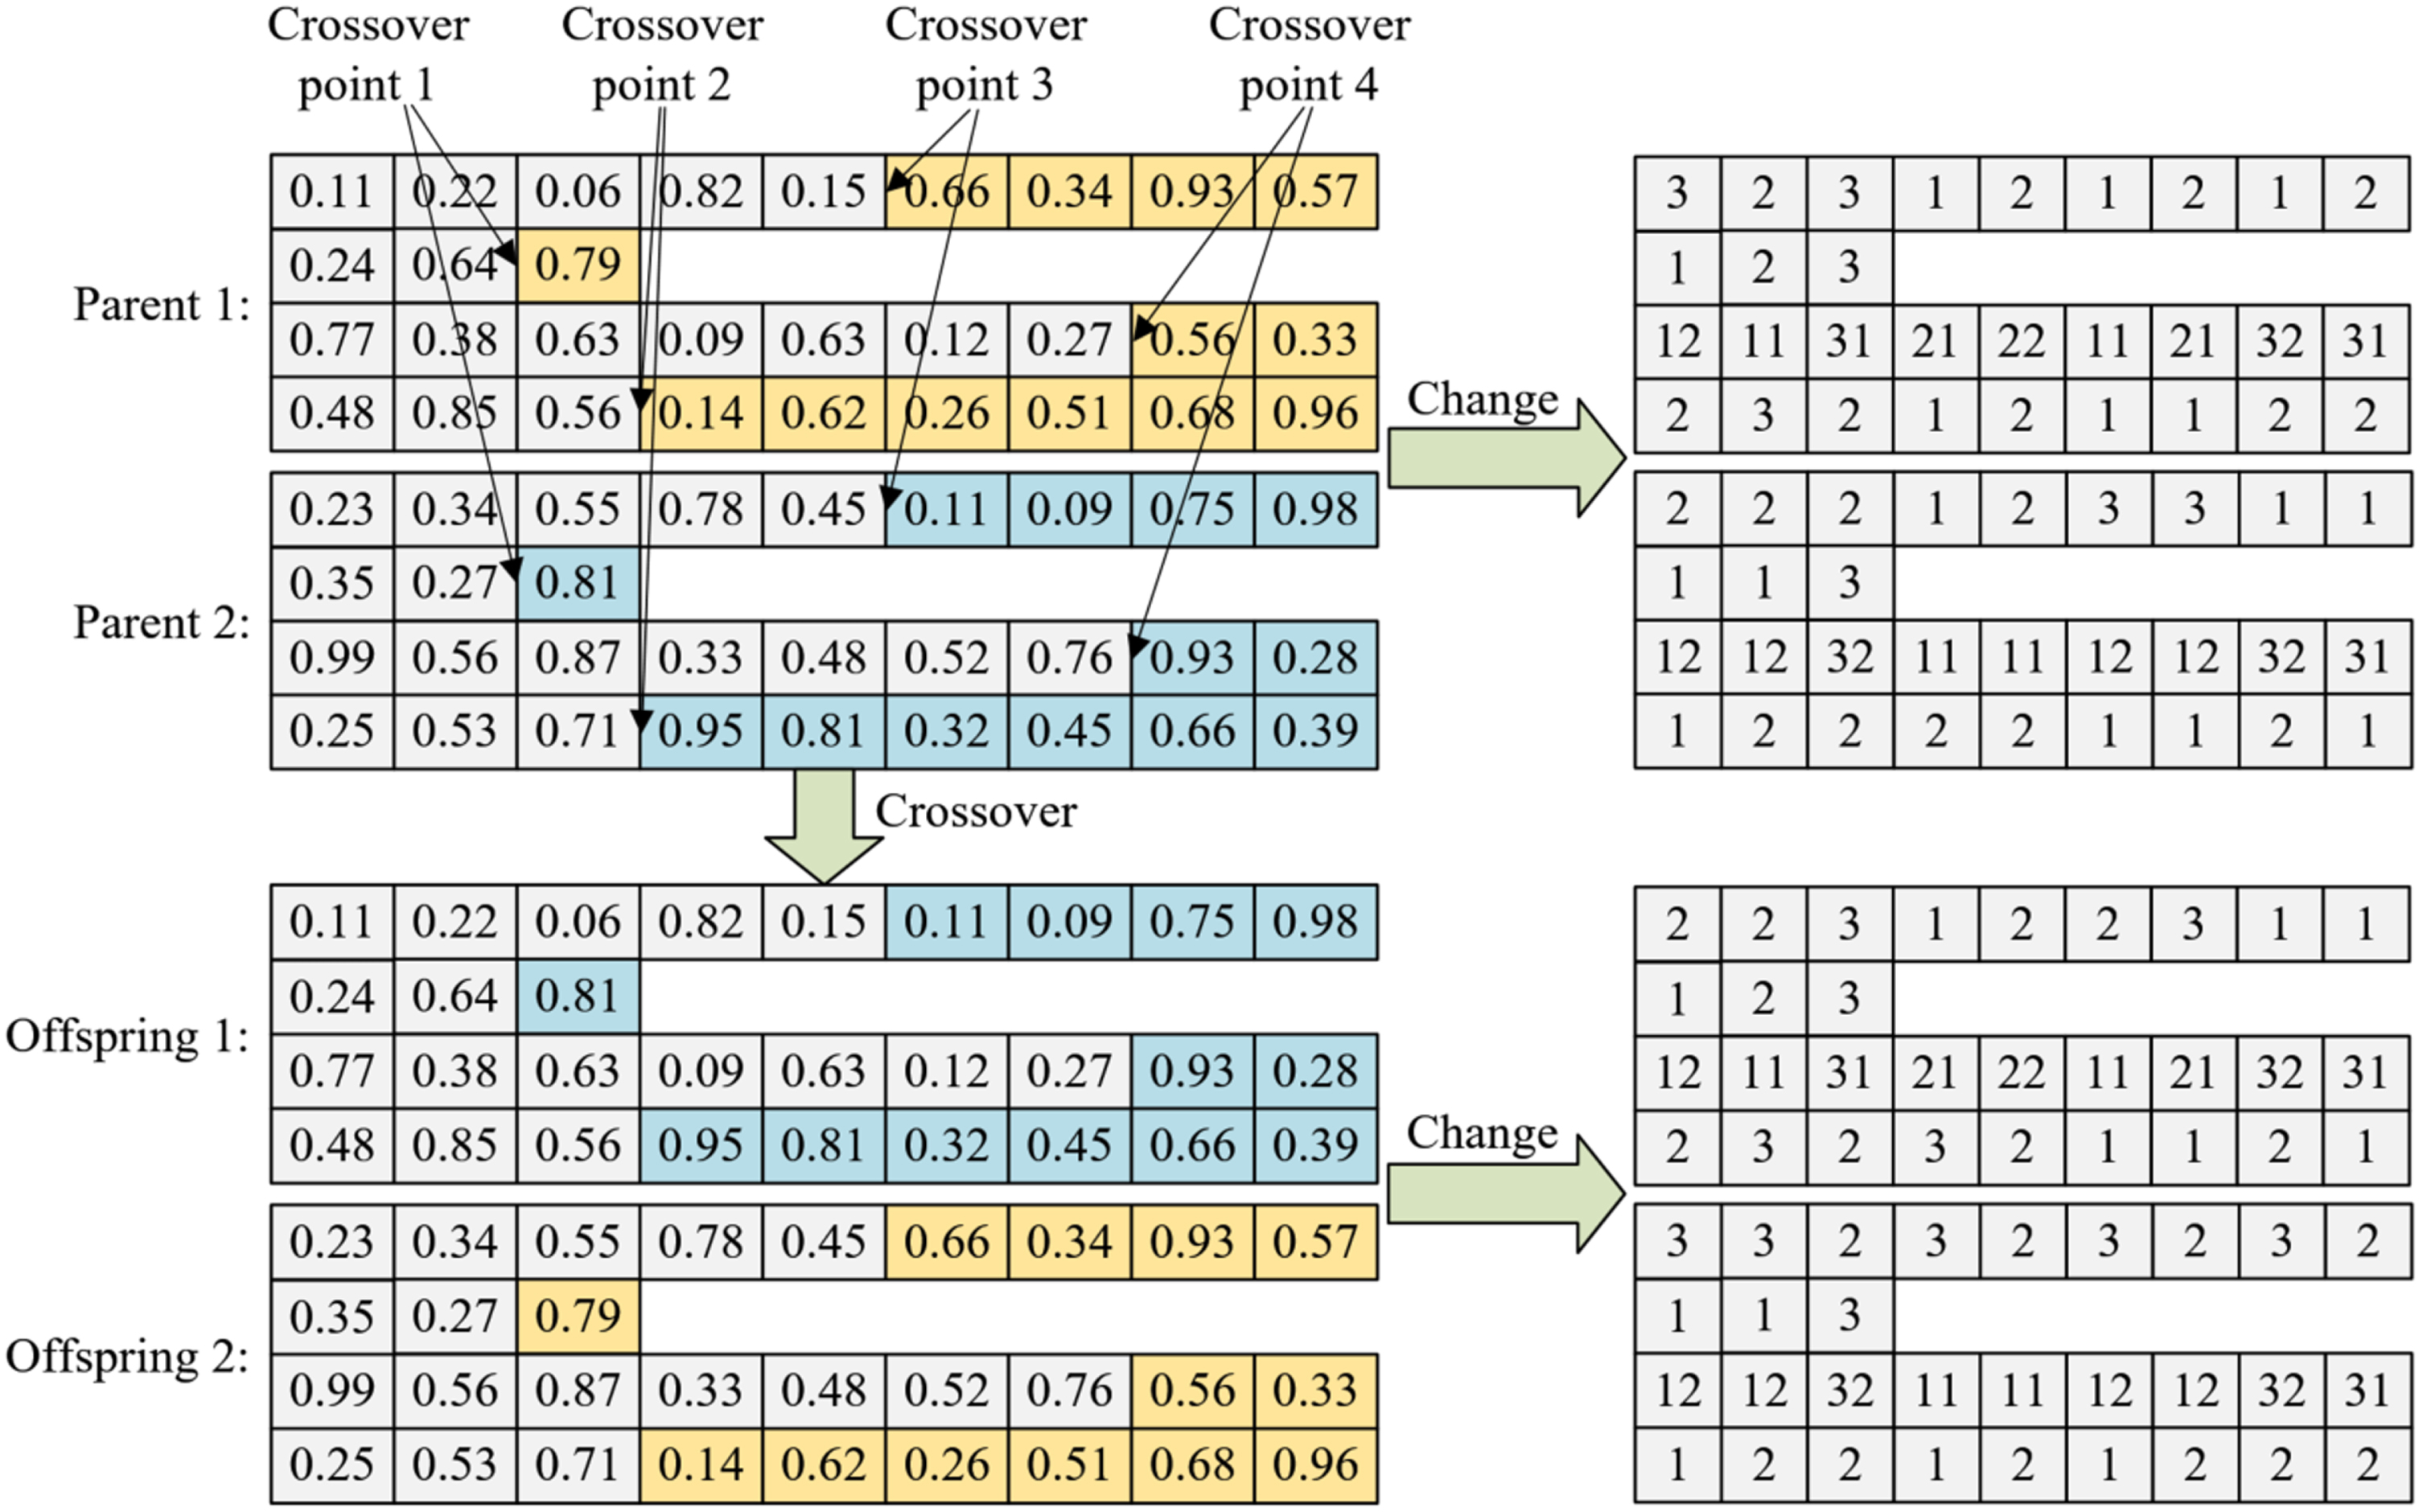
Crossover approach of MOH-GA-IABC.
In addition, three approaches for dealing with two offspring obtained in a crossover operation were developed. And each method is used as follows: If two parents come from the archive, they will be retained in the archive, and their two offspring will be tried to add to the archive. If one parent (Pr1) comes from the archive and the other from the current population (Pr2), Pr1 will be retained in the archive, and the two offspring (Ofs1 and Ofs2) will be tried to add to the archive. Then a dominating relation matrix including Pr2, Ofs1 and Ofs2 will be calculated with reference to Equation (22), and the probability of an individual being chosen to replace Pr2 will be calculated according to Equation (23). Finally, Pr2 will be replaced by the selected individual. If two parents (Pr1 and Pr2) come from the current population, the two offspring (Ofs1 and Ofs2) will be tried to add to the archive. Then a dominating relation matrix including Pr1, Pr2, Ofs1 and Ofs2 will be calculated according to Equation (22). The probability of an individual being selected to replace Pr1 or Pr2 will be calculated according to Equation (23). Finally, Pr1 and Pr2 will be replaced by two different selected individuals.
Mutation is another operator of GA based on the mechanism of biological gene mutation. In an individual of this study, the solution of OTM layer is affected by the solution of JTC layer. The solution of SL layer is affected by the solution of OTM layer. Therefore, to ensure the effectiveness of mutation operator, three different mutation approaches are designed in this paper, which are explained as follows: OS-JTC mutation. In this method, some mutation points in OS layer and JTC layer will be randomly generated. In OS layer, a code at one of the mutation points will be changed to a random real code. In JTC layer, a code to be mutated will be changed to a real code corresponding to a different candidate integer code. The codes of OTM layer and SL layer affected by the mutated codes of JTC layer will also be replaced by some random real codes. Figure 7 shows an example of mutation according to the data of Tables 1 2. In this example, two mutation points in OS layer and one mutation point in JTC layer are generated. The two real codes at the two mutation points of OS layer are replaced by two random real codes. The real code ‘0.79’ at the mutation point of JTC layer corresponds to the assigned manufactory of J3, and J3 can be undertaken by F1, F2 and F3, so the real code ‘0.79’ can be transformed to ‘3’ according to DI rule. Therefore, the old real code should be changed into a new real code corresponding to ‘1’ or ‘2’ by mutation. According to DI rule, the new real code should be in [0, 2/3], and it is ‘0.52’ in the example as shown in Fig. 7. OS-OTM mutation. In this method, some mutation points in OS layer and OTM layer will be randomly generated. The mutation strategy of OS layer is the same as that of OS layer in OS-JTC mutation. The mutation strategy of OTM layer is the same as that of JTC layer in OS-JTC mutation, and the codes of SL layer affected by the mutated codes of OTM layer will also be changed by randomly generating new codes. OS-SL mutation. In this method, some mutation points in OS layer and SL layer will be randomly generated. The mutation strategy of OS layer is the same as that of OS layer in OS-JTC mutation. In SL layer, the mutation strategy is the same as that of JTC layer in OS-JTC mutation.
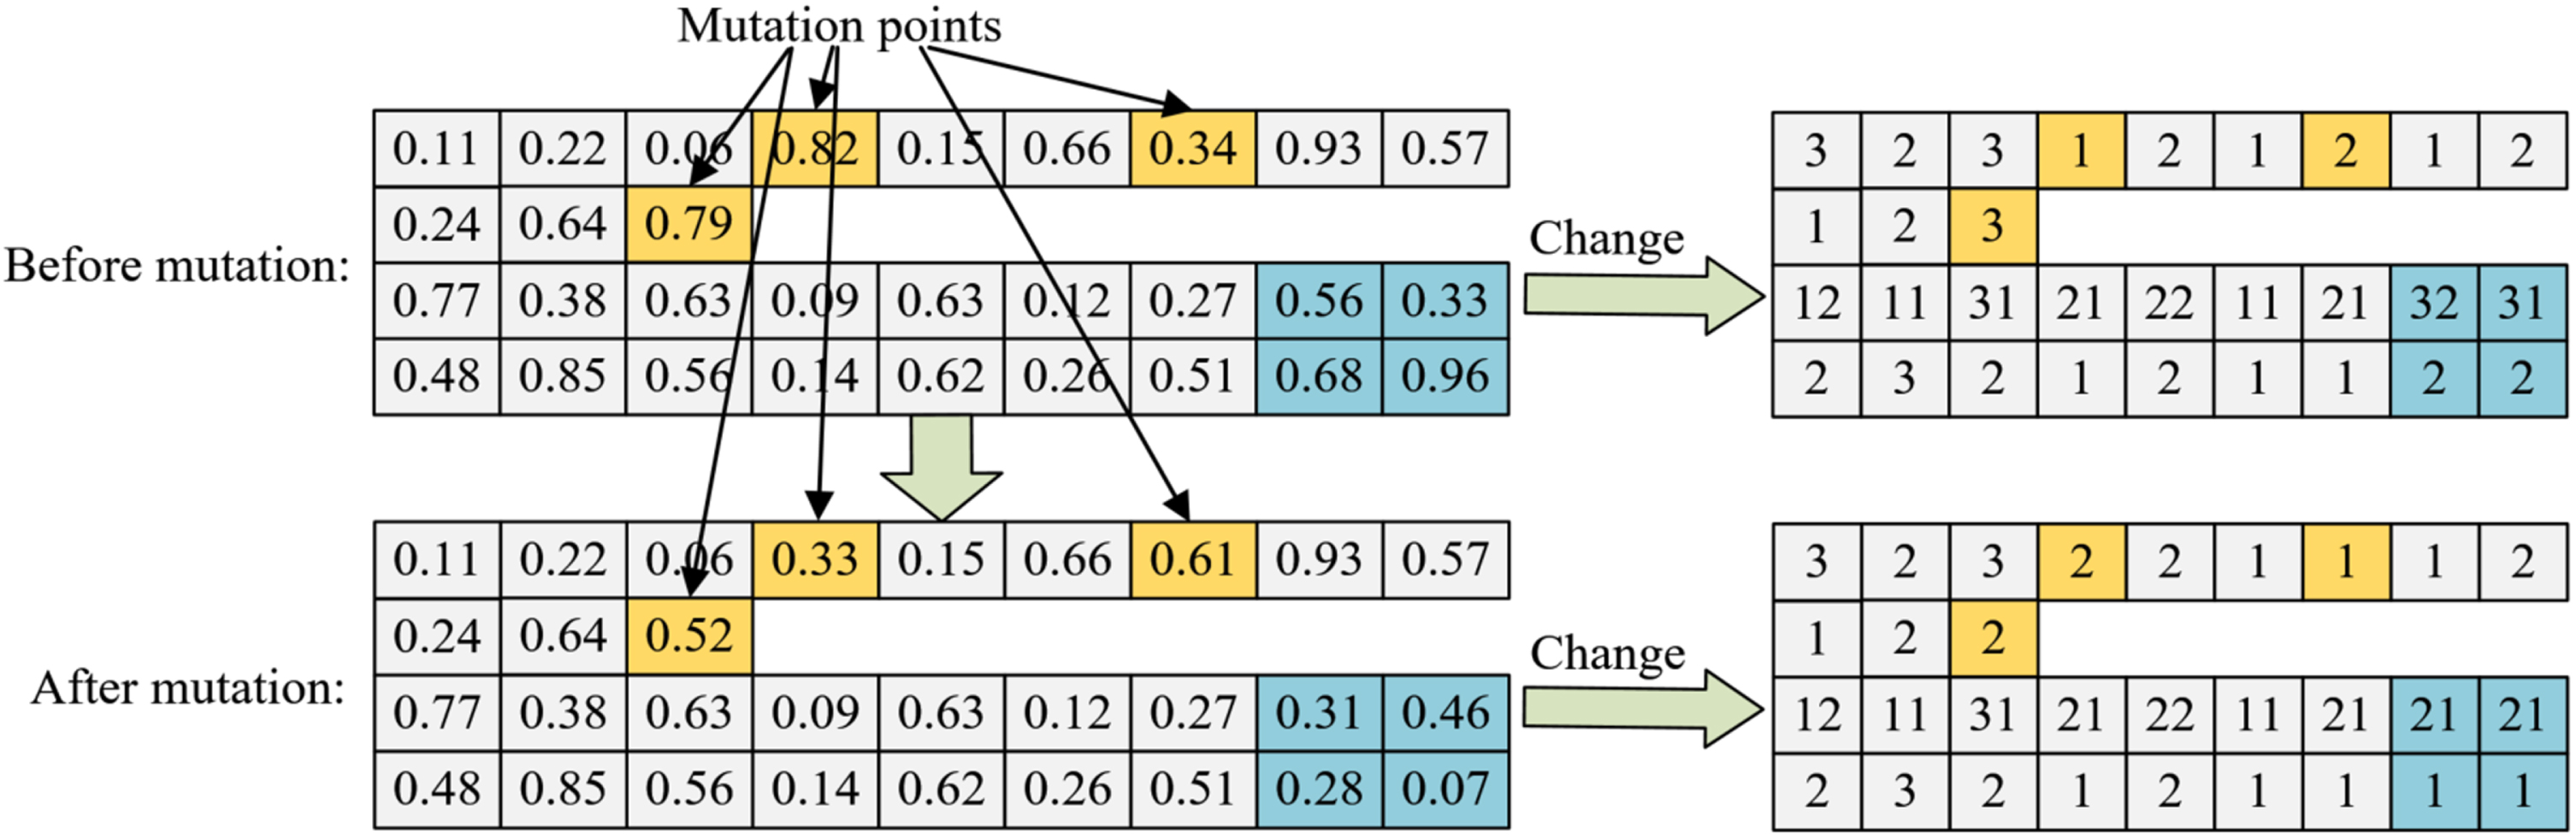
OS-JTC mutation approach of MOH-GA-IABC.
In this research, the minimum number and maximum number of mutation points are the number of codes in JTC layer and 1 respectively, so as to make the search range of mutation operation more flexible. In addition, if an individual is selected to be mutated according to the value of MR, one of the above mutation methods will be randomly applied.
In this research, we carried out some random test experiments with different scales according to the survey of a relevant manufacturing enterprise. Firstly, the data of 45 groups of random test experiments were designed and generated; Then, orthogonal experimental design method was designed to determine the optimized parameters of MOH-GA-IABC; Finally, some comparison experiments including MOH-GA-IABC, MOPSO [25], MOABC_LS [26], MOGWO [46], EMA [41] and classic NSGA-II were presented. All the algorithms were adjusted according to the characteristics of Oos-DFJSP.
Data preparation
In the existing studies, there is no suitable general test experiments for this research. To verify the performance of MOH-GA-IABC, 45 sets of test data were generated by considering the characteristics of Oos-DFJSP and referring to Mk01∼Mk15 in the standard experiments of FJSP, which include the cases of 4 manufactories, 5 manufactories and 6 manufactories. For instance, in an experiment named ‘Mk01_4’, the ‘4’ indicates that the number of manufactories in this experiment is 4. The ‘Mk01’ corresponds to experiment Mk01. The above test data are generated according to the data of Table 3. In each experiment, if an operation can be finished in a manufactory, the number of corresponding machines will not be less than 2.
Data for creating test experiments
Data for creating test experiments
In addition, the ranges of other parameters for generating each experiment were also defined as shown in Table 4. In this Table, each range indicates that the corresponding value will be randomly generated in this interval. (Pos_X, Pos_Y) describes the location of a manufactory or a customer. Time is the unit of the two axes. φ ir represents the set of all machines in participating manufactories that can finish O ir . max{Dis (S, E)} represents the maximum possible distance between two locations. The generating method of PT i refers to the existing research [47] and is improved to meet the needs of this study. In this method, the possible maximum values of transportation time of an operation outsourcing, trt i (Cus i ) (i.e. 2×max{Dis (S, E)} as well as max{Dis (S, E)}) are all involved.
Ranges of other parameters
The parameters of an algorithm greatly affect its performance, which means that it is necessary to select reasonable parameters for MOH-GA-IABC. Therefore, an experiment based on orthogonal experimental design method was performed with 5 levels. Table 5 shows the factors and levels of the experiment. According to the data in Table 5, the orthogonal experiment table including 25 sets of parameters as shown in Table 6 is obtained.
Source data of orthogonal experiment
Source data of orthogonal experiment
Orthogonal experiment table and average response values
The experiment of parameters is carried out with the medium-scale experiment Mk09_5. The algorithm with each group of parameters in Table 6 will be run 20 times for 10 minutes each time. The algorithm is run in the following platform: Windows 10, Intel®CoreTM i7-8700 CPU, 3.20GHz, 8GB RAM, Matlab R2018a.
After running the algorithm for each time, a reference set of non-dominated solutions will be obtained, which is formed by merging 25 subsets of non-dominated solutions corresponding to the 25 sets of parameters. The performance of each set of parameters is measured by the average response value (AvgRV) as shown in Table 6. The larger the AvgRV is, the better the set of parameters are. The calculation method of AvgRV of each set of parameters is as follows:
In Equation (25), AvgRV μ represents the AvgRV of the μth set of parameters, Nrnds(θ) represents the number of members in the reference set of non-dominated solutions obtained by running the MOH-GA-IABC for the θth time, while Nsubnds μ(θ) represents the contribution of the μth set of parameters.
According to the data in Table 6, the performance of the algorithm with each level of each factor as shown in Table 7 is obtained, and the corresponding trend of each factor is shown in Fig. 8. They indicate that the best parameter combination of the algorithm is PSet_1 = {NP = 50, AS = 20, T0 = 300, β=0.7, CR = 0.8, MR = 0.05}, while the results in Table 6 shows that the 2th set of parameters (PSet_2) is the best. It can be observed that only the values of AS and CR are different between PSet_1 and PSet_2, thus the effects of most of the above 6 parameters on the performance of the algorithm for solving the Oos-DFJSP are consistent in a certain range. In addition, as shown in Table 7, NP corresponds to the largest range, thus the performance of the algorithm is the most sensitive to NP. PSet_1 and PSet_2 also indicate that larger population and archive do not necessarily lead to more high-quality non dominated solutions.
Performance of the algorithm with each level of each factor
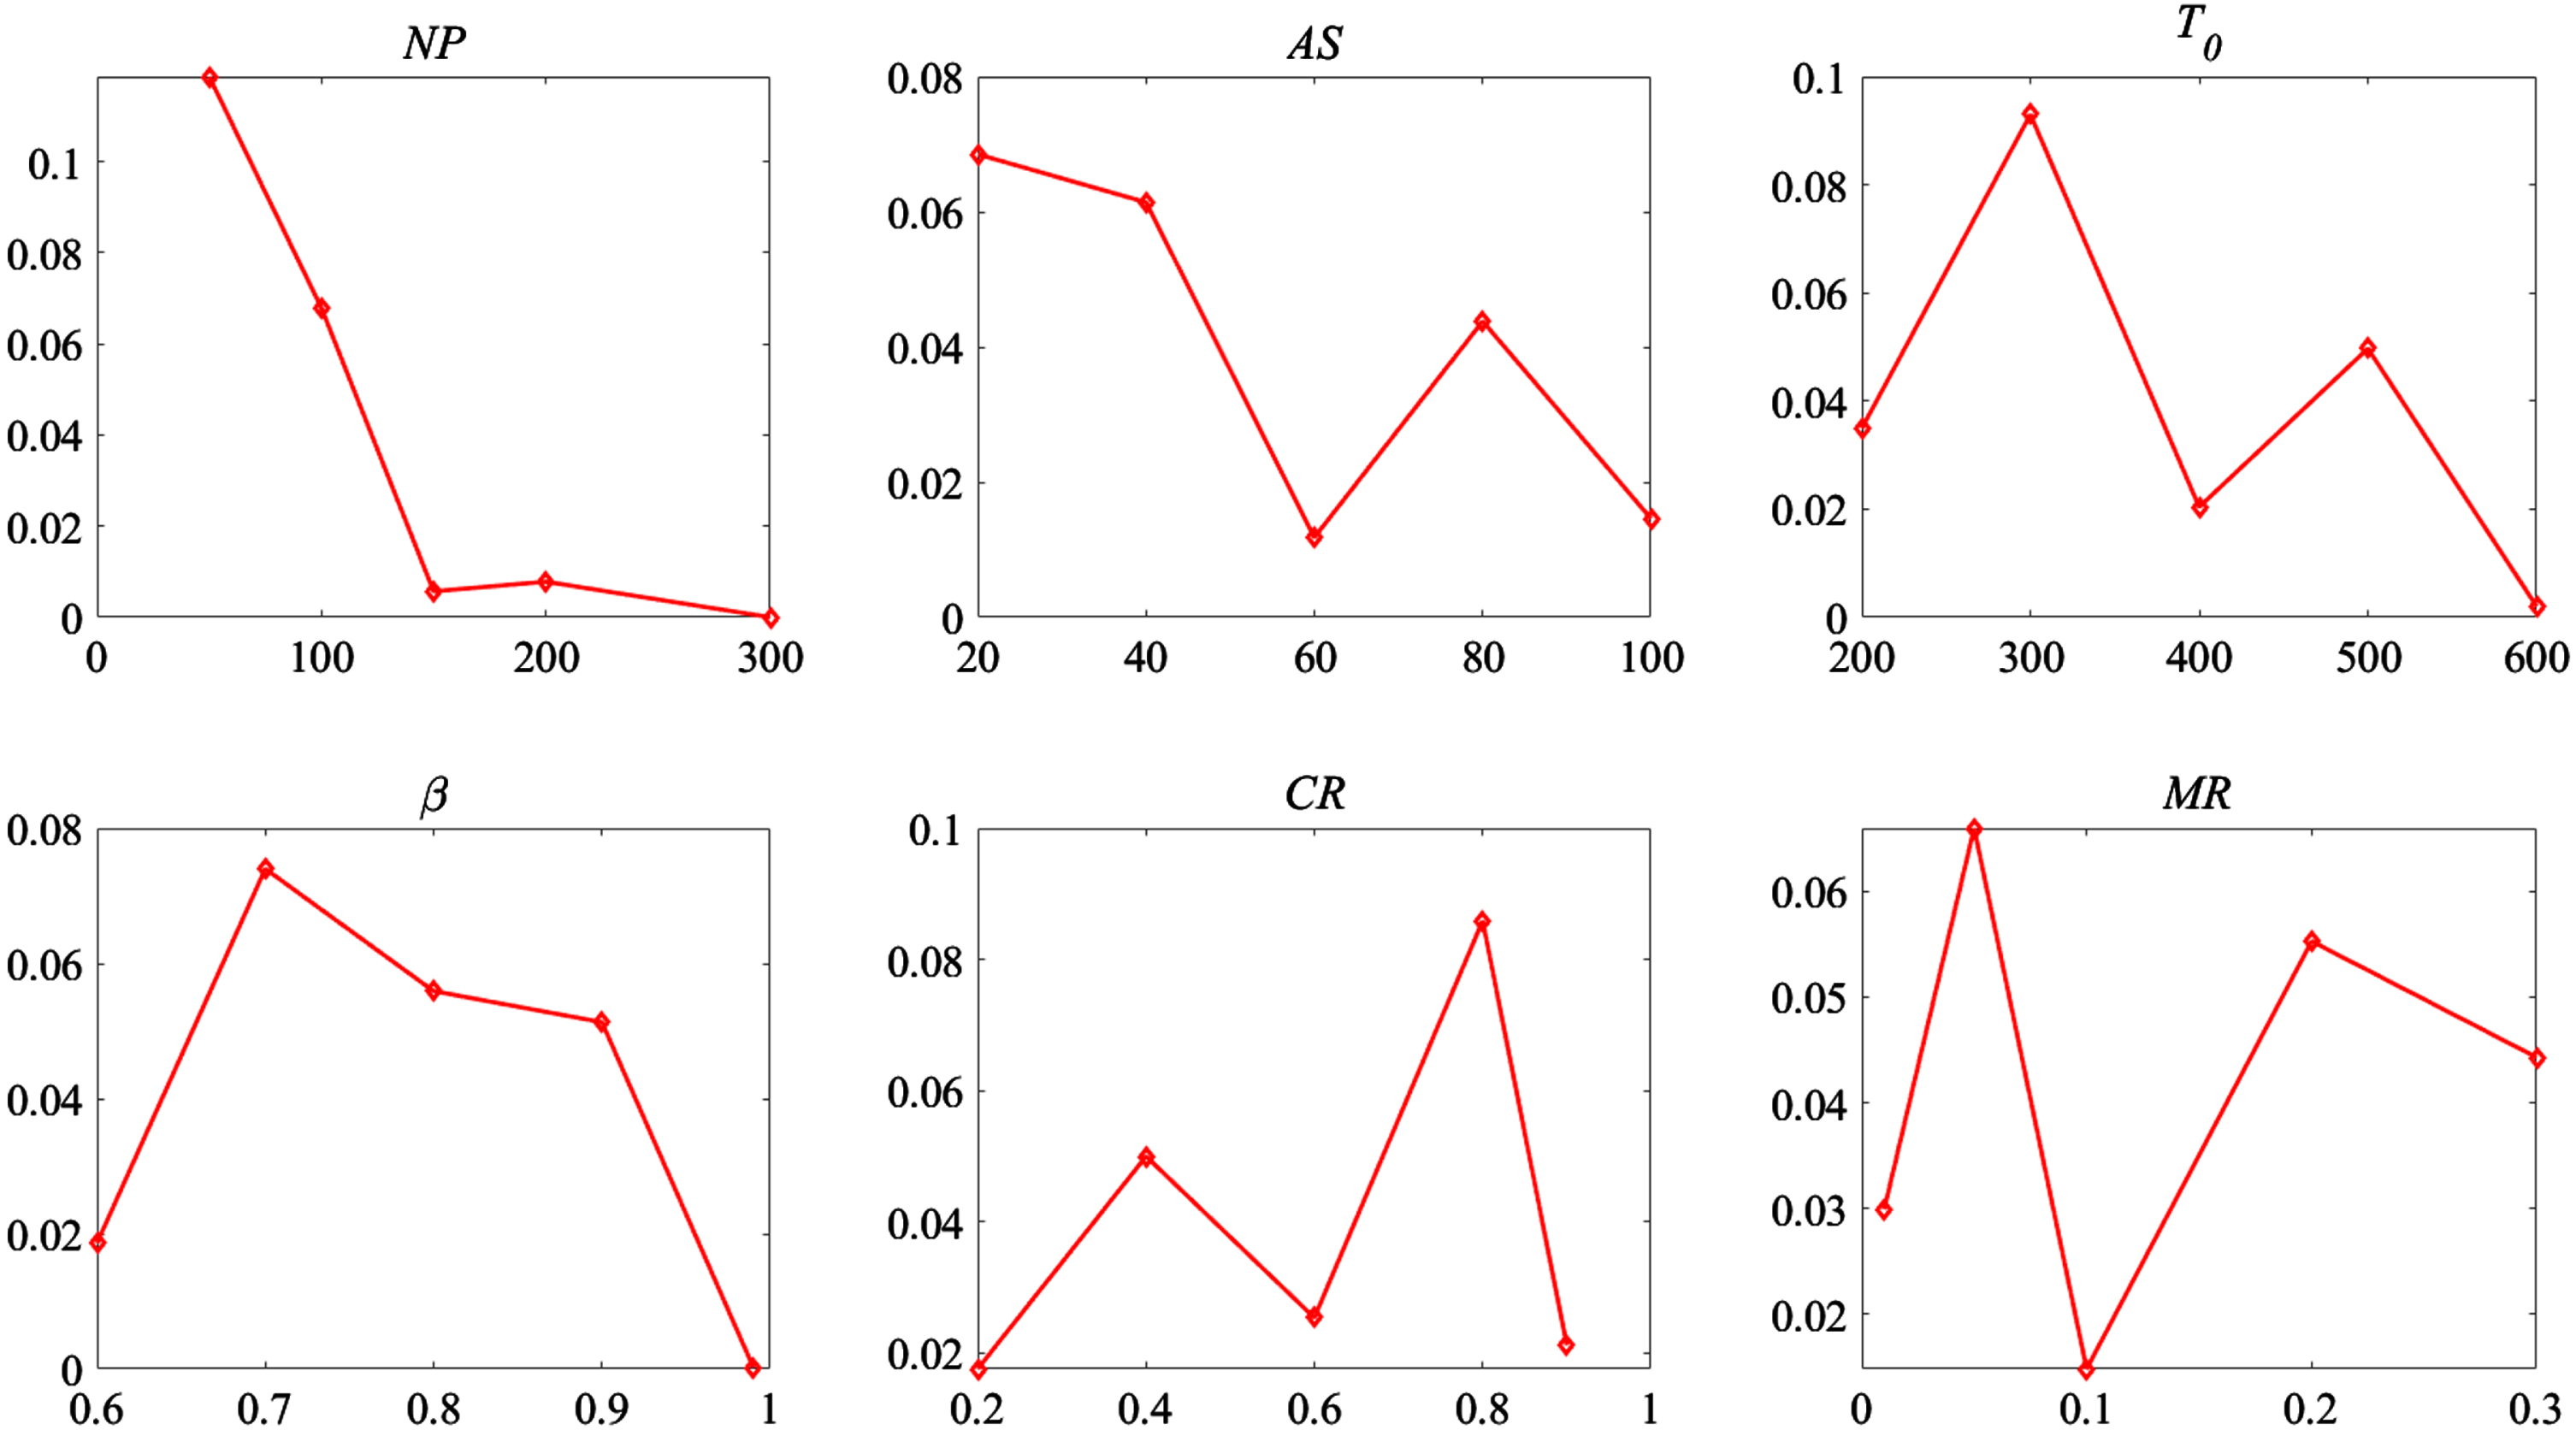
Trend of each factor.
To determine the parameters of MOH-GA-IABC, we presented another experiment of parameters including PSet_1 and PSet_2. Their average response value in this experiment were obtained as 0.5628 and 0.4372 respectively. In addition, the results of the experiment also show that the distribution of archive obtained using PSet_1 is better than using PSet_2. Therefore, PSet_1 is determined as the recommended parameters of the algorithm.
In this section, we carried out several groups of experiments (Mk03_4, Mk09_5 and Mk12_6) to verify the effectiveness of main three components designed in MOH-GA-IABC. The results are shown in Table 8. It can be observed that the algorithm performs best in different scale experiments when all components are used. Therefore, the three components proposed in this research can effectively improve the performance of the developed algorithm for solving the Oos-DFJSP. In addition, according to the results in Table 8, it can also be observed that the operators of GA has the greatest impact on the performance of the algorithm.
Orthogonal experiment table and average response values
Orthogonal experiment table and average response values
To comprehensively measure the performance of each algorithm, two indicators as follows are applied in this paper:
(1) Inverse Generational Distance (IGD)[26]
IGD is a common indicator to describe the distribution and convergence of a multi-objective algorithm, which describes the comprehensive distance between real Pareto front (Pf) and the set of non-dominated solutions (Ω) obtained by the algorithm. The smaller IGD corresponding to the algorithm is, the better the convergence and diversity of Ω are. That is, the closer Ω is to Pf. However, Pf is not available in this paper. Therefore, we took the union of four sets of non-dominated solutions obtained by MOH-GA-IABC, MOGWO, EMA, NSGA-II, MOPSO and MOABC_LS as Pf, in which the repeated solutions and the dominated solutions will be removed. The calculation method of IGD is as follows:
Where Dis(min) i represents the minimum Euclidean distance between the non-dominated solutions of Ω and the ith solution of Pf. M represents the number of objectives, f j (Pf i ) represents the value of objective j of the ith solution of Pf, f j (Ω k ) represents the value of objective j of the kth solution of Ω. size(Ω) and size(Pf) represent the quantities of solutions in Ω and Pf respectively.
(2) Error Ratio (ER)
ER represents the proportion of solutions in Ω that are not in Pf, which is calculated by
Where the smaller the value of ER of an algorithm is, the more the non-dominated solutions are provided by the algorithm to Pf, and the lower the proportion of useless solutions in Ω is.
In this research, 45 groups of comparison experiments were performed based on the 45 sets of test data with different scales generated in Section 6.1, so as to test the performance of MOH-GA-IABC. In order to improve the comparability of NSGA-II in the above comparison experiments, a test of parameters was also carried out to find a group of parameters with good performance for NSGA-II by referring to what were shown in Table 6. P _ NSGA2 = {NP = 200, CR = 0.9, MR = 0.01} was determined as its recommended parameters.
In each group of experiment, all of the algorithms run 20 times for 10 minutes. Table 9 shows the results of the 45 groups of comparison experiments. According to the results, MOGWO, EMA, MOPSO and MOABC_LS perform worse than the other two algorithms on both IGD and ER. In some small-scale experiments, NSGA-II performs better than the other five algorithms on IGD for its obtained large number of non-dominated solutions, while it performs worse than MOH-GA-IABC on ER in these experiments. However, in the 45 groups of experiments, MOH-GA-IABC is dominant on IGD in 34 of them, while MOH-GA-IABC is dominant on ER in all of them. In addition, it is dominant on both IGD and ER in 34 of them. Therefore, compared with MOGWO, EMA, NSGA-II, MOPSO and MOABC_LS, MOH-GA-IABC performs better on distribution, convergence and quality of non-dominated solutions for solving the Oos-DFJSP in this study, especially in solving medium-scale and large-scale problems.
Results of comparison experiments
Results of comparison experiments
In order to present the quality and distribution of non-dominated solutions of each algorithm intuitively, the scatter plots of non-dominated solutions obtained by the six algorithms in some experiments with different number of manufactories and jobs (Mk03_4, Mk04_5, Mk08_6, Mk09_5, Mk12_4, Mk15_6) are shown in Fig. 9. It can be observed that the data obtained by MOH-GA-IABC in each experiment are evenly distributed in the lower left corner of corresponding scatter diagram. Therefore, the following conclusions can be drawn from Fig. 9:
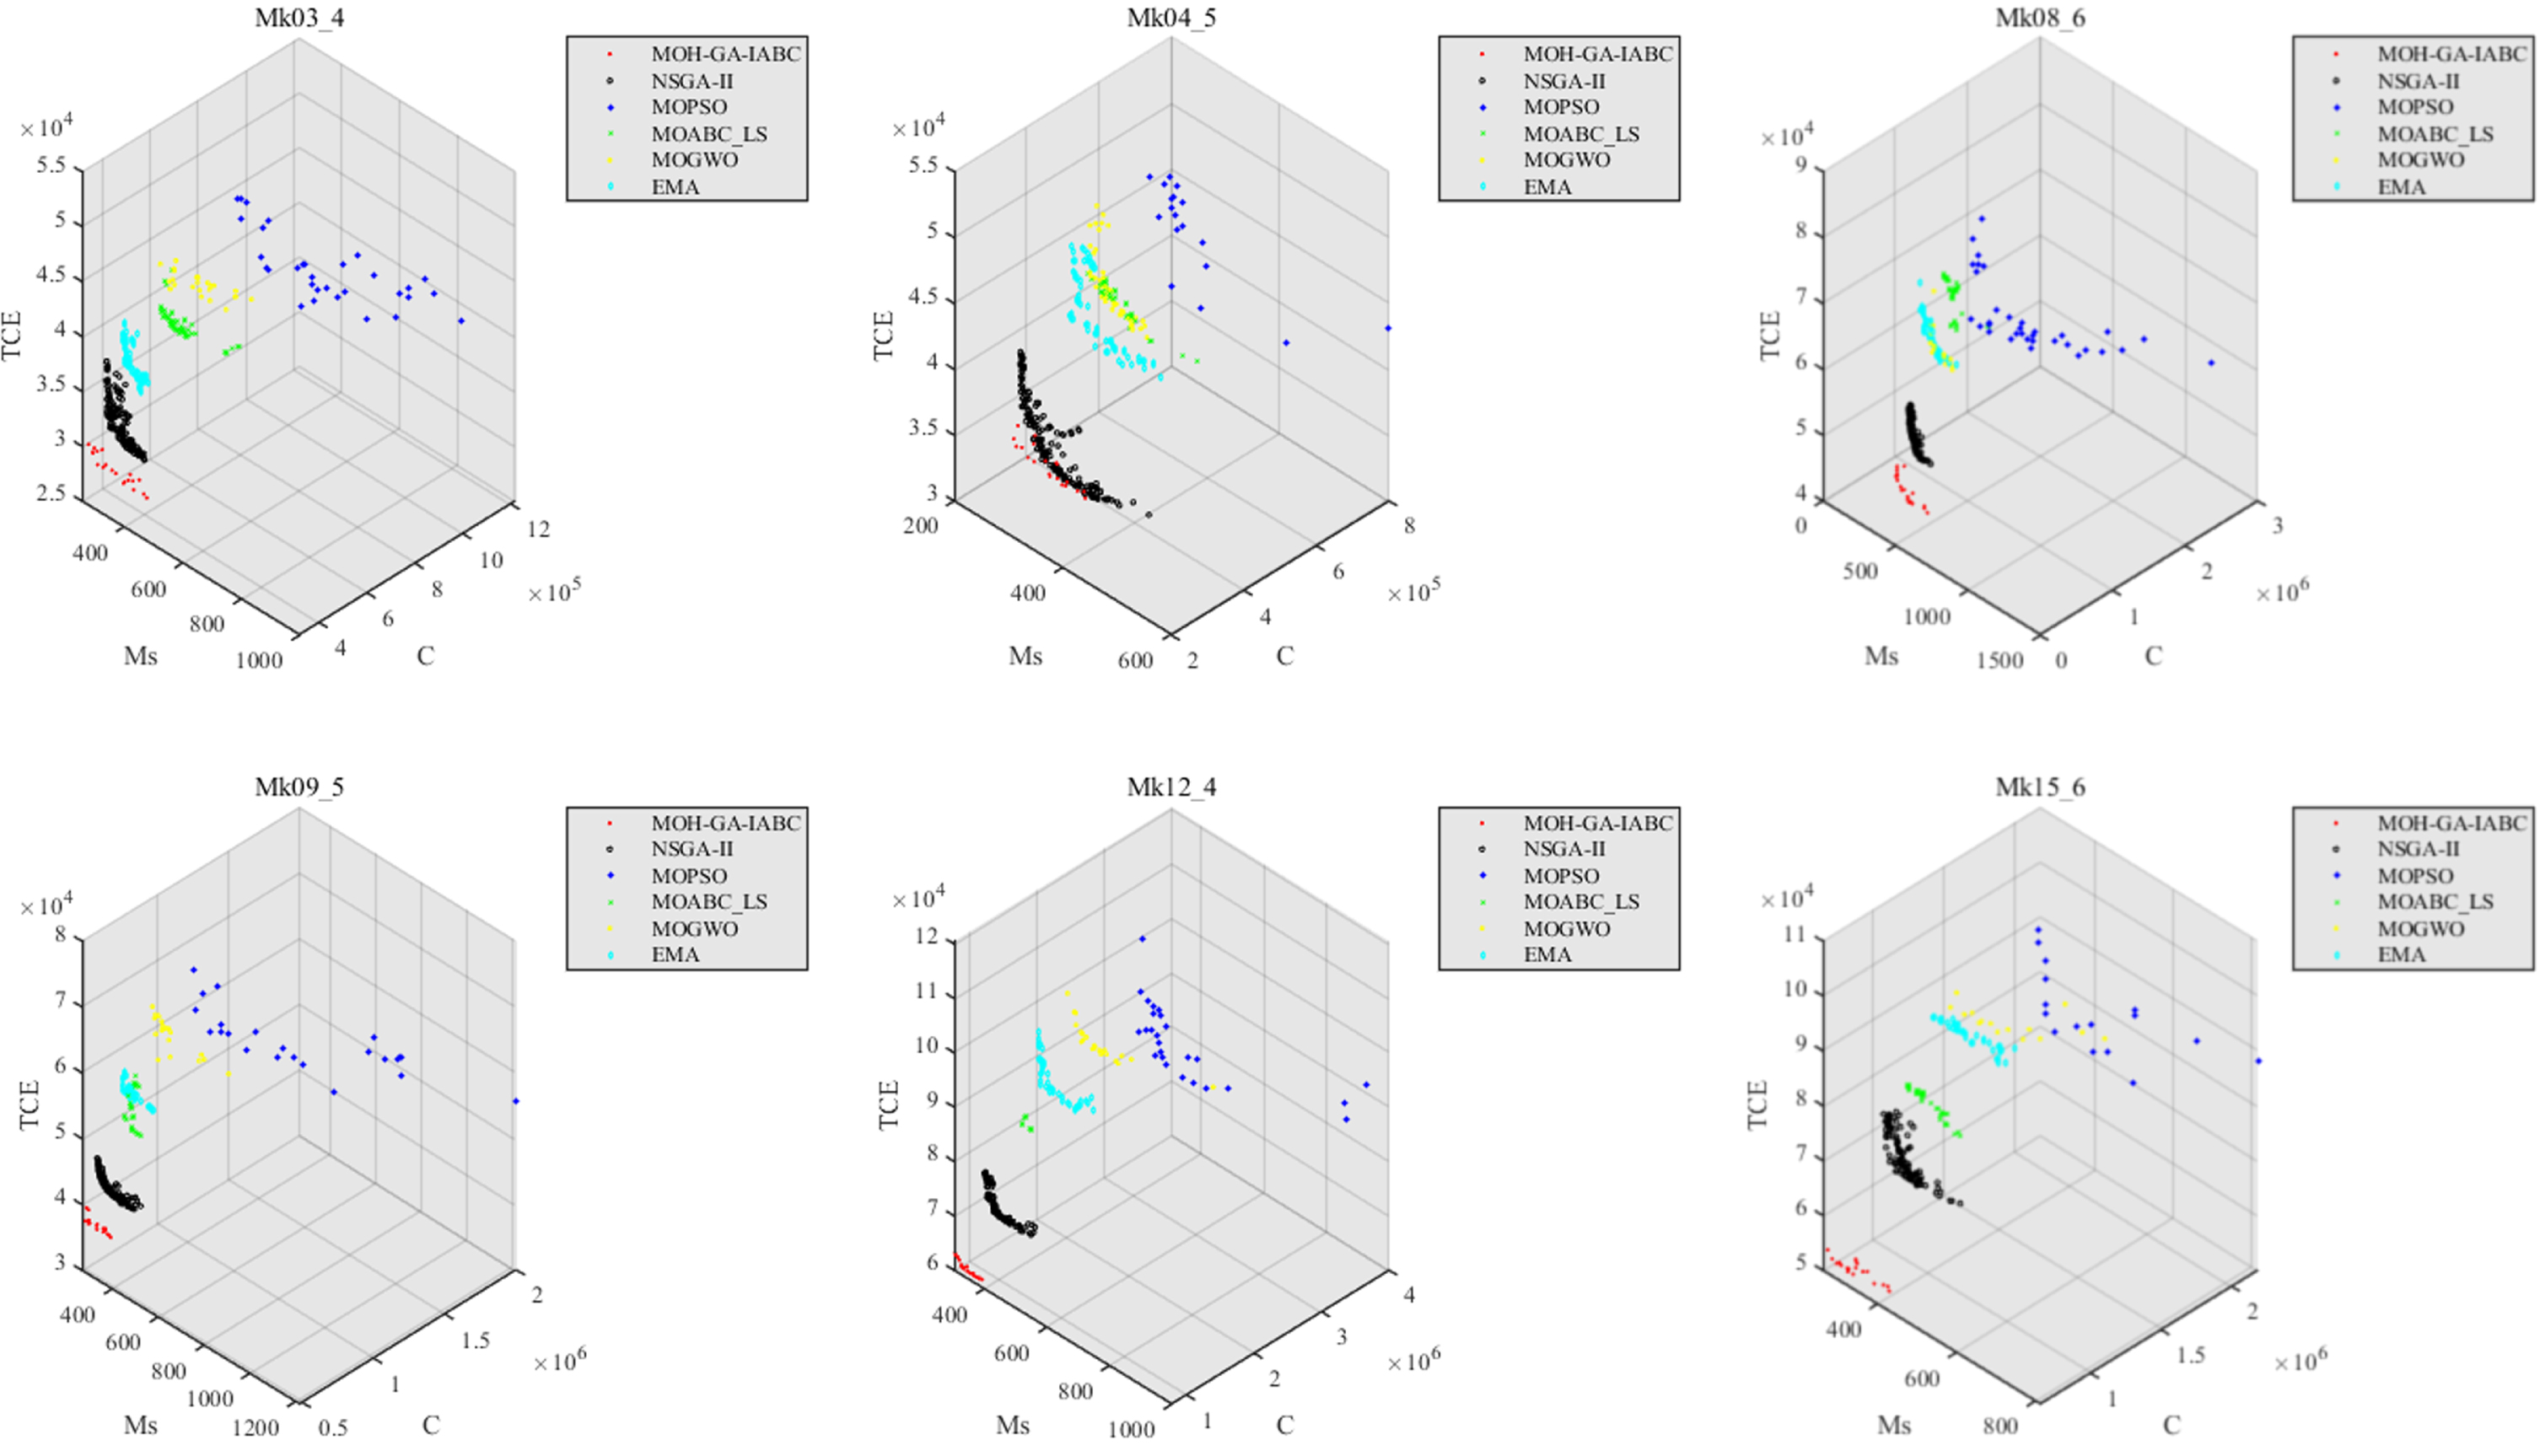
Scatter plots of different experiments.
Although the number of non-dominated solutions searched by MOH-GA-IABC is less than that of NSGA-II, its quality of data in most experiments is significantly better than that of the other five algorithms. In aspect of distribution, the non-dominated solutions obtained by MOH-GA-IABC also perform well.
Figure 10 shows some solutions generated randomly (Before optimization) and the non-dominated solutions obtained by MOH-GA-IABC (After optimization) corresponding to the three experiments with different scales (Mk01_4, Mk08_5, Mk13_6). Compared with the randomly generated solutions, the three objectives of the optimized solutions are significantly improved.

Comparison of solutions before and after optimization in different experiments.
Figure 11 shows the Gantt Chart of two solutions of Mk01_4, which are a solution obtained by MOH-GA-IABC and a randomly generated solution respectively. It can be observed that the number of outsourced operations after optimization is significantly less than that before optimization, and the optimized solution is more compact than that before optimization, reducing a lot of waiting time. Meanwhile, the values of C and TCE of solution before optimization are 1.54×10⁶ and 6.93×10⁴ respectively, the values of C and TCE of solution after optimization are 4.8×10⁵ and 3.8×10⁴ respectively, that is, all of the three objectives are improved simultaneously after optimization using MOH-GA-IABC.

Gantt Chart of solutions before and after optimization of Mk01_4.
In summary, the designed MOH-GA-IABC can solve the Oos-DFJSP studied in this research effectively. Compared with the five existing multi-objective algorithms including MOGWO, EMA, NSGA-II, MOPSO and MOABC_LS, the comprehensive performance of MOH-GA-IABC designed in this paper is significantly more excellent, especially in solving medium-scale and large-scale problems.
In this research, the problem of distributed low carbon scheduling for group manufacturing enterprises of LCE was presented. According to the characteristics of this kind of enterprises, necessary operation outsourcing cases were involved. In terms of the above problem, a multi-objective model including makespan, total costs and carbon emission was formulated, in which energy consumption of production, energy consumption of transportation, power generation of waste heat, treatment capacity of pollutants and processing speeds available for machines are involved simultaneously. Compared with the existing low carbon scheduling model, it has more practical application value. Given the complexity of the studied problem, we designed a MOH-GA-IABC by combining the advantages of ABC, GA and SA to address the proposed model for finding high-quality non-dominated solutions. In this algorithm, an individual was described by a set of four-layer codes. Aiming at increasing its search scope, diversity of population and search efficiency, different strategies of initializing population, processing data and updating codes were developed. Finally, three groups of effectiveness verification experiments of different components in MOH-GA-IABC, 45 groups of comparison experiments with different scales and comparative analysis experiments using scatter chart were carried out. According to the data obtained in these experiments, the following findings and conclusions can be obtained: The designed components including operators of GA, strategies of accepting new nectar source based on SA and initialization strategies of population significantly improve the optimization ability of the proposed algorithm, in which the operators of GA is most critical component. In most of the 45 groups of comparison experiments with different scales, the developed MOH-GA-IABC performs better than MOGWO, EMA, NSGA-II, MOPSO and MOABC_LS in the existing studies, especially in solving medium-scale and large-scale problems, that is, the algorithm proposed in this paper has better performance in solving complex Oos-DFJSPs than other five algorithms. In the scatter charts of comparative analysis experiments, the solutions obtained by MOH-GA-IABC evenly distributed in the lower left corner. Therefore, the proposed algorithm can search solutions with higher quality than other five algorithm and has good distribution.
However, designing algorithms that can solve real-time scheduling problems and considering more complete carbon emission factors are still the content of this paper that needs further research. In the future, it will be interesting to research the following issues: The types of energy required by enterprises to carry out production are diverse. In addition, the prices, demands and the effectiveness of energy are all different in different time periods or seasons. Therefore, it will be an interesting direction to study the low carbon scheduling problem of manufacturing enterprises in the diversified energy supply environment, which will also be a great help to reduce the manufacturing costs. The complexity of the manufacturing process of LCE and the length of the manufacturing cycle will lead to frequent changes in its design and job allocation in the manufacturing process. Therefore, it is of great significance to study the rescheduling problems for the manufacturing of LCE in different conditions. With the development of intelligent manufacturing technology, robots will gradually become an important tool for efficient operation of manufacturing systems, and improving the path planning performance of robot in dynamic and complex environment has become an important development direction [56]. Therefore, it will be another interesting direction to research the robot path perception and optimization methods for optimizing the operation of intelligent workshop.
Footnotes
Acknowledgments
This work is supported by the National Natural Science Foundation of China under Grant (Nos. 52105513 and 51905396).