
Abstract
Hydropower station is vital for the stable growth of the national economy. How to timely warn the possible faults of hydropower stations has become an increasingly popular research topic. The traditional detection model is difficult to detect the small abnormal changes in the data, and these abnormal changes are often the precursor of faults. To improve the sensitivity of the traditional detection model, this study introduced a weight factor into the traditional LSTM detection model. By using the correction mechanism, the LSTM correction model makes the prediction model never deviate from the normal track following the appearance of abnormal data. This ensures that the model can generate large residuals after abnormal data occur so that we can detect these abnormal data in time. Finally, this paper puts forward two factors related to equipment health and integrates these two factors to form a health index. The results show that the LSTM correction model based on the health index can not only detect small changes that cannot be detected by traditional detection models but also knows the wear and tear of equipment during operation based on the changes in health indicators.
Introduction
The normal operation of hydropower plants is the guarantee for the rapid growth of the national economy. With the rapid development of hydropower plant automation equipment and the continuous expansion of the capacity of hydropower station generator sets, it is of great significance for power plants to use big data to analyze the degradation degree of equipment components and make a timely prediction of unit faults [1]. A variety of sensors are installed on the generator set of the hydropower plant, and researchers take various measures to ensure the accuracy of these sensors data [2,3, 2,3]. Those sensors monitor the running status of the equipment in real-time, monitoring data can not only reflect the characteristics and state of the hydropower plant but also provide a maintenance basis for maintenance personnel. Maintenance personnel can effectively prevent faults by monitoring sensors data.
In recent years, researchers around the world have devoted themselves to the research of equipment fault warning. The relevant status is summarized as follows:
Fault diagnosis and early warning are often considered as classification issues. Zhao [4] put forward the deep residual shrinkage network. Different from fixed threshold classification, this algorithm noticed unimportant features through the attention mechanism and set them to zero by the soft threshold function. And Wang [5] collected the spindle current signal into the particle swarm optimization support vector machine model and then evaluated the performance of the spindle. Plakias et al. [6] proposed a focused dense convolutional neural network (ADCNN). This algorithm combined dense convolution blocks with attention mechanisms and can effectively detect fault data. Song et al. [7] proposed a fault detection method based on standardized knn (SKNN). The method developed a standardized distance to characterize the distance between data and its neighbors, taking into account both inter-pattern and inter-pattern scale information. Through the experiment, the result showed that this algorithm had high superiority in fault diagnosis. Wu et al. [8] proposed a semi-supervised fault diagnosis method called hybrid classification autoencoder. This algorithm modifies the mean square error (MSE) commonly used in unsupervised autoencoders, and it can obtain fairly high diagnosis accuracies. Mo et al. [9] proposed a new weighted cyclic harmonic-to-noise ratio (WCHNR) index, this index can be used to directly evaluate the quality and quantity of harmonics in the square envelope spectrum of bearing characteristic frequencies, so that fault harmonics can be detected. Selak et al. [10] applied a support vector machine to data detection of hydropower station generators and effectively realized fault classification. Zhu et al. [11] proposed a monitoring model based on nuclear independent component analysis (NICA) and principal component analysis (PCA), which was applied to the environment of hydropower units to detect the occurrence of faults more effectively. Liu et al. [12] developed a potentially optimized stable generative adversarial network for fault data with a small number of samples and verified that the proposed model can perform fault diagnosis through fault diagnosis experiments of bearings. These algorithms have high detection accuracy when detecting statistical anomalies, and does not need to annotate the data set in advance. But these algorithms don’t take into account the effect of time on the data.
Other common fault detection algorithms are to set a fixed threshold, once the monitored data exceeds this threshold, it will be labeled as abnormal data. Hundman et al. [13] adopted the LSTM dynamic detection algorithm, they exploited historical operating data under normal conditions to predict running data for the next period. The threshold is then set based on the mean and standard deviation of the residual. Li et al. [14] proposed an enhanced weighted voting (EWV) combination strategy with a specific class threshold to achieve selective ensemble learning. Finally, the BAS algorithm is used to adaptively select the optimal class-specific threshold. Experimental bearing data verify the effectiveness of the proposed method. Tojeiro et al. [14] proposed the implementation of a fault detection scheme for photovoltaic systems based on neural fuzzy model identification. The residuals are evaluated to determine which threshold is more favorable for robust fault detection, experiments show that this algorithm is highly detectable. Youssef et al. [16] proposed an algorithm of Kullback-Leibler divergence (KLD) analysis based on the probability distribution function. Santis et al. [17] detected abnormal points before the occurrence of hydropower station accidents by applying the isolated forest algorithm to the abnormal detection of hydropower stations. These algorithms set the threshold according to prior knowledge and can perform the fault diagnosis well.
However, this kind of algorithm relies too much on the setting of the threshold value, once the threshold is not accurate, it will inevitably affect the monitoring process and may lead to misdiagnosis. In order to solve this problem, researchers at home and abroad have begun to study dynamic indicators to judge whether the equipment fails. Chen et al. [18] proposed a threshold self-setting HCM scheme (DCGAN) based on a deep convolution generative adversarial network to define a self-setting threshold to monitor wind turbine bearings. It can automatically create the threshold model of HCM through the G network output in DCGAN, thus solving the difficult problem of threshold setting. Yang et al. [19] proposed a new signal reconstruction modeling technique based on the support vector regression model. In addition, three statistical indicators (deviation index, volatility index, and significance) are proposed to quantify the degree of deviation from normal state to abnormal state. Lin et al. [20] used the improved global empirical mode decomposition (MEEMD) scalar index to obtain the bearing state. Moreover, they used the improved health index (MHI) to test different fault modes, which overcame the shortcomings of the health index as a single fault mode classifier and deep neural networks (DNNs) as a multi-fault mode classifier.
In addition, in order to conduct real-time monitoring of equipment and effective fault warning, researchers introduced the time series model to fault diagnosis and equipment life prediction. Zhang et al. [21] proposed an adaptive method based on KF-EM-RTS to predict battery RUL, and experimental results show that the algorithm can accurately predict battery degradation. Huang et al. [22] presented a prediction method based on BILSTM. This method can integrate multiple sensors data with operational conditions data for RUL prediction of engineered systems. Zhang et al. [23] proposed a new BiGRU-TSAM network, by assigning different weights to different time sequences, this method can predict the life of equipment very well. Zhang et al. [24] established a single-cell dynamic degradation model based on UPF, and introduced the wilcoxon rank sum test to determine the capacity regeneration point, so as to reduce the prediction error, and achieved good results in the remaining life experiment of 18650 lithium-ion batteries.
Due to the excellent performance of LSTM in time sequence modeling, many anomaly detection methods based on LSTM have been proposed. Kim et al. [25] used CNN+LSTM detection to detect abnormal network data. Their experiment proves that their method achieves almost perfect anomaly detection performance for network traffic data. In order to realize fault detection of the Internet of things, Yao et al. [26] adopted the BILSTM algorithm to analyze abnormal data and finally detected abnormal data and fault types. Fernando et al. [27] proposed an LSTM+Soft+Hardwired mechanism to improve the speed and accuracy of fault detection. Bian et al. [28] applied particle swarm optimization (LSTM-Attention) to electric quantity anomaly detection. Their model uses an attention mechanism to give different weights to the hidden state of LSTM so that it can detect abnormal electric quantities more accurately. These algorithms have good sensitivity to data with sequential characteristics and are often used to predict the life of the equipment and monitor the operation status of the equipment.
Although LSTM has a strong predictive ability in time series, it also causes a problem. The appearance of abnormal data will make LSTM fit with abnormal data and deviate from the normal model track. We want the predicted data to be quite different from the abnormal data so that our detection model can produce a large residual after the occurrence of abnormal data and we can detect these abnormal data in time. In addition, most of the current fault warning methods are based on the residual to set the fault threshold but do not convert the residual into the equipment fault probability model. In order to solve all the above situations, this paper proposes the LSTM correction model based on the health index. The contribution of this paper is listed as follows: The weight mechanism is introduced into the LSTM model so that our prediction model will not be affected by abnormal data and deviate from the normal track. When abnormal data appears, this model can generate a larger residual, which makes it easier to exceed the set threshold, so as to realize the function of fault warning. Compared with other detection models, our model can identify small abnormal fluctuations in the early stages. Thus, the model can better carry out fault warning and avoid unnecessary losses. This paper converts the residual between the actual data and the predicted data into a probability model for assessing equipment fault and presents health indicators related to the running state of the equipment. By observing the changing trend of equipment health factors, maintenance personnel can know the running state of equipment.
LSTM correction model
LSTM model
Because the data of hydropower stations is collected according to time, it is more accurate to use the network with time memory for fault warning. RNN model can be used for the prediction of various time data, but the problem of vanishing gradient or gradient explosion may occur in the process of prediction. LSTM model is improved based on RNN. LSTM has a forgetting gate, input gate, and output gate, which overcomes the vanishing gradient problem [29]. Therefore, this paper chooses LSTM as the prediction model. The LSTM unit structure is illustrated in Fig. 1:

LSTM unit structure.
LSTM transmission unit can be expressed as follows:
As shown in Fig. 1 and the Equations (1)—(6), t represents the time, the subscript t represents the value of the current moment, and the subscript is the value of a moment before in the t-1. f
t
represents the forgetting gate used to determine how much information about output ht-1 and input x
t
is forgotten. The input gate i
t
indicates how much information is retained,
LSTM has a strong predictive ability in time series [30], but it also causes a problem. The appearance of abnormal data will make the LSTM model fit with the abnormal data, so that the generated residual is below the threshold line, resulting in the failure to detect these abnormal data in time. Therefore, we want that the value predicted by the improved model will always be within an acceptable range so that large residuals can be generated when abnormal data appear. By considering the time factor and correction mechanism, the improved detection model can more effectively detect the equipment and fault warning. Inspired by literature [31, 32], the process of the LSTM correction model is shown in the figurebelow:
As shown in Fig. 2, the procedure of the LSTM correction model algorithm is as follows:
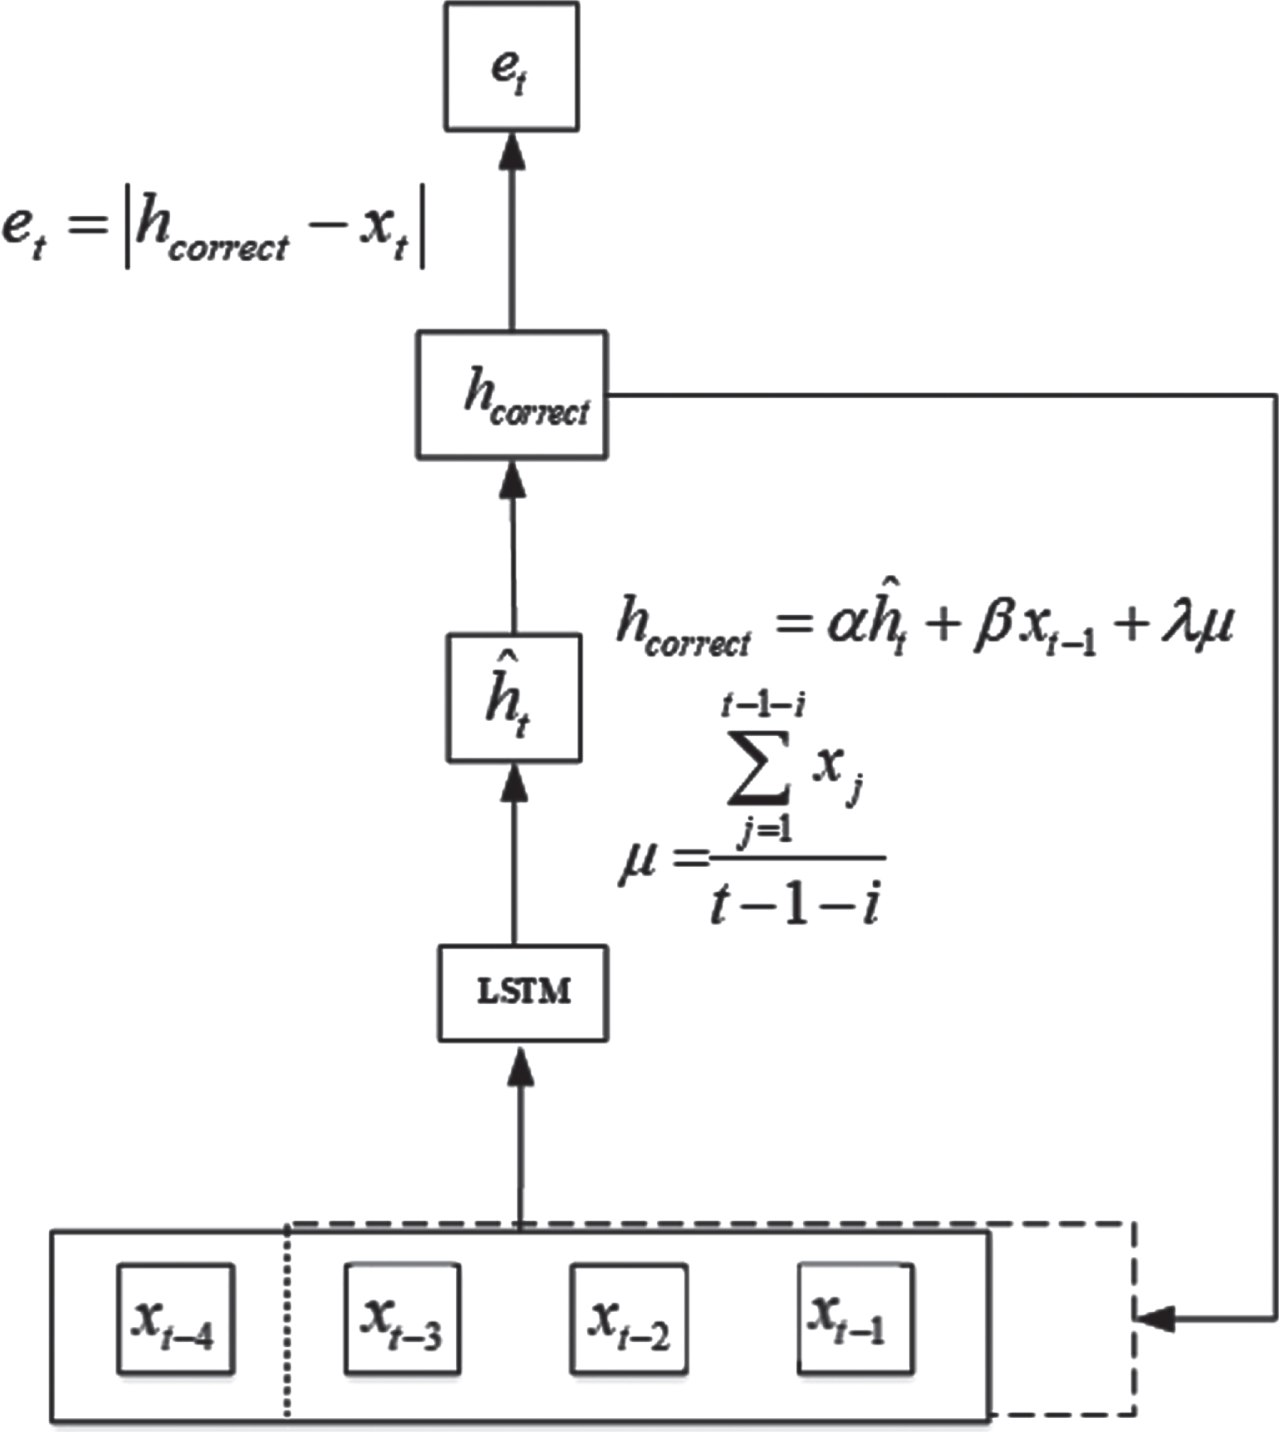
LSTM correction model.
Because the LSTM correction model is used to detect whether abnormal data exists in real-time data, we first need to train the LSTM model with the training set data, and then the trained LSTM model is weighted to form the LSTM correction model.
Step1: Divide the data of the hydroelectric generator into two parts. One part is represented as the data without fault, which is used as the training set. The other part is the data about 12 hours before the fault as a test set.
Step2: Use the data of the training set to train the model and get a well-trained LSTM model
Step3: Use the trained LSTM model to predict the test set data, and weighted correction of the predicted value according to formula (7) and formula (8). So as to ensure that when abnormal data occurs, the weighted predicted value will produce a large residual difference from the abnormal data.
Step4: Subtract the actual data from the corrected forecast data and take the absolute value to obtain the residual data.
The LSTM correction formula can be expressed as follows:
The residual is obtained by subtracting the actual data from the corrected forecast data:
The generated residuals will provide a calculation basis for subsequent health evaluation indicators.
In order to know the wear condition of equipment during operation, two indicators related to equipment health are set to evaluate the equipment condition. The flow of health indicator production is shown in Fig. 3.

Health indicator generation framework.
As shown in Fig. 3, the health indicator generation framework is as follows:
The health indicators are used to judge the probability of device failure in this paper, we extract three new statistical indexes from the residual distribution and transform them into the failure probability indexes of equipment.
Step 1: Calculate the residuals generated from the normal operation data of the equipment by Equations (9).
Step 2: Calculate the mean and standard deviation of residuals during normal operation of the device, and the mean and standard are denoted as u0 and σ0 respectively.
Step 3: Calculate the mean and standard deviation of the test set residuals, and denoted as u1 and σ1 respectively.
Step 4: According to the literature [33], if a potential fault occurs, the running data of the equipment may deviate from the normal track. In order to represent the deviation of data from water, we define the deviation index (DI), and the formula of the deviation index is as follows:
When a fault is about to occur, the device data usually increases. In order to judge whether the increase in data is accidental or caused by faults, we define the kurtosis index (KI). The formula of the kurtosis index is as follows:
Step5: Use the corresponding formula to calculate the probability value of equipment fault.
PDI is the probability of DI. Since the distribution of deviation index (DI) follows the probability distribution, the cumulative distribution function is selected to calculate the probability of deviation index. The calculation formula is as follows:
Where Φ (x) is the cumulative distribution function of the standard normal distribution, and α is the ratio parameter set by the user, it represents in this formula the scaling factor which can be regarded as the significance index.
PKI is the probability of the Kurtosis index (KI) using the tanh function. The tanh function is selected as the activation function of the significance index because when the input of this function is larger than a certain value, its increase becomes slower and eventually approaches 1. Therefore, when the PKI increases significantly, we can conclude that the equipment is or will be in a state of fault. The formula is as follows:
In this formula, β represents the specific factor set by the user, which is used to help the user discover the abnormal situation of the device earlier.
The health index (HI) can measure the health status of a device in real time. It takes into account both PDI and PKI indicators. The smaller the HI index is, the healthier the device becomes. Health indicators are defined as follows:
To sum up, the LSTM correction model based on the health index framework of this paper is shown in Fig. 4, including two steps:
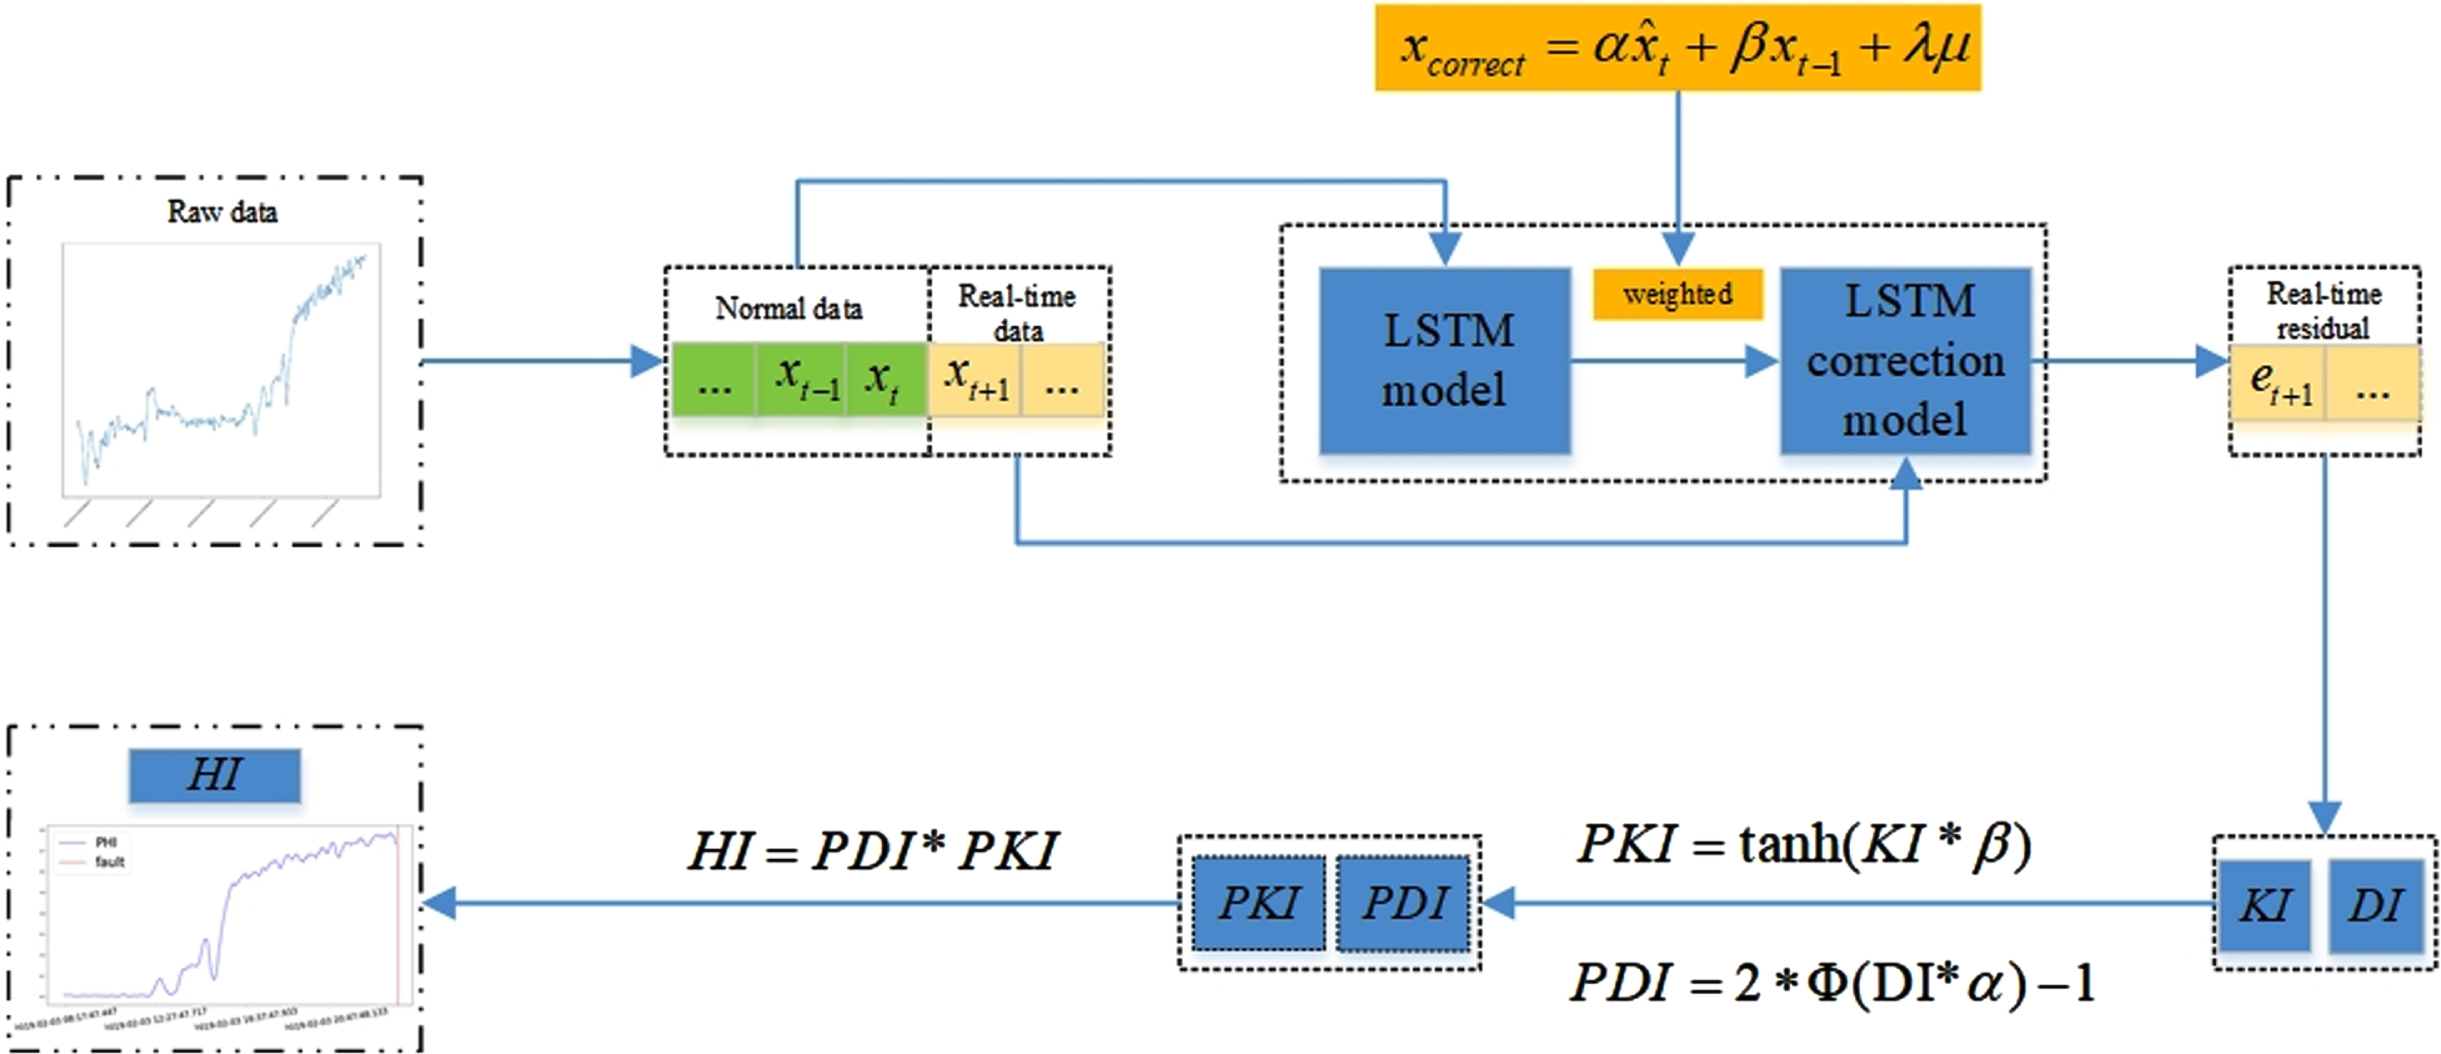
LSTM correction model based on the health index framework.
Step 1: Establish the LSTM correction model.
Step 2: Use generated residual to establish the health indicators.
The LSTM correction model based on the health index proposed in this paper is verified by real-time monitoring data from a small hydropower station in southern Brazil. The plant has an installed capacity of 22.6 MW and provides energy for the local population. The main single Hydro-generator unit records data every five minutes. The detection equipment monitors a total of six parts. These are: generator apparent power, bearing hydraulic lubrication unit (HLU) inflow, and different positions of the four bearings vibration: axial, vertical radial, horizontal radial, and coupled.
In this experiment, the monitoring variable of generator apparent power is selected as the research object. The research time is selected from mid-January 2019, early February 2019, and early April 2019 respectively. During these periods, the apparent power data is shown in the following figures:
Data standardization
In order to facilitate the calculation of the model, we normalized the normal operating data to [0, 1], and processed the data of the test set in the sameway.
Where x is an original value, x train is the normalized value for training.
This chapter selects the normal data 1—3 days before the fault as the training set, and the data on the day when the fault occurs as the test set. We use the LSTM model and the LSTM correction model respectively to detect the above data, to see which model can realize the fault warning as soon as possible.
In order to compare the detection effect of the LSTM model and LSTM correction model, the 3-Sigma threshold is used for both model thresholds.
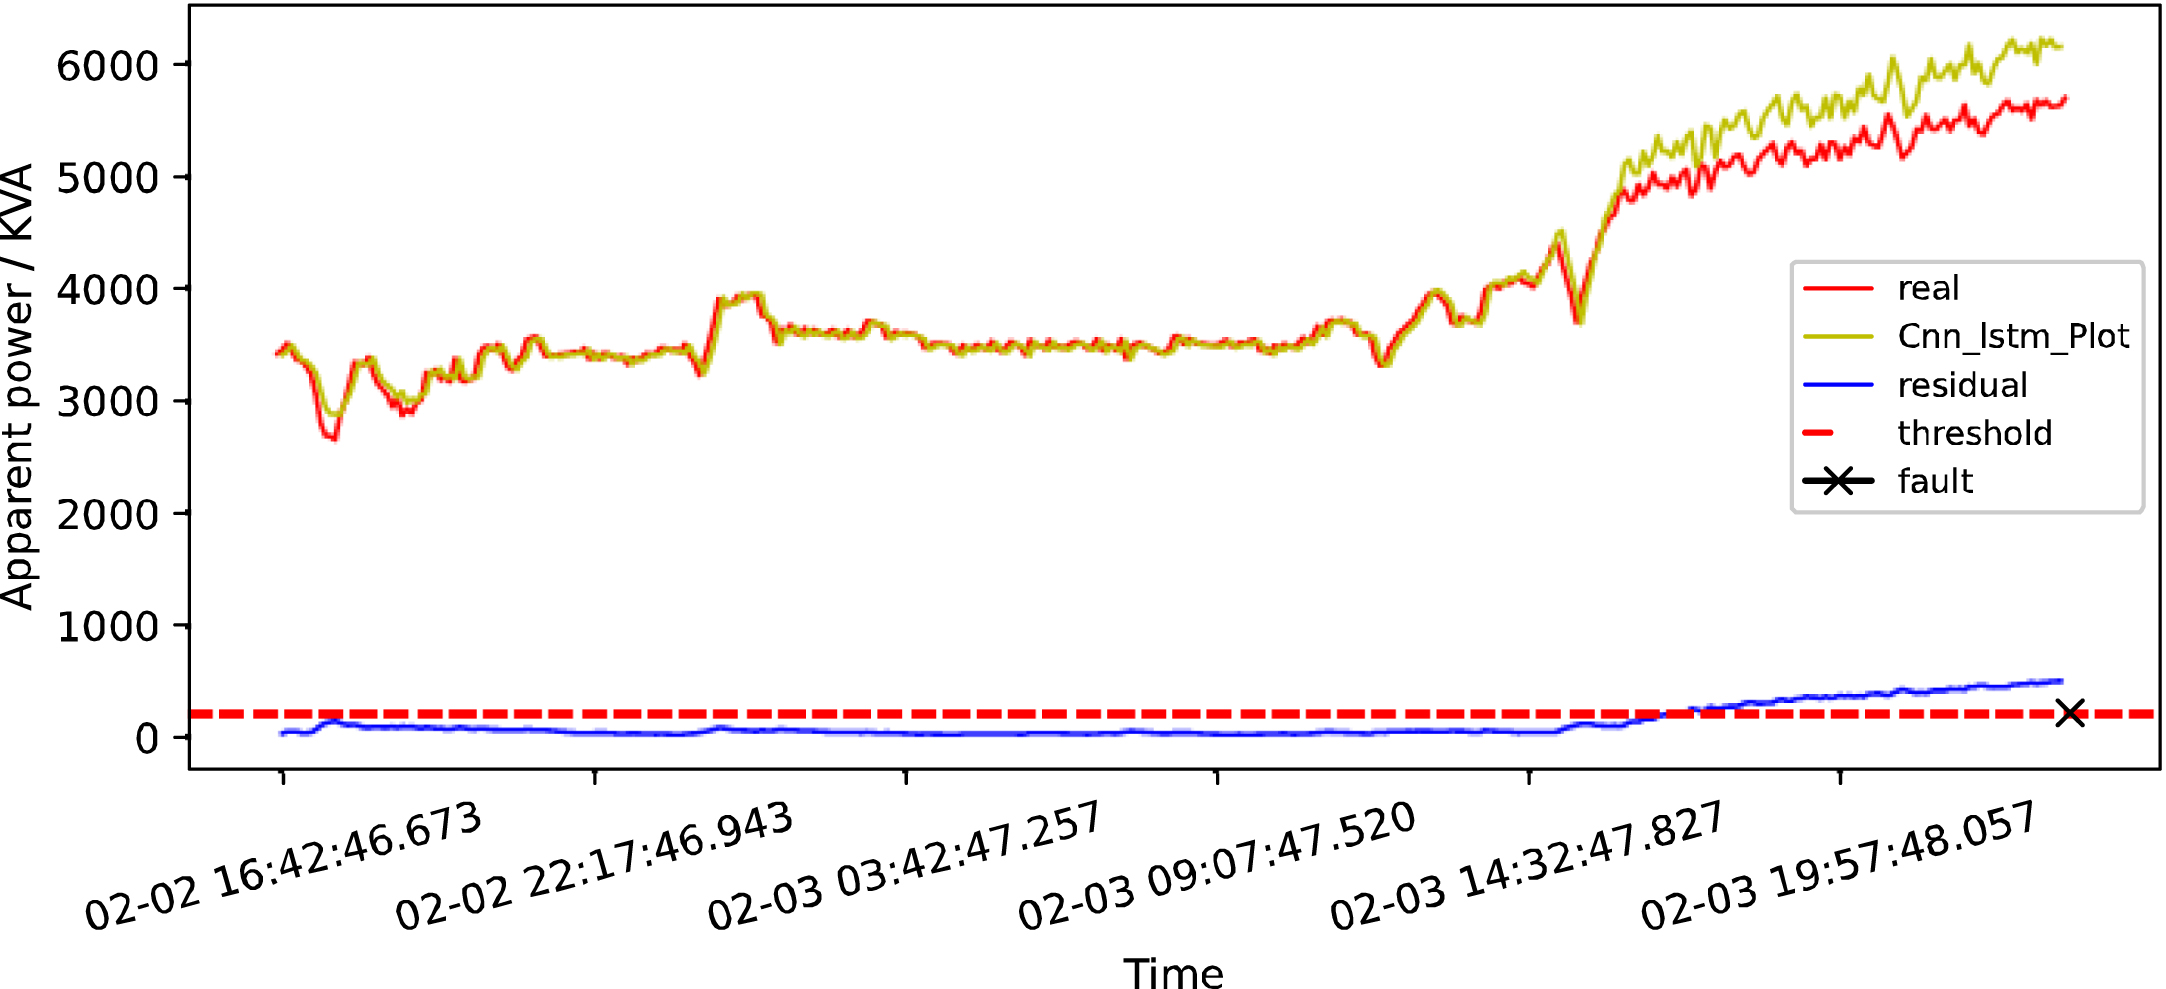
As shown in Fig. 6, this paper uses the LSTM model to detect whether the data of apparent power in mid-January 2019 has abnormal data. The green line represents the data predicted by the LSTM model, the red line represents the training set and test set data, and the blue line represents the residual, which in this paper represents the difference between the predicted data and the training set data, as well as the difference between the red and green lines in the figure. The black cross indicates the time when the fault occurs, and the red dashed line represents the threshold in this article. In the figure, the abscissa represents the time and the ordinate represents the data of apparent power.

Apparent power monitoring char.
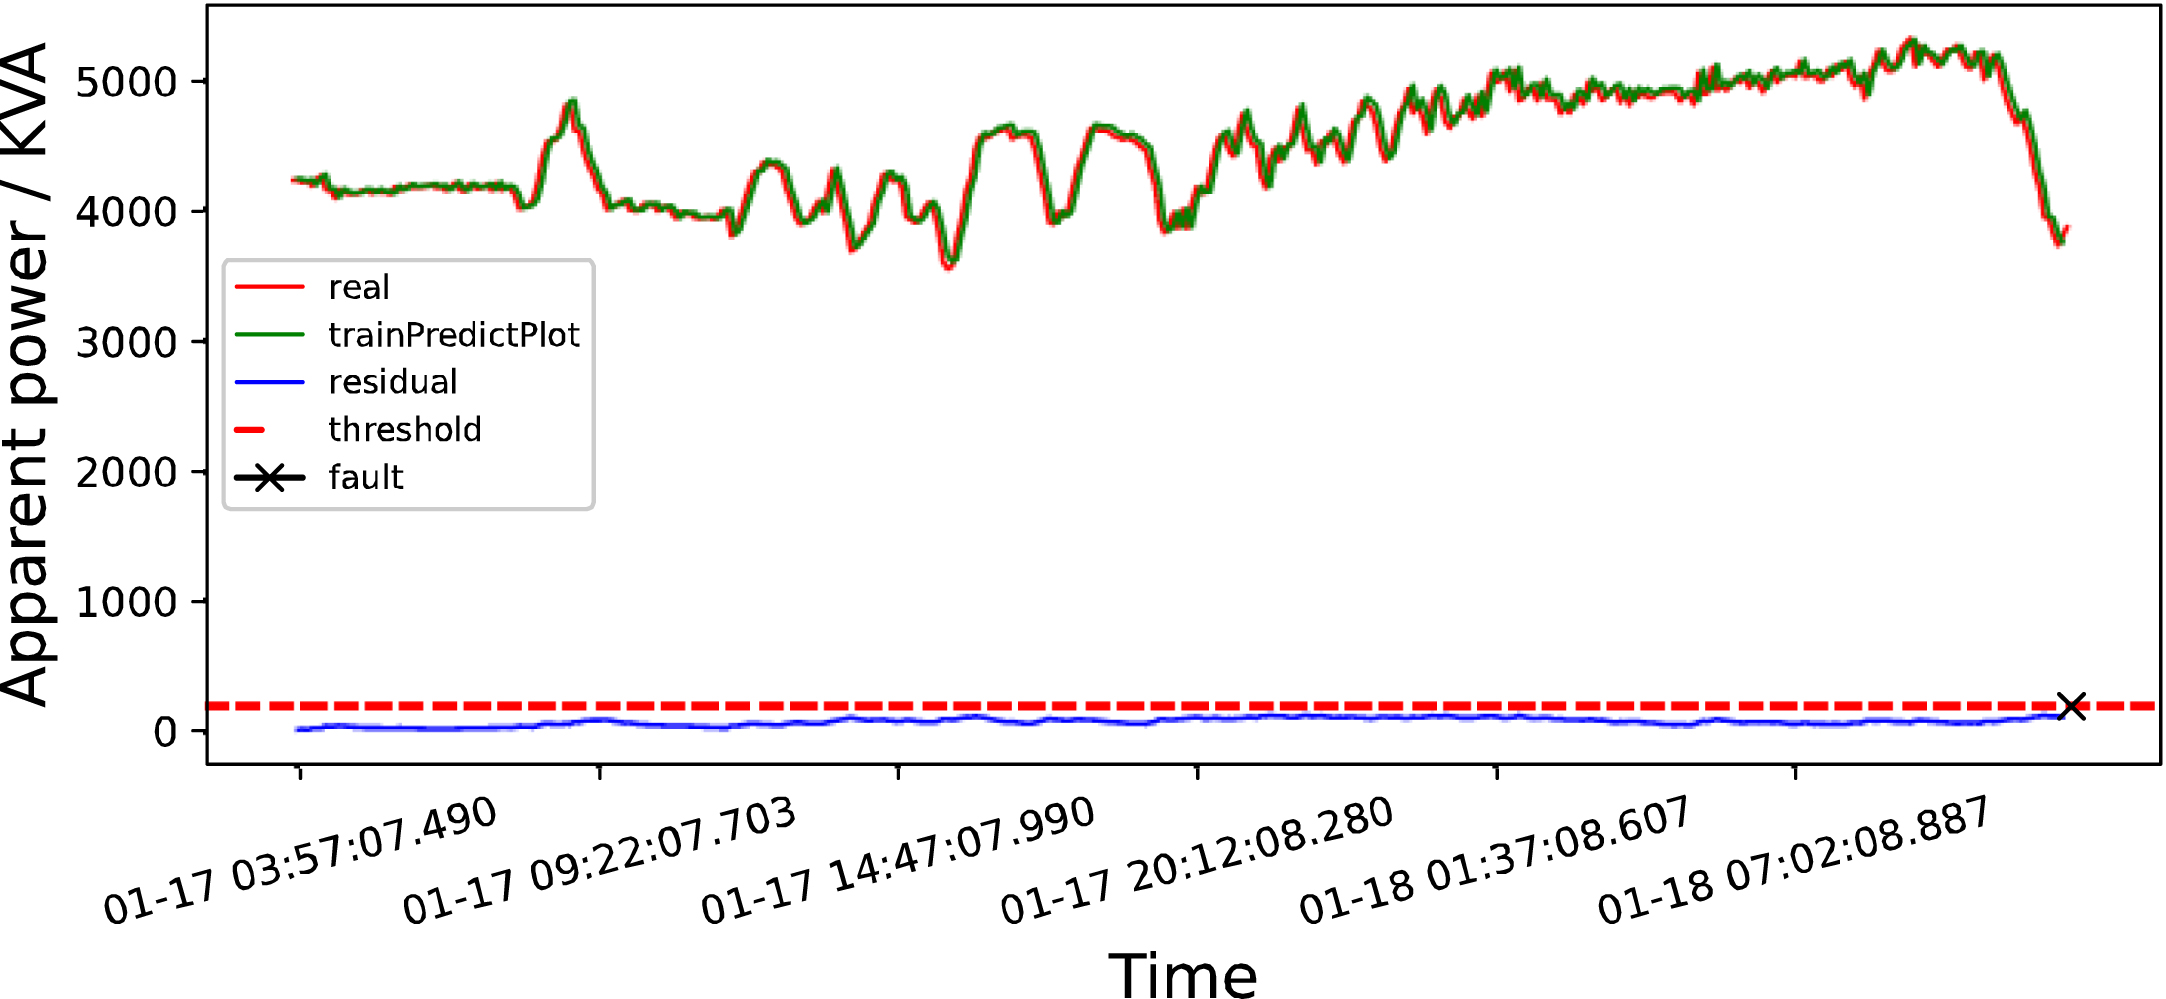
LSTM detection map in mid-January 2019.
In Fig. 7, the LSTM model is first trained by using the data of the training set and ensure that the precision and accuracy of the LSTM model are within the acceptable range. Secondly, this paper uses the trained LSTM model to predict the data of the training set and uses the green line to indicate the predicted value. Then the trained LSTM model is weighted to obtain the LSTM correction model. Finally, the LSTM correction model is used to predict the test set data, and the predicted value of the test set is represented by the light blue line.
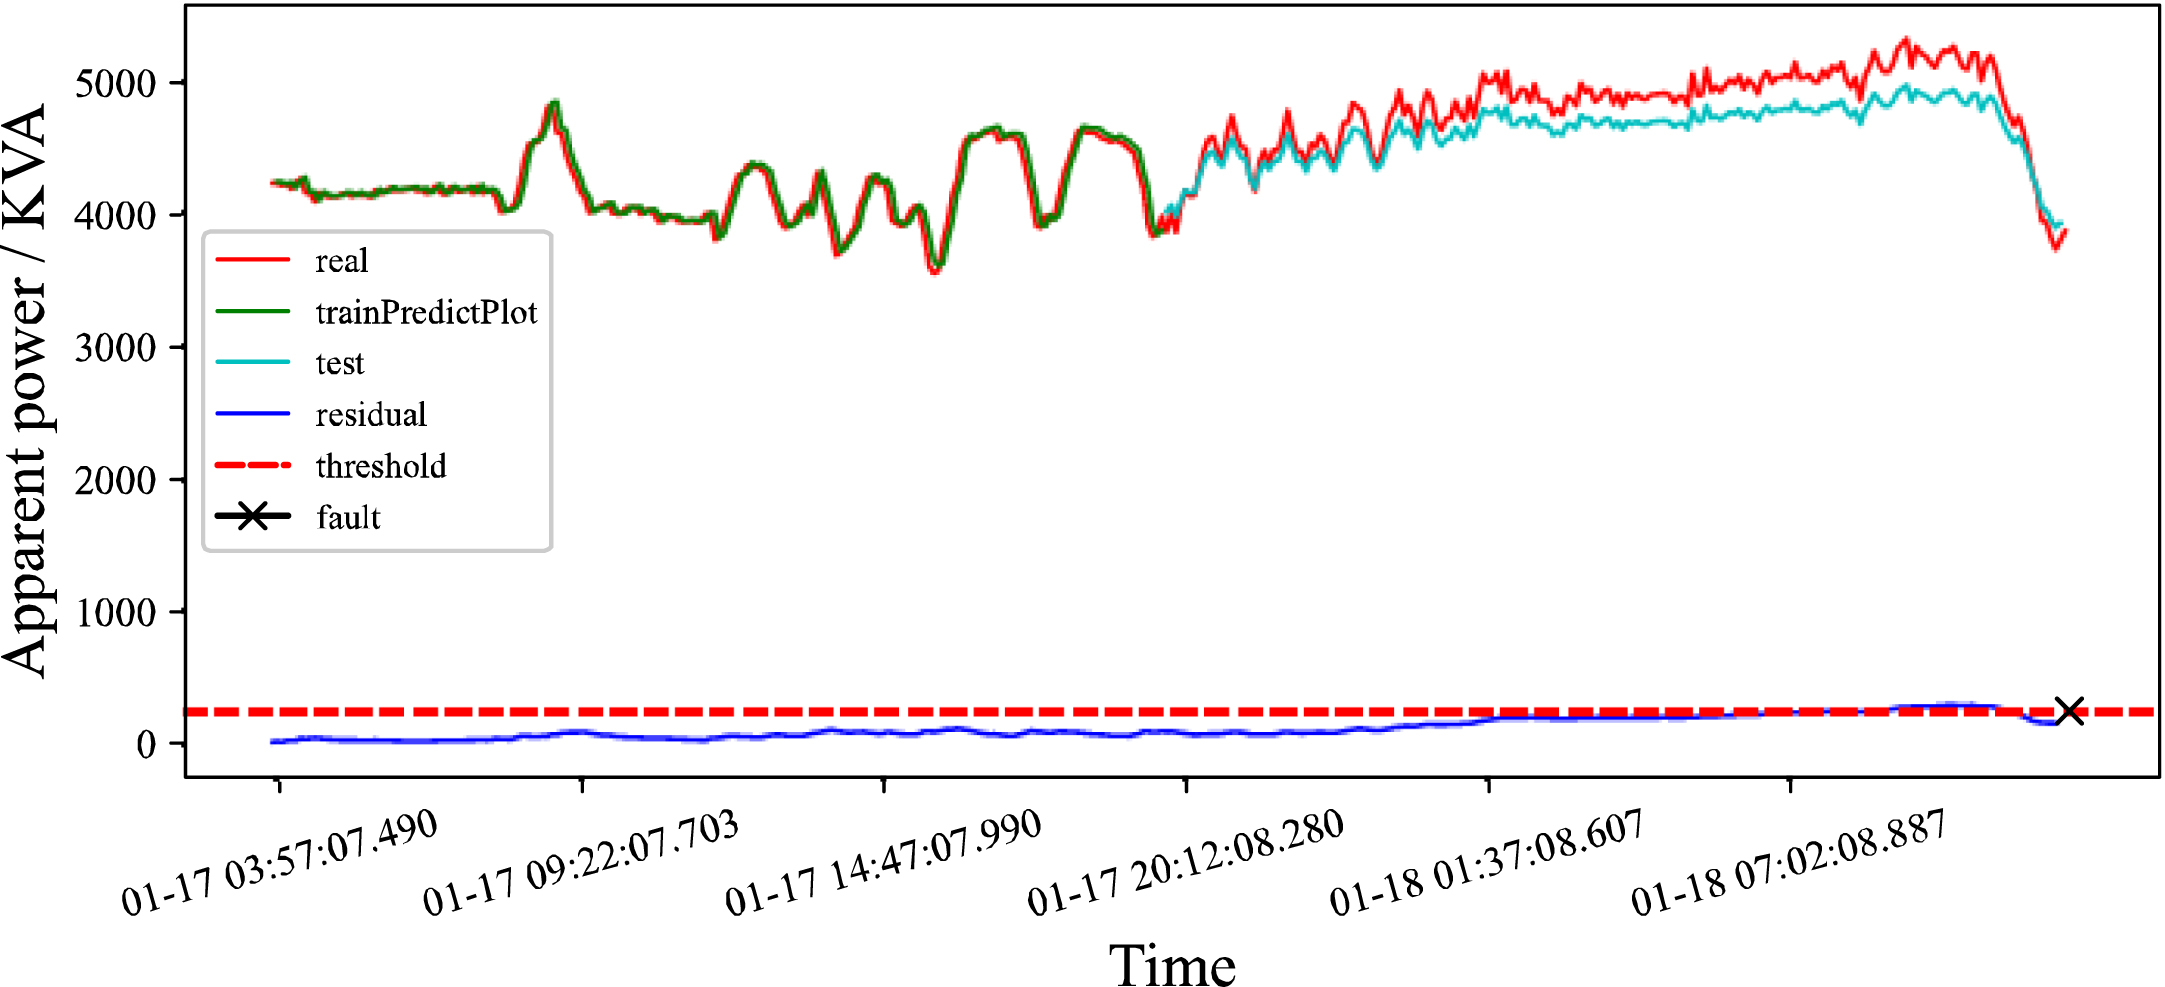
LSTM correction model detection in mid-January 2019.
The LSTM and LSTM correction models are used to train the data of apparent power in early February 2019. The detection results are shown in Figs. 8 and 9 respectively.
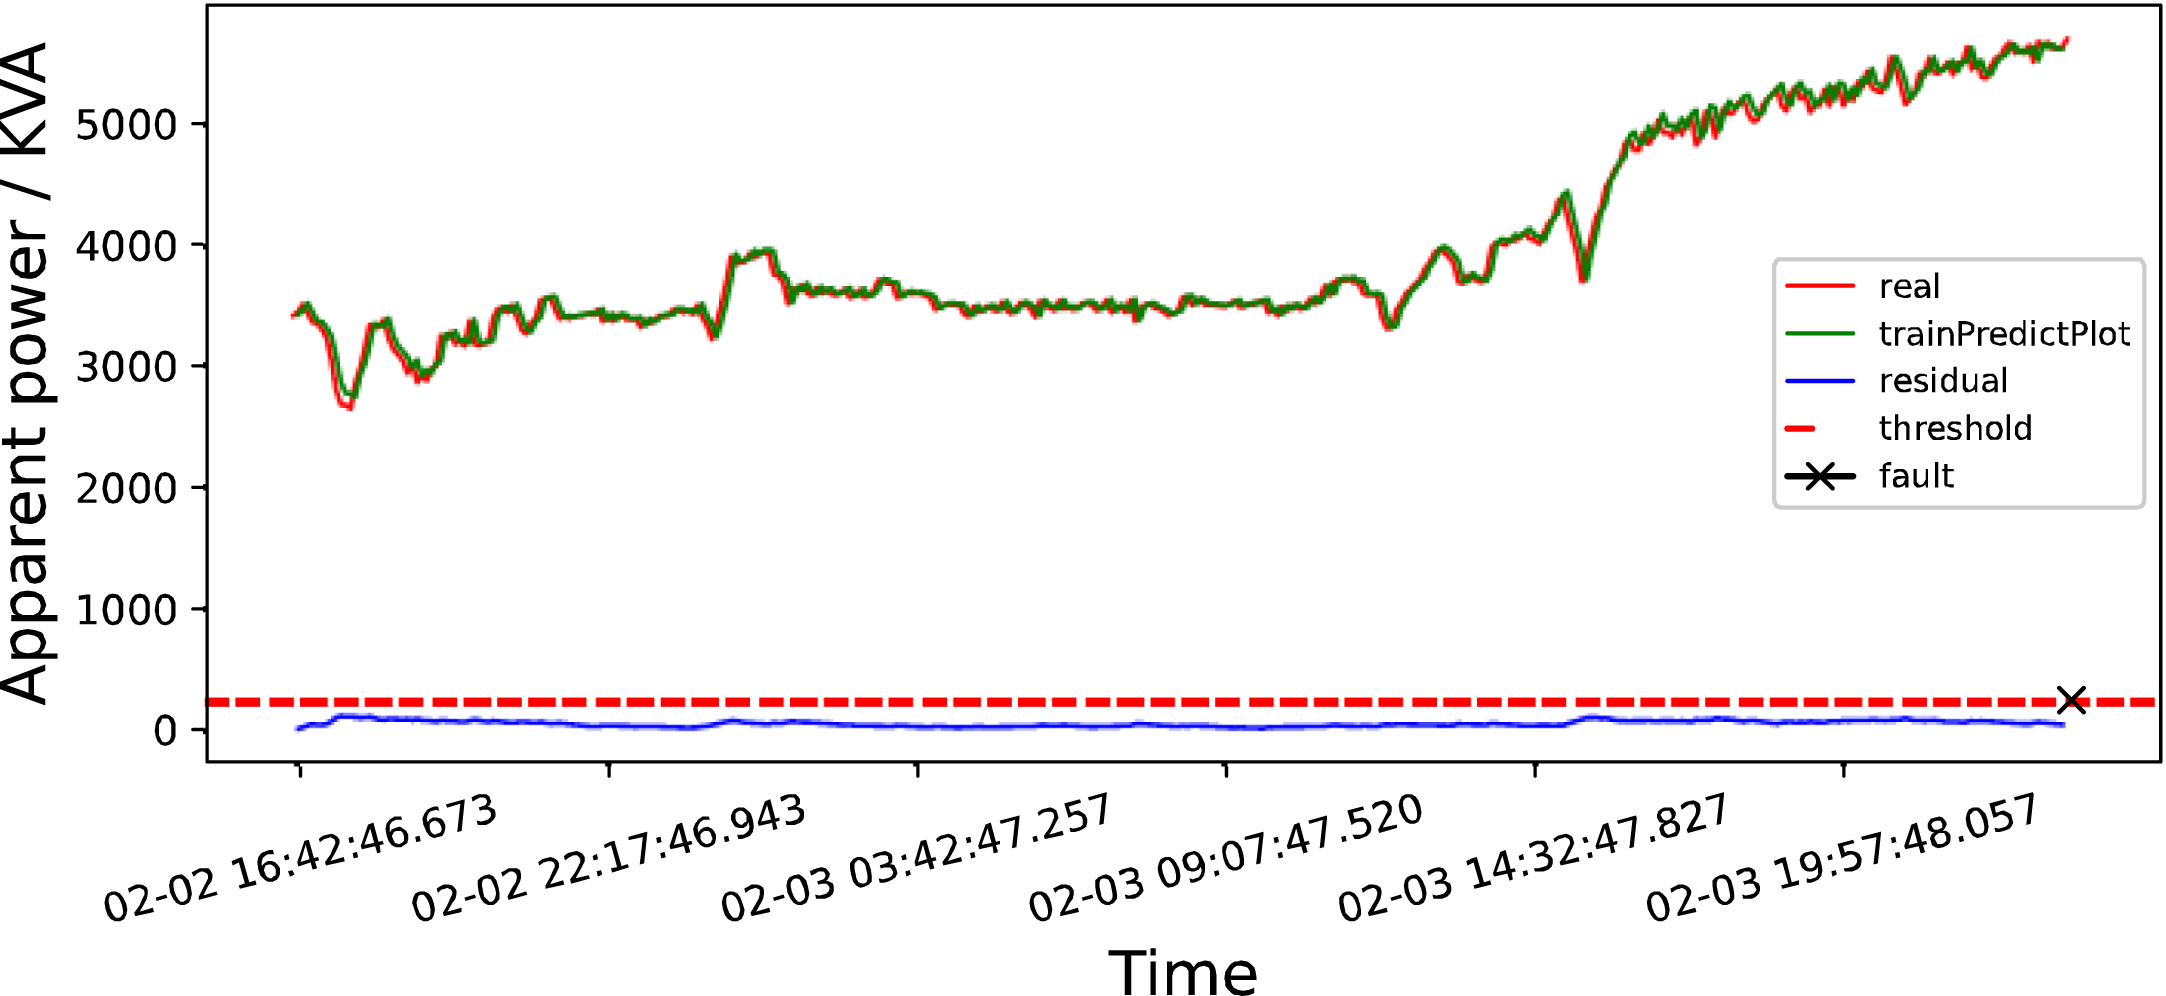
LSTM detection map in early February 2019.
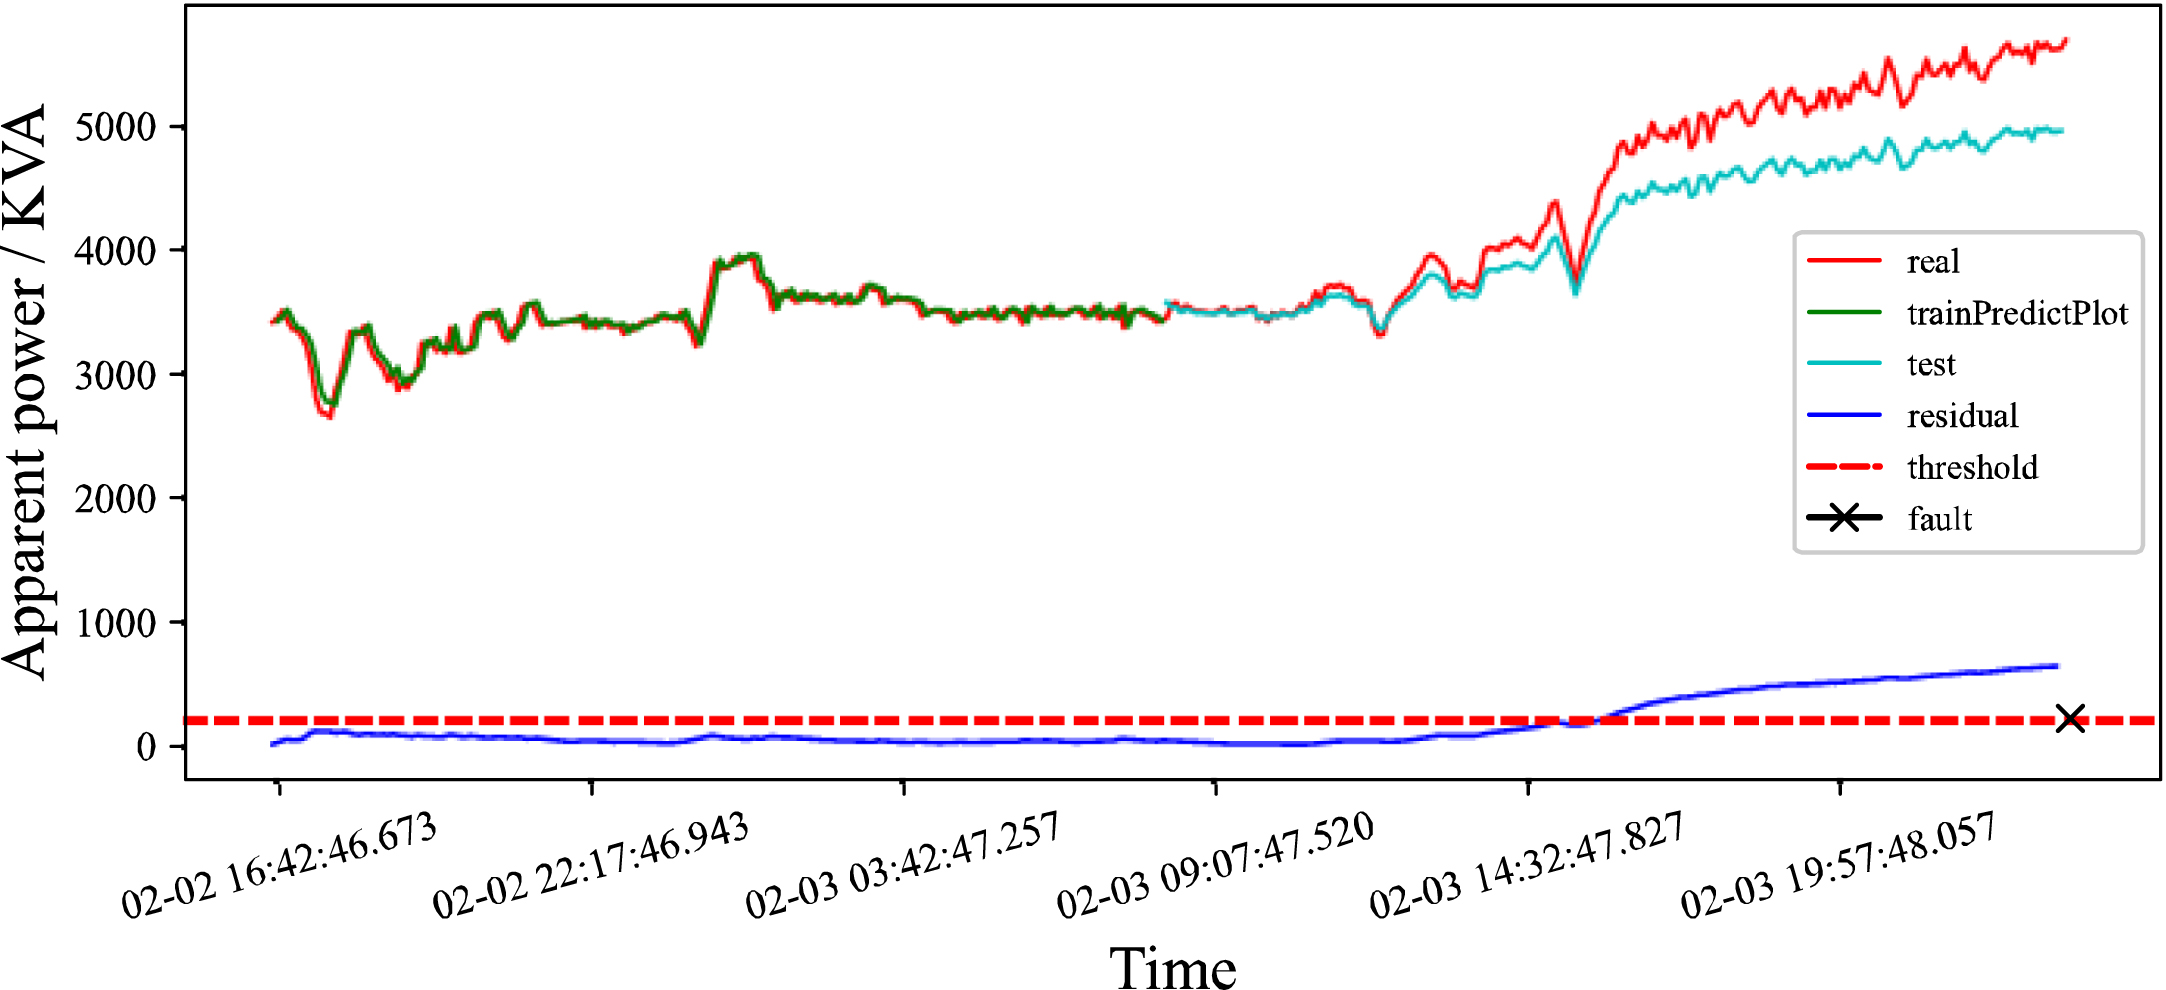
LSTM correction model detection in early February 2019.
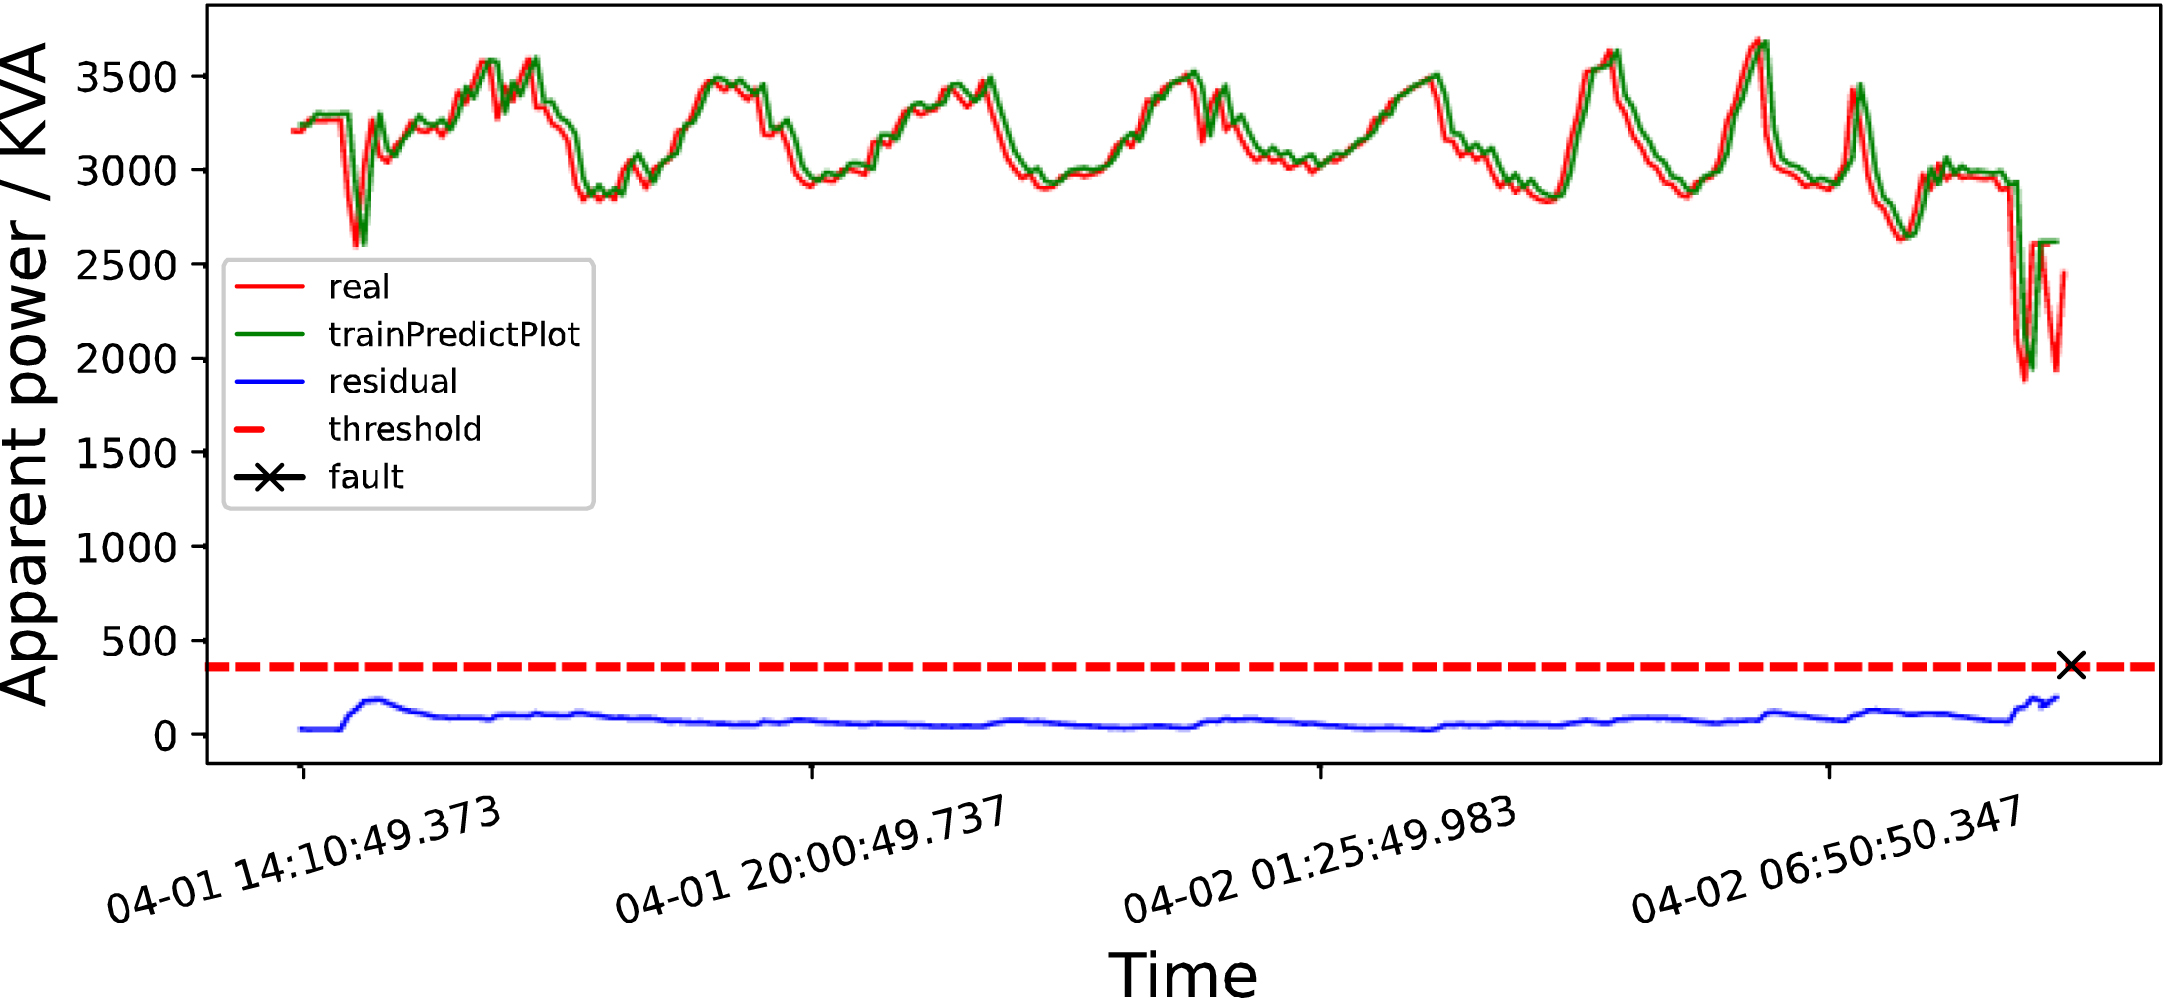
The LSTM and LSTM correction models are used to train the data of apparent power in early April 2019. The detection results are shown in Figs. 10 and 11 respectively.
LSTM detection map in early April 2019.
According to the monitoring data of the hydropower station, the power station failed separately at 12 : 08 : 47 on January 18, 2019, 23 : 57 : 53 on February 3, 2019, and 09 : 06 : 14 on April 4, 2019.
According to the data from mid-January and early February 2019, it can be found that the LSTM model will follow the abnormal data to fit, and cannot give a timely warning of faults. However, the LSTM correction model can detect that the residual tends to increase before the fault occurs, and the residual exceeds the threshold in a period of time before the fault occurs. The improved model will help maintenance personnel to warn in time and avoid greater losses.
According to the data in early April 2019, when the data is less volatile, both LSTM and LSTM correction models do not give early warning before faults, which may be related to the small weight setting of our LSTM correction model. However, with help of the health indicators below, we can give timely warning before faults according to the fluctuations of health indicators.
The above cases prove that the LSTM correction model can overcome the insensitivity of the traditional LSTM detection model. In the early stages of the fault, it can detect small abnormal changes in the data.
In this section, we use the LSTM correction model to obtain the residual of the equipment fault day in January 2019, the residual of the equipment fault day in February 2019, and the residual of the equipment fault day in April 2019 respectively. These residuals also represent the residuals of the test sets in Figs. 7, 9, and 11 in the 4.2 section, which are plotted separately in this section as follows:

LSTM correction model detection in early April 2019.
This paper uses Equations (10)—(14) to process the residual data mentioned above and obtain the health indicators of the equipment, the results are plotted in the following figures. Where the abscissa represents the time and the ordinate represents the probability of equipment fault.
The PDI, PKI, and HI indices are applied to the residual data, the threshold is set based on a confidence interval of 0. 99 for data without failure, and the HI index threshold is taken as 0.5. And the results are shown in the figures below:
The PDI index is sensitive to data deviation, so it can well reflect the fluctuation of data. According to analyze the PDI in Fig. 13(a), we can discover that at 0 o ’clock on the 18th, the index increased greatly, and the possibility of fault exceeds 0.5.
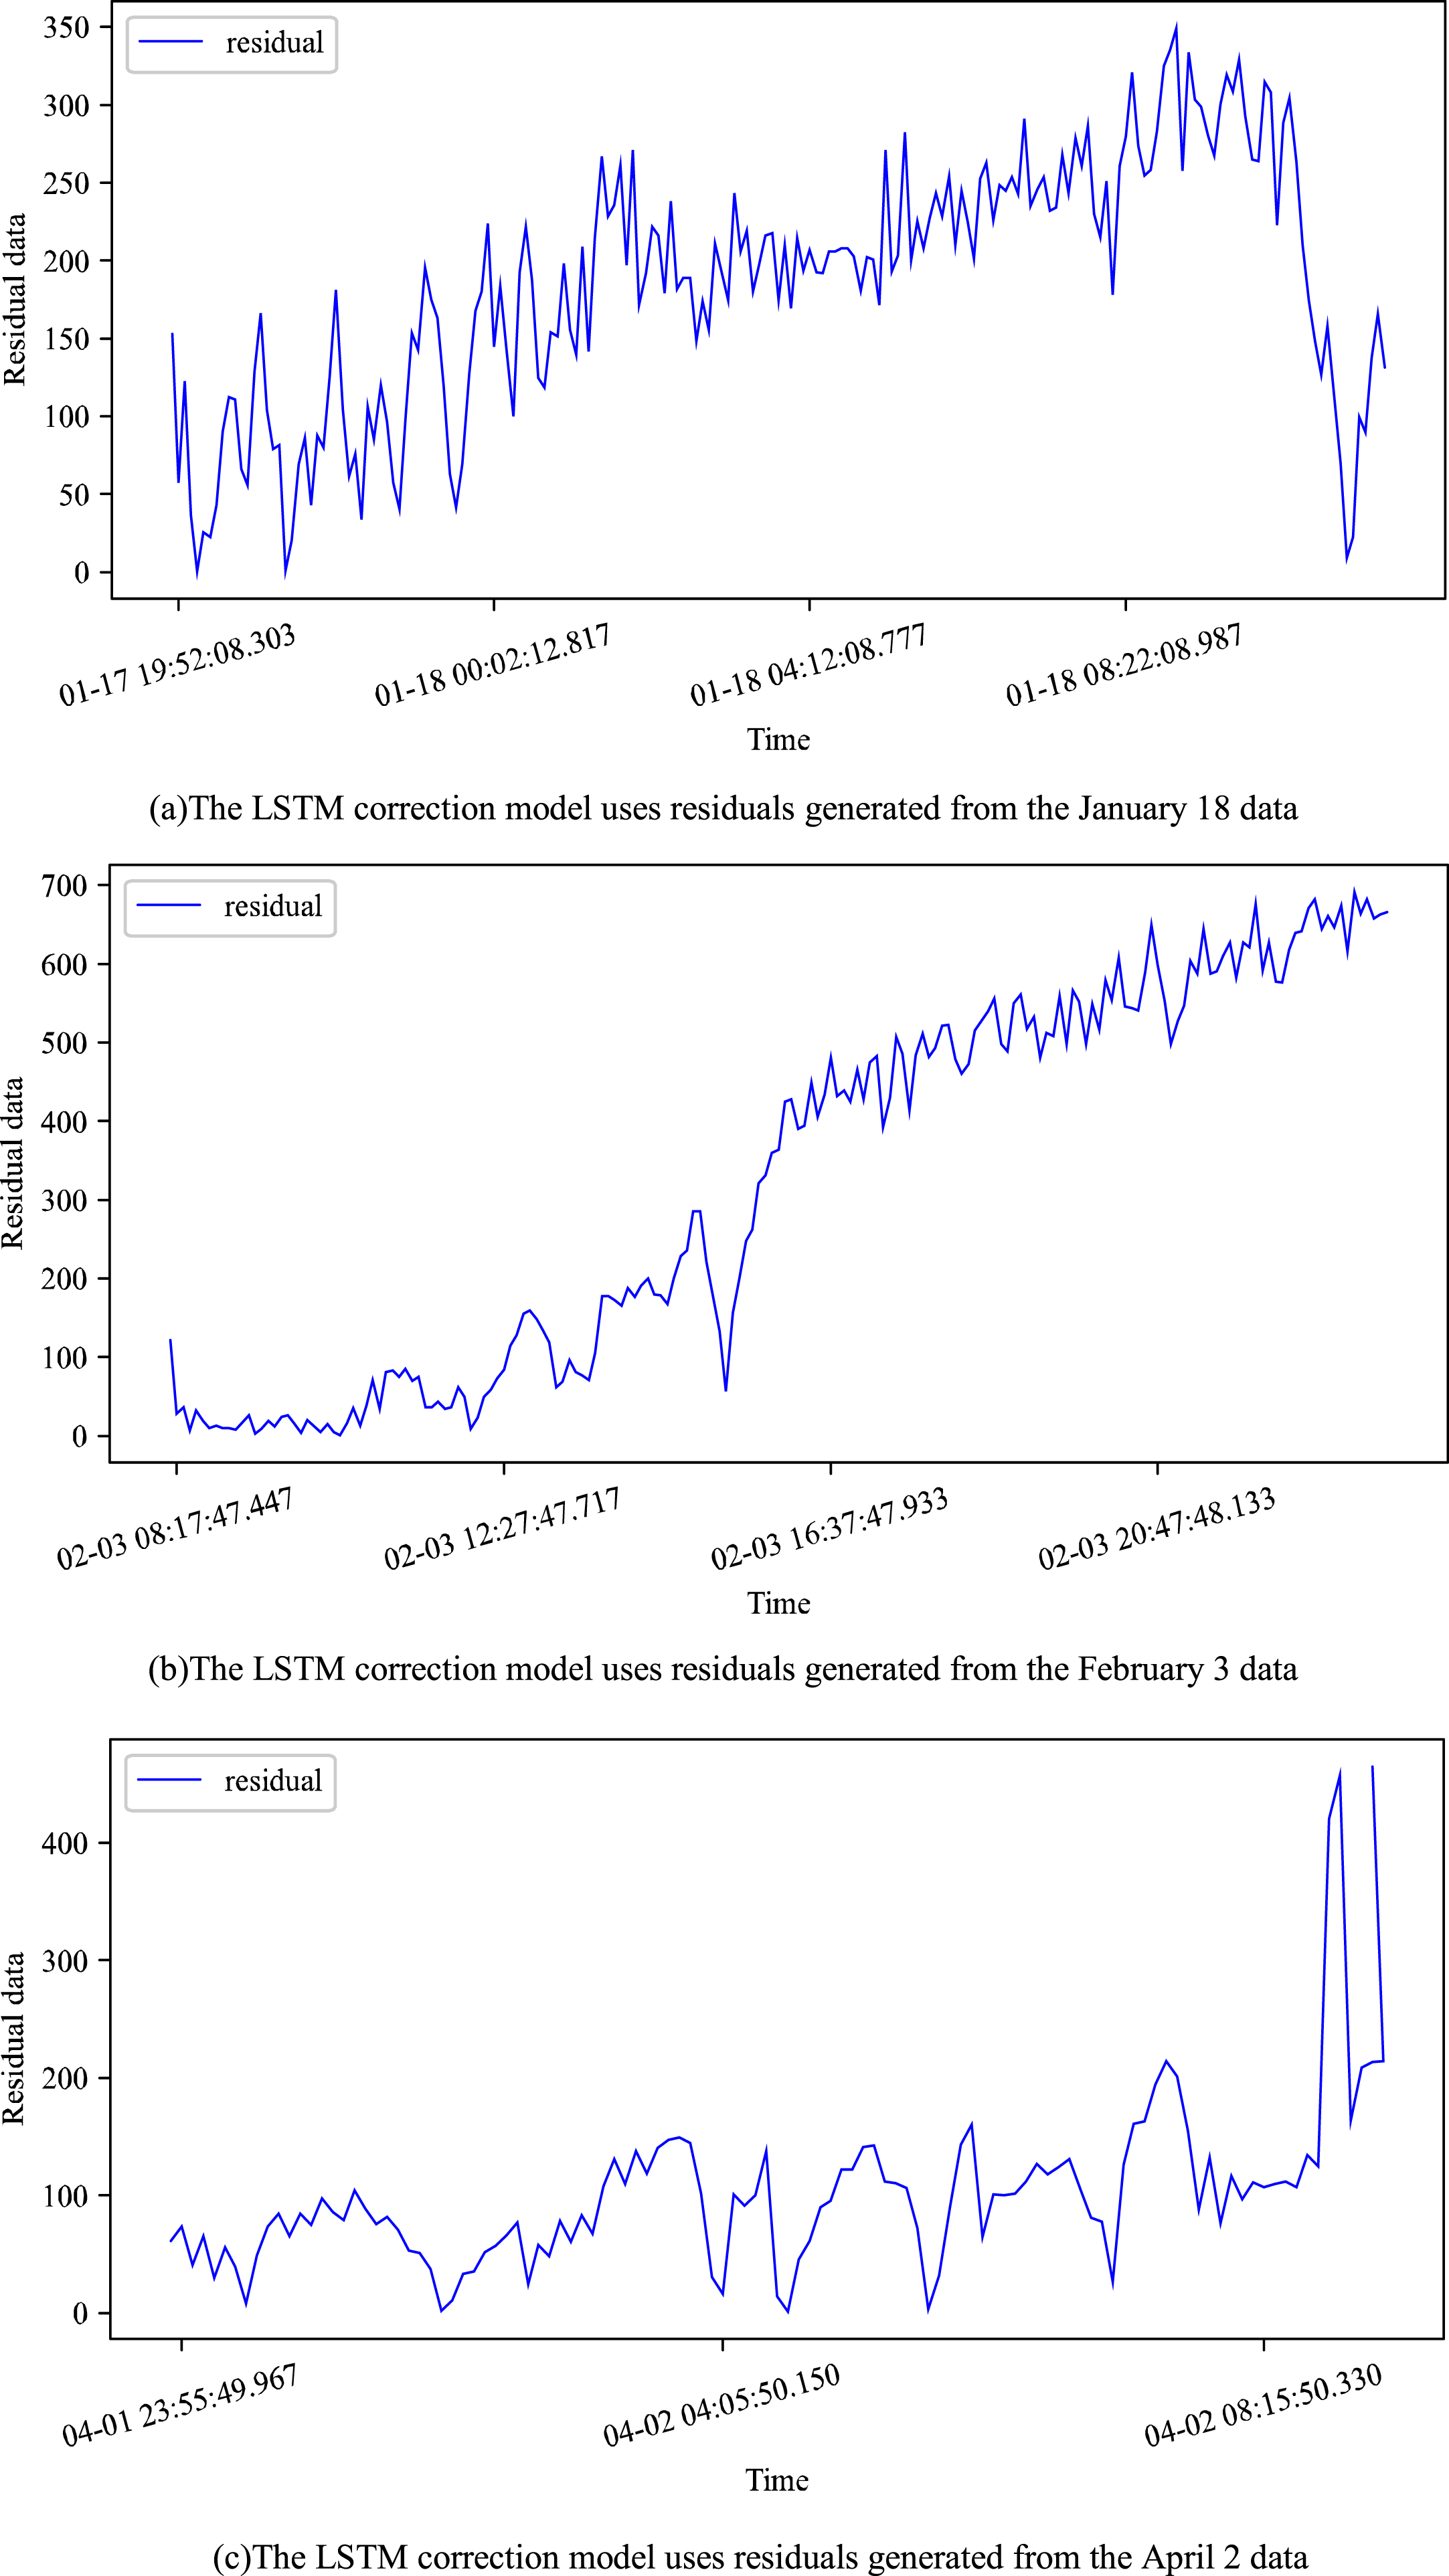
Prediction residuals of apparent power monitoring using LSTM correction model.
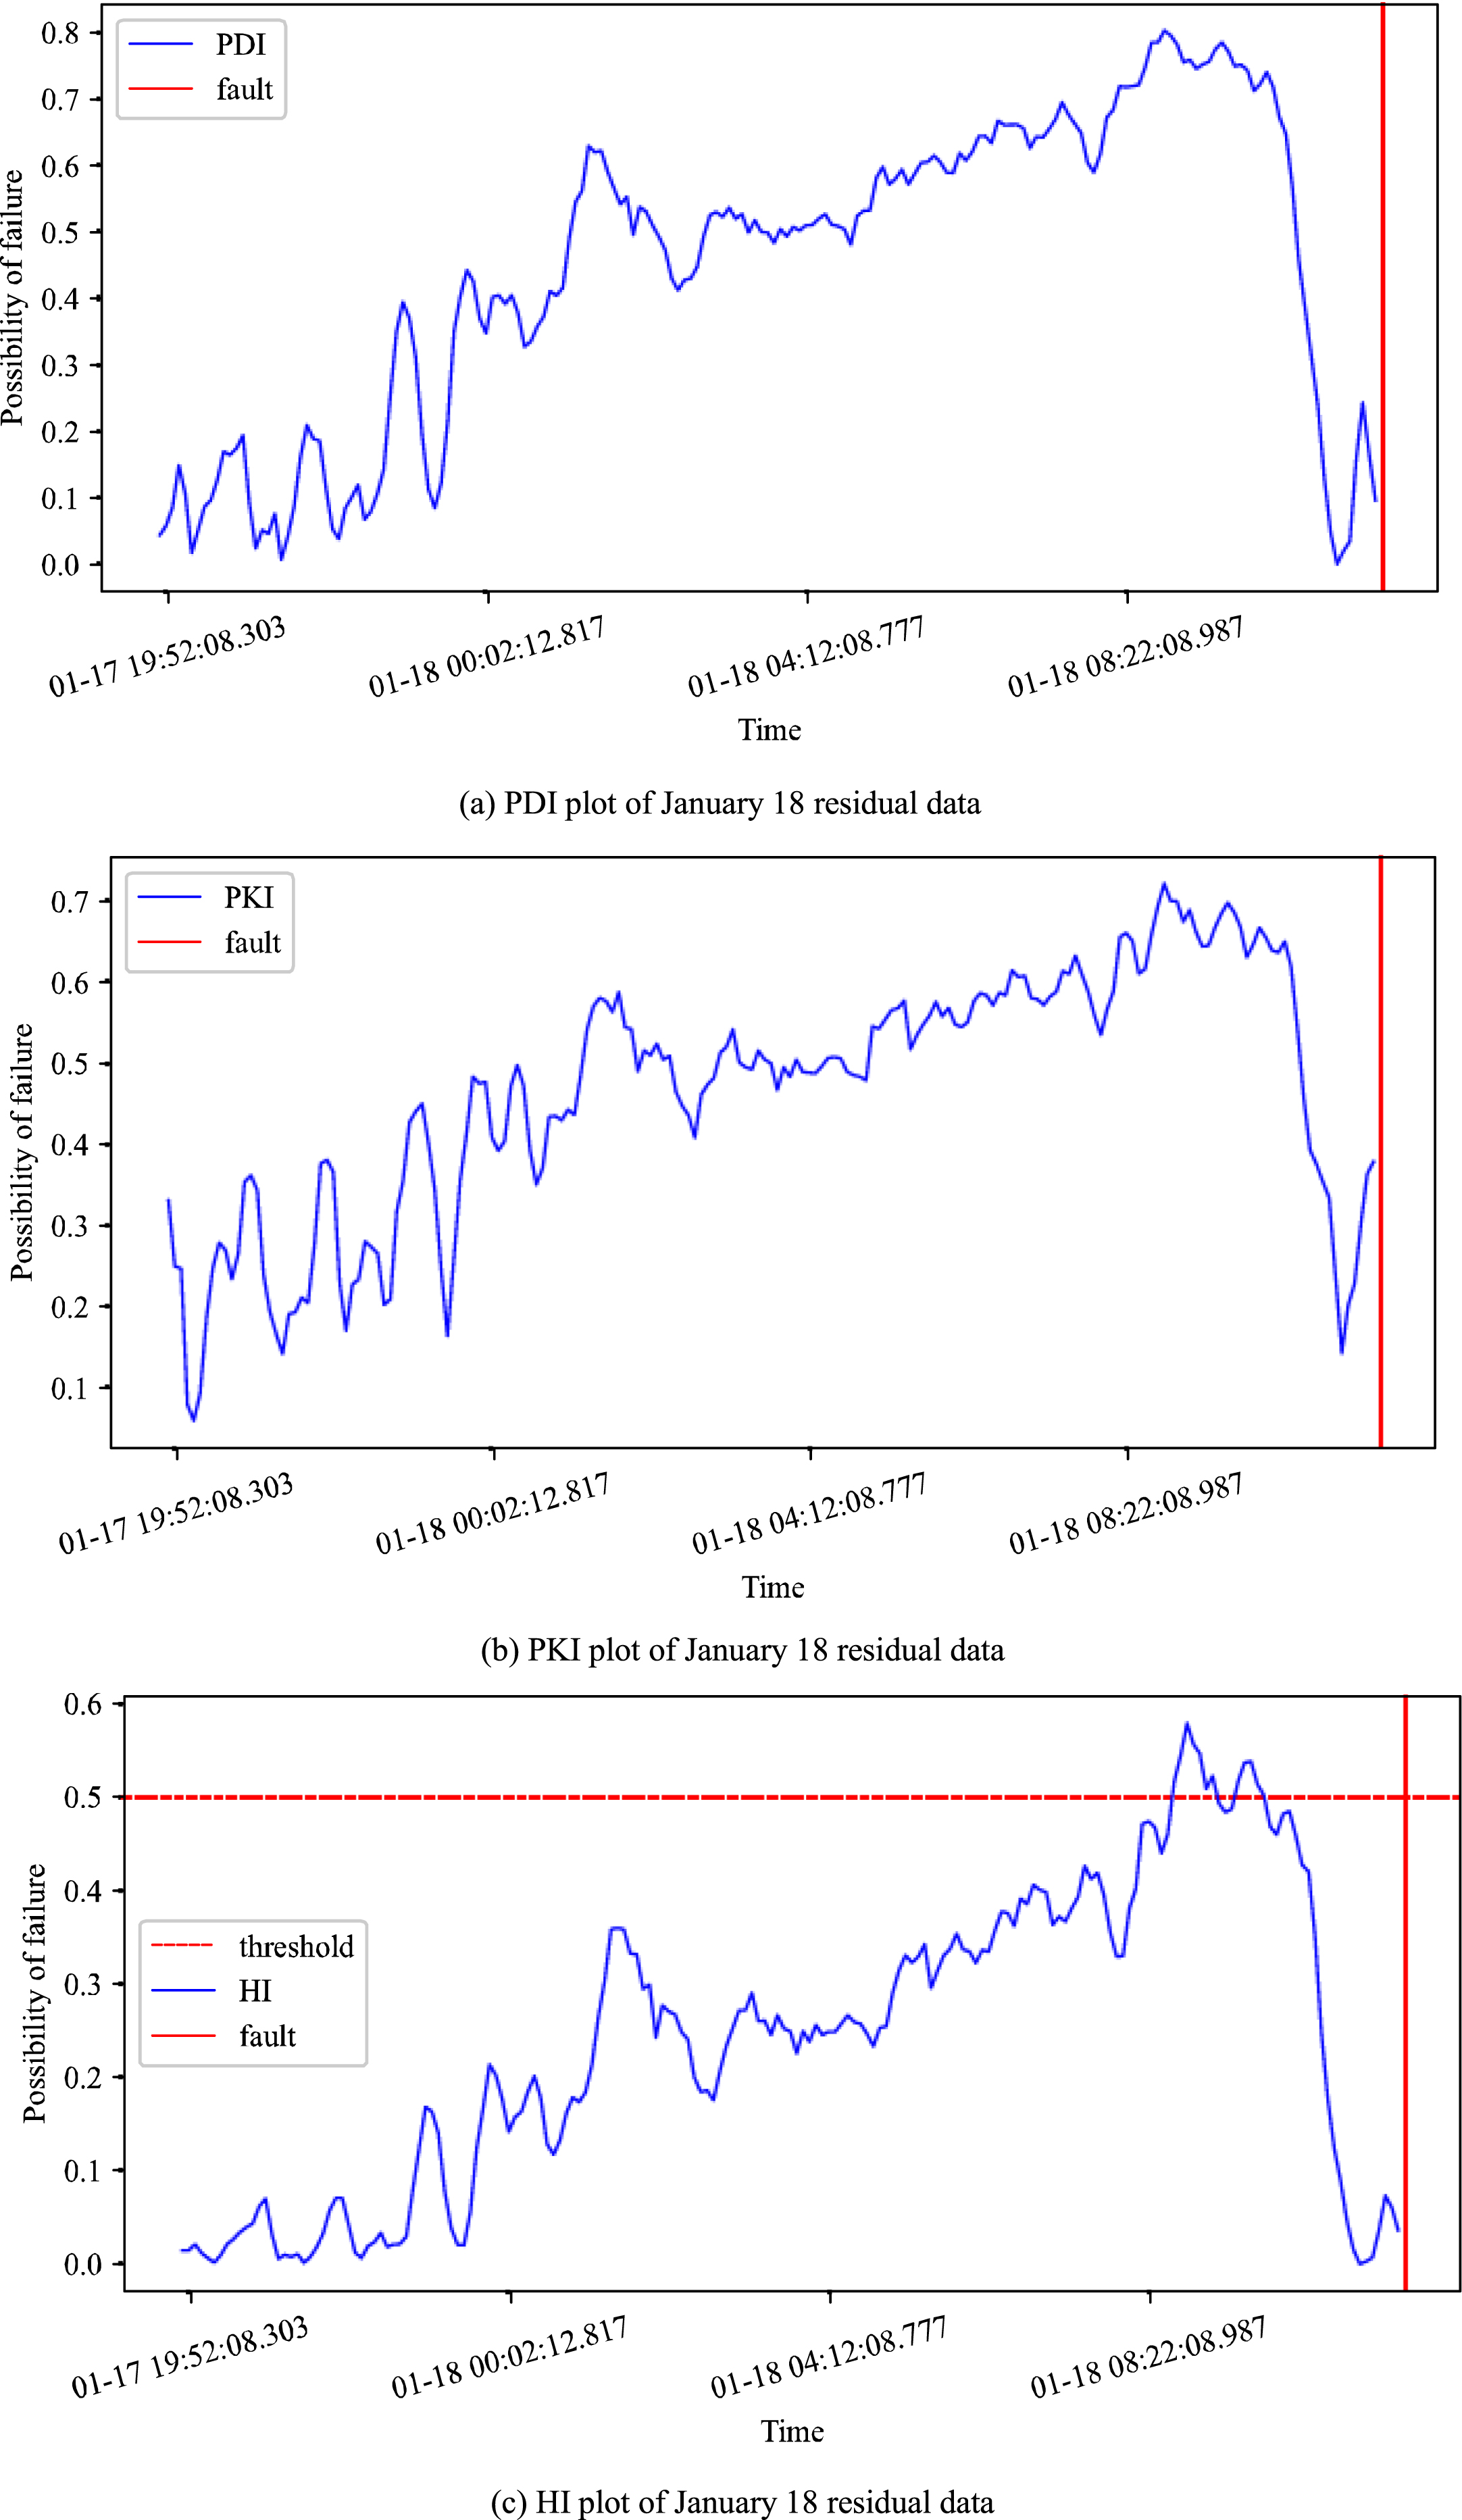
Indicator chart of January 18 residual data.
The PKI can avoid data offset caused by some noise, so analyzing PKI can avoid the possibility of false positives. Based on the analysis of the PKI in Fig. 13(b), it can also be found that the possibility of fault exceeds 0.5 at about 1 o ’clock on the18th.
The HI index combined with the characteristics of the above index, it can accurately estimate the probability of equipment fault. This index in Fig. 13(c) exceeds 0.5 at 08 : 37 on the 18th, and it can give a warning four hours before the equipment fault occurs. If effective interference is carried out on the equipment at this time, the fault can beavoided.
The PDI, PKI, and HI indices are applied to the residual data from early February 2019, the results are shown in the figures below:
By analyzing Fig. 14, we can know the equipment fault occurred at 23.52 on February 3, while the HI index began to increase continuously around 14 : 30 and exceeded 0.5 around 15 : 45, allowing for an early warning 11 hours before the fault.

Indicator chart of February 3 residual data.
The PDI, PKI, and HI indices are applied to the residual data from early April 2019, and the results are shown in the figures below:
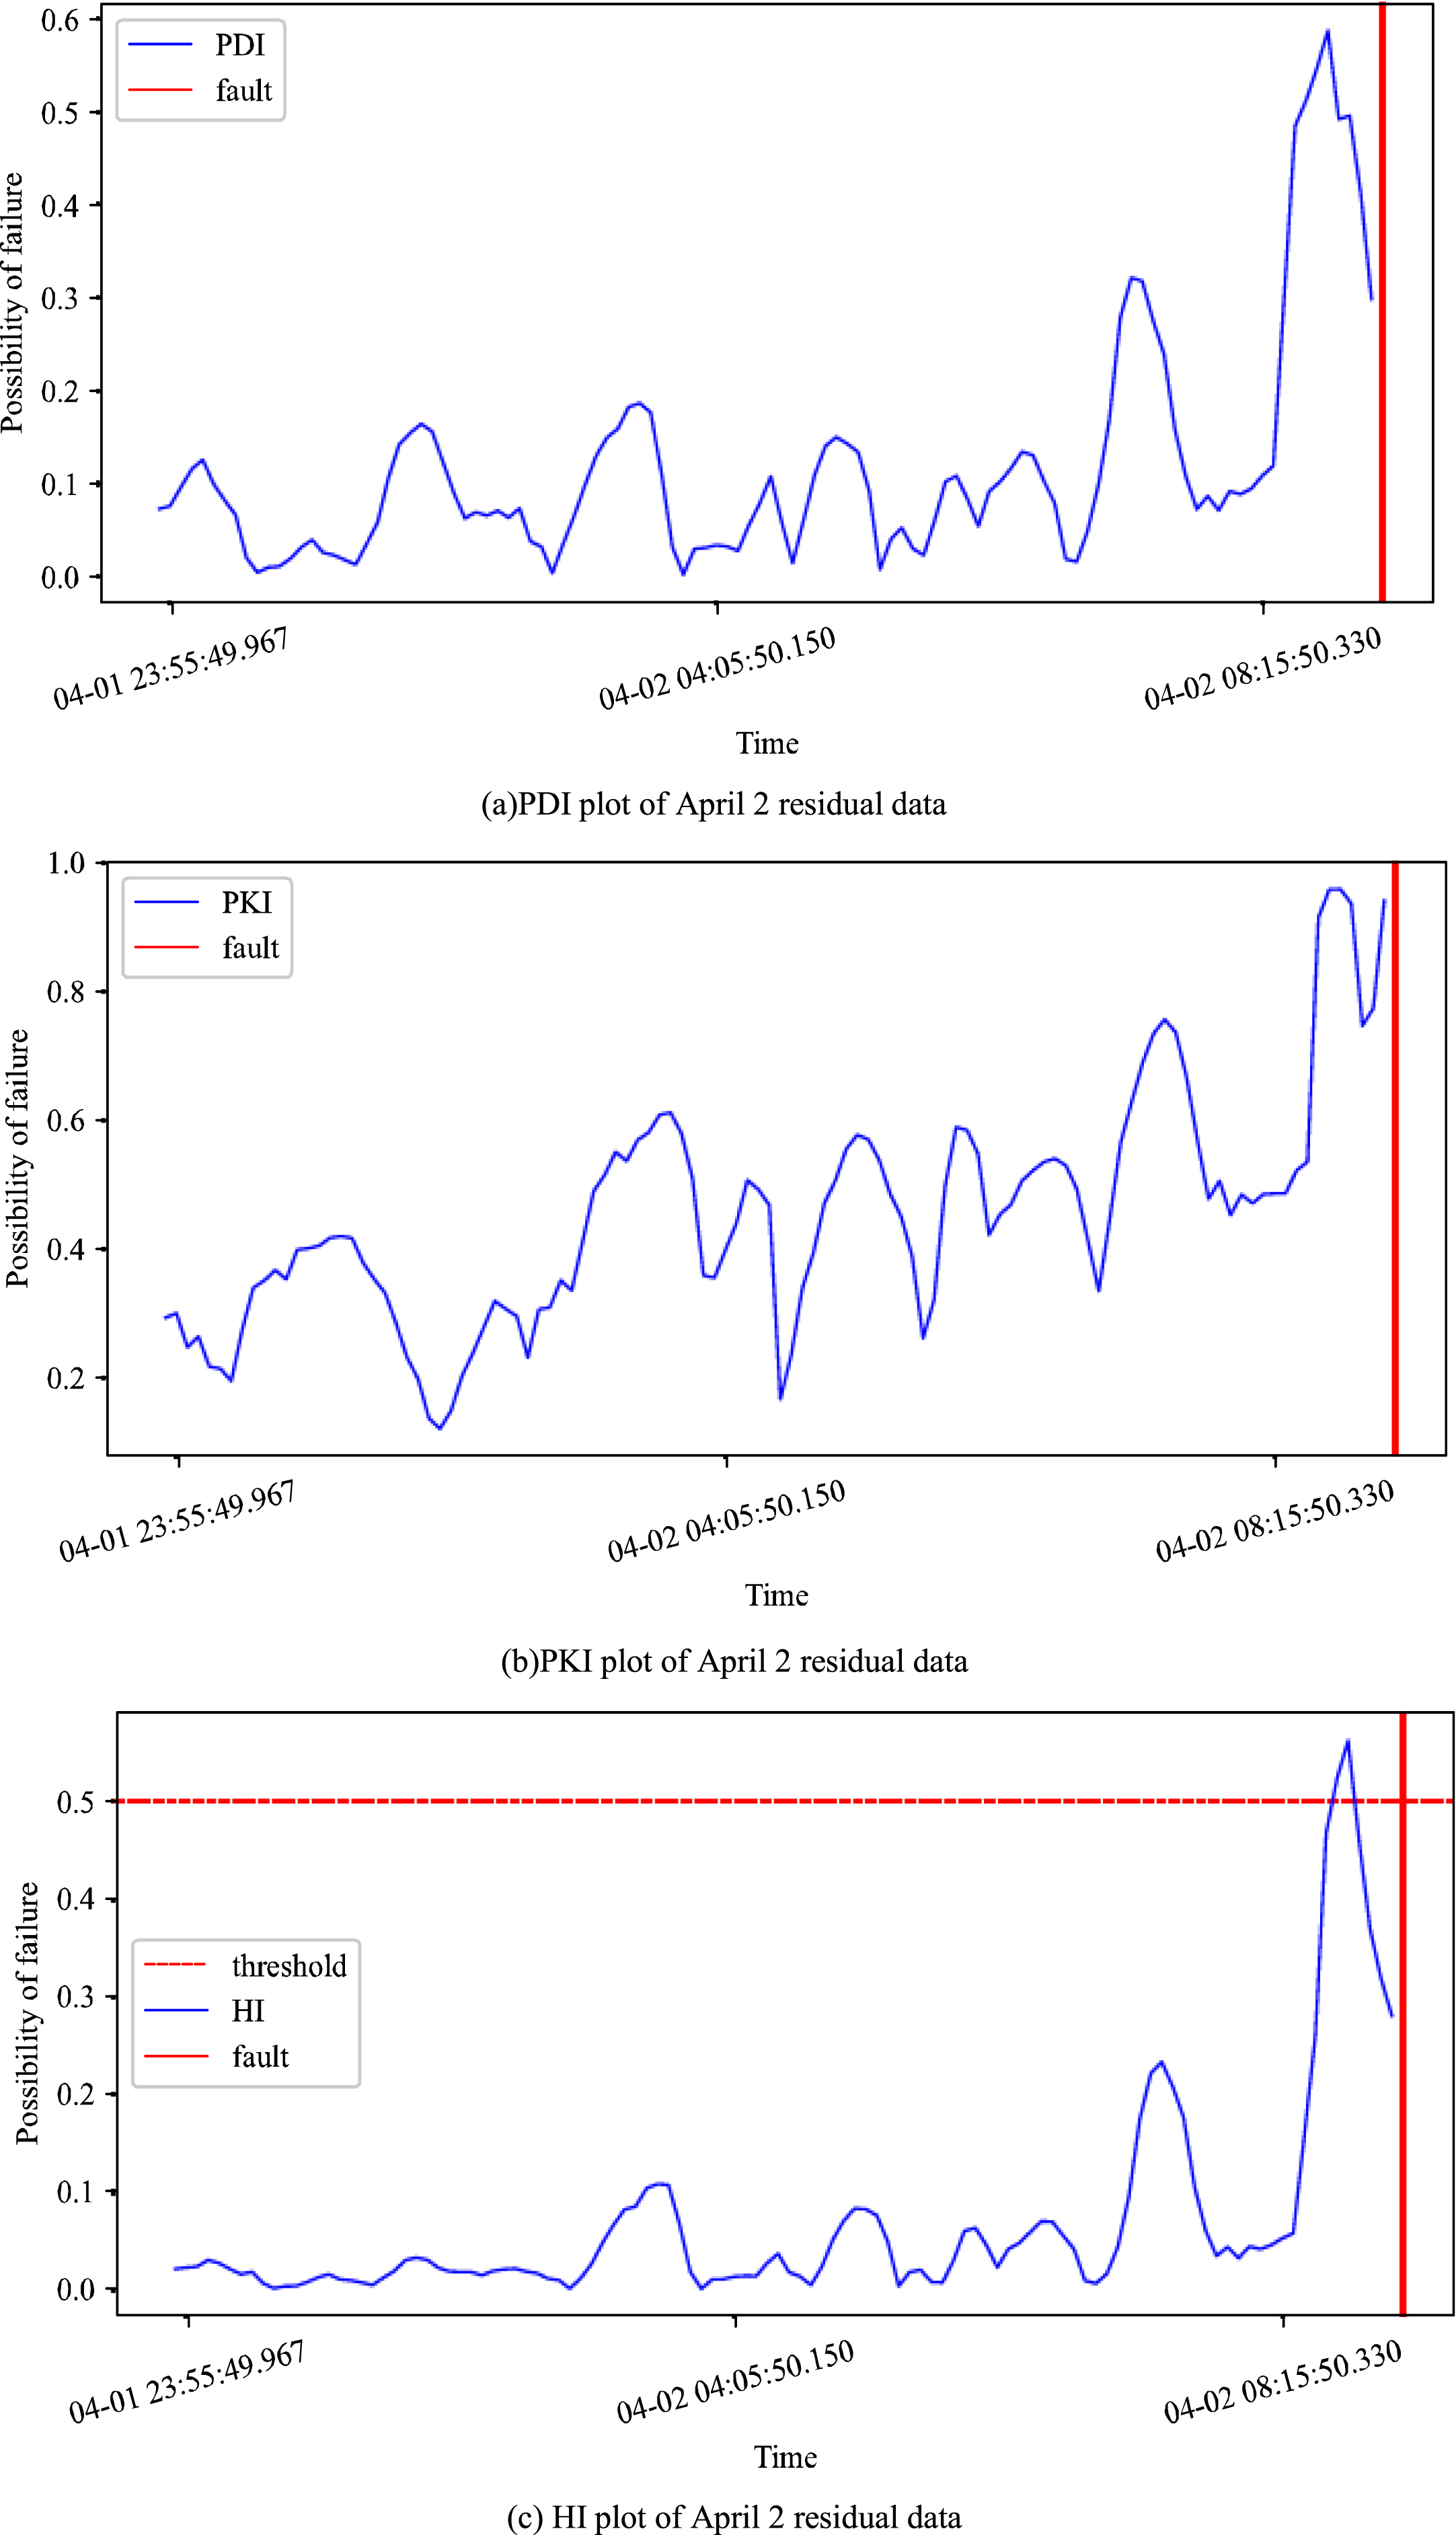
Indicator chart of April 2 residual data.
The PDI and PHI analyze the probability of fault of hydropower stations from different aspects, and we only need to consider the combination of the two (HI index), we can accurately get the probability of equipment fault.

BILSTM detection map in early February 2019.
CNN+LSTM detection map in early February 2019.
Figure 15(c) shows that the HI index increased slightly at around 03 : 00, 04 : 00, and 05 : 00 on the day of the accident. And this index kept increasing after 07 : 30, exceeding 0.5 at around 08 : 30. If effective interference is carried out on the equipment at this time, the fault can be avoided.
By comparing the detection results from April 2 of the LSTM correction model (in Fig. 11) and LSTM correction model based on the health index (in Fig. 15(c)) respectively. We can find that the LSTM correction model considering health indicators has higher sensitivity to the early minor abnormal data, and can also play a more important role in the early warning of equipment fault.
In this paper, the LSTM correction model based on the health index is used to give a timely warning of possible faults, and the result is compared with the LSTM model, LSTM correction model, CNN+LSTM model, BILSTM, and extended isolation forests algorithm.
Since the fault detection algorithm of the LSTM model has been mentioned above, and the extended isolation forests algorithm has been applied in literature [17], this chapter only discusses CNN+LSTM and BILSTM algorithms.
Taking early February 2019 and early April 2019 as examples, we respectively use CNN+LSTM and BILSTM models to verify the results, and the results are as follows:
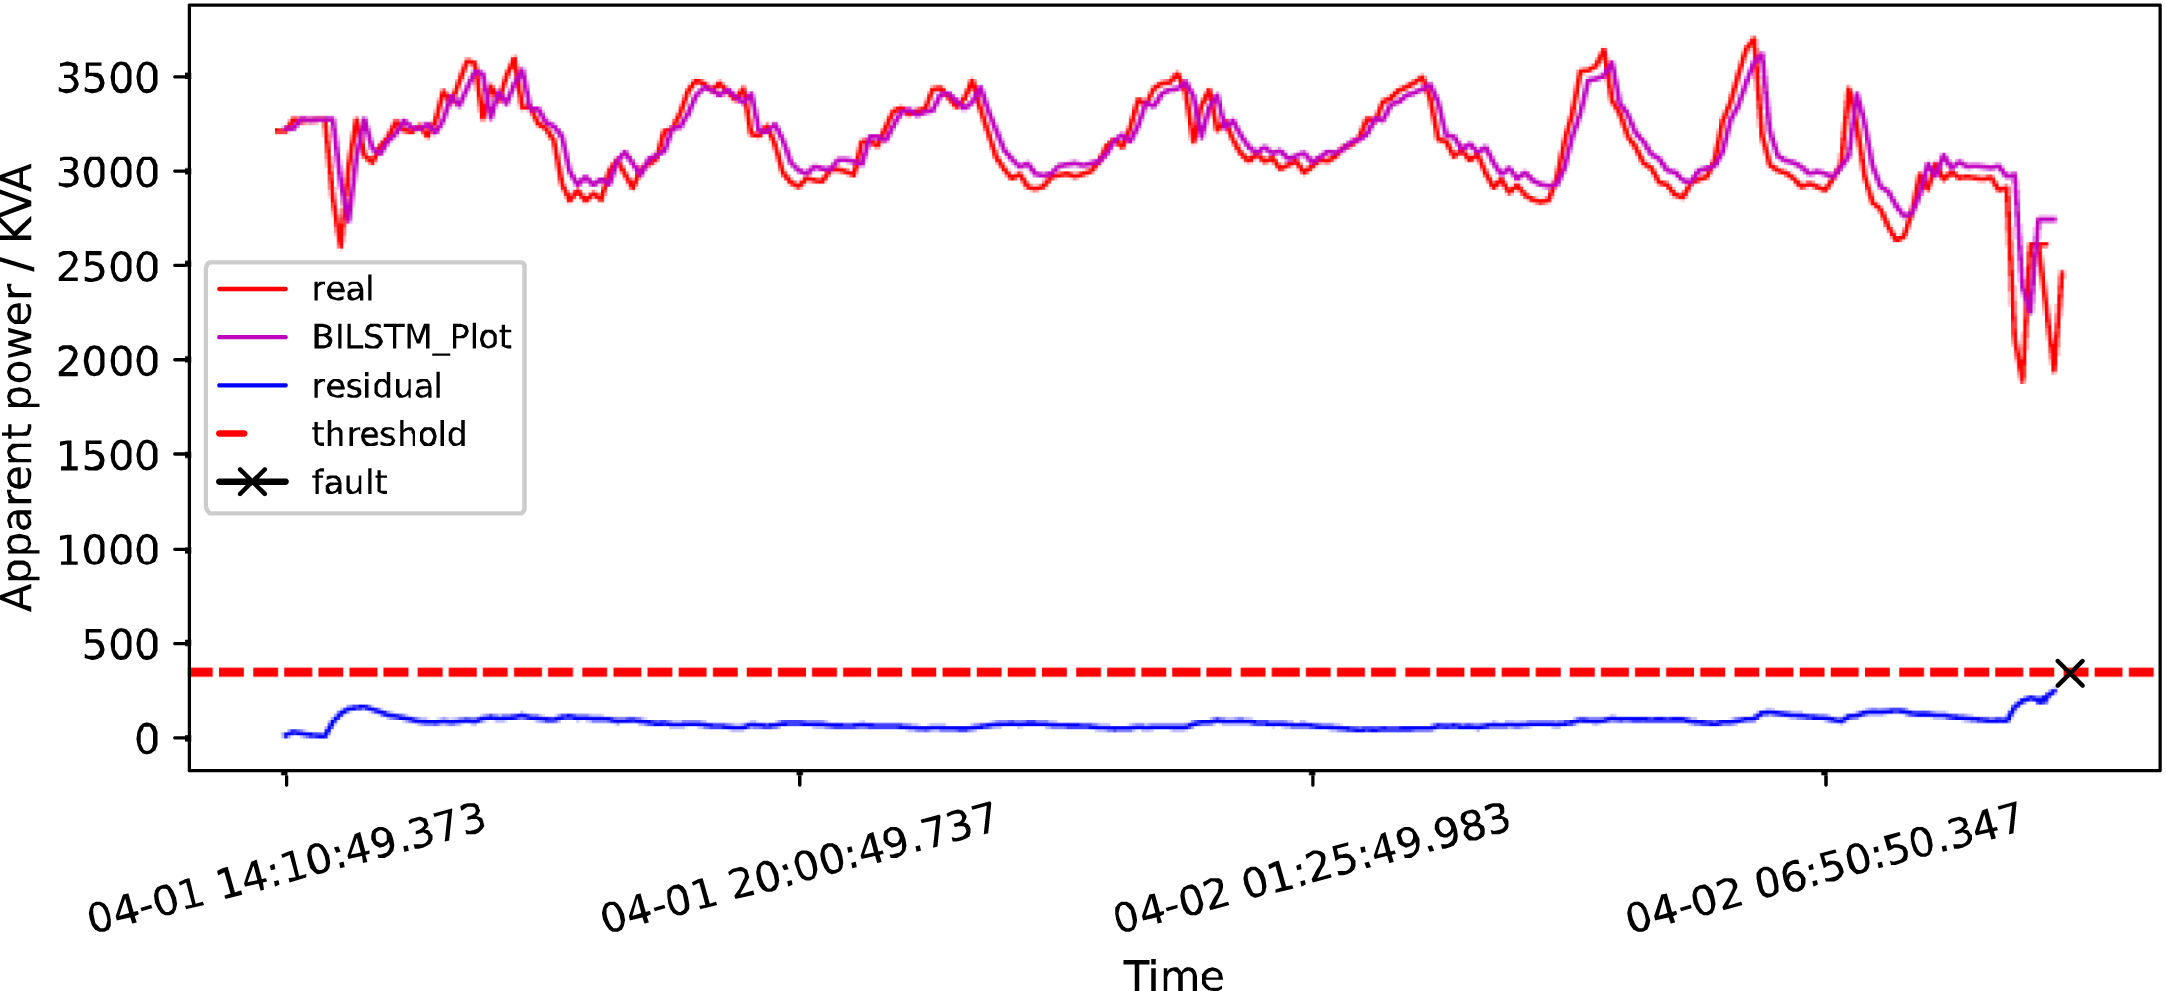
BILSTM detection map in early April 2019.
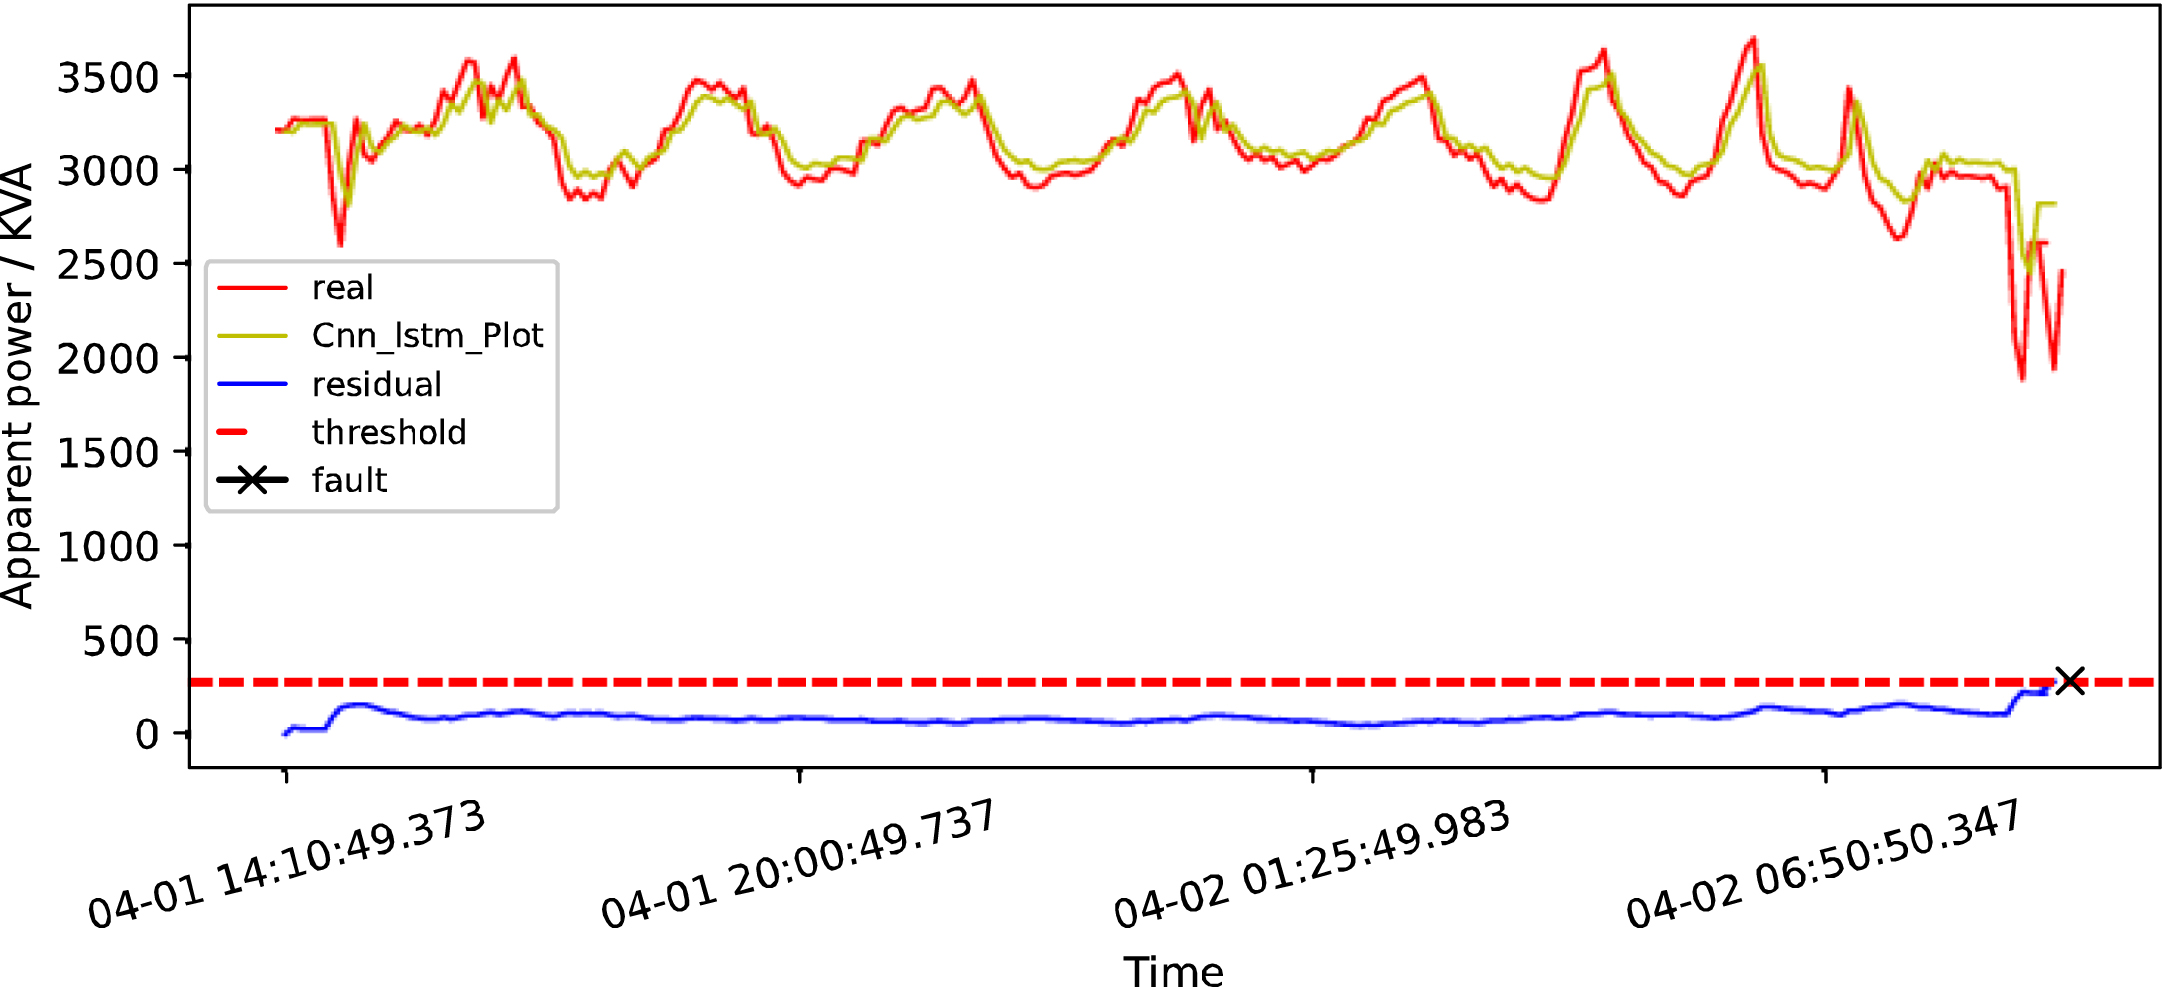
CNN+LSTM detection map in early April 2019.
Finally, in this chapter, all the above algorithms are applied to the apparent power of hydropower stations in January, February, and April 2019, and the results are summarized in the following table. In the following table, the first column represents the name of the algorithm, the second column represents the time when the equipment fault occurred, and the third column represents the time when the algorithm detected the fault. NULL in the following table indicates that the algorithm did not detect abnormal changes in the data before the fault occurred and the following table shows the algorithm of this paper in bold.
Early warning of data in mid-January by each model
Early warning of data in early February by each model
Early warning of data in early April by each model
It can be seen from the above table that compared with other algorithms, the LSTM correction model based on the health index can provide earlier and more effective fault warning. When abnormal data occurs, the residual error generated by the LSTM correction model can exceed the set threshold faster, so it can realize more effective fault warning. The HI index proposed in this paper is calculated according to the residual error generated by the LSTM correction model and it represents the probability of potential device faults. So the LSTM correction model based on the health index not only has the advantages of the LSTM correction model, but also can monitor the health status of the equipment in real-time, and help the maintenance personnel observe the running status of the equipment.
Equipment faults are usually not periodic, which makes it impossible for traditional detection models to learn periodic features from data. In this paper, we weighted the traditional LSTM model to form the LSTM correction model. This model can produce large residuals in the presence of abnormal data, which facilitates timely fault warning. So it is superior to the traditional LSTM model in anomaly detection and maintains the same excellent prediction ability as the LSTM model. In the case of small abnormal data, the traditional model will often follow these abnormal data for fitting, thus unable to produce a large residual error and lose the role of early warning. The model in this paper can detect the abnormal trend of data in time and give early warning of fault in advance. On this basis, two factors related to equipment health are proposed: PDI and PKI, and combine these two indicators to form the health indicators (HI) of this paper. Finally, based on fully considering the characteristics of hydropower plant data time series, this paper uses the LSTM correction model based on the health index to verify the data of hydropower station. The experimental results show that: this paper proposes the model can not only know the health status of the device in real-time but also has good sensitivity, which can detect abnormal changes in the early stage of the fault and give a timely warning.