



Abstract
The earth pressure balance (EPB) shield tunneling efficiency is greatly affected by the choice of soil transport mode. In this study, the influence of two soil transport modes, such as the continuous belt conveyor and rail train, on the efficiency of shield excavation was analyzed using the Markov chain model. A method was proposed to define the ideal and non-ideal excavation states and quantitatively evaluate the excavation efficiency of the two soil transportation modes of the EPB shield. Based on this model framework, a profitable Markov chain model was established to predict the expected profits of the two soil transportation modes. The Beijing Metro New Airport Line first-phase project was used as a case study to verify the model established. The results show that under the same conditions, the continuous belt conveyor soil transport mode can have a higher excavation efficiency and expected profit. This advantage gradually increases over time.
Introduction
The complete tunneling cycle of the earth pressure balance (EPB) shield is composed of three parts: excavation, segment assembly, and soil (including material) transportation. As the shield excavation continued to advance, the shield excavation and segment assembly time generally did not change significantly as long as the geological conditions did not change significantly. However, the soil transportation time increased with the lengthening of the transportation distance. Therefore, the selection of a reasonable soil transportation mode for long-distance shield tunnels has a decisive effect on the efficiency of the shield tunnel. Especially for the construction of urban subways, and the efficiency of shield soil transportation significantly affects the construction duration and schedule of the entire project [1–3]. It also has great influence on the stability of shield tunneling machine working surface.
Therefore, many scholars have conducted qualitative analyses and quantitative calculations on the transportation of the two types of the shield horizontal soil transport of the continuous belt conveyors and rail trains. The qualitative analyses include the following: the horizontal transport mode of the shield tunnel is elaborated in detail, the comprehensive technology of soil transportation outside the hole of the belt conveyor with different excavation distances is proposed, the working characteristics of the belt conveyor are analyzed, specific examples are provided, and the practicality, advantages, and disadvantages of common horizontal transportation modes are analyzed [4, 5]. The quantitative calculations include the establishment of an optimized model for the trackless transportation of tunnel vehicles for long-distance slurry shield tunnels, creation of a vehicle scheduling model inside the tunnel, and usage of operations research to establish and solve a mathematical model regarding soil transportation planning [6–8]. Based on the previously cited studies, the qualitative and quantitative analyses of the horizontal direction of the shield soil transportation mode are complementary and have achieved good application verification in many practical projects.
Moreover, based on the Markov chain model, it has applications in the field of engineeringand in identifying soil geological model parameters [9]. On the other hand, the application of the shield tunnel construction includes the use of the improved coupled Markov model to characterize geological uncertainty, and the influence of the shield tunnel and excavation location on tunnel structural performance is verified in Norway and Shanghai [10]. In addition, the foundation conditions and cost of the Chuanshi Tunnel were quantitatively and probabilistically estimated using the Markov chain model [11]. Moreover, the Markov model was used to analyze the equipment reliability of the EPB shield, and the maximum availability of the shield equipment was obtained [12]. On the other hand, the potential uncertainty and randomness of tunnel construction are modeled by the discrete-time Markov chain process, and the feasibility and application potential of the method are proved by the safety analysis of the construction of the Wuhan Yangtze River Tunnel to obtain the safety impact of tunnel construction on surface road operation [13]. A general model of tunnel geological determination based on probability was proposed based on the hidden Markov model and neural network. For example, the model was verified to have high accuracy in geological prediction through its application in the Middle River Drainage Tunnel Project in Taipei, Taiwan [14]. A two-step parameter estimation method based on the hybrid evolutionary Markov Monte Carlo algorithm was proposed to investigate the reliability of the structural system, verifying the stability of the working surface in shield excavation [15]. Meanwhile, a simulation was carried out by the Markov chain based on the Bayesian model to evaluate the state of the shield tunnel with different cover thickness [16]. Based on ground-penetrating radar, the Markov Monte Carlo model with Bayesian inference was used to estimate the thickness of the grouting layer of the shield tunnel lining [17].
Through an extensive literature review, few studies combine the Markov chain model with shield excavation efficiency with expected profits. The choice of the two shield soil transportation modes of a continuous belt conveyor and rail train mostly relies on past work experiences due to the lack of sufficient theoretical background and reliable data available. In addition, existing research also lacks relevant theoretical support for such problems. Therefore, in this study, we propose a prediction model based on the Markov chain model for the horizontal soil transport efficiency of two shield tunnels of a continuous belt conveyor and rail train. Moreover, the proposed model is combined with the actual construction case of the adjacent shield project of the New Airport Line first-phase project of the Beijing Metro to analyze the operation of the construction process of the two soil transport modes, predict the excavation efficiency of the two soil transport modes, and provide a reference for the selection of different soil transport modes for shield excavation. Finally, an expected profit forecast is performed, providing a reference for the profit cost analysis of the construction project.
Excavation efficiency prediction model
The internal transportation of EPB shield tunnel mainly applies two types of soil transport, such as the continuous excavation by the continuous belt conveyor and soil truck transport of soil by the rail train. In this section, these two soil transport modes are introduced and analyzed.
Construction analysis of two types of soil transportation
The traditional rail train soil transport mode needs to carry both the segment car and soil truck, drive into the tunnel after the vertical transportation of the launch well is completed, unload the segment material and load the soil during the shield excavation process, and drive out of the tunnel for vertical hoisting transportation after the completion of the shield excavation. The continuous belt conveyor soil transport can realize the separation of the material and soil transport compared with the traditional rail train soil transport mode. In addition, during the shield excavation process, the soil transported by the screw conveyor is directly transported to the rear continuous belt conveyor and out of the tunnel with the belt conveyor until it enters the ground soil pit. The two soil transport modes are shown in Fig. 1.
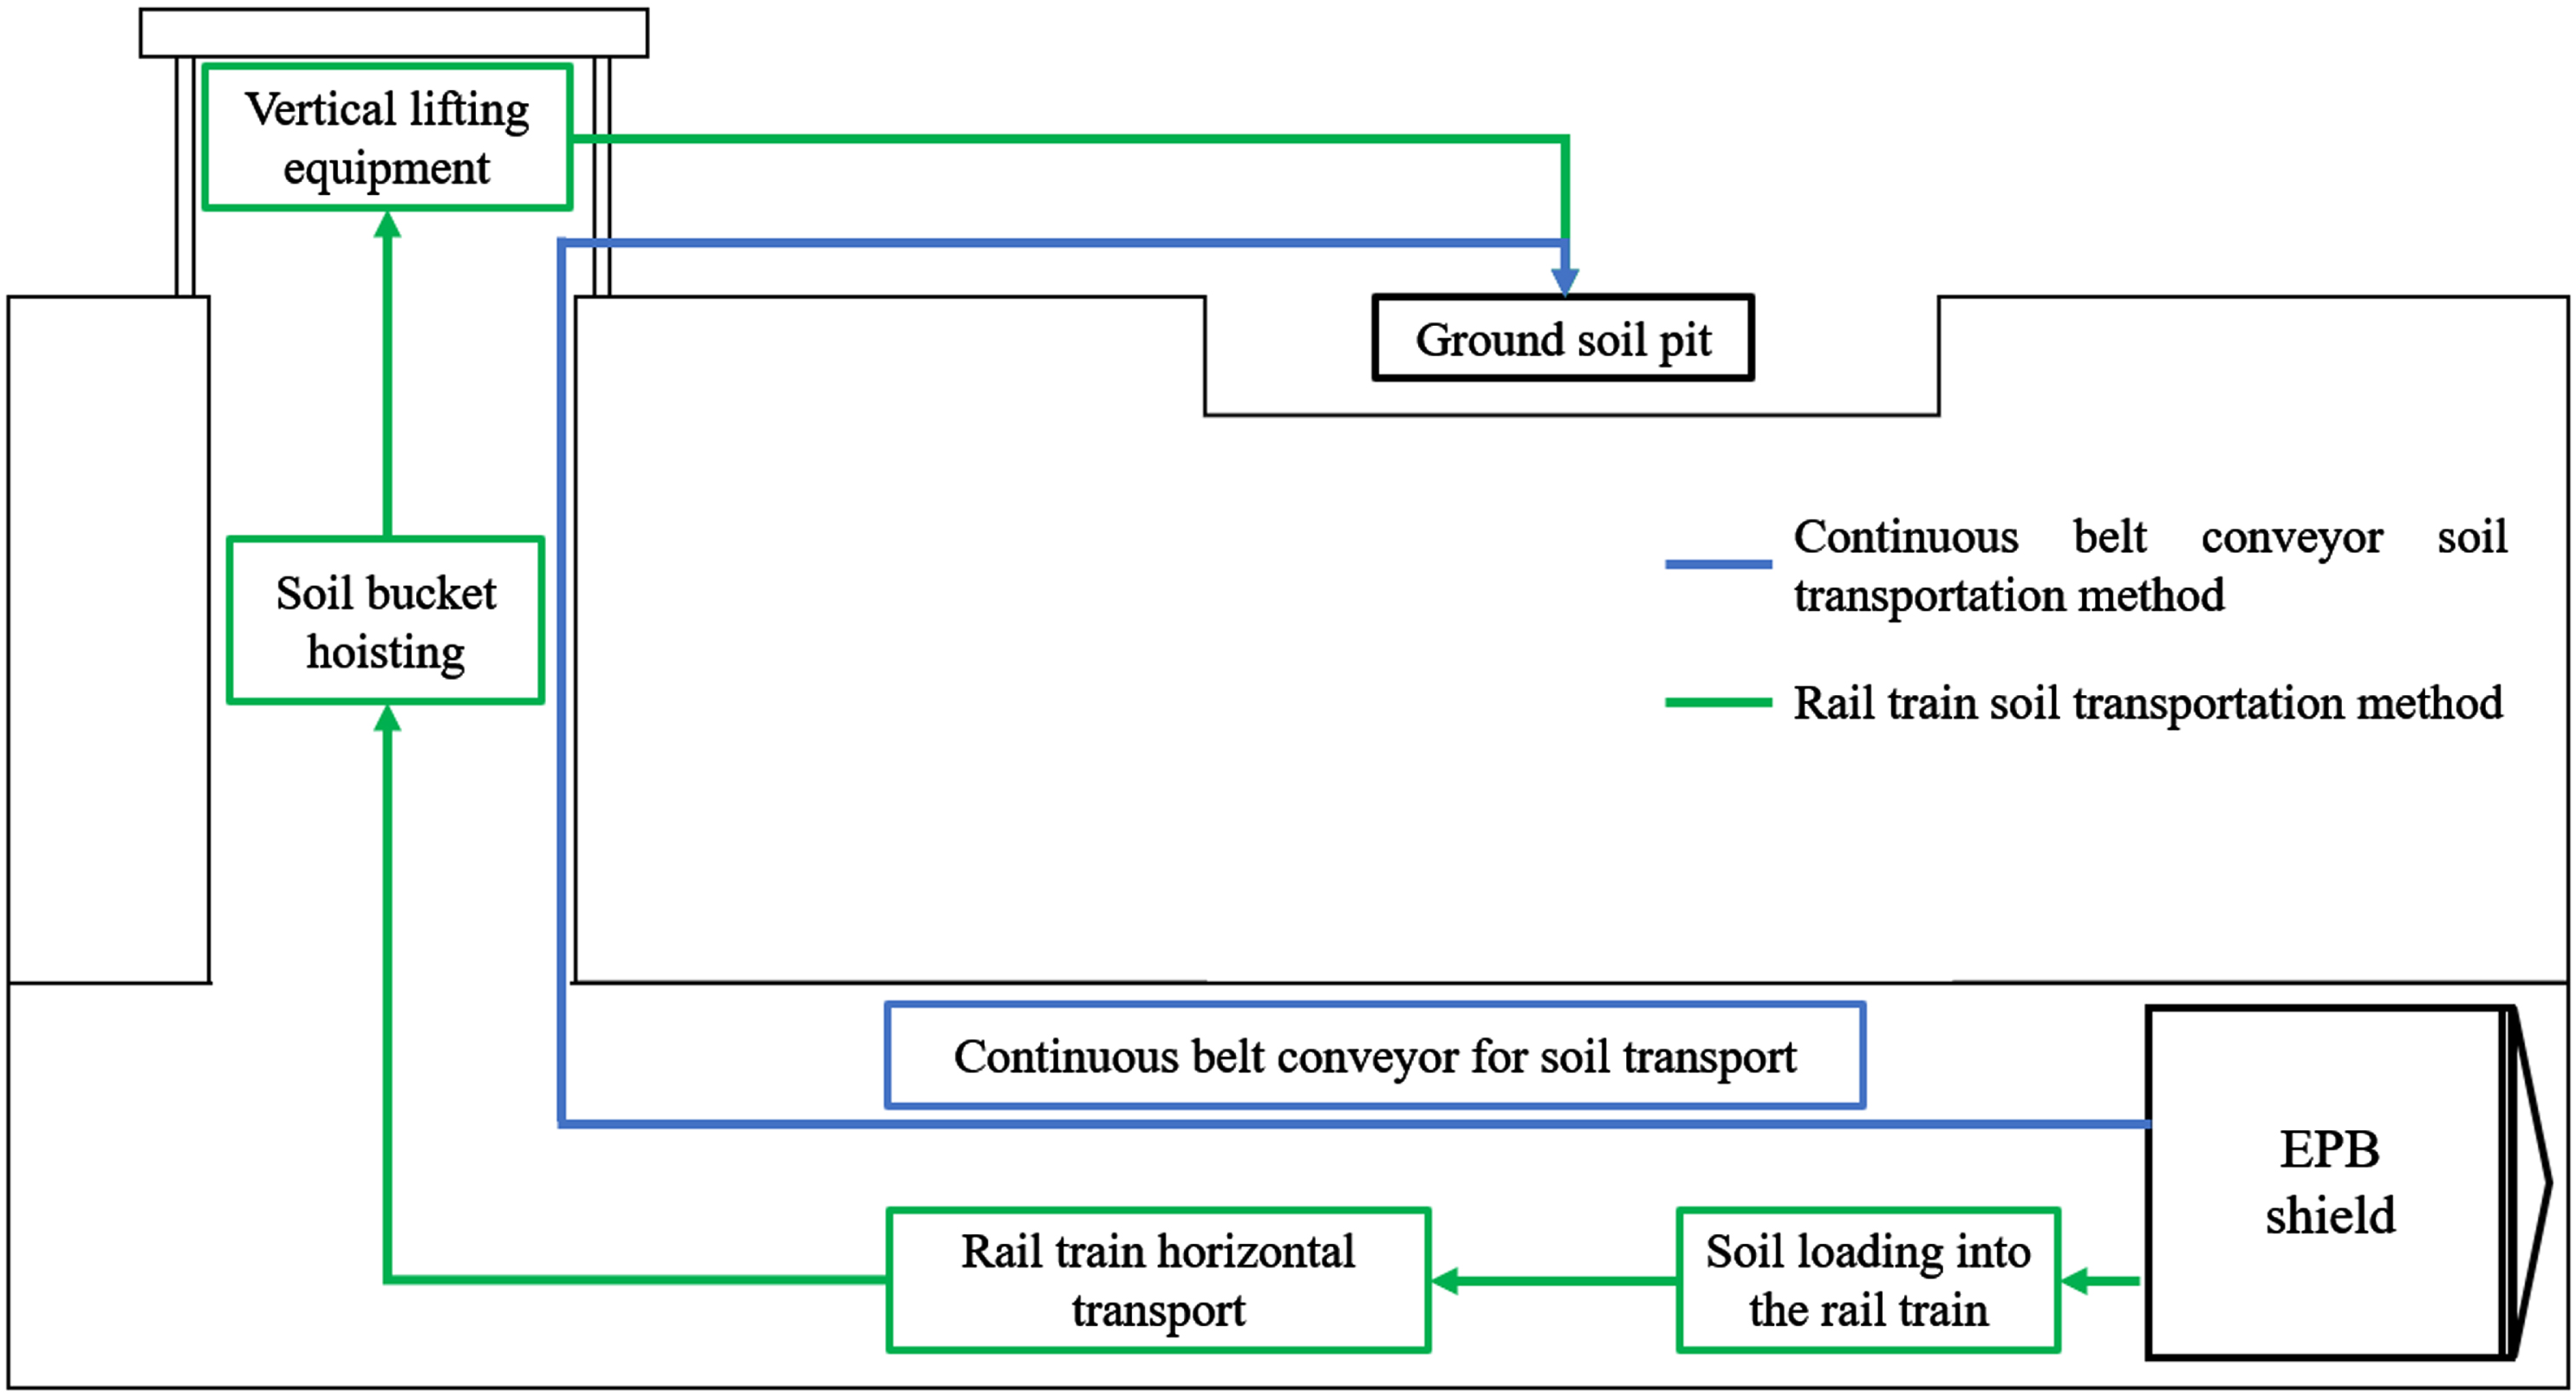
Shield excavation process of two types of soil transportation.
The shield excavation machine was set to always exist only in the following two construction states (i.e., States A and B) during the excavation process.
State A: The shield tail always maintains a sufficient supply of segments and materials. There is a soil truck below the soil outlet at all times to load the soil. On the other hand, the soil can be directly loaded into the continuous belt conveyor. State A is called the “ideal state.”
State B: The intermittent supply of segments and materials are at the shield tail, or no soil truck waiting to load when the soil outlet discharges the soil. State B is called the “non-ideal state.”
If the current horizontal transport cycle belongs to State B, the probability of the next horizontal transport cycle transitioning to state A is α (α > 0). The current horizontal transport cycle belonging to State A is that the probability of the next transition to State B is β (β > 0). The following two issues are discussed:
Question 1: What is the probability that the current State A transport cycle process will change to State B at time n?
Question 2: In the long run, what is the proportion of each state?
Model Markov chains
Let X(n) be a process with two states (set of values {0, 1}), which is used to describe the state of the next transition. If the horizontal transport is transformed into State A for n times, it is recorded as X(n) = 0. Meanwhile, it is recorded as X(n) = 1 if the horizontal transport is converted to State B for n times [18–21]. Its transition probability is shown in Equation (1).
The transfer probability matrix is expressed in Equation (2).
In the n-step case, the probability of state transition follows the n-step transfer matrix, as shown in Equation (3).
For obtain the stationary distribution (π0, π1)
T
, which yields a system of linear equations, as shown in Equation (4).
The system of linear equations in Equation (4) are solved, as shown in Equation (5).
Therefore, in the long run, the proportion of States A and B is given by Equation (6).
Enterprises aim for construction efficiency and reduced construction duration to increase profits. Therefore, it is necessary to predict the expected profit when formulating an organization plan for soil transportation. Forecasting was performed in two steps as follows:
Step 1: Statistical analysis of the data to obtain changes in construction status, profits, and losses.
Step 2: Build a mathematical model and list the prediction formulas for solving the prediction.
The Markov chain is called the “Markov chain with profit” if it is accompanied by profit changes when the state transition occurs [22].
Instant expected profit (One-step State Transfer Expected Profit)
The system has N states, and the profit obtained when state i is transferred to state j in one step (when the event occurs, P
ij
= 1) is r
ij
(i,j=1,2,..... N). The profit matrix R is given by Equation (7).
Where, if r ij > 0, profit occurs, r ij < 0 loss, and r ij = 0 balance. This profit can only be the expected profit because the system state transitions to random.
The expected profit is presented in Table 1, considering the one-step transfer probability of State i.
State i one-step transfer probability expected income statement
The expected profit value obtained after a one-step transfer from State i is given by Equation (8).
This value is also known as the immediate expected profit and is the mean profit under the probability definition, which is denoted by Equation (9).
Especially when
The k-step transfer expected profit can be decomposed into two steps: one-step transfer expected profit and k-1 step transfer expected profit. The one-step transfer of expected profit is expressed in Equation (9). Here, the k-1 step transfer expected profit is discussed.
If the state has been transferred to State 1 (let P
ij
= 1), then the expected profit is achieved after reaching the State k-1 step from State 1, and the probability of the transition from State i to State 1 occurs is
Similarly, the actual expected profit of k-1 after State i is first transferred to State 2 is
The k-step transfer of the expected profit is shown in Equation (10).
Equation (9) is substituted into Equation (10) for resolution, and the solution is shown in Equation (11).
Equation (11) is the k-step transfer expected profit recursion formula, which can be rewritten as matrix recursion. Moreover, the specific derivation process is as follows.
Equation (10) can define the j-step transfer of the expected profit column vector, as shown in Equation (12).
The matrix of the immediate expected probabilities is shown in Equation (14).
Based on Equations (14), the k-step transfer of the expected profit matrix recursive formula is shown in Equation (15).
The results of the efficiency projection model and expected profit forecast model proposed in Sections 2 and 3, respectively, were combined to estimate the shield excavation efficiency and expected profit forecast for both shield soil transport modes quantitatively and probabilistically.
Engineering background
Project overview
The first phase of the Beijing Metro New Airport Line project is approximately 46 km long. This project encompasses the rail transit line directly to the new airport in the urban area, and the underground section of the tunnel length is 14.8 km. It uses EPB shield excavation, reinforced concrete segments (segment outer diameter of 8800 mm, ring width of 1600 mm, and thickness of 450 mm), and shield tunnel burial depth of approximately 12 to 26 m, although the formation is mainly pebble strata.
In this study, the Nos. 1 to 2 and Nos. 2 to 3 shield interval tunnels adjacent to the shield construction project of the Beijing Metro New Airport Line first-phase project are selected for analysis. The two shield interval equipment configurations are the same. In addition, the crossing geological conditions are similar, but the soil transportation mode is different. The location and geological conditions of the shield interval plane are shown in Figs. 2 3, and an overview of the shield interval and comparison of the equipment parameters are shown in Table 2.
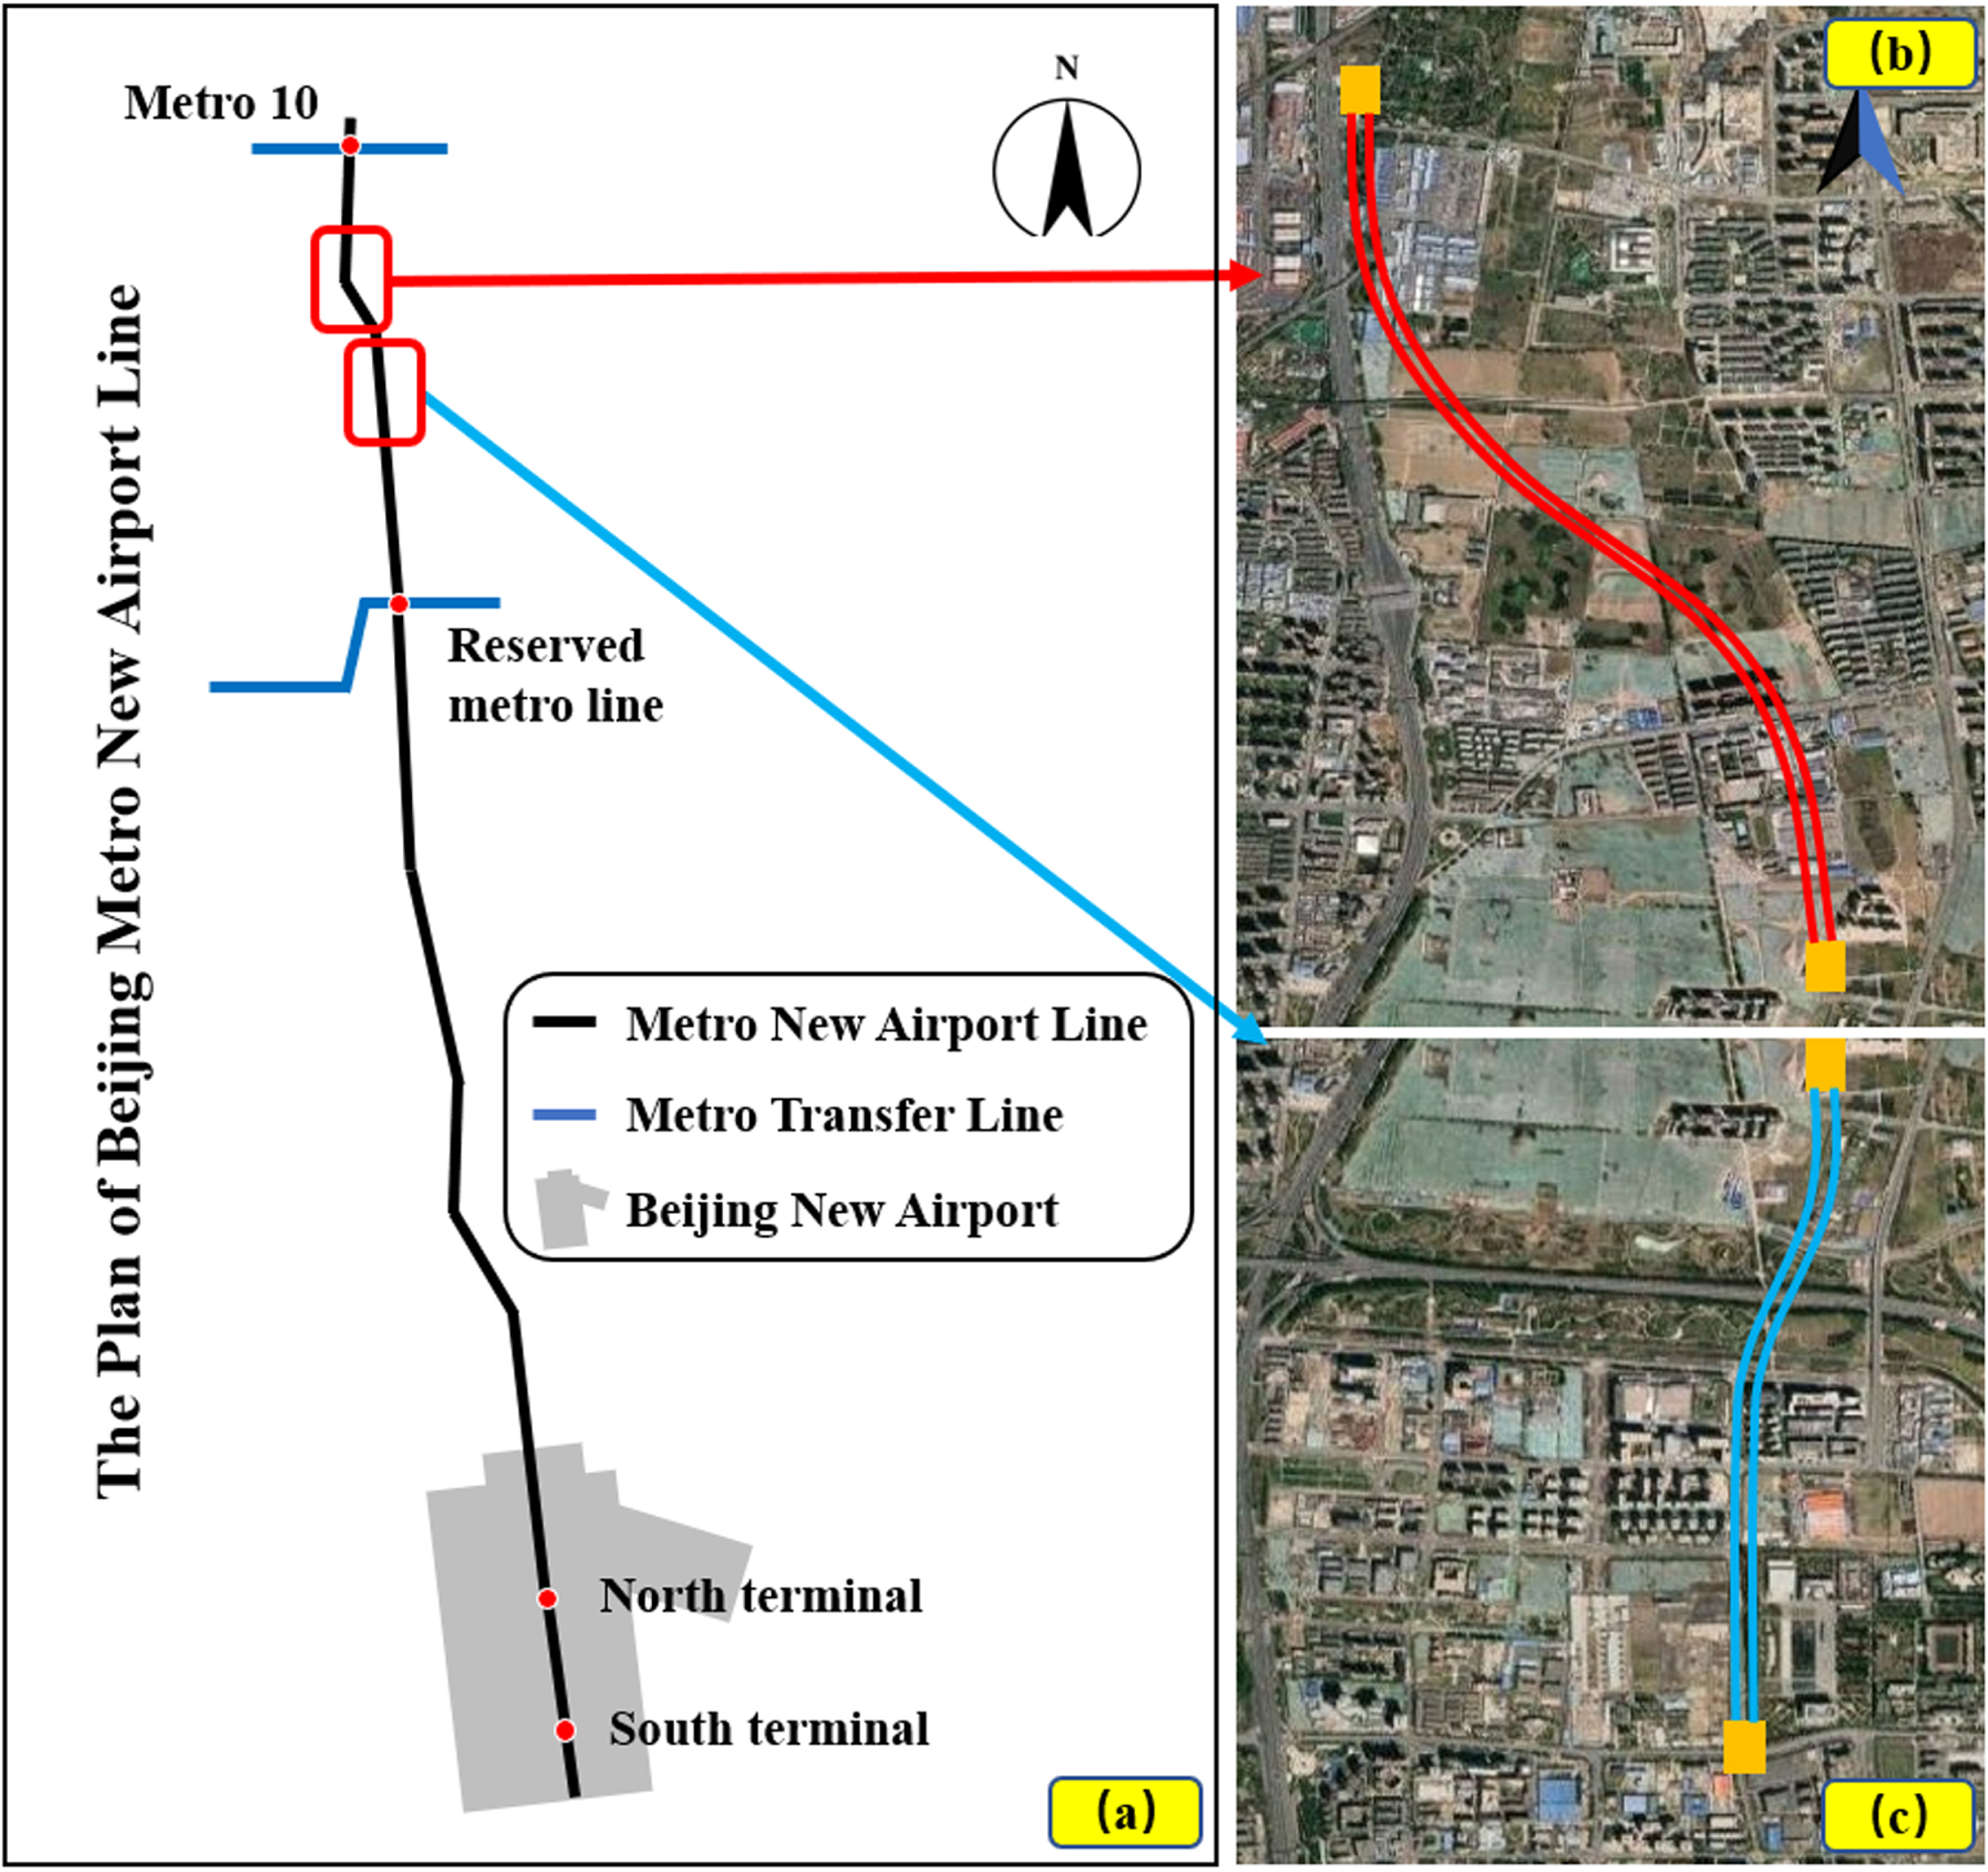
Beijing Metro New Airport Line first-phase project.

Nos. 1 to 3 shield interval tunnel geological conditions.
Overview of the shield tunneling intervals and comparison of equipment parameters
A large number of statistical analyses were carried out on the shield excavation time and segment assembly time of these two shield intervals. The time required for the shield to complete a ring of excavation and segment assembly are 0.75 and 0.5 h, respectively.
According to the characteristics and actual investments of the project, the single-track rail system was laid in the tunnel during the shield excavation period of the shield interval tunnels Nos. 1 to 2 and Nos. 2 to 3. The fixed and mobile rail train cross platforms were added to the tunnel in three stages with the increase in the tunnel excavation distance and the reduction in transportation efficiency to meet the requirements of the multi-column rail train marshalling operation.
Stage 1: During the excavation of the shield at approximately 0 to 160 m, a single train is marshalled at this time, and the track adopted a single-line track. This is shown in Fig. 4(a).

Three-stage floor plan of the tunnel’s internal track laying. (a) phase 1, (b) phase 2, and (c) phase 3.
Stage 2: Shield tunneling is in the range of approximately 160 to 900 m. The fixed rail train cross-platform and four-track double-line area are laid at the entrance of the tunnel and put into two groups of train marshalling. This is shown in Fig. 4(b).
Stage 3: When the shield tunneling exceeds 900 m, add a set of movable rail train cross platforms at the tail of the shield machine equipment, and move forward with the shield machine. The moving cross-platform was approximately 100 m away from the shield tail. This is shown in Fig. 4(c).
Combined with the above analysis, the internal track-laying scheme of the tunnel was clarified. Subsequently, a prediction study of the tunnel excavation efficiency of the two types of shield soil transport methods was conducted.
Rail train efficiency predictions
Assuming that shield excavation is always in an ideal state, the main factor determining the efficiency of shield excavation is the sum of shield excavation time (ET) and segment assembly time (AT). That is, the time required for the shield to complete a ring tunnelling cycle (TC) is given by Equation (16).
A total of 323 days of shield construction in the right line of the Nos. 1 to 2 shield interval tunnel of the Beijing Metro New Airport Line first-phase project. Then, we waited for the shield reception well to be constructed for a total of 112 days, in which special holidays and other objective factors work stopped for 22 days. The actual excavation time was 189 days, and the statistics of the number of shield excavation rings per day are shown in Fig. 5. In the shield excavation process, the daily net excavation time is affected by many factors. In addition, Table 3 lists the collected and counted influencing factors.
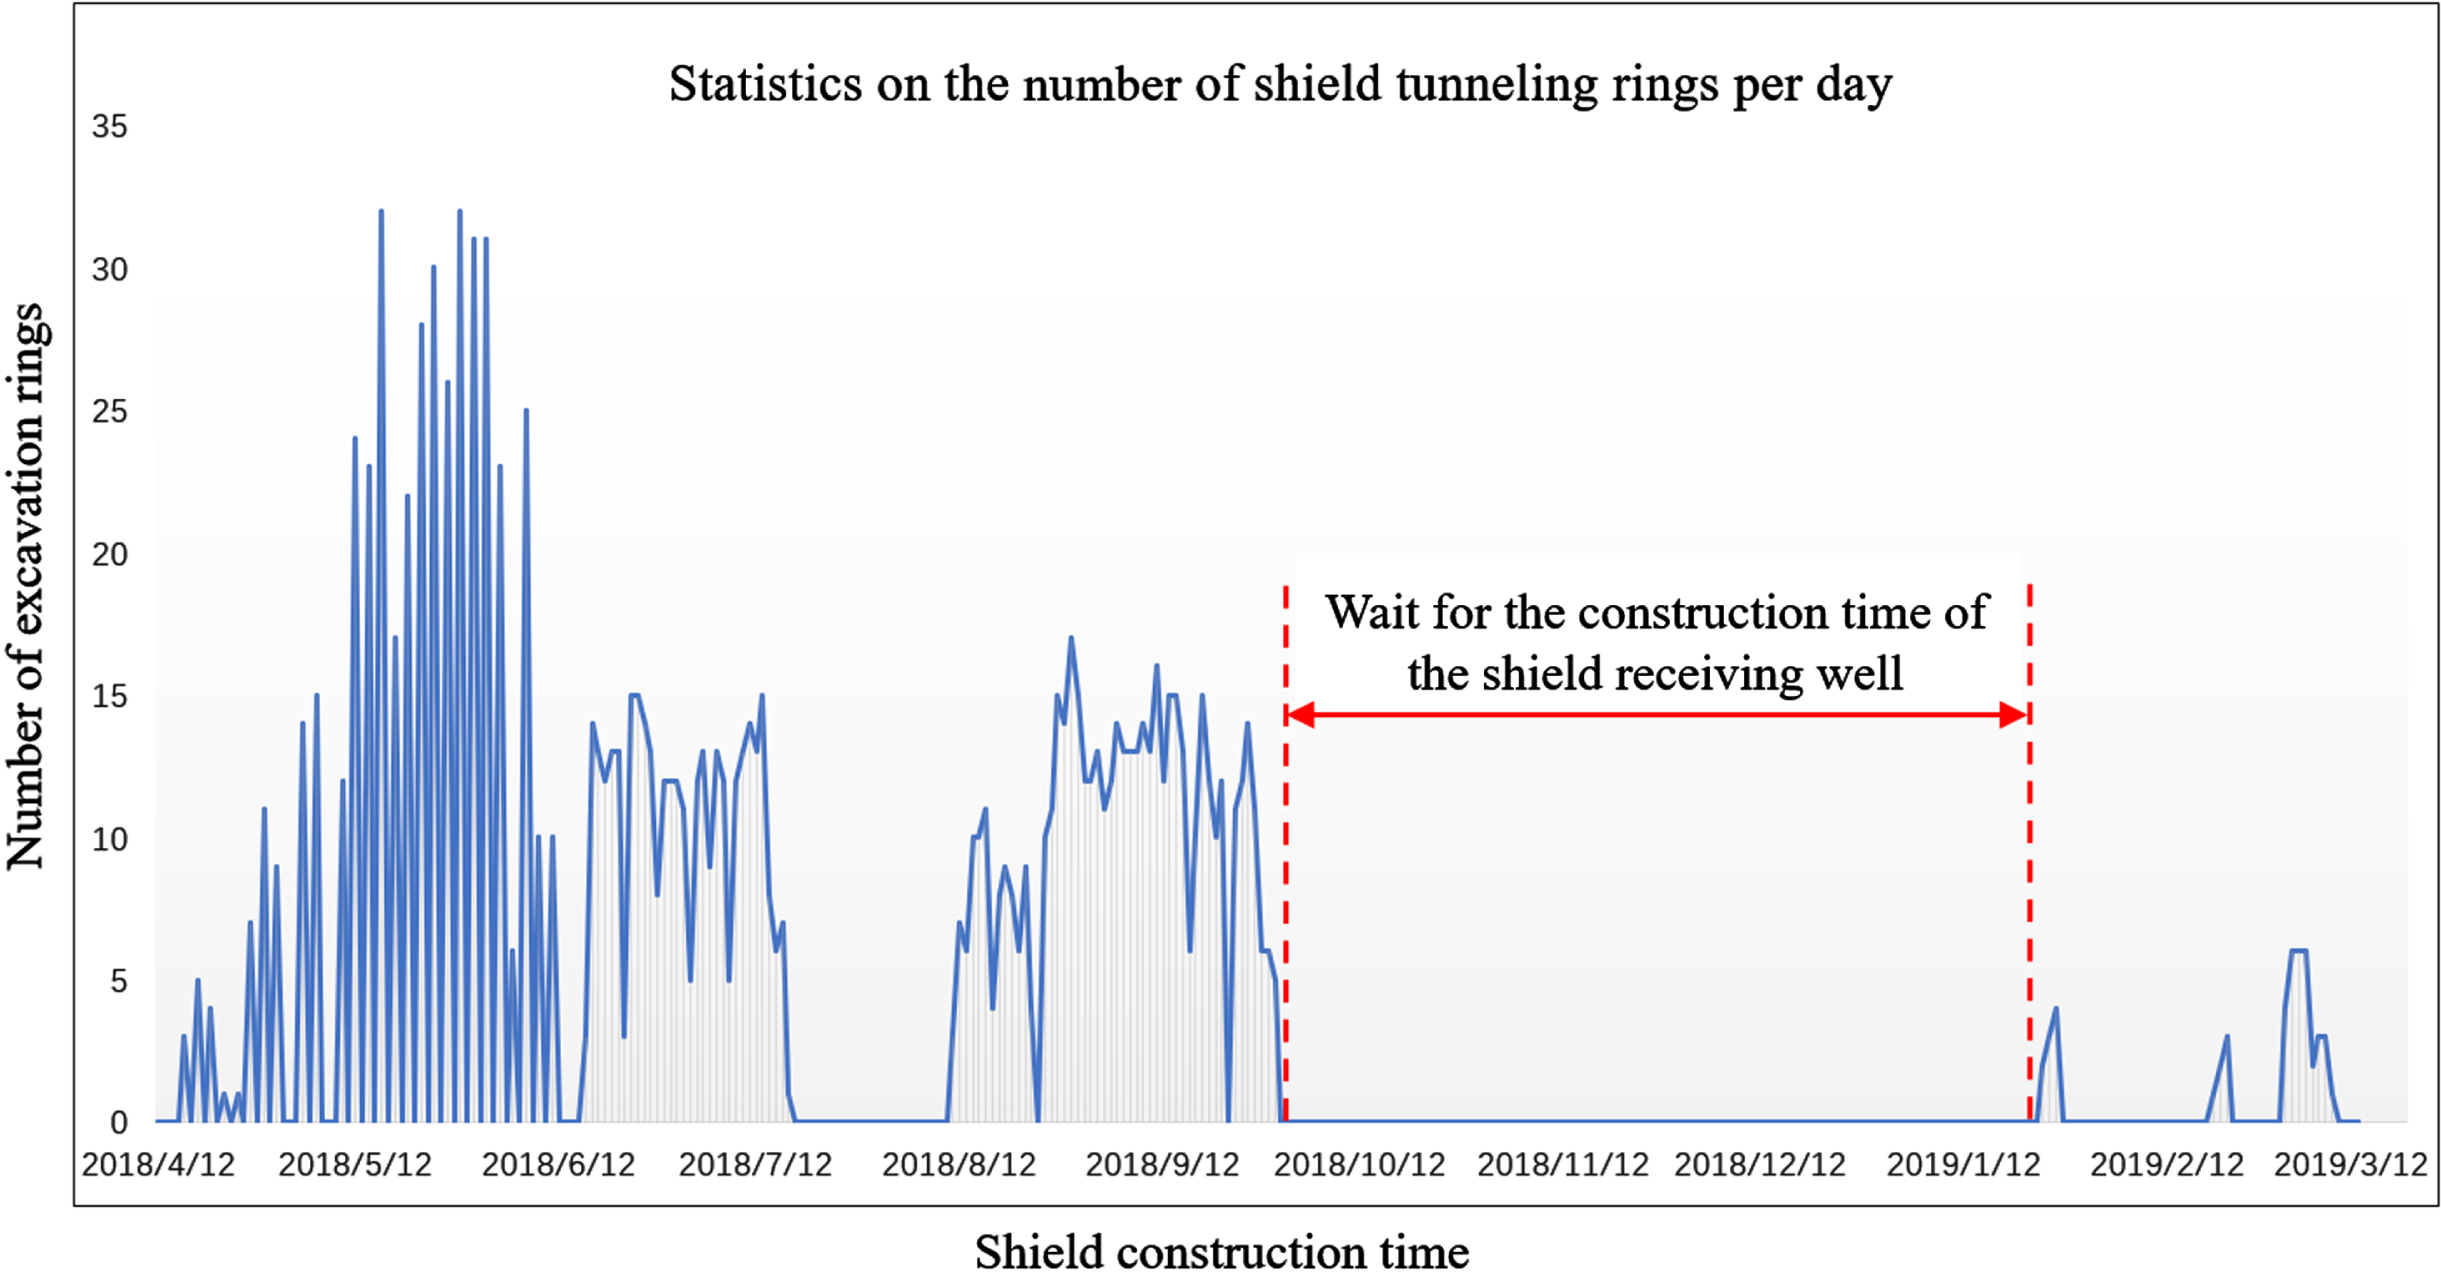
Statistics on the number of shield tunneling rings per day.
Influencing factors of shield net excavation time
From the above table statistics, the average daily loss time is 8.89 h, and the average daily net excavation time calculation can be obtained as shown in Equation (17).
That is, in an ideal state, the calculation of the number of shield tunneling rings per day is given by Equation (18).
From Equations (18), it is apparent that the shield excavation state can be an ideal state when the number of shield excavation rings exceeds 12.08 rings per day, and vice versa is a non-ideal state.
The progress of shield excavation on the right line between the Nos.1 to 2 shield interval tunnel of the Beijing Metro New Airport Line first-phase project was analyzed, and the number of shield excavation rings per day was statistically analyzed. To simplify the amount of data, the number of tunneling rings per week is regarded as a statistical unit, that is, it can be regarded as an ideal state when the number of shield tunneling rings per week is greater than 84.56 rings/week, and vice versa is a non-ideal state. The specific statistics of the number of tunneling rings in 27 weeks are shown in Table 4.
Shield tunneling status statistics every week
Based on the data listed in Table 4, seven weeks belong to State A (ideal state), 20 weeks belong to State B (non-ideal state), the number of consecutive occurrences of State A is four, the number of weeks of continuous appearance of State B is 16, the number of weeks from States A to B is three, and the number of weeks from States B to A is three. From this, the weekly excavation status transfer of the shield can be obtained, as listed in Table 5.
Shield tunneling state transfer situation every week
Moreover, the transition probability with frequency instead of probability was calculated to obtain the formula of the continuous state A (CA) probability, as shown in Equation (19).
On the other hand, the formula for calculating the probability of transitioning from States B to A (BtoA) is shown in Equation (20).
Similarly, Equation (21) shows the formula for calculating the probability of State A transitioning to State B (AtoB).
Note that the denominator is 20-1 because the 27th week belongs to State B and there is no follow-up record. Therefore, it needs to be subtracted by one.
Equation (22) shows the formula for calculating the probability of a continuous belonging to State B (CB).
Using Equations (22), we can obtain the matrix expression of the tunnel state transition probability, as shown in Equation (23).
The first row in the matrix (0.57, 0.16) indicates that excavation this week belongs to State A, with a 57% probability of remaining in State A the following week and a 16% probability of transitioning to State B. Similarly, the second row indicates that the excavation this week belongs to State B, with a 43% probability of transitioning to State A the following week and an 84% probability of remaining in State B.
Therefore, the probability of state transition follows the n-step transfer matrix, as shown in Equation (24).
The combined with stationary distribution (π0, π1)
T
, which yields a system of linear equations, as shown in Equation (25).
The system of linear equations in Equation (25) are solved, as shown in Equation (26).
Therefore, in the long run, the proportion of States A and B is given by Equations (28), respectively.
In the long run, the probability of tunneling State A (ideal state) and State B (non-ideal state) of the first phase of the Beijing New Airport Line Project Nos.1 to 2 shield interval tunnel was 27% and 73%, respectively.
The main factor that controls the efficiency of shield excavation is the sum of the shield excavation time and segment assembly time, as stated previously in Section 4.2.1 in Equation (16).
The left line shield machine in the section between the Nos. 2 to 3 shield interval tunnel of the Beijing Metro New Airport Line first-phase project was constructed for a total of 258 days. The objective factors and special holidays were stopped for 33 days, and the actual excavation time was 225 days. The statistics of the number of shield excavation rings per day are shown in Fig. 6. Table 6 lists the collected and counted influencing factors of the net tunnel excavation time of the shield machines.

Statistics on the number of shield tunneling rings per day.
Influencing factors of shield tunneling net excavation time
Based on the statistics in Table 6, the average daily loss time is 10.67 h, and the average daily net excavation time calculation is shown in Equation (29).
In an ideal state, the calculation of the number of shield tunneling rings per day is given by Equation (30).
It can be observed that the shield excavation state can be considered to be an ideal state when the number of shield tunneling rings exceeds 10.67 rings per day, and vice versa is a non-ideal state.
The number of shield tunneling rings on the left line of the Nos. 2 to 3 shield interval tunnel were sorted out statistically, and then the shield tunneling state was obtained, which can be regarded as an ideal state when the number of shield tunneling rings is greater than 74.69 rings/week. Otherwise, it is a non-ideal state. The specific 32-week progress statistics are shown in Table 7.
Shield tunneling status statistics every week
Analyzing the data in Table 7, 17 weeks belong to State A (ideal state), 15 weeks belong to State B (non-ideal state), the number of weeks in which State A appears continuously is 11, the number of weeks in which State B appears continuously is 9, the number of weeks from States A to B is 5, and the number of weeks that transition from States B to A is 6. Therefore, the weekly excavation status transfer of the shield was obtained, as listed in Table 8.
Table of shield excavation state transitions
Equations (22) provide the matrix expression of the tunnel state transition probability, as shown in Equation (31).
Similarly, the first row in the matrix indicates that the tunneling this week belongs to State A, with a 69% probability of remaining in State A the following week and a 40% chance of transitioning to State B. On the other hand, the second row indicates that the tunneling this week is State B, with a 31% probability of transitioning to State A the next week and a 60% probability of remaining in State B.
Equations (28) are used to solve for the transfer probability after n weeks. The solution results are given by Equations (33), respectively.
In the long run, the proportion of tunneling States A (ideal state) and B (non-ideal state) of the Beijing Metro New Airport Line first-phase Project Nos. 2 to 3 shield interval tunnel is 56% and 44%, respectively.
Rail train expectation profit forecast
Based on the summary of Section 4.2.1, a table of shield excavation status transfer of the Beijing Metro New Airport Line first-phase project Nos. 1 to 2 shield interval tunnel can be established, as shown in Table 9.
Table of shield excavation state transitions
Table of shield excavation state transitions
Assuming that the shield excavation is continuous in State A, the construction duration can be reduced by three days and by one day by State AtoB or State BtoA, and the construction duration can be increased by two days if it is continuous in State B. It can increase or decrease the penalty or reward of 10,000 Yuan for one day of construction to ensure that the profit transfer table of the right line shield excavation state in the Nos. 1 to 2 shield interval tunnel can be obtained. Table 10 presents the results.
Shield excavation status profit transfer table
The transition matrix P and profit matrix R expressions for the tunneling state are shown in Equations (35), respectively.
P and R form a profitable Markov chain The recursive formula for the expected profit
The one-step expected profit calculation model is given by Equation (37).
Then, the expected profit calculation model after step k is given by Equation (38).
The transition matrix P and profit matrix R of the tunneling state is rewritten to Equation (38) to obtain the expected profit value for each period. The one-step expected profit calculation is shown in Equation (39).
From Equation (39), it can be expected to make a profit of 18,700 Yuan in the next week when the shield excavation is in state A this week. On the other hand, when it is in state B this week, it will lose 12,500 Yuan next week.
The expected profit forecast value after N weeks is calculated. The result of the 27-week expected profit forecast for the rail train soil transport mode was mapped, as shown in Fig. 7(a).

(a) Expected profit forecast for rail trains. (b) expected profit forecast for the continuous belt conveyor.
According to the data in the analysis figure, the expected profit and expected loss forecasts showed a linear upward trend as the progress of the shield excavation increases. The expected loss curve slope is greater than the expected profit curve.In addition, the expected profit and predicted loss of the shield tunnel reached the highest values by the 27th week of construction, which were 74,240 Yuan and 93,160 Yuan, respectively.
Similar to the analysis of the expected profit of the rail train, through the summary of Section 4.2.2, the table of shield excavation state transfer of the Beijing Metro New Airport Line first phase project Nos. 2 to 3 shield interval tunnel can be established, as shown in Table 11.
Table of shield excavation state transitions
Table of shield excavation state transitions
Similarly, the profit transfer table of the shield excavation state of shield interval tunnels Nos. 2 to 3 is the same as to that of the tunneling state of shield interval tunnels Nos. 1 to 2 (as shown in Table 11), and the expressions of the transition matrix P and profit matrix R of the tunneling state are shown in Equations (41), respectively.
P and R form a profitable Markov chain, and the Equations (38) can be found in the calculation of the expected profit, as shown in Equation (42).
Equation (42) shows that it is expected to make a profit of 24,700 Yuan in the next week when the shield excavation is in State A this week. Moreover, it will lose 8,900 Yuan next week when it is in state B this week.
Similarly, the expected profit forecast value after N weeks was calculated. The results of the calculation of the expected profit of the shield excavation under the continuous belt conveyor soil transport mode for 32 weeks are plotted in Fig. 6(b). According to the data in the analysis chart, the expected profit and predicted loss forecasts showed a linear upward trend as the progress of the shield excavation increases, and the expected profit and expected loss of shield excavation reached the highest values at 307,090 and 198,500 Yuan, respectively, after 32 weeks of construction.
In this study, the problem of the optimal soil transport mode of EPB shields was investigated. The Markov chain model was used to model and solve two different soil transportation modes adjacent to the shield interval tunnel of the Beijing Metro New Airport Line first-phase project. Simultaneously, the expected profit forecast of the two modes of soil transport was carried out based on the profitable Markov chain model. The following preliminary conclusions were obtained based on the solution results: The shield excavation that selects the continuous belt conveyor soil transport mode is easier to achieve and maintains an efficient and ideal excavation state compared to the rail train soil transport mode. The continuous belt conveyors transport the soil transport mode to obtain more profits the next week in the case of the current ideal excavation state. On the other hand, in the current non-ideal excavation state, the next week will lose less. The expected profit become higheras the time increases. The continuous belt conveyor gains more advantages in terms of excavation efficiency and expected profit as the tunneling distance and construction time of the shield machine increase.