
Abstract
In the wake of the wide promotion of 5G network, the era of super-high-speed networks and the Internet of Everything is approaching. Combining digital technologies led by 5G with landscape architecture has become an important way for the sustainable development of garden ecology. In order to achieve refined management of gardens and improve the accuracy and consistency of garden environmental data monitoring, this study constructs a new IoT sensor multi data fusion algorithm model. Considering the high redundancy and large error data collected by multiple sensors, this paper proposes a multi data fusion algorithm based on adaptive trust estimation and improved D-S evidence theory. The experimental data demonstrates that matched with IGA-BP, algorithm in this paper obtained the largest fitness value and the fastest convergence speed in three sensor application scenarios with different numbers of nodes. The lowest values were obtained in terms of unit energy consumption and network latency indicators. In the monitoring experiment for environmental data of landscape architecture, the algorithm obtained lower relative error and mean square error than IGA-BP in four environmental parameters of temperature, humidity, light intensity and carbon dioxide concentration. Therefore, the algorithm is effective in real-time monitoring of landscape garden environmental data, and can provide decision-making data for garden management as a reference.
Introduction
Compared with 3G or 4G mobile communication technology, 5G technology has ultra-high network speed, better network operation quality and higher operation efficiency [1]. At the same time, in the wake of the wide promotion of 5G network, the application scenarios of 5G have extended from industrial, transportation, and medical fields to gardens. Some scholars have also proposed the idea of “5G smart gardens” [2]. The application of 5G technology in landscape planning, monitoring, and management can achieve the technological upgrading and transformation of traditional gardens, thereby meeting the increasingly complex and diverse landscape needs. However, most of the current landscape architecture monitoring and management is still in the stage of manual maintenance, so it is necessary to introduce idea of interconnection of everything to ameliorate this situation. With the help of IoT technology of 5G network, real-time global monitoring of the park can be realized, and scientific and reasonable decision-making opinions can be provided through efficient and accurate information data analysis [4]. Relying on intelligent technology, a green ecological environment proprietary database based on landscape architecture can be formed, thereby realizing data visualization of landscape ecology. IoT technology using sensors has more integrated and information-based precision processing capabilities in data system management, as well as lower usage costs and higher efficiency. Therefore, this research aims to use the multi-data fusion algorithm to fully utilize the IoT technology of sensors to achieve intelligent monitoring of landscape garden environmental data.
Related work
Many scholars have done a lot of meaningful research in the field of landscape architecture or natural environment. To systematize the experience and knowledge of eight professionals working in the field of ecological landscaping, Demello and Bar ê apastore [5] analyzed detailed data through interviews and surveys, concluding that relevant experience can be used for soil and ecological research in species selection. Firdaus et al. [6] explored the study of rivers. The study demonstrated that community accountability to rivers is key to resilience. Shaghi et al. [7] studied the Golshan Garden by expressing the characteristics of Iranian gardens, and used descriptive analysis methods to study. It found that the garden is provided with fractal characteristics. Soydan [8] studied traffic and environmental relationships in the Kaleii region. This historical usage of study region was also carefully investigated. Currently, the findings suggest that protection planning is not effective in preventing deterioration. Dihua [9] paid attention to the planning and implementation of ecological restoration in the whole life cycle. In addition to the need to develop plans across administrative boundaries, the authors stressed the importance of multidisciplinary collaboration. The purpose of the study by Altunta [10] was to investigate the possibility of application in landscape design of natural native plants growing in the southeastern province of Sirt in Turkey. According to their characteristics, the possibility of their application in different landscape design fields is discussed. The results showed that more than 25% were suitable for medicinal use, more than 30% were suitable for making inflorescence beds, more than 5% were suitable for shelter plants, and 24% were suitable for natural and artificial water plants. Muthuveeran et al. [11] faced the practical challenges of Malaysia ecological garden subject. Through interviews with 24 professional landscape architects from the Klang Valley area, the content analysis method and thematic analysis method are used to interpret and summarize. It was found that project awareness of risk management helped improve project outcomes. A great deal of professors has finished a lot of meaningful findings on multi-data fusion algorithms. Gao et al. [12] proposed a multi data model for deep Intelligent training. Experiments show that the algorithm has advantages in testing large multi-dimensional complex data. Qu et al. [13] proposed a human fall detection algorithm combining human posture, support vector machine and quadratic threshold judgment. The experimental results show that the recognition rate of fall detection is 92.2%, the false detection rate is 3.593%, and the missed detection rate is 2.187%, which can better distinguish other non-fall behaviors. Wu et al. [14] proposed a compensation method on the basis of leven Berg – Marquardt algorithm. The experiment shows that this method has remarkable effect on ameliorating the precision. Liu et al. [15] proposed three improved algorithms. The records show that these streamlined algorithms can improve the correctness of the support vector regression machine under the condition of faster operation speed. Belov and Denisova [16] studied the impact of fusion on image thematic classification as the spatial and spectral resolution of the data increases. The findings show that for SVM methods, fusion is not desirable. Feng et al. [17] designed a liquefied gas tank leakage explosion-proof control system based on data fusion. The data shows that this method has the advantage of low energy consumption.
To sum up, scholars mainly conduct research on natural ecology such as landscape architecture through structured interviews or literature analysis, while few researchers use digital technology. In addition, when scholars apply multi-data algorithms, they are mostly used in scenes such as human motion or UAV navigation, and rarely combine other landscape architectures. Therefore, this paper aims to propose a new multi-data fusion algorithm to realize real-time monitoring of garden environmental data.
Landscape architecture monitoring model based on multi data fusion algorithm
Multi-sensor data algorithm based on T-NN
In the data fusion problem, it is very important to perfect the robustness, because sound effects of data fusion are directly related to the monolithic skeleton frame quality. For smart landscape architecture with multiple sensors, how to combine the redundant information of sensors according to reasonable rules becomes the main point of the problem. Figure 1 is a sketch map of the sensor transmission fusion model.
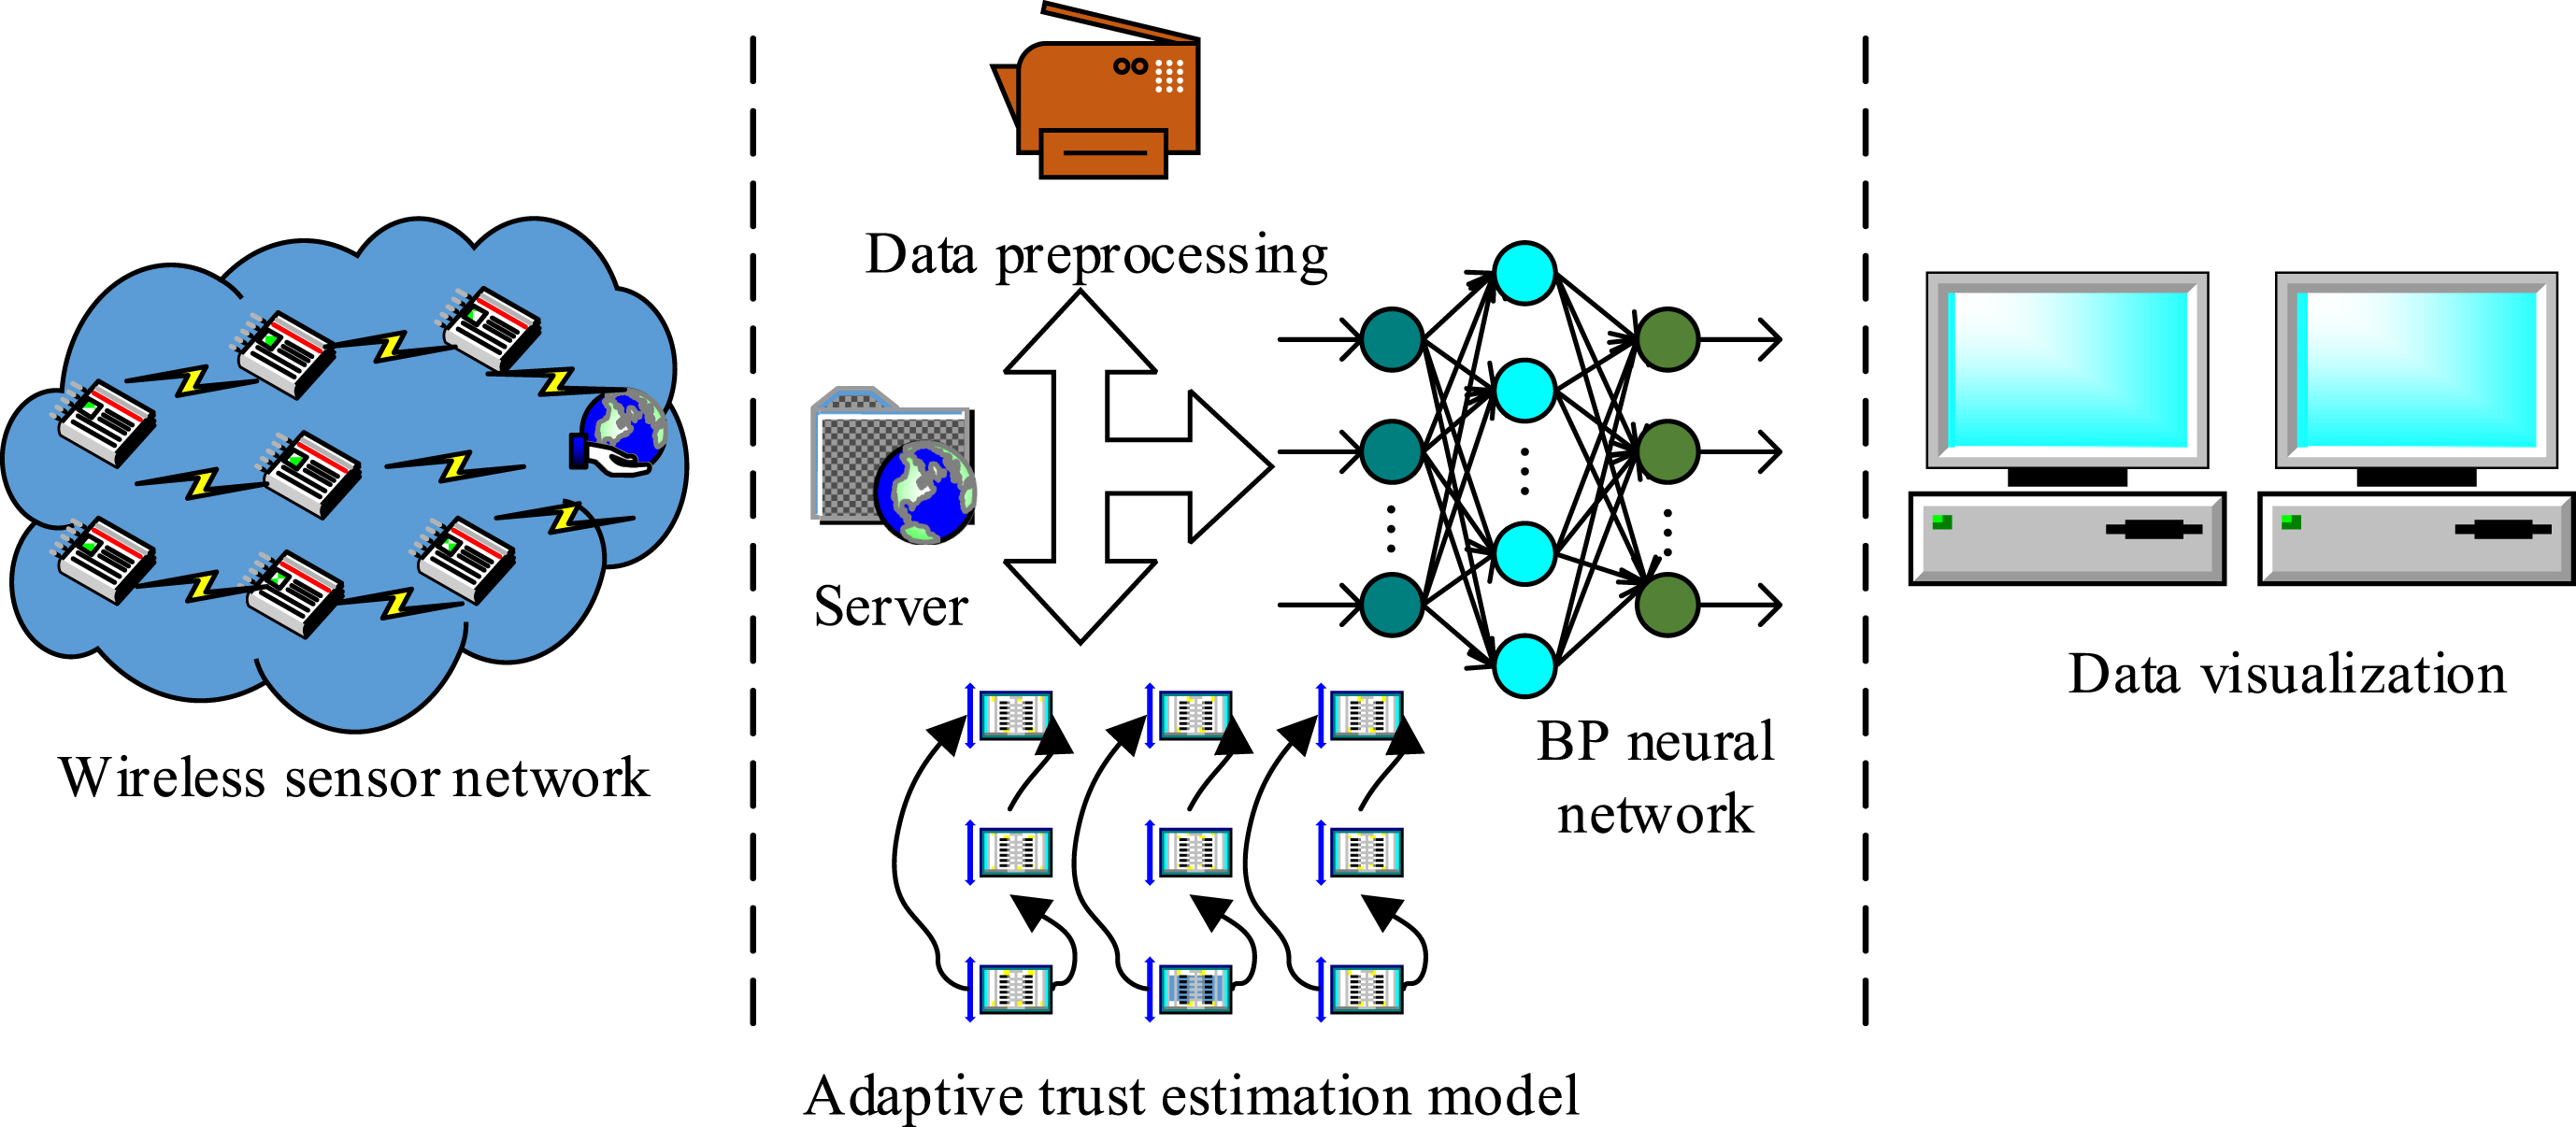
Schematic diagram of multi-sensor data fusion model.
In the light of Fig. 1, the model is mainly composed of data preprocessing, self-adaption trust evaluation and BP neural network. Among them, record preprocessing is operated by exponential smoothing method, and the purpose is to remove noise and heighten the steadiness. The self-adaption trust evaluation link includes the generation of the trust matrix, which calculates the trust relationship between each data through the introduction of the node trust model. The BP neural network trains and processes the data obtained after the adaptive estimation process. The purpose is to compare the data output value with the expected data output value, and obtain high-precision and high stability fusion data under the adjustment of weighting factors [18, 19]. Equation (1) is the mathematical equation of exponential smoothing method.
y t in Equation (1) represents the initial data column. S t represents the value processed by the smoothing operation. The α value is between [0, 1], which is used to balance the old and new data. When the α value is close to 1, it means that only the current data point is retained, and if the α value is close to 0, it means that only the previous smoothed value is retained. As a result, data observation value has an impact on the smooth value, the choice of coefficient is very important. Figure 2 shows the adaptive trust estimation model.
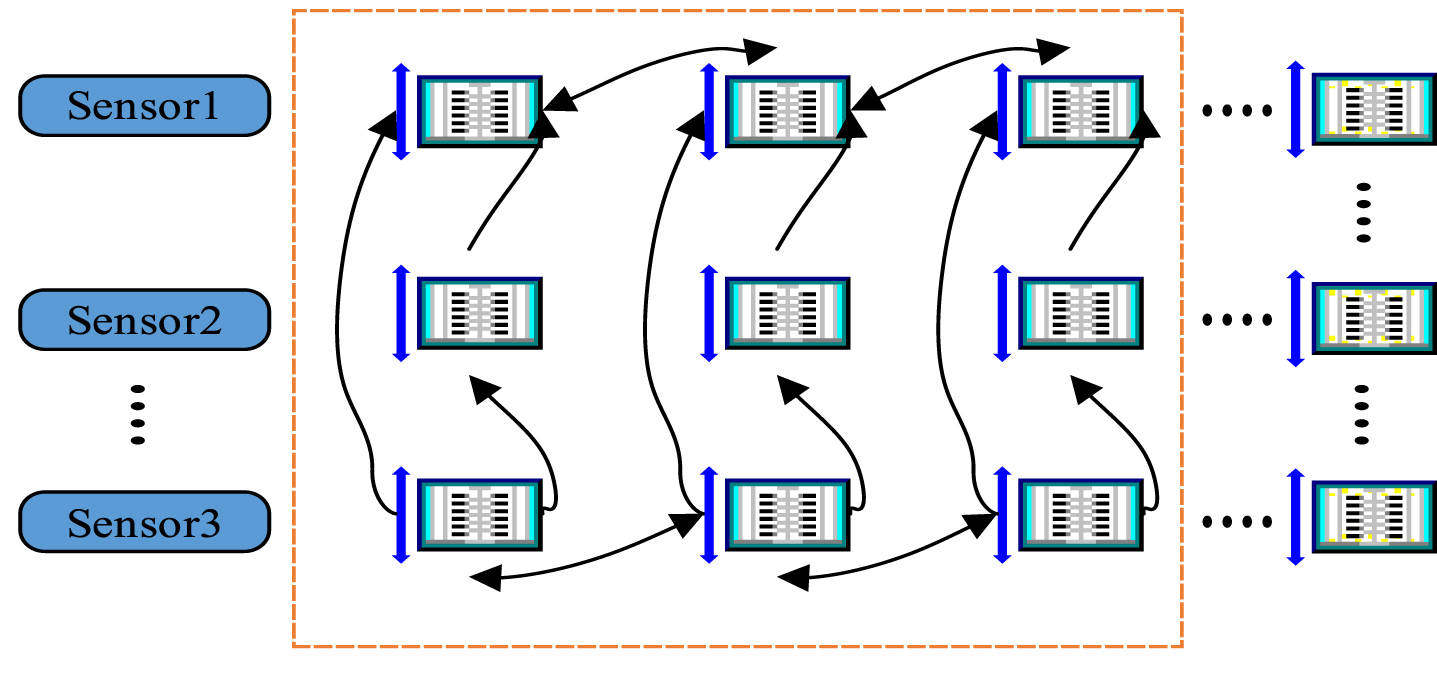
Adaptive trust estimation model.
From Fig. 2, the model needs to compute the trust degree among the data of each node. The trust function is defined as e ij , and 0 ⩽ e ij ⩽ 1. Assuming that the trust function satisfies the e ij = f (|x i - x j |) mapping relationship, and i, j = 1, 2, …, n, then self-adaption trust evaluation can be specifically expressed as a piecewise function shaped as Equation (2).
In Equation (2), N refers to the upper limit of the fusion data, which belongs to the preset value. The sum x
i
of x
j
refers to the t
o
sensor node and the preprocessed value of the sensor node e
ij
= 1 at the moment i. At that time, it means that the i-th node absolutely trusts the j-th node. If e
ij
= 0, at this time, it means that the two nodes i and j belong to a non-trust relationship. In order to avoid the phenomenon of data omission that may occur D
ij
when the trust degree is equal to zero, the average value of trust estimation among the data in the time period is introduced, denoted as e
ij
, its mathematical expression is Equation (3).
m in Equation (3) means that the data D
ij
was collected in this time period, and the m value range is also between 0 and 1. At the same time, in order to continuously measure the m trust degree between nodes at each sampling time, a decay factor w is introduced. Its variation rule satisfies Equation (3), and the calculation equation of the trust degree m of each sampling corresponding to the sub-sampling is Equation (4).
Equations (4) and (5) fully illustrate the correlation between time and trust. If the collected data is closer to the current time, the trust effect value will be larger, otherwise, it will be smaller, which will help to improve the algorithm’s performance to a greater extent. Dynamic adaptability, more objectively calculate the trust degree between sensors, and can better avoid the negative impact of data sampling value distortion caused by too long measurement time. The trust estimation matrix can be expressed as Equation (6).
In Equation (6), the d ij degree of trust is expressed. For self-adaption trust evaluation, the trust limit needs to be set in advance. When there is a certain sensor node whose trust calculation value is superior than the trust limit, it means that the sensor is in a regular working condition. However, if the calculated value of the trust degree of a certain sensor node is smaller than the trust limit value, it indicates that the sensor belongs to the fault operation state. Therefore, the diagnostic and detection function of the sensor in the landscape garden is realized with the help of this model [20, 21].
The data-oriented landscape architecture intelligent monitoring system has become the mainstream. However, the system has nonlinear and strong time-varying characteristics. To increase the accurate monitoring of the environmental parameters of landscape architecture and provide decision-making data for management and operation, the T-NN algorithm is combined with the improved DS evidence theory to deal with different environmental conditions. Figure 3 is a flow chart of the fusion model.
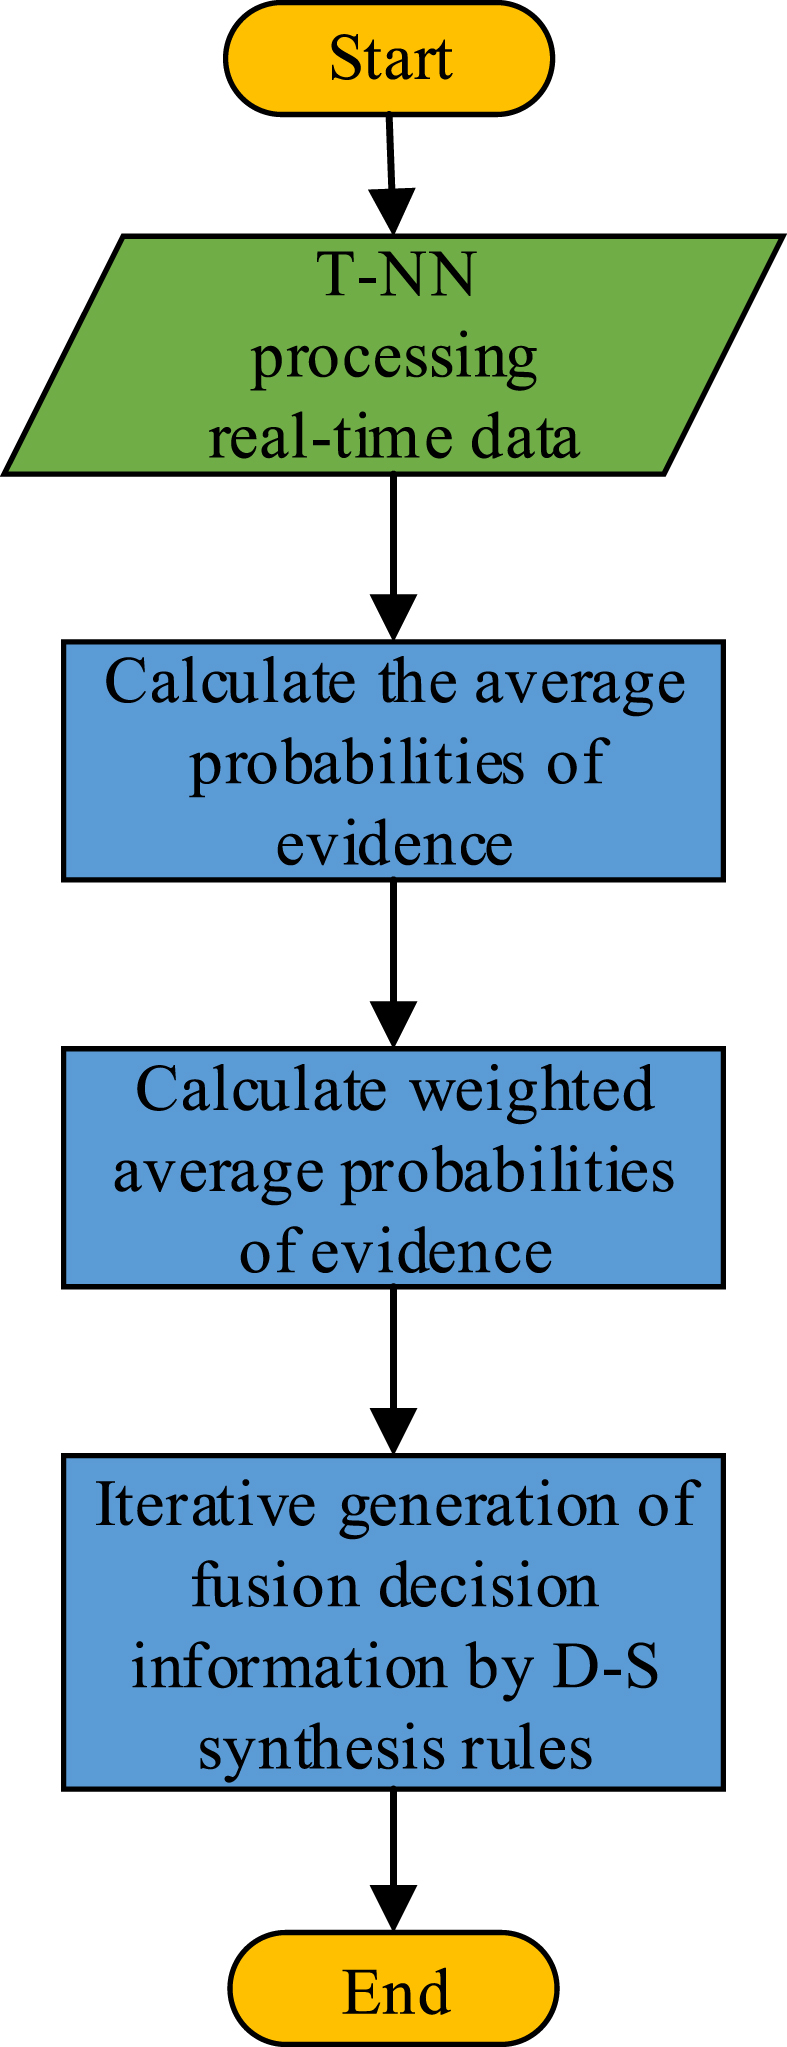
Flow chart of fusion model.
After the data is reckoned to acquire the trust value between nodes, the BP neural network is introduced to fuse the statistics. BP neural network belongs to the multi-layer feedforward training network and has the function of error back propagation. For training the network, it is necessary to input and output a large amount of data in advance to obtain weights. Assuming that the quantum of nodes in the input layer of the BP neural network is n. Since this paper studies the IoT process of the landscape garden, n refers to the number of sensors installed in the garden at this time. The quantum of hidden layer nodes W ij is set as L, the input sample is set as X i (i = 1, 2, …, n), the output data is expressed as Y i (i = 1, 2, …, m), the expected output value is set as C k . The weight coefficient between the hidden layer and the output layer θ is W jk , and the bias between the hidden layer and the output layer is set to γ. Equation (7) represents the type of activation function selected for the study.
In line with equation (7) that the sigmoid activation function is selected in the study. Equation (8) is the error equation of BP neural network.
In Equation (8), O
k
represents the output value. When the weight coefficient W
ij
and the threshold are both the minimum value, the network training ends. The data set outputted by the BP neural network can be stored in the cloud table as the result of data fusion to realize visual data monitoring. Considering the accuracy of the first data fusion, it needs to be optimized through the global decision based on the improved DS theory. DS theory belongs to the extension of Bayesian theory, and its characteristic is that it can express and combine uncertain information, so as to better solve the combination problem of fuzzy information and uncertain information. Figure 4 shows the information fusion process via DS evidence theory. The information fusion reflected in Fig. 4 includes several parts, including recognition framework, independence judgment, probability distribution, and combination and decision-making based on rules. Assuming that the number of evidences is n, the identification frame is set to μ, and the probability distribution function of each evidence is recorded as
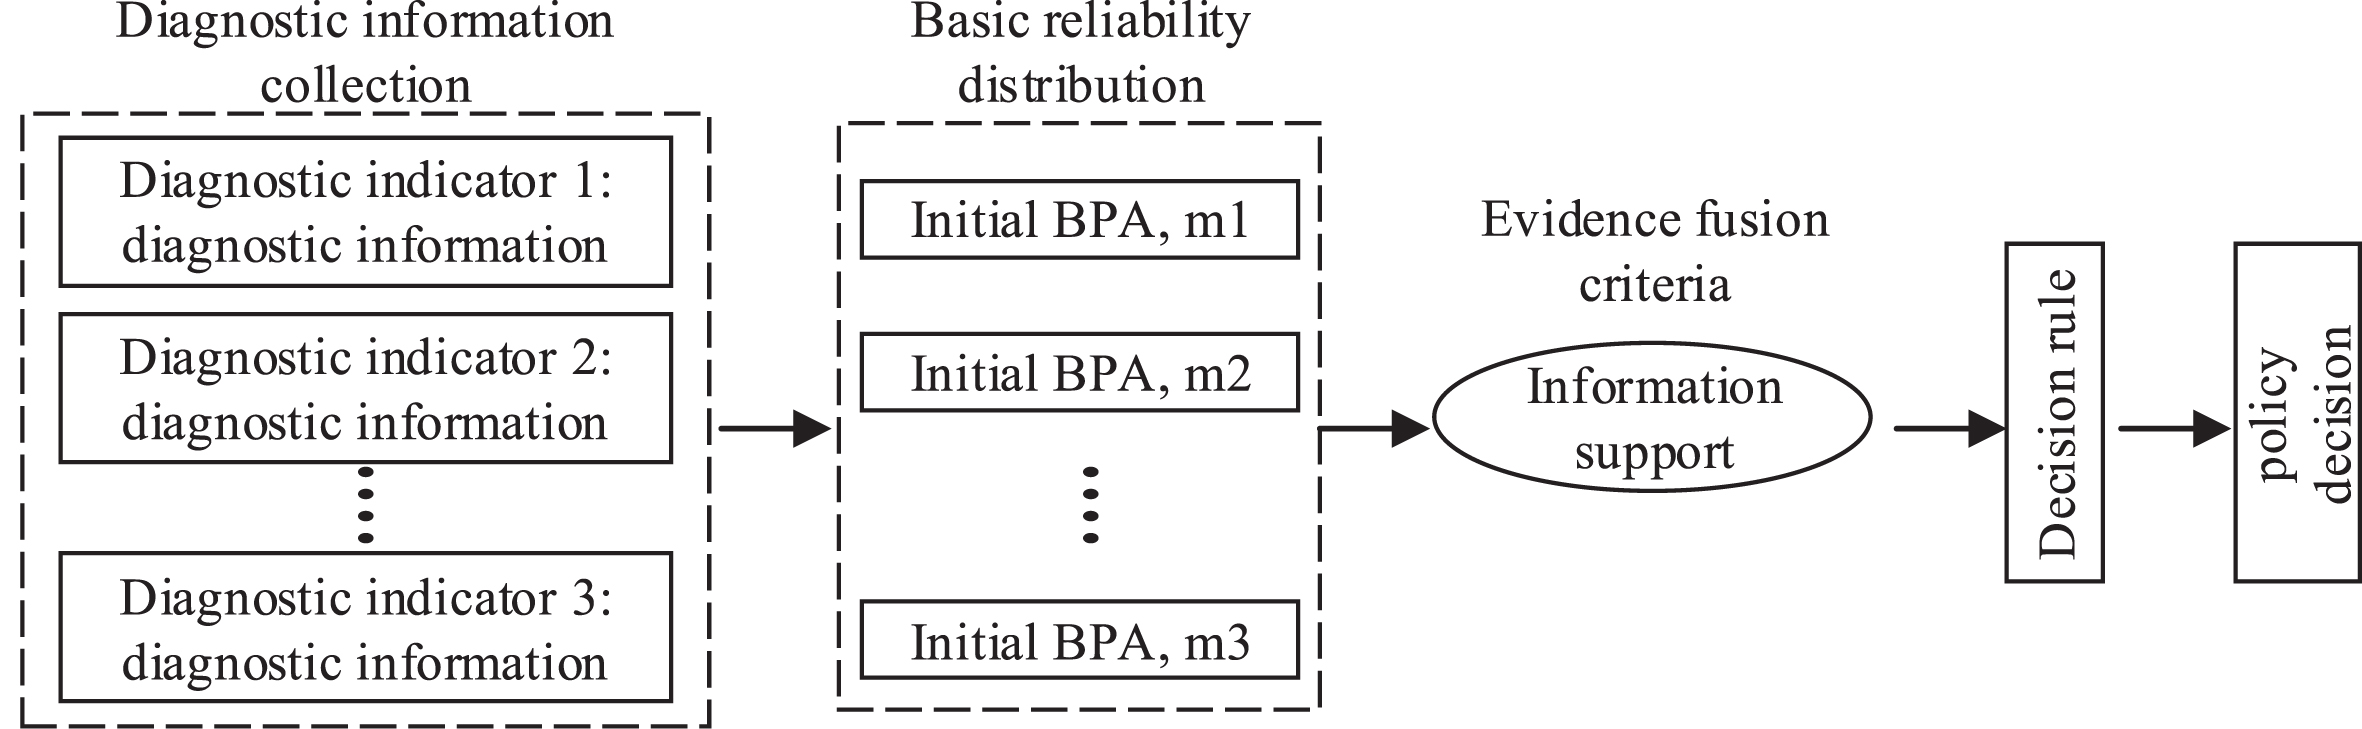
Information fusion process of DS evidence theory.
In Equation (9), k represents the conflict coefficient, which can be used to represent the inconsistency of each evidence for a certain proposition. The larger the value of the conflict coefficient, the less uniform the evidence supports for the proposition. When the conflict coefficient is 1, it means that the evidences are in a state of complete conflict, and the combination rule is invalid at this time. The mathematical expression of the conflict coefficient is shown in Equation (10).
A
i
in Equation (10) represents the evidence focal element. Considering that the effect of data fusion is not good when the evidence is in a high conflict state, the DS evidence theory needs to be improved. Improvements for high conflict evidence can be done as follows. The Equation (11) and the Equation (12) are the calculation expressions of the average evidence probability and the calculation equation of the average evidence distance.
In Equations (11) and (12),
Performance test of T-NN and improved DS evidence theory fusion algorithm
This research tests and verifies T-NN and improved DS evidence fusion algorithm from three algorithm performance evaluation levels: maximum fitness, whole network energy consumption and whole network delay. And the algorithm was compared with IGA-BP fusion algorithm and GA-BP. The experiment selected a Jiangnan landscape garden and 200m × 200m randomly installed sensors for testing. The communication radius of the sensor used in the experiment is 80 m, and the number of nodes is between 10 and 100. Matlab software was used to verify the superiority of the algorithm. Figure 5 shows the simulation results of maximum fitness under three experimental scenarios of 25 sensors, 50 sensors and 75 sensors.
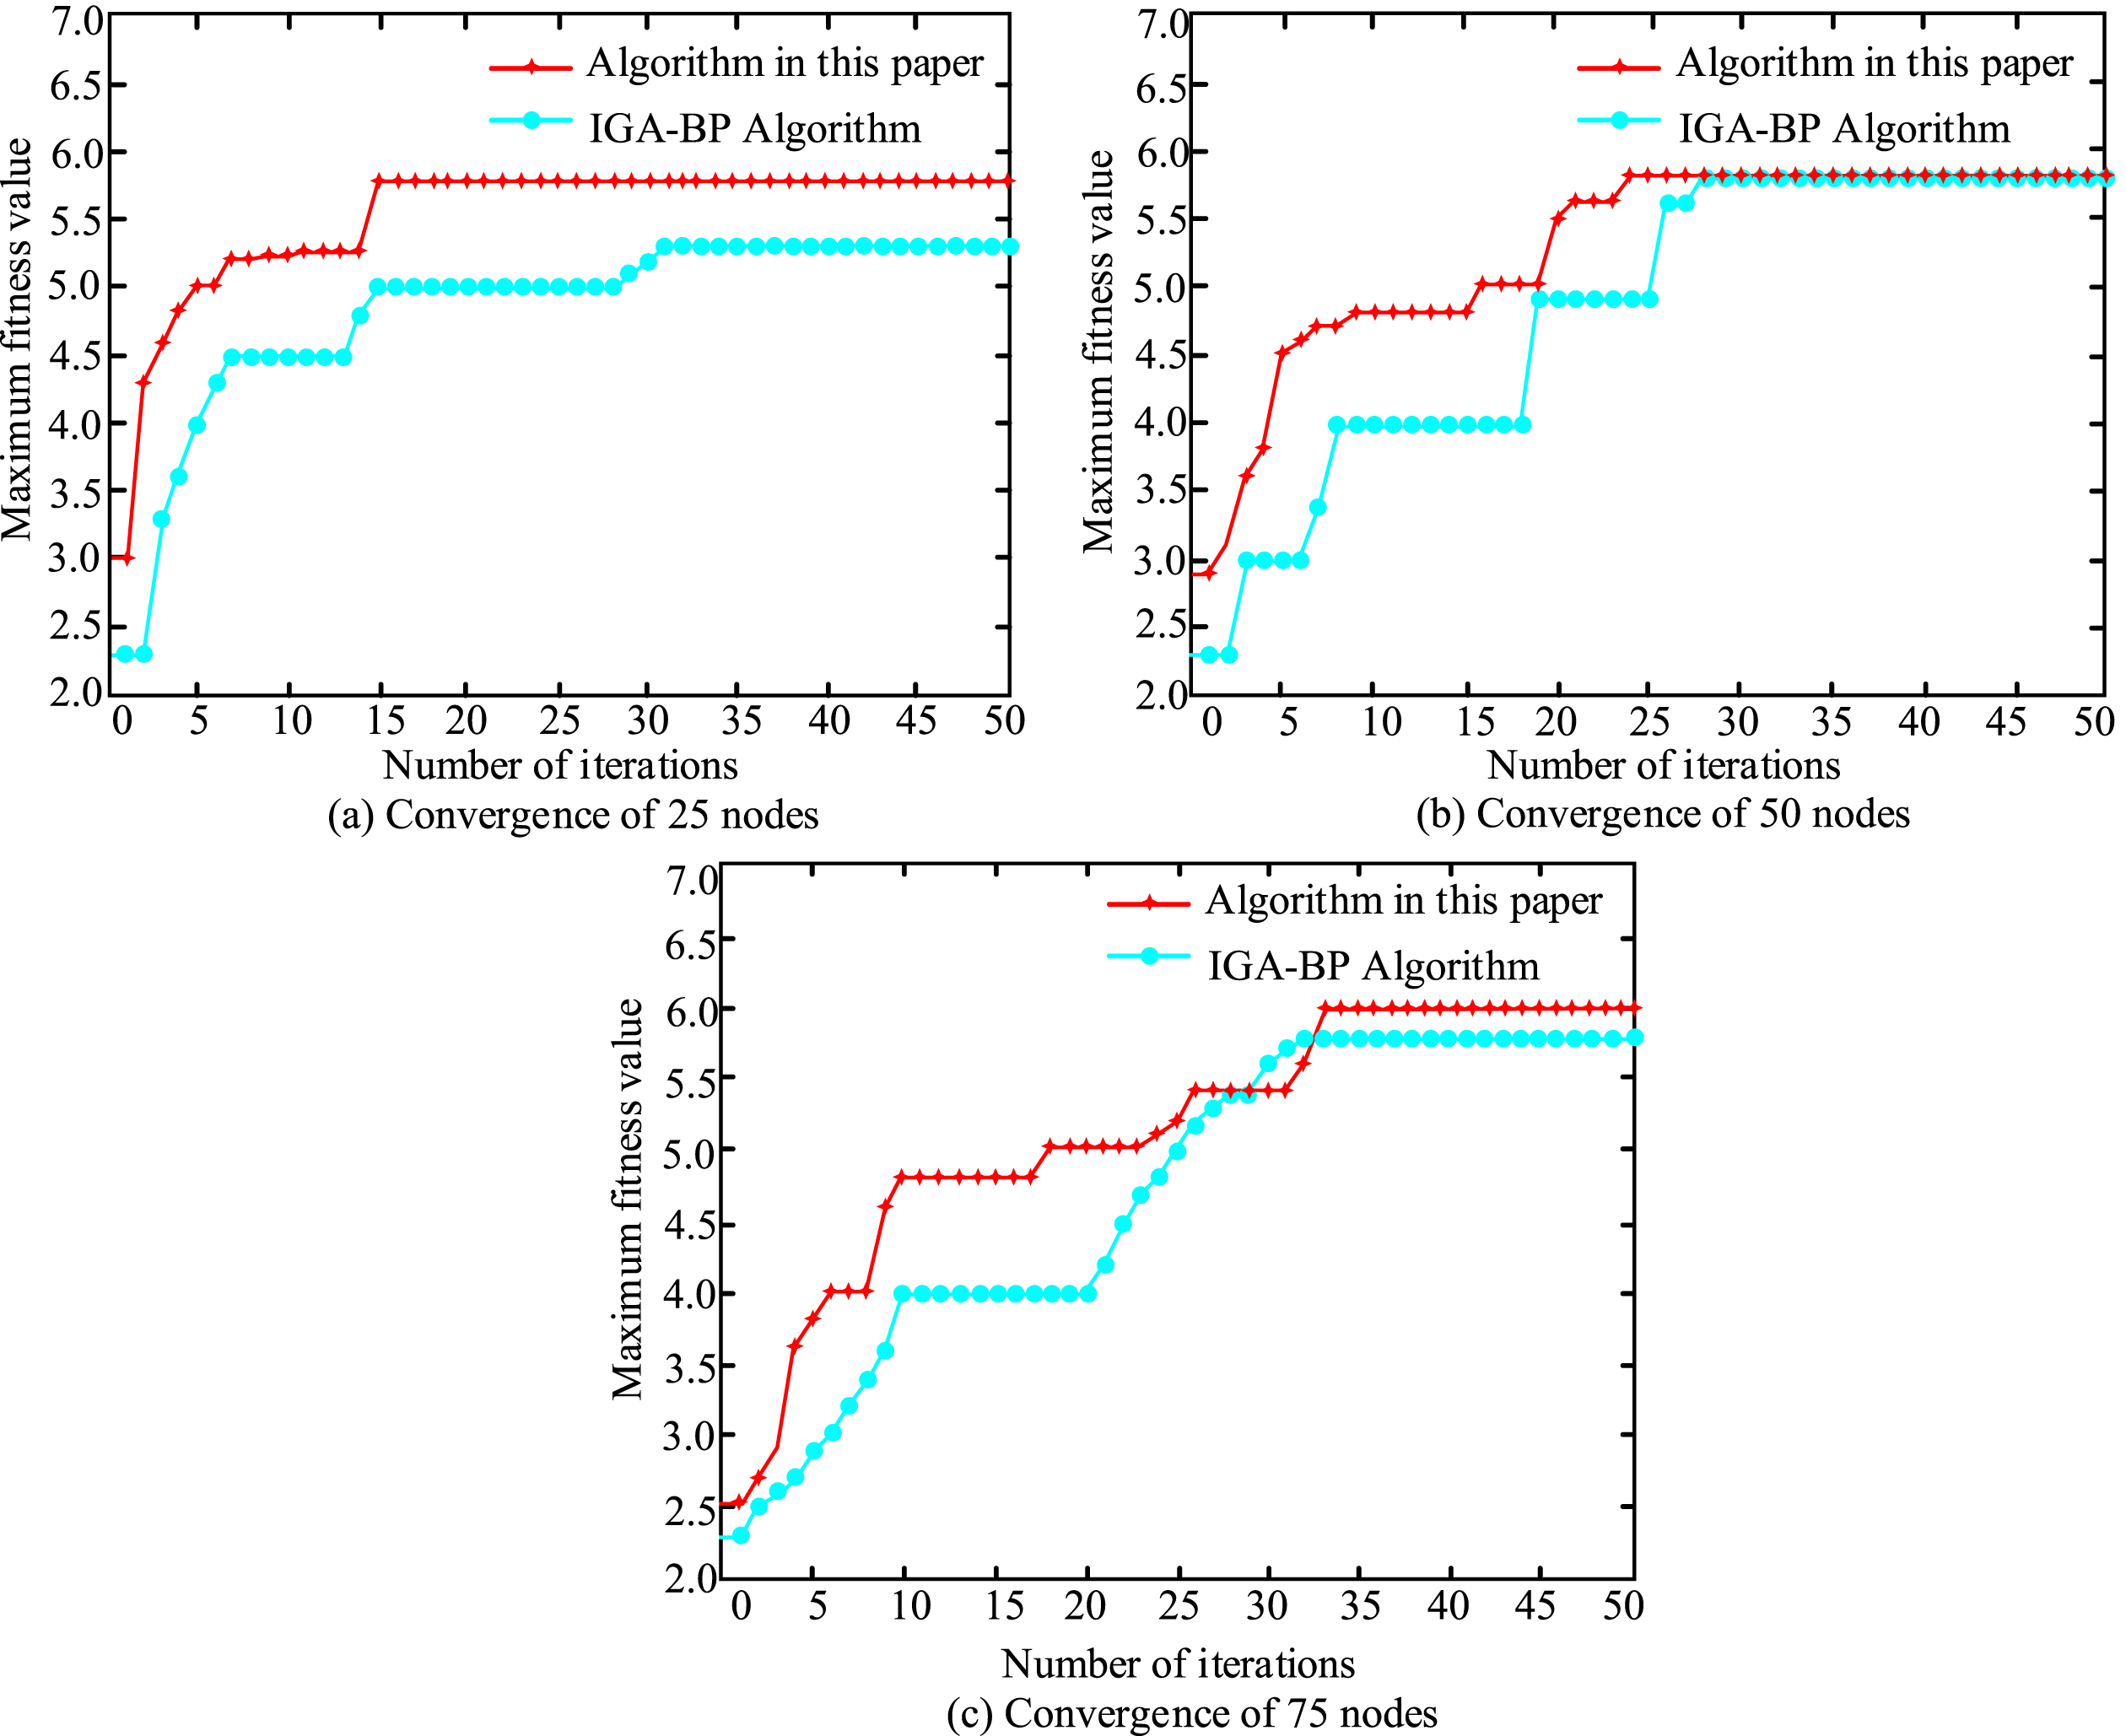
Simulation results of maximum fitness under three experimental scenarios.
It can be seen from the maximum fitness value of the algorithm corresponding to the number of iterations in Fig. 5. Regardless of the number of sensor nodes, fusion algorithms based on T-NN and improved DS evidence theory, as well as IGA-BP fusion algorithms, will increase the number of nodes and iterations. It can be successfully converged, which shows that the two algorithms are feasible and effective in the sensor application for the collection of environmental parameters of landscape architecture. Figure 5(a) corresponds to the experimental scenario of 25 sensor nodes. In this scenario, the fusion algorithm of T-NN and improved DS evidence theory achieves convergence when the quantity of iterations is 15, and the corresponding maximum adaptation is 5.7. The IGA-BP fusion algorithm achieves algorithm convergence when the number of iterations is 31, and the maximum fitness value is 5.3. Therefore, when the number of sensor nodes is 25, the fusion algorithm used in the study obtains faster algorithm convergence speed and higher algorithm accuracy, and the maximum fitness value is 0.4 higher than that of the IGA-BP algorithm. Figure 5(b) corresponds to the experimental scene of 50 sensor nodes. In this scene, although the two algorithms obtain the same maximum fitness value, which is 5.75, the fusion algorithm proposed in this study can reach 24 iterations when the number of iterations is 24. The IGA-BP algorithm requires 27 iterations to converge. Figure 5(c) is an experimental scene of 75 sensor nodes. In this scene, the two algorithms have the same convergence speed, but the algorithm proposed in this study has higher algorithm accuracy. In terms of the maximum fitness value, the algorithm is better than IGA-BP, 0.3 higher than that. Figure 6 is a graph showing the unit energy consumption and the average network delay curve corresponding to different sensor node numbers for the four algorithms.
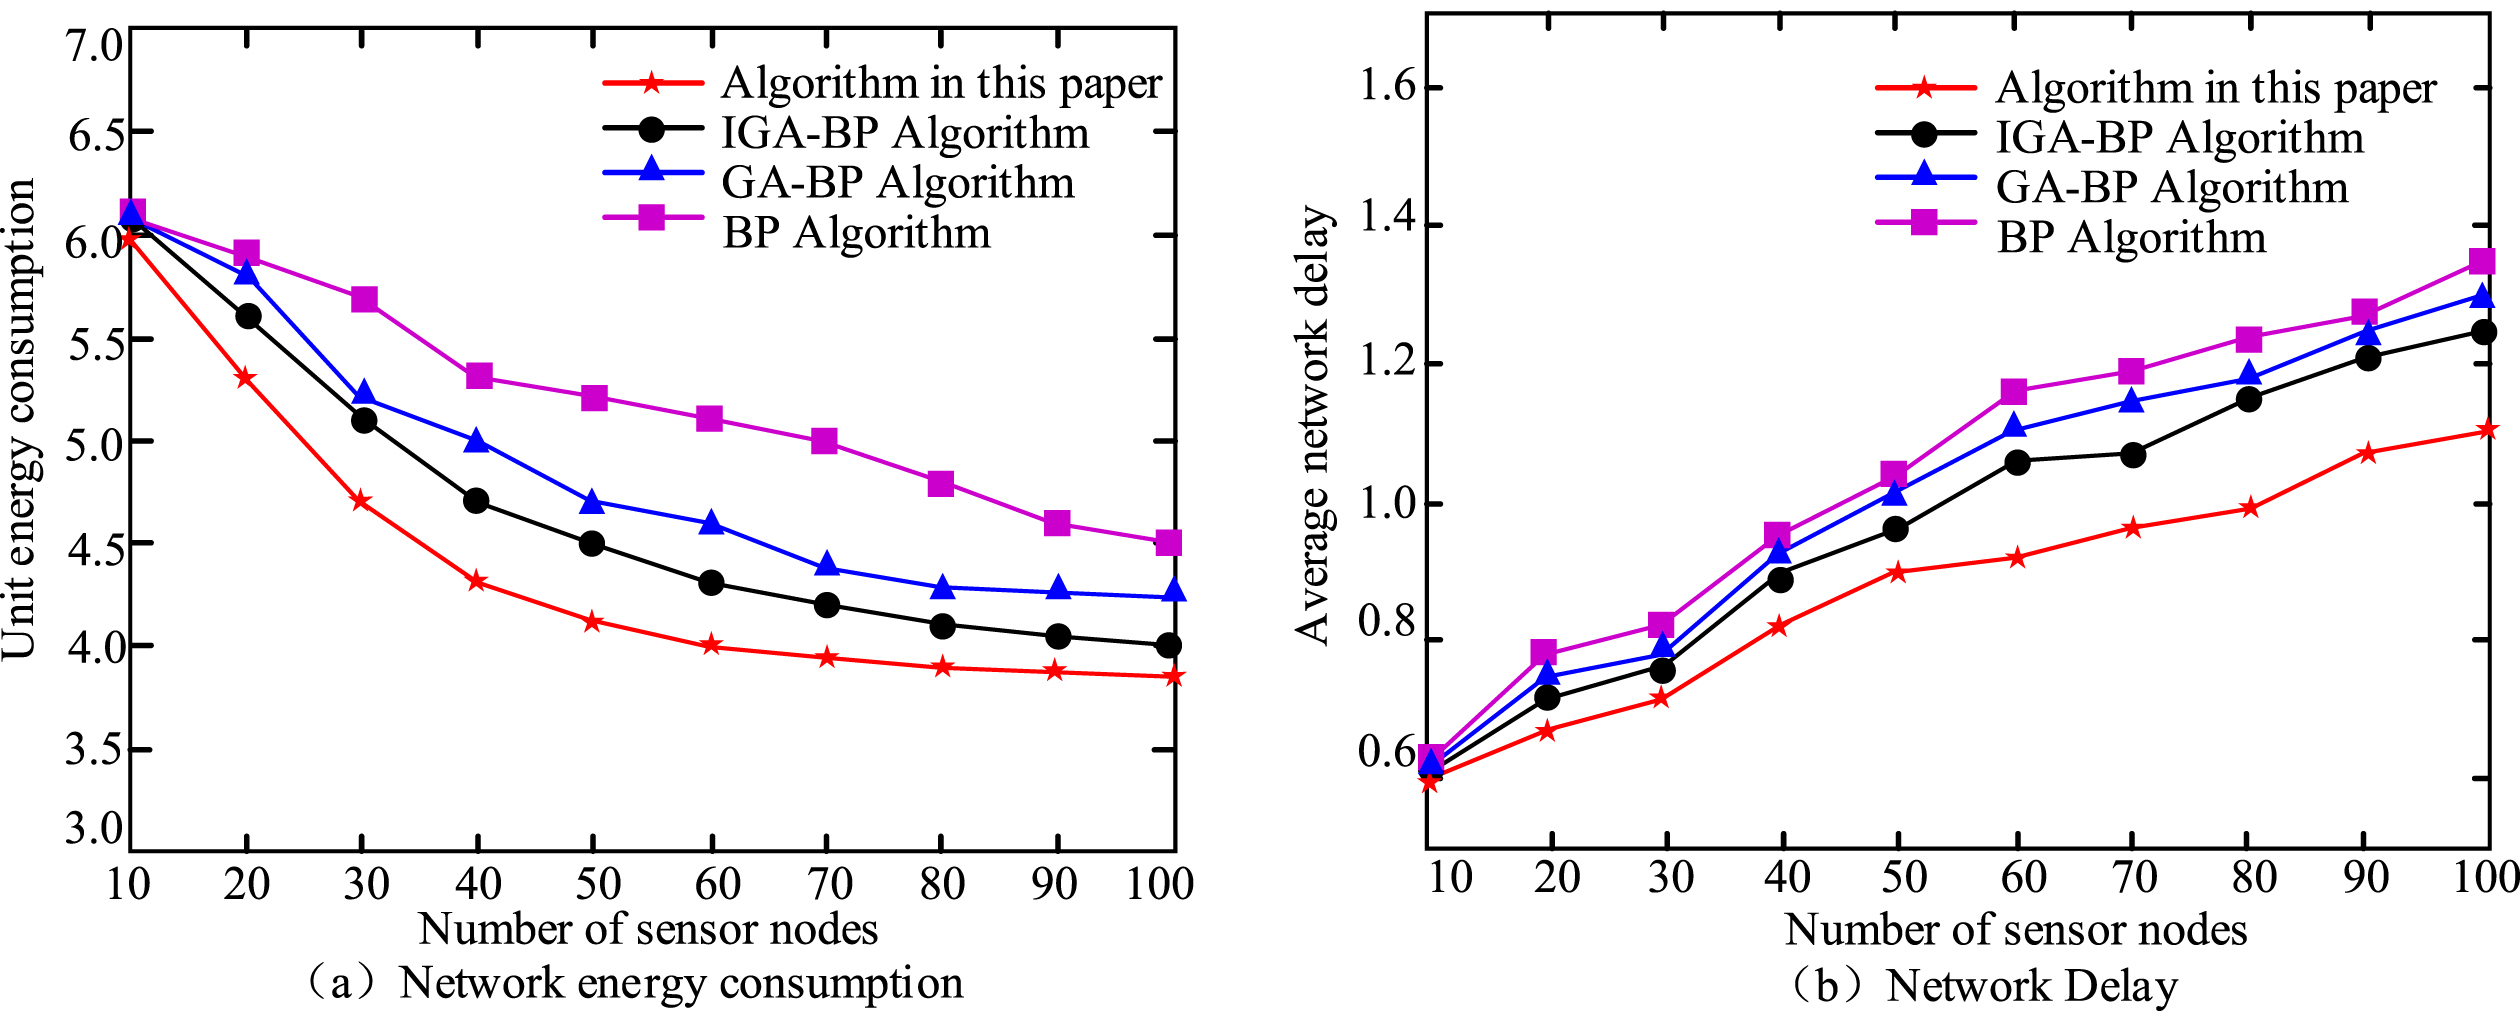
Graph of unit energy consumption and network average delay corresponding to different sensor nodes of the four algorithms.
From Fig. 6(a), energy consumption of the four algorithms decreases with the raise of quantity of sensor nodes, but energy consumption of T-NN and ameliorated DS theory fusion algorithm decreases the fastest. When the quantity of sensor nodes is 50, the energy consumption decreases the fastest. The fusion algorithm reduced the unit energy consumption value from 6 to 4.1, ultimately achieving a minimum unit energy consumption of 3.9. The IGA-BP algorithm has the second lower rate of decrease. When the quantum of sensor nodes is 50, the unit energy consumption drops from 6.1 to 4.5, and finally the unit energy consumption value of 4.0 is obtained. Comparing the two, the multi-data fusion algorithm proposed in this study also reduces the unit energy consumption by 0.1. And it is the lowest among the four algorithms. This fully shows that the fusion algorithm can better improve the network performance, thereby extending the life cycle of the entire network. From Fig. 6(b), when the number of sensor nodes increases from 10 to 100, the average network delay of the four algorithms increases, but the multi-data fusion algorithm proposed in this study has the lowest average network time delay. The extension value is 1.1. The index is ranked from small to large as T-NN and improved DS evidence theory fusion algorithm, IGA-BP, GA-BP and BP algorithm, and the corresponding 100-node delay values are 1.1, 1.23, 1.3 and 1.35, respectively. Therefore, the algorithm proposed in this study reduces the average network delay by 0.13 compared with the IGA-BP fusion algorithm. Figure 7 is a graph showing the result of exponential smoothing.
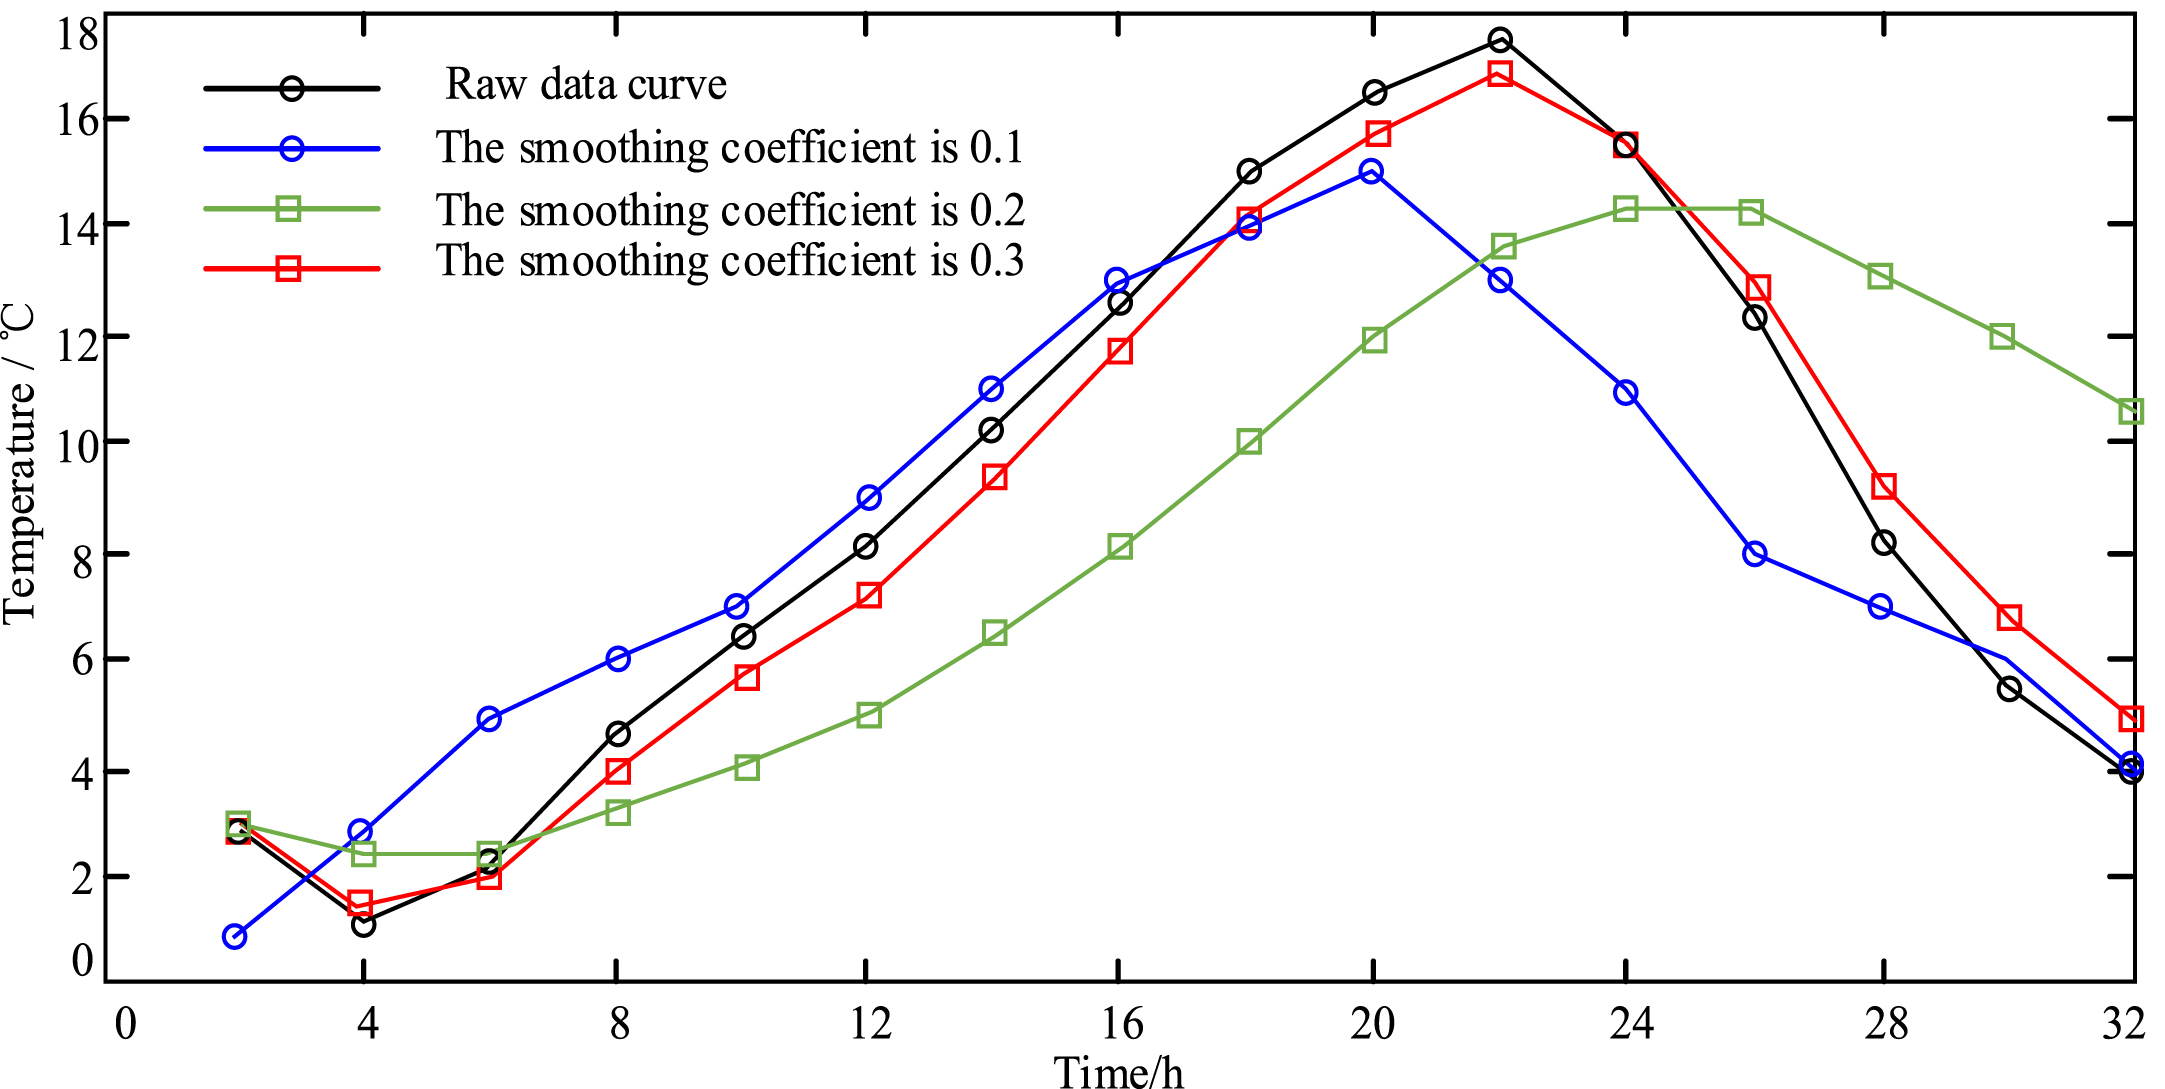
Exponential smoothing result chart.
In line with Fig. 7 that the initial temperature data without data preprocessing has great fluctuation characteristics, but the temperature value curve tends to be smooth after three smoothing exponential operations. When the α value is 0.2, the fluctuation of the temperature curve is improved to the greatest extent, and the smoothness obtained is better. But its defect is that it has a relatively obvious hysteresis deviation. When the α value is 0.1, the fluctuation improvement and hysteresis are both better. When the α value is 0.3, the volatility improvement is poor. Therefore, it can be concluded that α a value of 0.1 is the most suitable value [24, 25].
The collection task of landscape architecture environmental data mainly starts with four parameters: temperature, humidity, light intensity and carbon dioxide concentration. The IGA-BP is used as a comparison algorithm to verify the effectiveness and accuracy of data monitoring of the algorithm. Table 1 is the sensor sampling data table under the two algorithms at a certain time in the morning.
Sensor sampling data table under two algorithms at a certain time in the morning
Sensor sampling data table under two algorithms at a certain time in the morning
In Table 1, the multi data fusion algorithm used in the study obtained more accurate sampling values for data monitoring at a certain time in the morning. The sampling values of the four environmental parameters of temperature, humidity, light intensity and carbon dioxide concentration are 29.32°C, 77.6%, 2610 lx and 426.7 ppm, respectively, and the corresponding relative errors compared with the real values are 0.61%, 0.28%, 1.24% and 0.16%. The sampling data of the IGA-BP algorithm are 28.56¡æ, 76.32%, 2715 lx and 424.28 ppm, respectively, and the corresponding relative errors are 3.18%, 1.90%, 5.35% and 0.40%. Compared with the two algorithms, the algorithm used in this study obtained smaller relative errors, which were 2.57%, 1.62%, 4.11% and 0.24% lower than the relative errors of the IGA-BP algorithm on the four environmental parameters, respectively. Figure 8 is a comparison chart of the mean square errors corresponding to the four environmental parameters under the two algorithms.
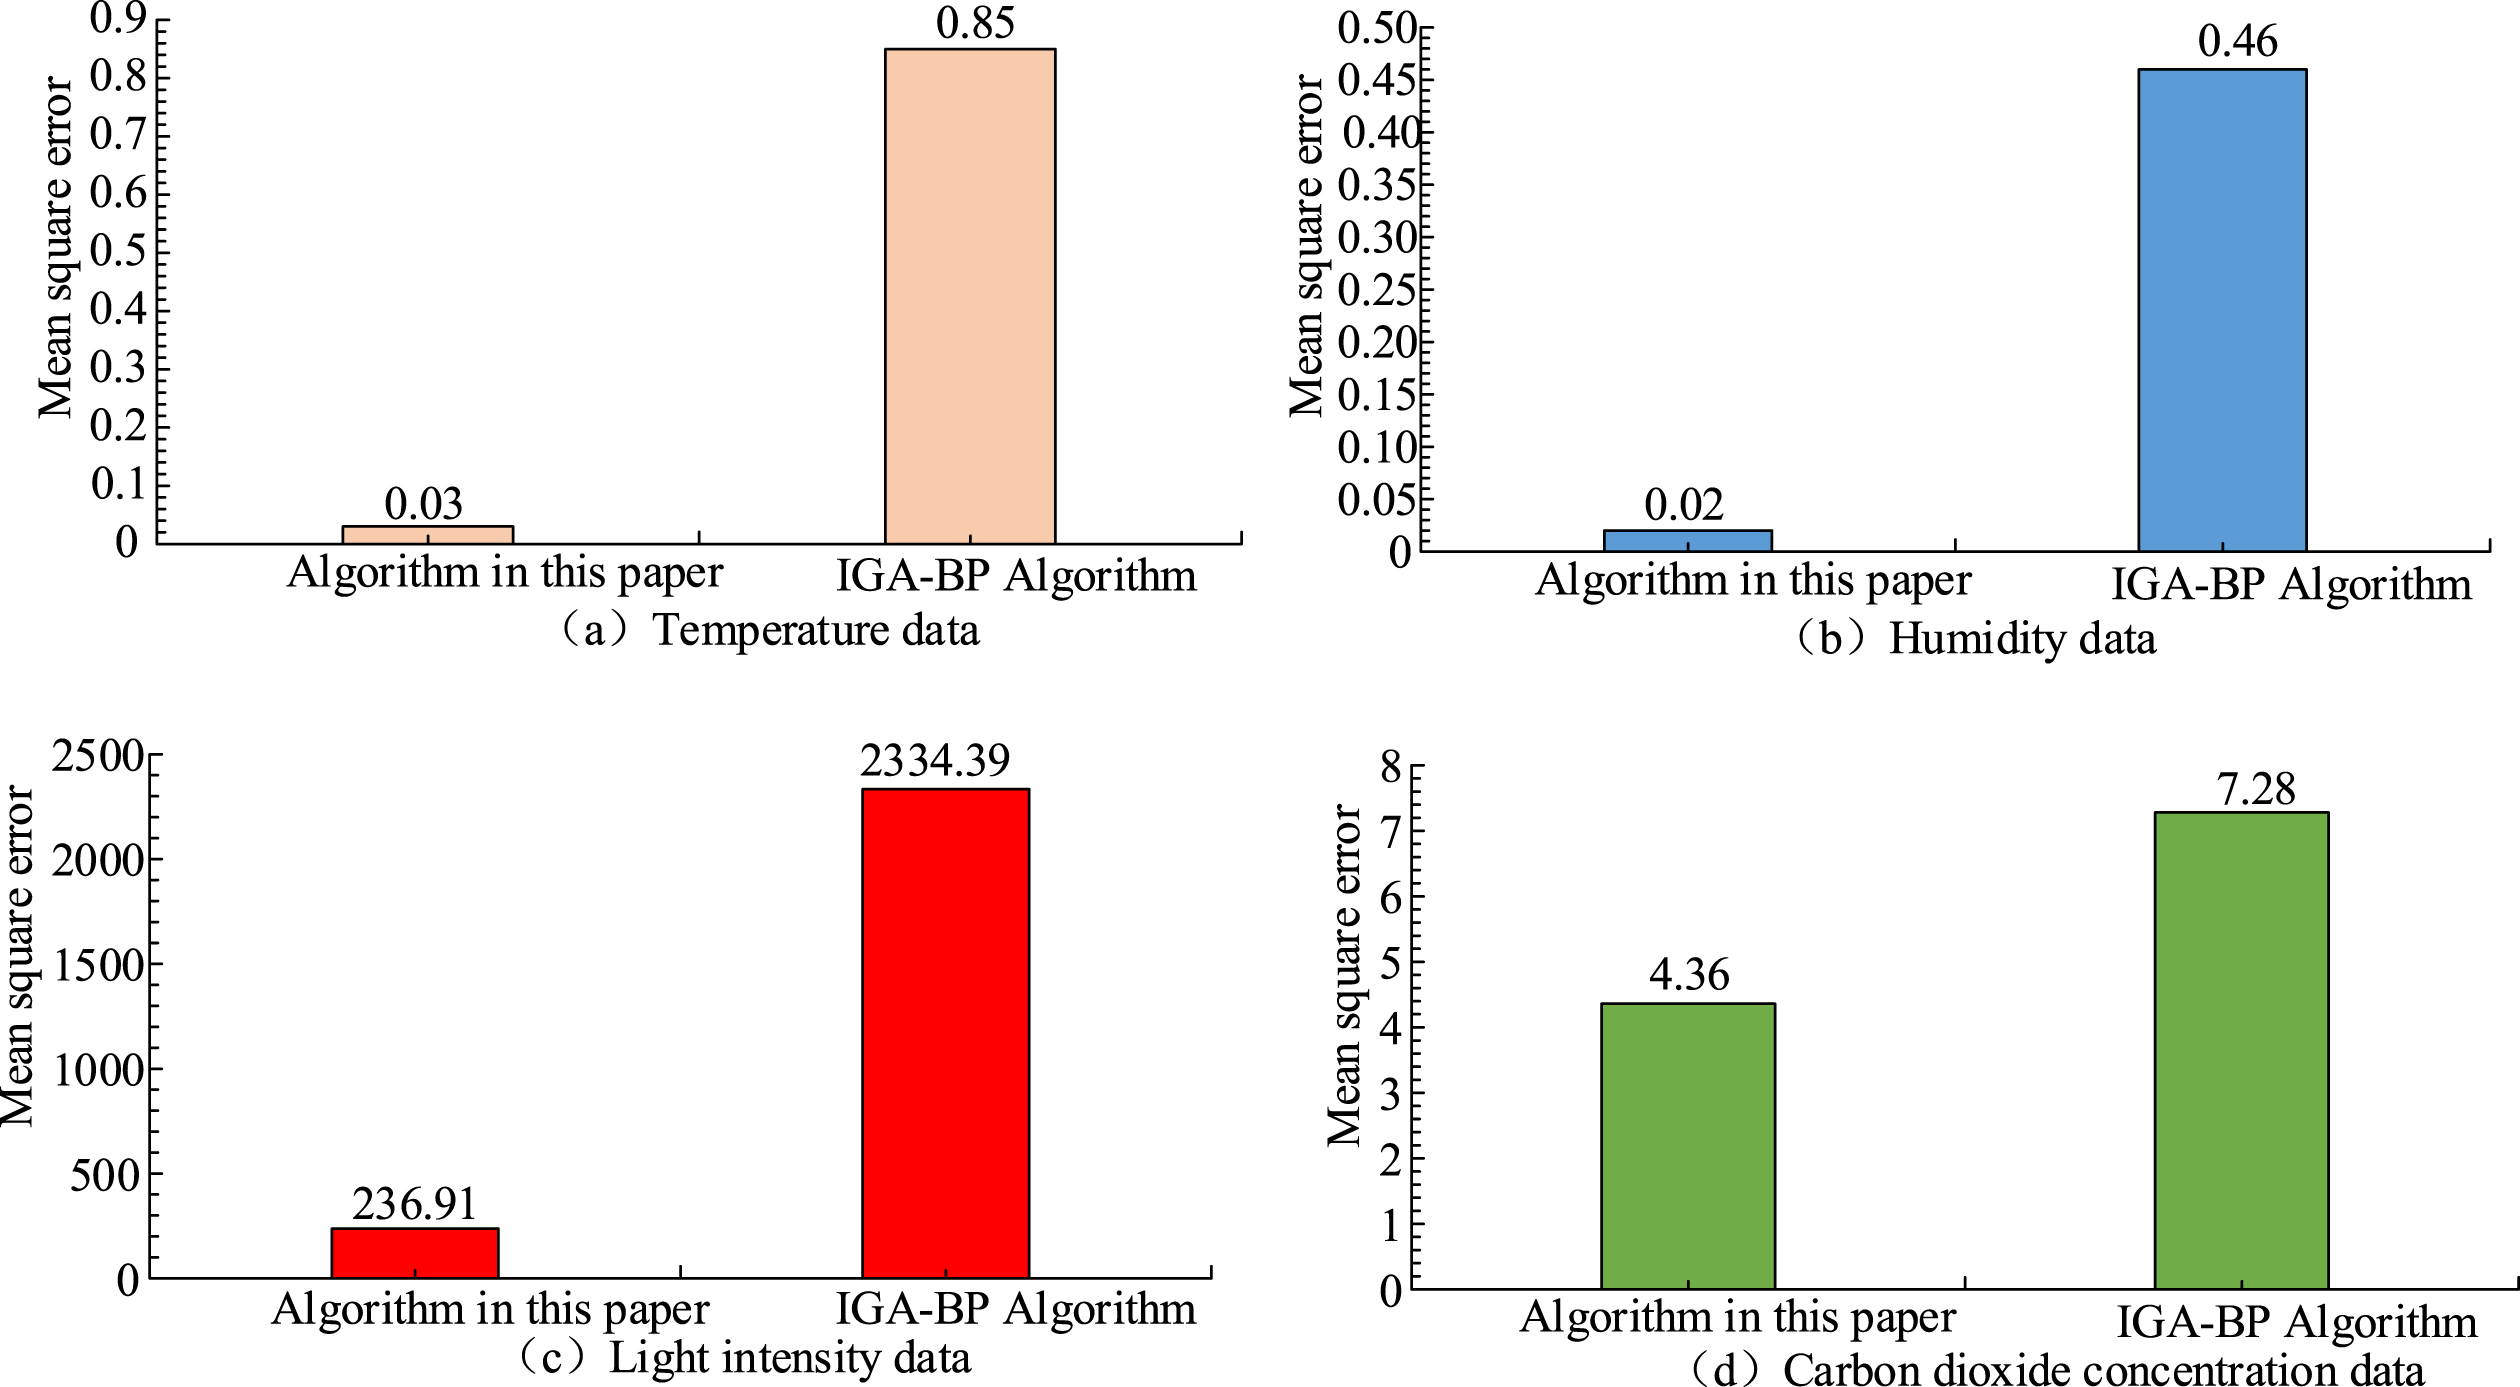
Comparison of mean square error corresponding to four environmental parameters under two algorithms.
Figure 8 reflects the mean square error of the two data fusion algorithms on the sampling of four environmental parameters. The corresponding mean square errors of the fusion algorithm used in the study on temperature, humidity, light intensity and carbon dioxide concentration are 0.03, 0.02, 236.91 and 4.36, respectively. The mean square errors corresponding to the IGA-BP algorithm are 0.85, 0.46, 2334.39 and 7.28. The comparison shows that the data fusion algorithm used in this study is 0.82, 0.44, 2097.48 and 2.92 lower than the IGA-BP data fusion algorithm. Figure 9 is a graph showing the sampling results of four environmental data of temperature, humidity, light intensity and carbon dioxide concentration in one day by the sensor set up in the experiment.
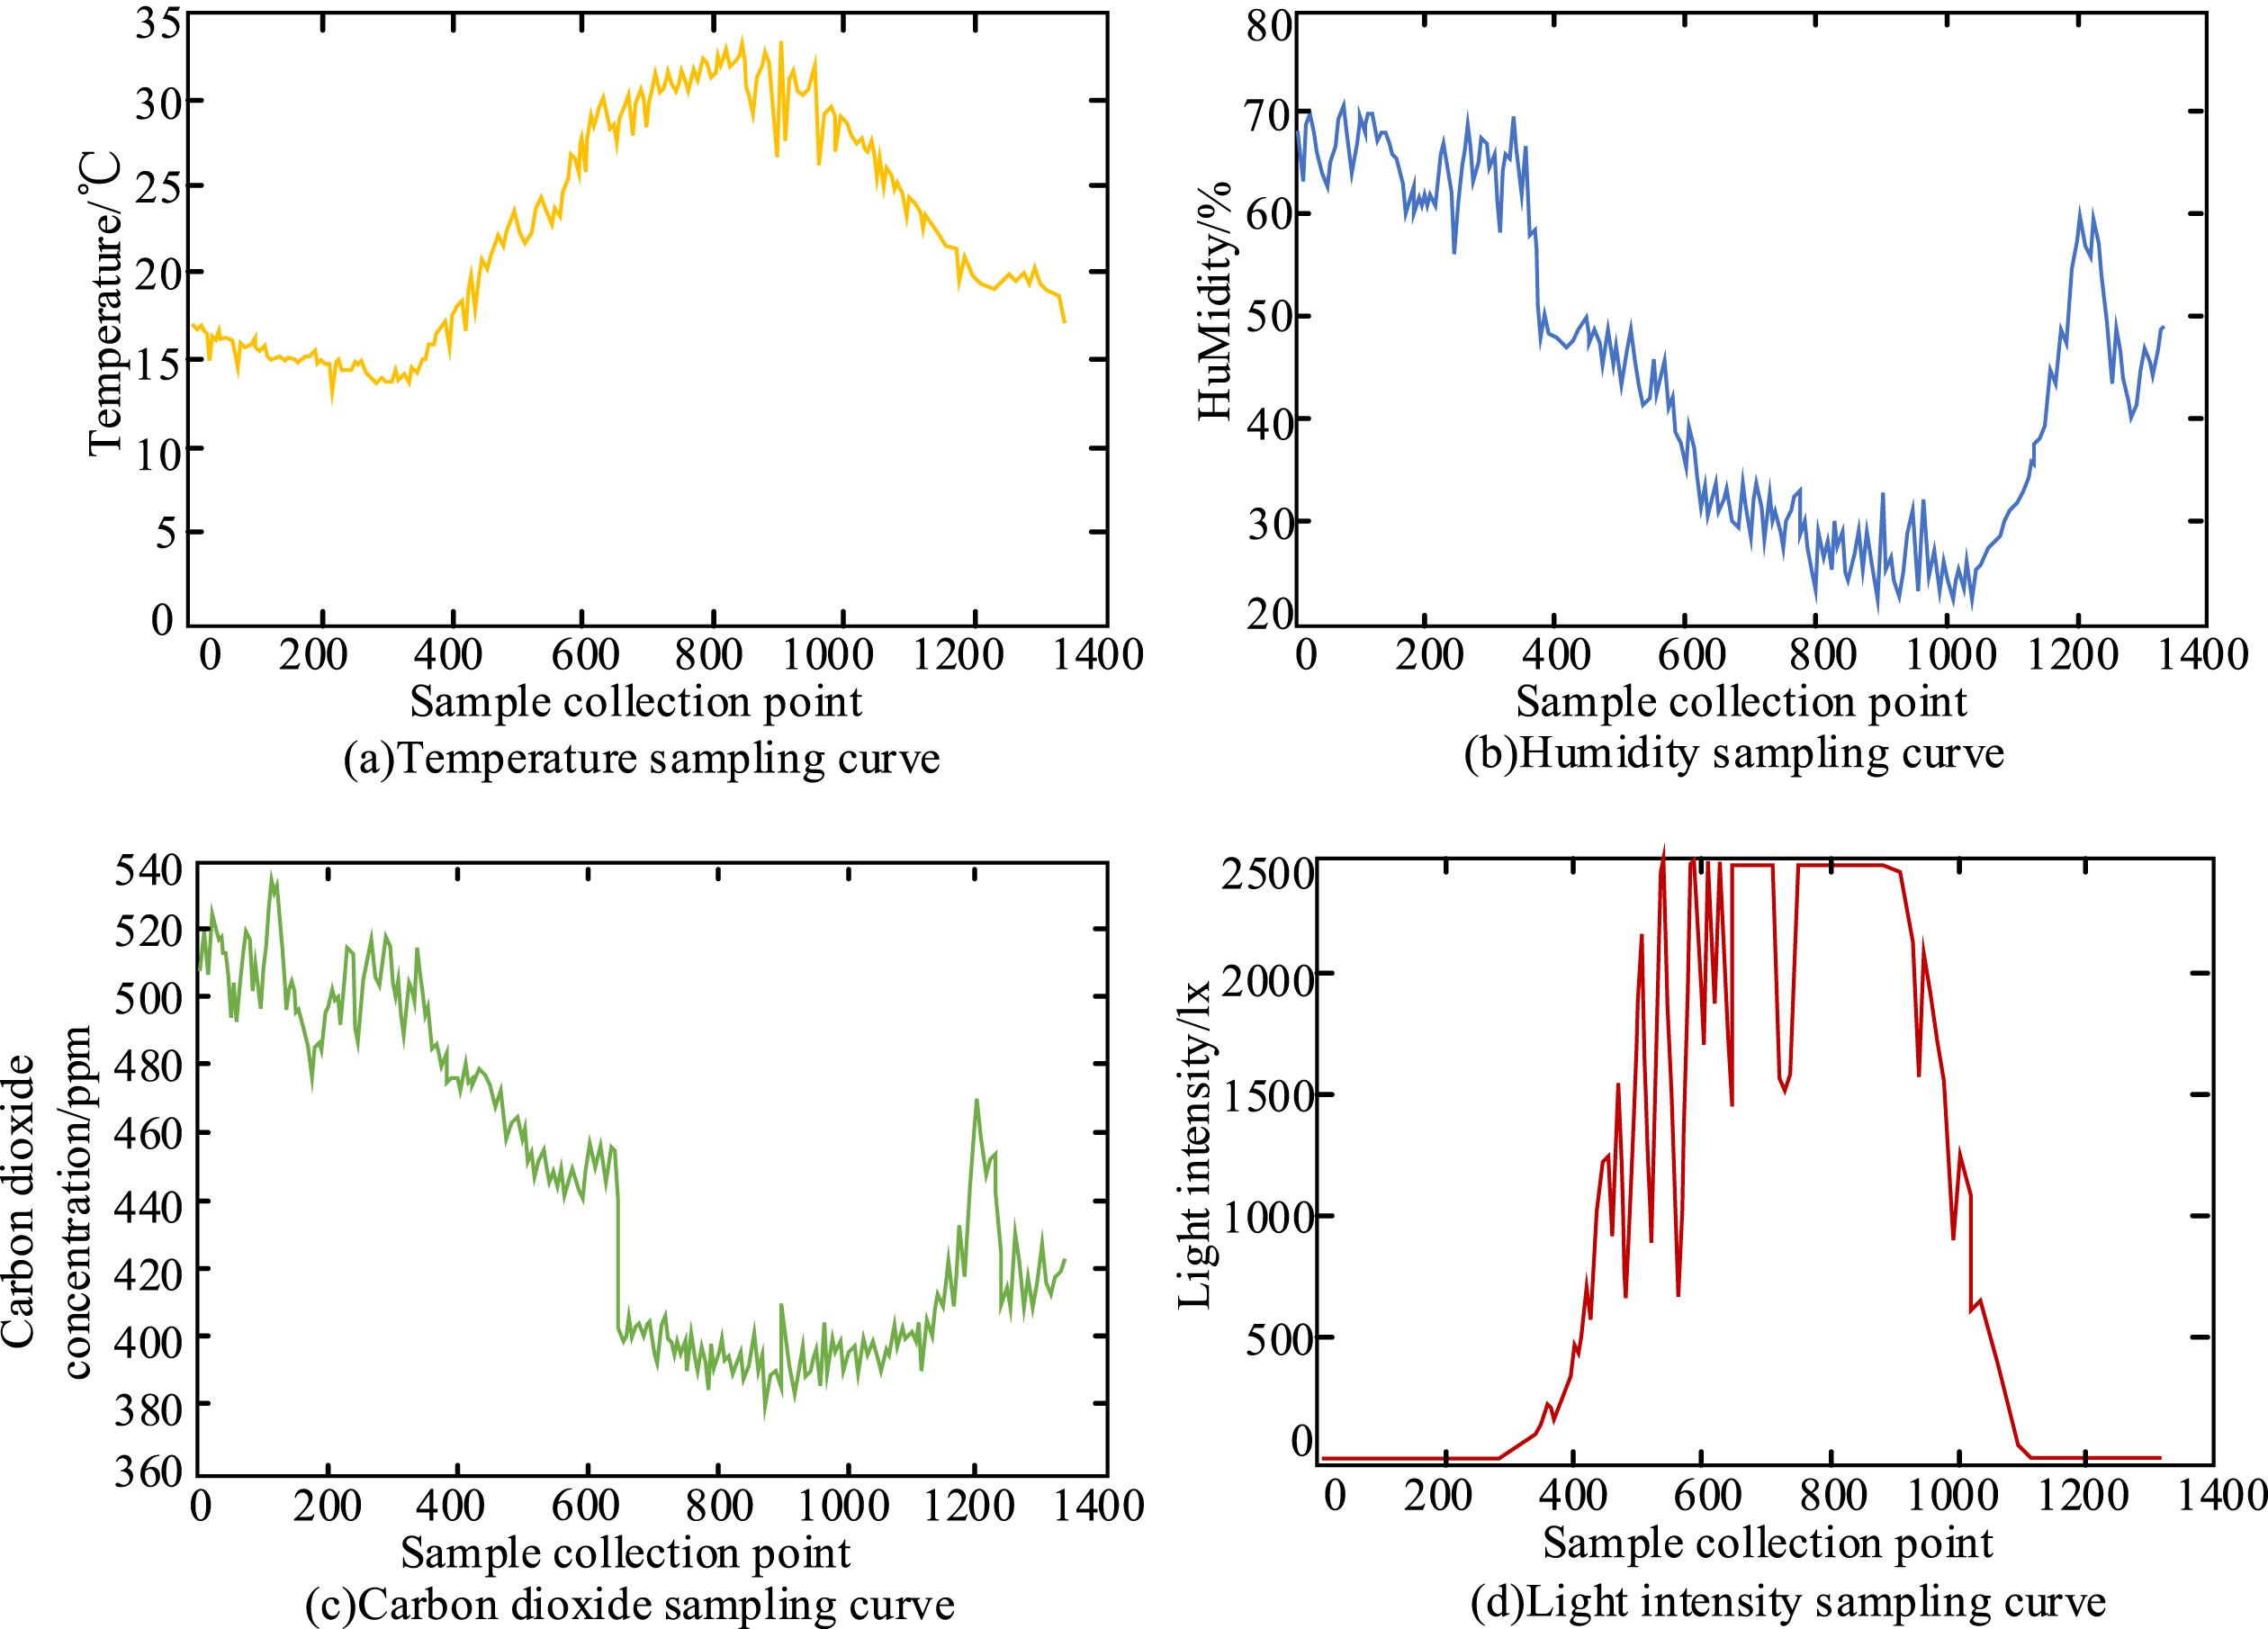
Four environmental data sampling results in one day.
In line with Fig. 9, the fusion algorithm of T-NN and improved DS evidence theory adopted in the study can well sample four kinds of environmental parameter data. From the temperature sampling curve in Fig. 9(a), the temperature of the sampling point is low between 0 and 400, indicating that it is at night, and the maximum temperature of the day is 35.2°C at the sampling point at 876. From the humidity curve in Fig. 9 (b), the humidity at the sampling point is relatively high between 0 and 400, with a maximum value of 71.2%; The sampling point gradually decreases after 400, and the minimum humidity at 1000 sampling points is 22.5%. Afterwards, the humidity value gradually increases. From the carbon dioxide concentration curve in Fig. 9(c), the carbon dioxide concentration is high between 0 and 400 and the peak value is 529.6 ppm. This is because the plant photosynthesis is weak at night, so the carbon sequestration is less and the carbon dioxide concentration is high. Figure 9(d) shows the light intensity curve, and it can be seen that the maximum light intensity exceeds 2500 lx.
With the rapid development of 5G technologies such as the IoT and Internet+, the intelligence of landscape architecture has also become a focus of attention. In order to monitor and manage the landscape architecture environment more accurately and controllably, a new fusion algorithm, namely T-NN and improved DS evidence theory fusion algorithm, is proposed. It aims to address the issue of increasing randomness in landscape architectural environmental data. In the algorithm performance verification, whether 25 sensor nodes, 50 sensor nodes or 75 sensor nodes are used, the new multi data fusion algorithm proposed has higher fitness value and faster convergence speed than IGA-BP fusion algorithm. The new fusion algorithm used in the research also has stronger advantages in terms of network latency and unit energy consumption. When the number of sensor nodes increases from 10 to 100, the algorithm used in this study achieves a unit energy consumption of 3.9 and a network delay of 1.1, which are respectively 0.1 and 0.13 lower than the IGA-BP algorithm. In the monitoring of environmental parameters of landscape architecture, the sampling accuracy of T-NN and improved DS evidence theory fusion algorithm is higher than that of IGA-BP on four environmental parameters of temperature, humidity, light intensity and carbon dioxide concentration. For example, in the monitoring of a certain time in the morning, the relative error of temperature decreased by 2.57%, and the relative error of humidity decreased by 1.62%. In terms of mean square error, the algorithm used in the study reduces the four environmental parameters by 0.82, 0.44, 2097.48 and 2.92 respectively compared with the IGA-BP algorithm. Finally, the sampling results of environmental data in one day that the algorithm can better sample the data of each period, and the curve fitting is better. The innovation of this study lies in the proposed dynamic adaptive trust estimation model, which maximally avoids the impact of inaccurate data values caused by long measurement times. Meanwhile, the T-NN data fusion algorithm is combined with the improved DS evidence theory method to form a decision model based on multi data fusion algorithm, improving the accuracy of decision fusion. However, this study did not take into account the factors of longer monitoring cycles. Due to the accumulation of time, the data input into the system will continue to increase, which will bring a burden to the system. Therefore, if resources permit, it is necessary to consider storage and data processing issues in the big data environment in the later stage, add more servers, optimize data processing methods, and reduce system response time.
Footnotes
Availability of data and material
The datasets used and/or analyzed during the current study are available from the corresponding author on reasonable request.
Competing interests
It is declared by the authors that this article is free of conflict of interest.
Funding
No funding was received.
Acknowledgments
Not applicable.
Authors’ contributions
Huanyu Shi constructs a new multi-data fusion algorithm model for the sensor network of things, and considers the data collected by multi-sensors with high redundancy and large errors, finally, a multi data fusion algorithm based on adaptive trust estimation and improved D-S evidence theory is proposed. Ning Li and Yinuo Liu did an experiment, the experimental datas demonstrate that matched with IGA-BP, algorithm in this paper obtained the largest fitness value and the fastest convergence speed in three sensor application scenarios with different numbers of nodes. Huanyu Shi, Ning Li, and Yinuo Liu made great contributions to manuscript preparation. The first author finished the manuscript, and all the authors had no disputes.