
Abstract
Selecting a sustainable facility location is a crucial strategy for manufacturing companies to achieve long-term success in today’s competitive environment. Various quantitative and qualitative criteria with different importance in a multiple level structure must be considered and aggregated to assist the company in decision-making. How to determine these criteria weights and select the sustainable manufacturing facility locations have become research questions. To resolve this problem, this paper proposes a total distance ranking approach to fuzzy analytic hierarchical process (AHP)-based multiple criteria decision-making (MCDM) method. Currently, the membership functions of fuzzy weighted ratings in the MCDM with a multilevel structure cannot be developed. A ranking method is needed to defuzzify those fuzzy numbers used for fuzzy AHP and qualitative criteria in the MCDM for better executing decision-making procedure. The total distance ranking method related to the centroid on x-axis, centroid on y-axis and the distances of centroids point to the two tangent lines of a fuzzy number are considered in the proposed ranking approach. Formulas of the proposed approach will be presented, and some properties will be investigated to derive formulas for trapezoidal and triangular fuzzy numbers. A comparison with relevant ranking methods will be made to show the advantages of the proposed ranking approach. The proposed ranking approach is then applied to defuzzify the fuzzy numbers used in fuzzy AHP and linguistic values under qualitative criteria to obtain the criteria weights under multi-level structure and crisp values under qualitative criteria, respectively. The final scores of alternatives can be obtained by aggregating crisp criteria values and their corresponding weights by simple additive weighting method to obtain the ranking result. A numerical example will be conducted to show the effectiveness of the proposed model. Finally, a comparison with Best-Worst method (BWM) will be presented to show the persuasiveness of the proposed method.
Introduction
The facility location issue involves the facilities’ geographical sitting for an organizational unit, for example a firm [1]. Facility location decisions are seen as an important part in long-term planning for service and manufacturing organizations, and an incorrect location selection may lead to inadequately skilled manpower, operating expenditures increase, inadequate means of transportation, primary materials shortage, or even adverse consequences on the firms as a result of the intervention of political and social [2]. Therefore, selecting facility location is a crucial component of a manufacturing company’s strategy for achieving long-term success in the free market economy.
The process of selecting a facility location involves making strategic-level decisions, considering the significant time scale and costs associated with constructing these facilities [3]. This decision cannot be solely approached from an economic standpoint, as establishing facilities and their interconnections have substantial environmental and social impacts. Depending on the facility’s location, waste treatment facilities and the management of emissions (solid, liquid, or gas) may exhibit considerable variations [3]. Furthermore, when expanding a manufacturing network into multiple countries, it is essential to consider corporate social responsibility (CSR) aspects, including cultural differences and ethical values. In some countries, underage labor might be viewed as a necessary means for survival, but it is not ethically acceptable in many developed countries [1]. The global firms are broadening the viewpoints of the manufacturing footprint from only economic aspect to multi-aspect, which include environmental and social concerns; thus, sustainability is a critical factor in selecting the manufacturing facilities location [1]. Therefore, a manufacturing company must consider all the sustainability elements in the facility sitting decisions.
Recently, environmental impacts and social issues have been considered while selecting a location toward a sustainable development of companies [4–6]. Terouhid et al. [7] indicated that sustainable facility location is not only needed for noxious industries but it also should be applied for all kinds of industries. They further indicated that the need to take a comprehensive approach including three sustainable facets (i.e. economic, social and environmental facets) to achieve the shifting paradigm towards sustainable facility location is higher and more justified than ever before. Thus, comprehensively considering the three areas in making decisions related to facility location selection plays a key role for manufacturing firms seeking competitive advantage.
In the evaluation of sustainable manufacturing facility locations, many factors under the three above mentioned areas must be considered. For example, Chen et al. [1] proposed a three-level structure to describe the sustainability factors when selecting the manufacturing facility location. Evidently, evaluation of sustainable manufacturing facility locations is seen as an issue to solve by multiple criteria decision-making. Some of these criteria are quantitative and have numerical values, such as potential demand and labor cost, whereas some are qualitative and usually subjectively evaluated, such as competitiveness and political stability. Quantitative factors can be sorted into benefit and cost factors. The high score of benefit factors and low score of cost factors will be preferred. In addition, different criteria in the multilevel structure may have different importance levels. Aggregation of numerous criteria and their corresponding weights in the multilevel structure forms a critical component of decision-making regarding the selection of a sustainable manufacturing location. Thus, this paper suggests a fuzzy AHP-based MCDM method under an uncertain environment to overcome the above problems.
Among MCDM methods, AHP, introduced by Saaty [8], has found widespread application in evaluating complex multi-criteria alternatives across various domains [9, 10]. It excels in terms of ease of use, systematic problem structuring, and the ability to calculate both criteria weights and alternative priorities efficiently [11]. Fuzzy sets, initially introduced by Zadeh [12] as a prominent approach for managing imprecision, have been integrated with AHP to create the fuzzy AHP (FAHP) method. This combination retains the benefits of AHP while incorporating the ability to handle imprecise data. Consequently, FAHP has gained extensive application in various fields [13]. Fuzzy set theory presented the mathematical method to represent the linguistic terms by fuzzy numbers which is a useful tool for evaluating the qualitative criteria. In the proposed method, ratings of alternative locations versus qualitative factors are obtained by using linguistic values represented by triangular fuzzy numbers, and fuzzy AHP is employed to produce weights to display difference importance of the criteria. In this study, fuzzy AHP is utilized to produce the criteria weights because of the ambiguous nature of human subjective cognition for linguistic evaluation in a pairwise comparison (i.e., fuzzy numbers are employed in the pairwise comparison matrices instead of crip numbers). However, the procedure for calculating the fuzzy numbers in these pairwise comparison matrices is complicated. Furthermore, the procedure for aggregating fuzzy weights and the linguistic values described by fuzzy numbers of locations with respect to qualitative criteria in the MCDM is also complicated. Currently, the exact membership functions of fuzzy weighted ratings in the MCDM with a multilevel structure cannot be developed. Therefore, a ranking method is needed to defuzzify those fuzzy numbers that are used for fuzzy AHP and qualitative criteria in the MCDM for better executing the decision-making procedure. In 2000, Yao and Wu [14] proposed the signed distance based on the α–cut to order the fuzzy number; despite the benefits, this method cannot provide the distinguishable result for ranking some fuzzy numbers because of using the average operator. To solve this limitation, this study proposes a total distance ranking approach to conduct the defuzzification by using the addition of the centroid on x-axis, centroid on y-axis and the distances of centroids point to the tangent lines of a fuzzy number, in which both the centroids and shape of a fuzzy number are considered. Formulas of the proposed ranking approached will be clearly presented and some properties will be investigated to derive formulas for trapezoidal and triangular fuzzy numbers. Moreover, a comparison with the other relevant techniques, including Yao and Wu [14], Wang et al. [15], Deng et al. [16], Asady & Zendehnam [17], will be made to show the worthiness of the proposed approach. The proposed ranking approach is then applied to defuzzify the fuzzy numbers used in fuzzy AHP and linguistic values under qualitative criteria to obtain the criteria weights under multi-level structure and crisp values under qualitative criteria, respectively. The final scores can be produced by aggregating crisp criteria values and their corresponding weights by simple additive weighting method to obtain the ranking result. The contributions of this study are highlighted as follows. A fuzzy AHP-based MCDM method is proposed to evaluate sustainable manufacturing locations; A novel ranking approach considering the centroid on x-axis, centroid on y-axis and the distances of centroids point to the tangent lines of a fuzzy number is proposed; Formulas of the proposed ranking method are presented, some properties are investigated; A comparison with relevant methods is made to show the merits of the proposed approach; A numerical example of evaluating sustainable manufacturing locations is conducted to illustrate the practicality of the proposed model; A comparison with BWM is presented to indicate effectiveness of the proposed method.
The remaining parts of this paper are organized as follows. The following section presents the literature review on sustainable facility location, AHP, and fuzzy number ranking. The third section shows the fundamental notion of fuzzy set theory. Section 4 discusses about the proposed ranking approach, property study and comparison. Section 5 introduces the proposed model. In Section 6, a numerical experiment is shown to present feasibility of the model and a comparison with the BWM is performed in section 6.1 to exhibit the effectiveness of the proposed model. Finally, the conclusions and future works are presented in Section 7.
Literature review
Facility location selection is crucial for all types of firms both service and industrial organizations. Thus, location selection for the expansion of an existing company or new company is the key factor affecting the firm’s prosperity or failure. The decision makers have to choose a location which not only enhances the business performance but also is pliable enough to adapt to the required changes in the future [2].
Facility siting decisions have been investigated for a long time. Since the pioneering work of Alfred Weber [18], many researchers from various academic disciplines have investigated the model facility location decisions [19]. Terouhid et al. [7], Li et al. [20], Arabani and Farahani [21], Gülpınar et al. [22], Trivedi and Singh [23], Schöbel [24] conducted a review and comparison of these articles. Facility location selection has been traditionally concentrated on economic aspects; however, with the growing concern for global sustainability, the environmental and social dimensions are being included in the development of location selection models [7].
Studies on industrial sitting facility and sustainability began to be published in 1997 [1], when Eagan and Joeres [25] developed a facility-based environmental performance indicator involving economic sustainability in 1977. Anvari and Turkay [3] integrated three dimensions of sustainability into the facility location decision framework. Chen et al. [1] indicated that in many industrial enterprises, sustainable issue has been arisen as a strategic objective; however, it is rarely built into the decision support framework. Ghasempour et al. [26] presented the MCDM to select the solar plants sites and solar plants technologies. Wang et al. [27] used three types of belief degree-constrained mathematical techniques to address a sustainable facility location-allocation issue under the Hurwicz criterion, optimistic and pessimistic value criterion. Khanjarpanah and Jabbarzadeh [28] introduced a novel method using data envelopment analysis combined with fuzzy-cross-efficiency and cross-efficiency methods to determine the optimal locations for establishing the wind plants. Some additional recent studies related to this topic include those of Tajbakhsh and Shamsi [6], Farahbakhsh and Forghani [29] and Hrabec et al. [30]. Budak et al. [31] introduced the combination of DEMATEL and ANP under interval-valued intuitionistic fuzzy environment to select the most appropriate real-time location systems. To select the dry pot locations in the Western Balkans region,Tadić et al. [32] integrated MCDM models including Delphi, AHP (Analytical Hierarchy Process), and CODAS under grey environment. Ulutaş et al. [33] introduced Grey MCDM model to select the warehouse location.
During the sustainable manufacturing facility locations evaluation process, various criteria must be determined. Chen et al. [1] classified these criteria into the three areas of environmental, social, and economic aspects. They developed a three-level structure, including sub-factors and sub-sub-factors, to depict the relationships among these three factors. Some of these factors are quantitative, such as potential demand and labor cost, whereas some are qualitative, such as competitiveness and political stability. In this study, a four-level structure of criteria is developed based on the three-level structure of Chen et al. [1] and United Nations publication [34]. Therefore, evaluating sustainable manufacturing facility locations is a multicriteria decision-making problem. For effective decision-making, MCDM methods can be employed, which assist companies to pick up the optimal alternative under many criteria and are usually employed for addressing the ranking and evaluating issues which involve in various conflicting criteria [35]. A center of area method was suggested by Chu and Varma [36] to defuzzify triangular fuzzy numbers and applied it to a multiple levels MCDM modelfor evaluate suppliers under fuzzy environment. Numerous MCDM techniques and applications in location selection have been explored. Meta analyses of MCDM methods have been presented by Boutkhoum et al. [4] and Terouhid et al. [7]. MCDM methods can be applied in various areas which can be seen in Tan et al. [37], Hussain et al. [38], Liao et al. [39]. In MCDM problems, the qualitative criteria do not have numerical values and are usually evaluated subjectively.
The performance rating of the sustainable location for the retail companies under different qualitative factors and their level of importance are frequently presented in linguistic values and the MCDM methods integrated with fuzzy methods can be used to address the data uncertainties [40]. Fuzzy set theory [12] is a useful tool to evaluate the qualitative criteria employing linguistic values represented by fuzzy numbers. Several other recently published fuzzy sets have also been developed, such as intuitionistic fuzzy sets, hesitant fuzzy sets, Z-number, and utility numbers. Kahraman et al. [41] reviewed and compared these fuzzy sets. Gupta et al. [42] extended the VIKOR method using trapezoidal intuitionistic fuzzy numbers to address the plant location selection issue. Saravi et al. [43] proposed a novel approach based on the Z-number DEA model to determine the optimum locations for biomass power plants. Ji et al. [44] combined the ELECTRE method and multi hesitant fuzzy linguistic term sets to select a hotel’s location.
This paper proposes a MCDM model under an uncertain environment to assess and choose sustainable manufacturing facility locations, where fuzzy AHP is applied to find out the weights of the criteria. AHP is considered as a flexible and powerful methodology for addressing complicated decision problems and has been extensively studied and applied [4]. Nghiem and Chu [45] proposed an AHP-based ELECTRE I method for sustainable conceptual design evaluation under a two-level criteria framework. An overview of the AHP applications has been presented by Emrouznejad and Marra [10], Russo and Camanho [46]. AHP is an extensively used MCDM method; however, it has been generally criticized due to accept a nine-point scale, which cannot deal with the uncertainty and ambiguity involved in determining the weights of different criteria [47]. It is very hard for the decision maker to evaluate the subjective and qualitative criteria which requires using exact numerical values to express the preferences and providing exact pairwise comparison judgments [47]. By contrast, fuzzy AHP is the effective technique to manage with both quantitative and qualitative criteria in MCDM problems [47]. Due to the ambiguous nature of human subjective cognition for linguistic evaluation in a pairwise comparison, fuzzy numbers are used. Therefore, the fuzzification of 1–9 scale is sensible and rational.
Various fuzzy AHP applications have been investigated so far. Du and Wang [48] proposed the combination of GIS and fuzzy AHP approach to select suitable monitoring locations for the Tomur World Natural Heritage in China. Calabrese et al. [49] conducted a literature review for fuzzy AHP. Under fuzzy environment, Chou et al. [50] integrated AHP and TOPSIS to evaluate HRST performance of Southeast Asian nations. Wang et al. [51] presented the SWOT based fuzzy AHP approach to assess the renewable resources of Pakistan. Guler and Yomralioglu [52] used Fuzzy AHP and TOPSIS under GIS environment to select the electric vehicle fast charging station. Alosta et al. [53] combined AHP and RAFSI model to resolve location selection problem. Ayyildiz et al. [54] provided the real case study of refugee camp location selection in Turkey using the combination of AHP and WASPAS. Garg et al. [55] introduced the hybrid trapezoidal fuzzy FUCOM-AHP model to identify the reasons that cause the spread of the monkeypox virus. Other recent studies in this field include those of Khan et al. [56] and Boral et al. [57].
For most of fuzzy AHP studies, the reciprocal value of a linear fuzzy number is seen as a linear fuzzy number; however, this reciprocal value does not produce a linear membership function. In addition, the weights obtained from fuzzy AHP are more complicated than those obtained from crisp AHP, because fuzzy numbers are employed in pairwise comparison matrices instead of crisp numbers. Moreover, the membership functions of the aggregation of fuzzy numbers evaluating qualitative criteria in a multilevel structure cannot be precisely obtained. To resolve these limitations, a defuzzification or ranking method is necessary. This paper uses a fuzzy AHP method in which the values on the 1–9 scale are defuzzified before being used in the pairwise comparison matrices. In addition, the fuzzy numbers used in the alternatives’ evaluation with respect to qualitative factors in the MCDM model are defuzzified before being aggregated. In this study, triangular fuzzy numbers are utilized to display the uncertain and subjective nature of the linguistic evaluation on the AHP scale and the evaluation of alternatives under qualitative criteria.
Ranking fuzzy numbers methods have been extensively researched. Chen [58] suggested a new raking fuzzy numbers method for solving tool steel materials evaluation; Wang and Kerre [59] proposed a review of the ranking fuzzy numbers methods; some other recent studies can be found in Deng [60]. Cheng [61] proposed the centroid-based distance method to rank fuzzy number by using the Euclidean distances from the origin to the centroid point. The error of centroid formula provided by Cheng [61] was found by Wang et al. [15]; thus, they proposed the correct centroid formulae for fuzzy numbers from analytical geometry perspective. Based on the standard deviations and centroid points, Chen and Chen [62] introduced an approach to rank the generalized trapezoidal fuzzy numbers. Wang et al. [63] proposed a ranking method based on left and right deviation degrees derived from maximal and minimal reference sets. Asady [64] provided the revise of distance minimization method ranking fuzzy numbers by using the epsilon –neighborhood of fuzzy numbers. Nejad and Mashinchi [65] developed a technique based on the left and right areas to resolves the shortcomings the method of Wang et al. [63].
In 2000, Yao and Wu [14] introduced the signed distance to rank both positive and negative fuzzy numbers by using the average of the closed interval α–cut. Despite the merits, Yao and Wu [14] method cannot provide discernible result in ranking some fuzzy numbers such as symmetric ones due to the used average operator. Other than the centroids on the x-axis and y-axis, the distance of the centroids point to both left and right membership function of a fuzzy number should be investigated. To the best of our knowledge, there is no solution for calculating the distance of the centroids point to both left and right membership function of a non-linear fuzzy number. Bivens [66] found that tangent line can be considered as the best linear approximation of the curve. Therefore, this study proposes a novel approach by using the centroids on x-axis and y-axis and the distances of centroids point to the tangent lines of a fuzzy number to defuzzify fuzzy numbers. The proposed ranking approach is used to defuzzify the fuzzy numbers used in fuzzy AHP and the linguistic values of qualitative criteria under MCDM structure. The final evaluated values of alternative locations then can be received through additive weighting to obtain the ranking result.
Fuzzy set theory
Fuzzy sets
A fuzzy set
Fuzzy numbers
A real fuzzy number f
f
A
(x) = 0, ∀ x ∈ [d, ∞);
The membership function of
Fuzzy number
Fuzzy number
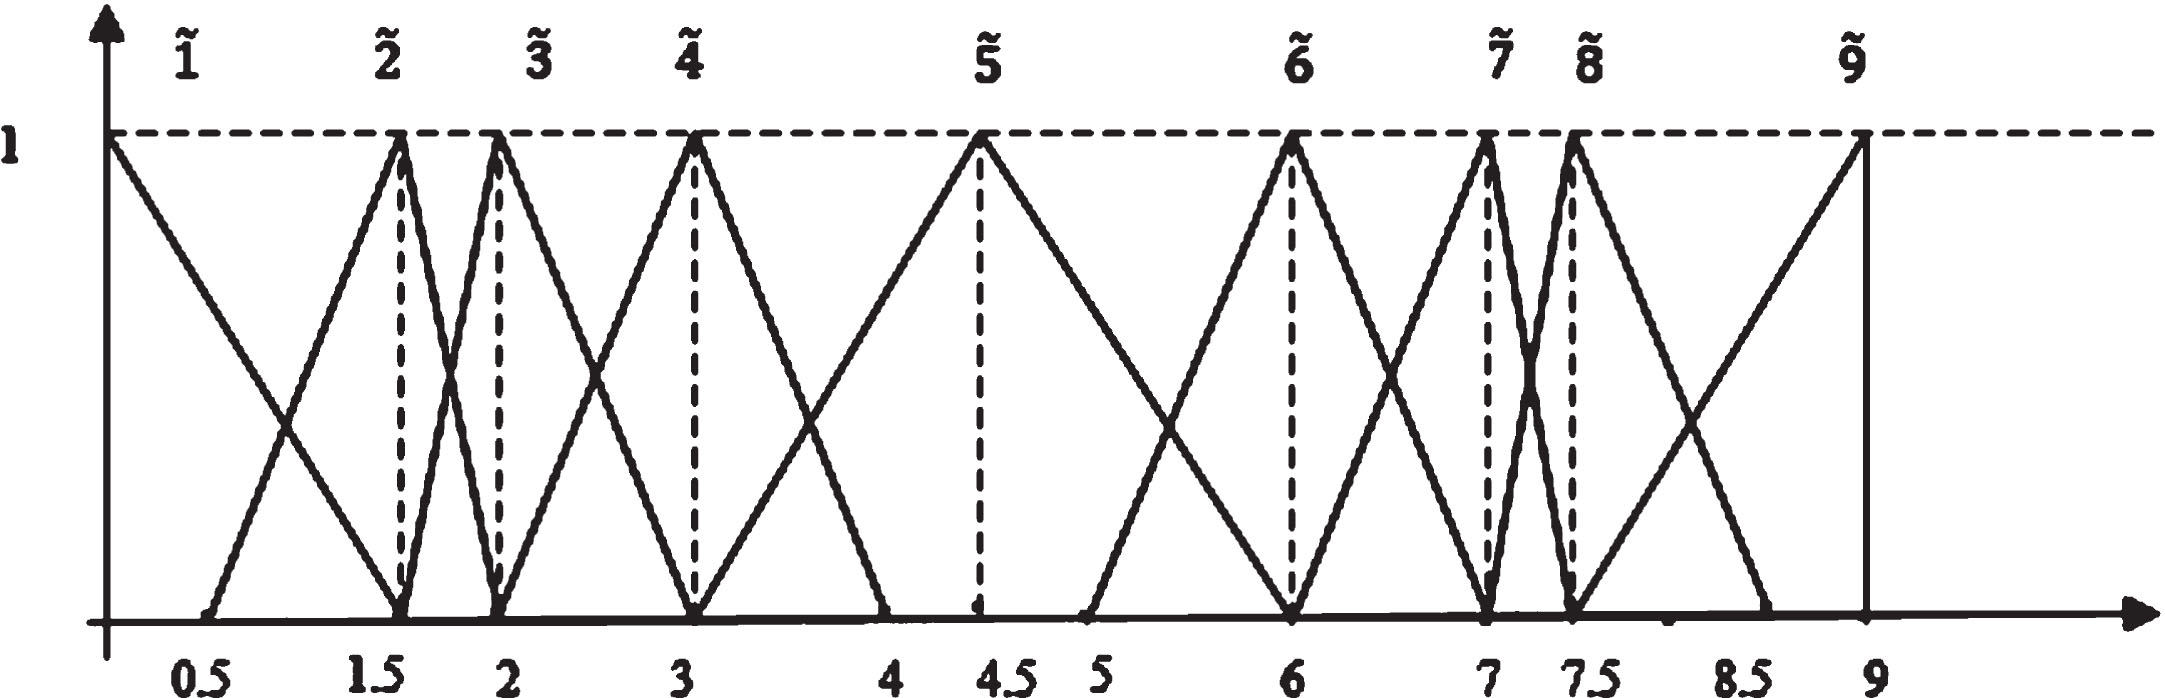
Linguistic terms are common words in the daily life which involve uncertainty or imprecision. If decision-makers employ linguistic terms with values that have imprecise characteristics during decision-making procedures, the decision-making results would be more accurate. To solve the uncertainty or vagueness of the linguistic variables, Zadeh [12] introduced fuzzy set theory in 1965 to quantify these linguistic terms. The linguistic terms are used in this study to express the importance of the criteria, for example EI (equal important), SI (Slightly important), FI (Fairly important), EI (Essentially important), I (Important), MI (Moderate important), SIM (Strong important), VSI (Very strong important), EIM (Extremely important) and the linguistic terms for ranking the alternatives are VP (Very Poor), P (Poor), MP (Medium Poor), SP (Slightly Poor), F (Fair), SG (Slightly Good), MG (Medium Good), G (Good) and VG (Very Good). The triangular fuzzy numbers are employed to represent these linguistic terms such as EI = VP = (0, 0, 1.5), SI = P = (0.5, 1.5, 2), FI = MP = (1.5, 2, 3), EI = SP = (2, 3, 4), I = F = (3, 4.5, 6), MI = SG = (5, 6, 7), SIM = MG = (6, 7, 7.5), VSI = G = (7, 7.5, 8.5), EIM = VG = (7.5, 9, 9). Assume that the experts understand completely these linguistics’ meaning with the equivalent fuzzy numbers before making the decision.
A new ranking approach by total distance
In this section, a new approach [70] based on the centroid points on x-axis and y-axis and the distances between the centroid points and the tangent lines of a fuzzy number,
Step 1. Determine the tangent line
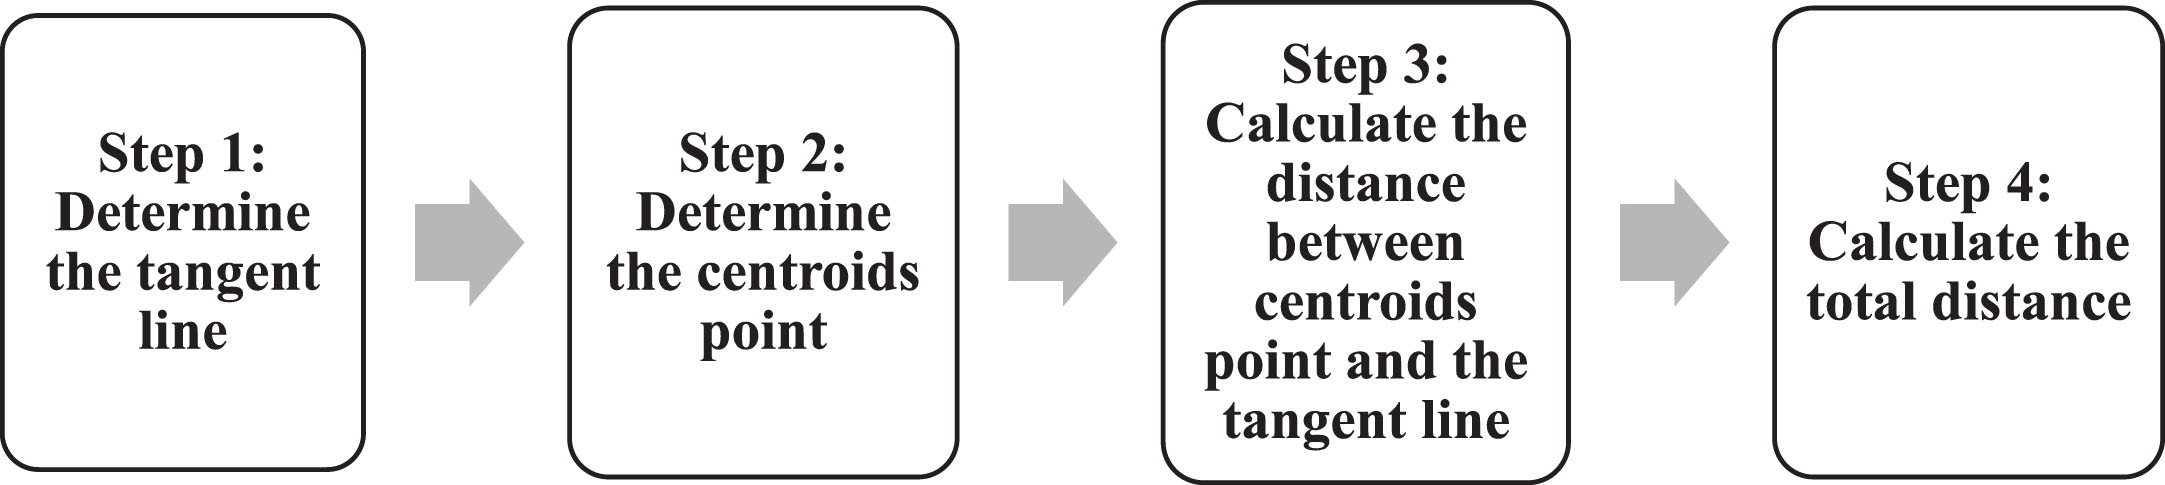
Total distance ranking process.
–Calculate tangent points
The tangent at the point (x
T
, f (x
T
)) to the graph of y = f (x) is the line through that point with slope [71]. Goetschel and Voxman [72] pointed out that the tangent line segments yield the best local ‘linear’ approximation of a fuzzy function. The tangent line can be used as the approximation to the curve at one point [73]. If the tangent point is the most representative point, the tangent line at this point of the curve also can be the best approximation of the curve. Therefore, this study considers the middle points of the left and right membership functions of a fuzzy number as the most representative points which can be used to determine the tangent lines of the left and right membership functions, respectively. The tangent points of a fuzzy number can be produced as follows. Assume T1 and T2 are the tangent points of the left and right membership functions of fuzzy number A, respectively, which can be defined as:
–Produce the tangent line
Horwitz [74] defined the tangent line of a function at a point, and is used as follows.
The tangent line of the left membership function at the point T1 can be obtained as:
The tangent line of the right membership function at the point T2 is defined as:
Step 2. Determine the centroids point
The centroid is also known as the “center of gravity” or the “center of mass” [75]. Møller [76] defined center of gravity (centroid) as a center of mass corresponding to a kind of average position of the mass in the system. Cheng [61] pointed out that the ranking method with centroid point relates to find the geometric center of a fuzzy number. Following Wang et al. [15], the centroids point
In case of the fuzzy number
Step 3. Calculate the distance between centroids point and the tangent line
The distance of a point from a line was defined by Anton [77] as
–The distance of centroids point to the tangent line of the left membership function at the point T1 can be obtained by Anton [77] concept and Equation (6) as shown in Equation (12).
–The distance of centroids pointto the tangent line of the right membership function at the point T2 can be obtained by Anton [77] concept and Equation (7) as shown in Equation (13).
Step 4. Calculate the total distance
The larger distance of centroids point to the right membership function of the fuzzy number leads to the larger distance of the right membership function to the y-axis. Whereas the smaller distance of centroids point to the left membership function leads to the larger distance of the left membership function to the y-axis. A fuzzy number with the larger distance of right and/or smaller distance of left membership function(s) to the y-axis generates larger ranking value. Herein, the relative closeness coefficient of a fuzzy number is defined as shown in Equation (14) to assist in ranking fuzzy numbers.
Due to the reason that either the distance of
From Equations (2) and (4),
T1 (x
T
1
, f (x
T
1
)), where
From Equations (2) and (5),
T2 (x
T
2
, f (x
T
2
)), where
From Equation (6), the tangent line at T1 of the left function of
From Equation (7), the tangent line at T2 of the right function of
By Equation (15), the total distance of a trapezoidal fuzzy number can be produced by summation of Equations (8, 9) and (18).
From Equations (3) and (4),
T1 (x
T
1
, f (x
T
1
)), where
From Equations (3) and (5),
T2 (x
T
2
, f (x
T
2
)), where
From Equation (6), the tangent line at T1 of the left function of
From Equation (7), the tangent line at T2 of the right function of
By Equation (15), the total distance of the triangular fuzzy number can be produced by the summation of Equations (8, 9) and (21).
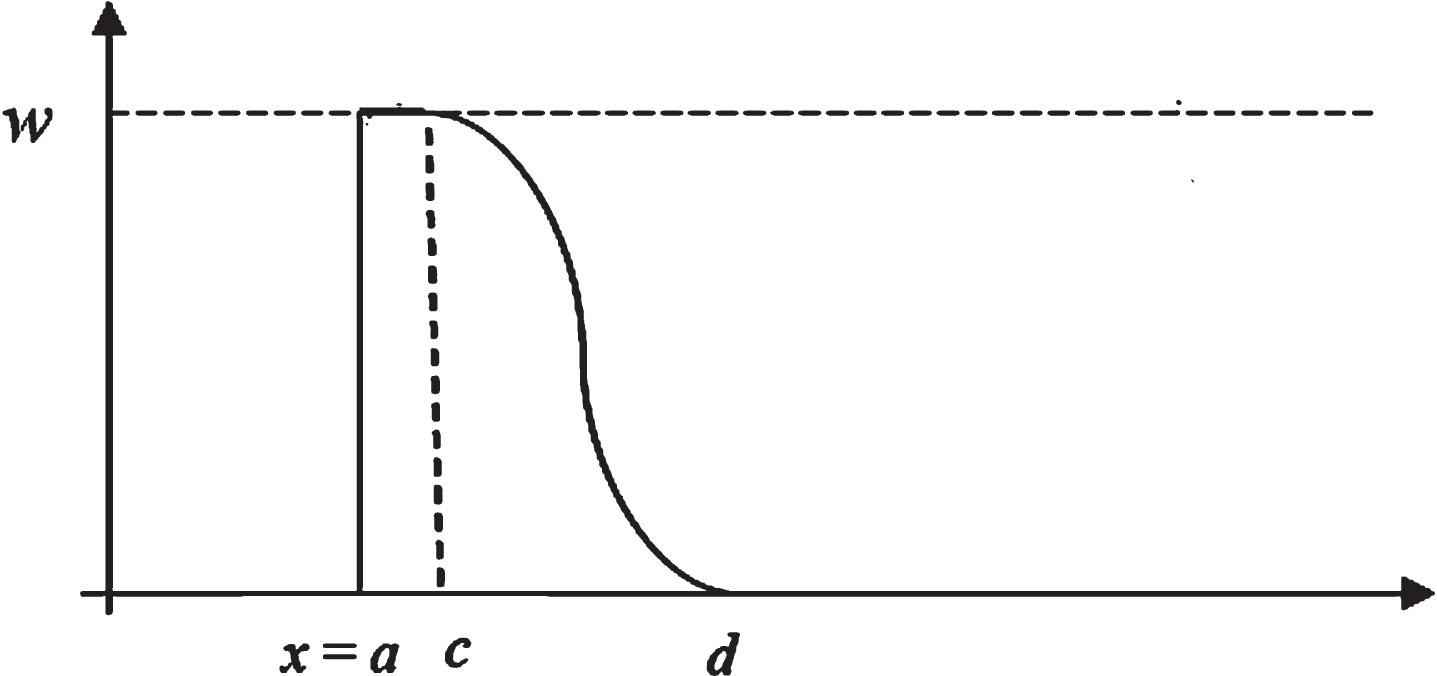
Fuzzy number
Following Anton [77], the distance of centroids point to the line x - a = 0 can be defined as:
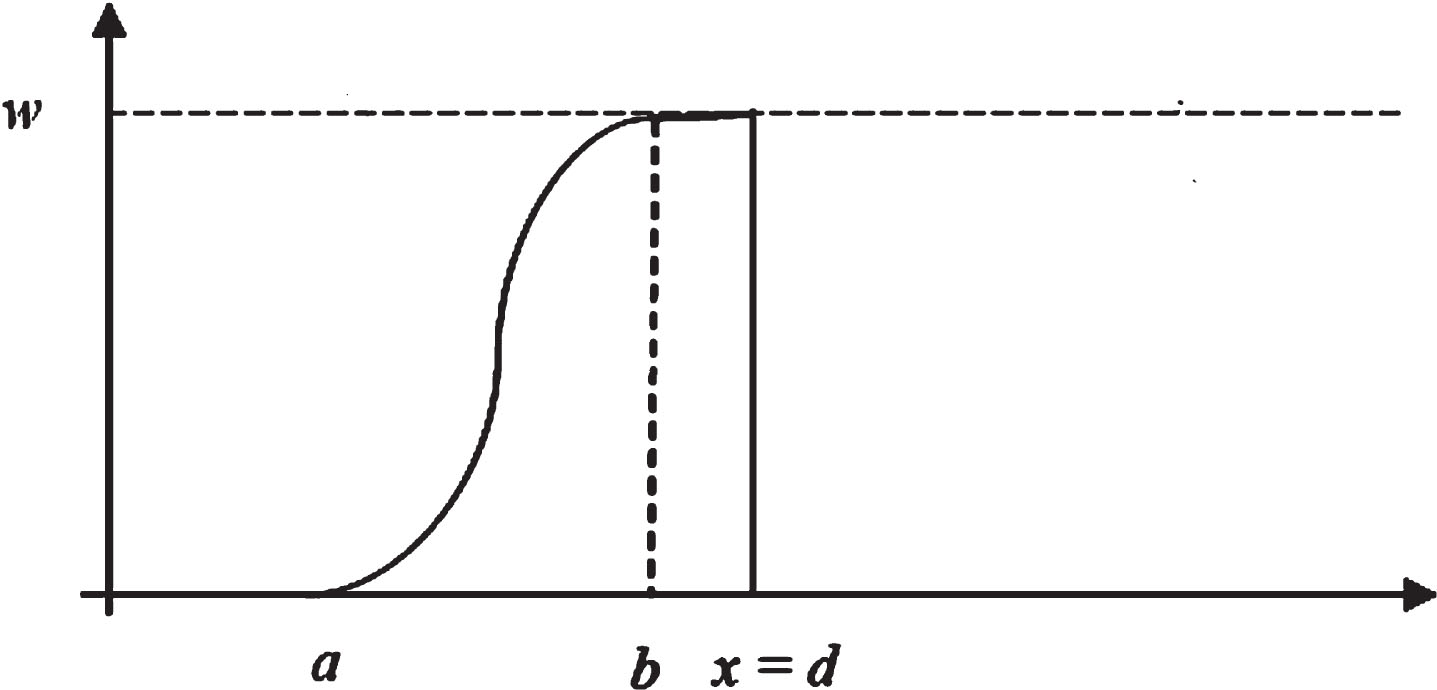
Fuzzy number
Following Anton [77], the distance of centroids point to the line x - d = 0 can be defined as:
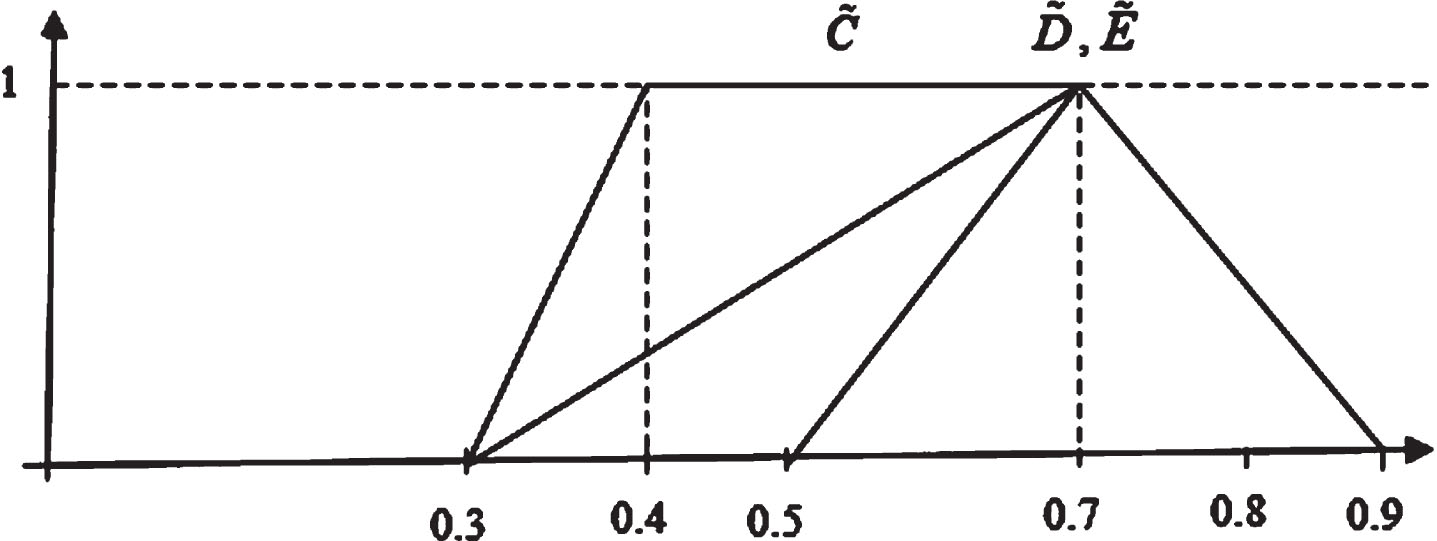
Consider two fuzzy numbers
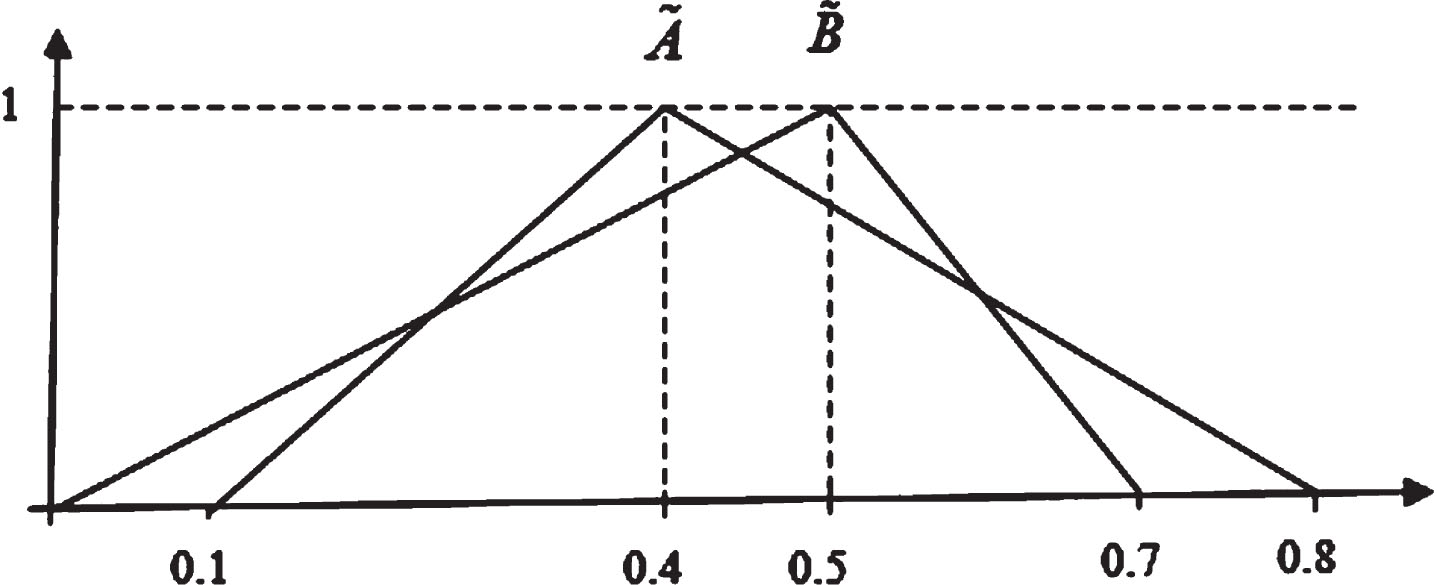
Fuzzy number
By Yao and Wu [14] method, the signed distance of two fuzzy numbers
Comparison with other methods
However, by the Equation (26), the sign distance of two fuzzy numbers
In addition, a comparison is made by using the four sets of fuzzy numbers in Yao and Wu [14] as shown in Table 1.
Set 1:
Set 2:
Set 3:
Set 4:
From Table 1, the proposed method has the same ranking result as that of the other four papers in set 1 and set 3. In set 2, the proposal method has the same result as that of Yao & Wu [14] and Asady & Zendehnam [17], which is
Fuzzy numbers in set 2.
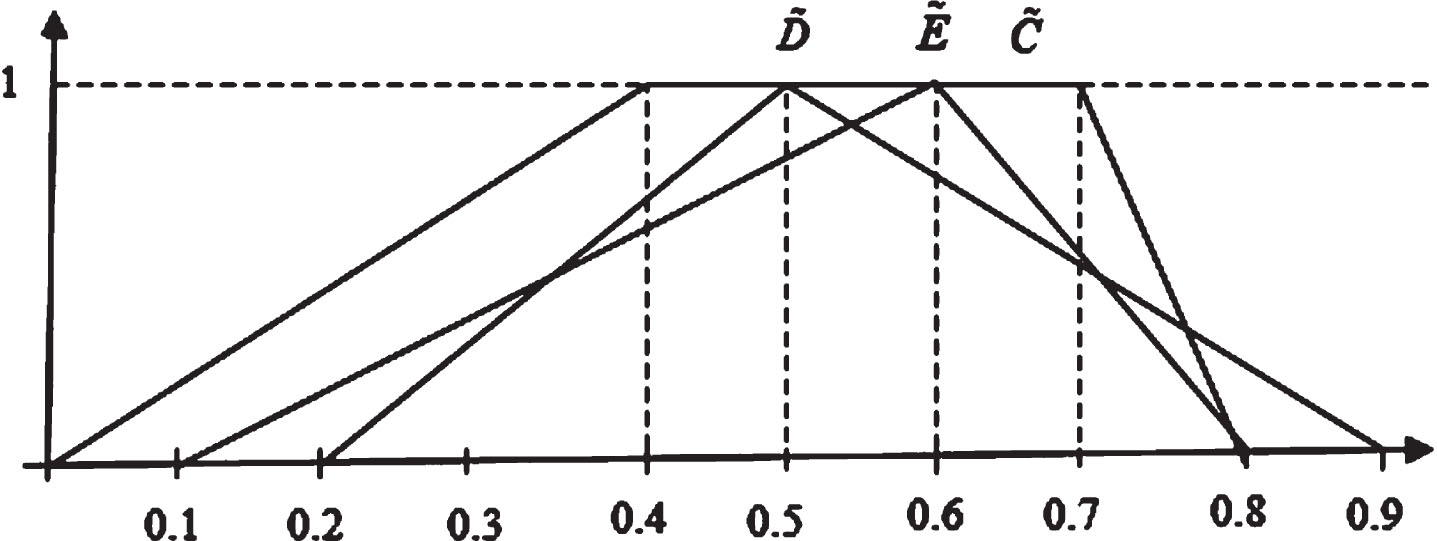
Fuzzy numbers in set 4.
The proposed AHP based MCDM method under uncertain environment is introduced as the following steps [70].
Step 1. Establish multi-level structure for criteria weights
The criteria weights in a multi-level structure can be obtained by the concepts from Chu and Varma [36] and Nghiem and Chu [45] as shown in Equation (27). The weights of major criteria in the structure can be denoted by w
x
1
, x1 = 1 ∼ n1, n1 ⩾ 1, n1 ∈ N,
Step 2. Build up fuzzy AHP
AHP is introduced by Saaty [8]. In this work, the weights in each level are produced by fuzzy AHP (FAHP). The fuzzy AHP starts creating a pairwise comparison matrix
Triangular fuzzy numbers of
Step 3. Establish a defuzzified
Because the calculation of fuzzy numbers in the pairwise comparison matrix
Linguistic evaluation, fuzzy numbers and defuzzified Values
Step 4. Produce weights
Once the crisp matrix A is built, the normalized pairwise comparison matrix of A is derived by making the sum of the entries on each column equal to one. The criterion weight can be obtained by averaging the entries on each row of A. The weight can be obtained by applying Equation (28).
Step 5. Test consistency
The consistency in each pairwise comparison matrix is conducted by the following procedure (Satty, 1980). The is produced by Equation (29). The estimated eigenvalue λmax can be obtained as Equation (30).
Values of the random index [8]
Hence, A is completely consistent when λmax = n, while it becomes increasingly inconsistent as the eigenvalue grows. And CI is the consistency index as shown in Equation (31) and RI is the random consistency index, i.e. the consistency index when the entries of A are completely random. The values of RI for small problems (m≤10) are shown in Table 3. The consistency ratio (CR) is presented as Equation (32). A matrix is consistent when CR < 0.1.
Step 6. Obtain weights of criteria
The aggregated weight for each final criterion in the structure can be produced by the following equation. The summation of weights of the end criteria equals one.
Step 7. Establish MCDM matrix
Suppose the final criteria in Equation (27), denoted by c
f
i
, i = 1 ∼ n, and their corresponding final weights in Equation (33), denoted by w
f
i
, i = 1 ∼ n, are identified. Criteria c
f
i
include qualitative and quantitative ones. Quantitative criteria can be classified to benefit (B) and cost (C) ones. Qualitative criteria are benefit. The decision-making matrix can be shown as follows.
Step 8. Average values of alternatives versus each qualitative criterion
Assume that values of alternatives versus qualitative criteria are evaluated by decision makers using linguistic values and fuzzy numbers in section 3.3, denoted by
Step 9. Normalize alternative values versus criteria
Values of alternatives versus criteria can be classified into benefit (B) and cost (C) ones and must be normalized because they have different units. Benefit criteria include qualitative criteria and benefit quantitative criteria. Benefit criteria have the characteristics of larger better, while cost criteria have the characteristics of smaller better. The following two formulas are applied.
Step 10. Obtain final evaluation
Finally, the additive weighted evaluation of each alternative can be obtained by using multiplication and addition to aggregate the normalized values and their corresponding weights as follows. Alternative A
p
has higher priority if its additive weighted value is larger.
Assume that a manufacturing company must select a sustainable facility location to build a new plant [70]. After preliminary screening, five locations A i , i = 1∼5, are chosen for further evaluation. A committee of three decision-makers D t , t = 1∼3, is formed to conduct the evaluation and selection of the five locations by the proposed method as follows. The decision-makers may include the CEO, the heads of departments, or experts who possess a comprehensive understanding of both the company and the locations in this area. When choosing the manufacturing location, there are numerous options to be considered. To streamline the process, decision-makers must screen the alternatives to narrow down their choices. Supposed five alternatives were chosen by the decision makers after conducting an initial screening. These alternatives may be situated either within the same area or across different locations. After preliminary screening, five locations A i , i = 1∼5, are chosen for further evaluation.
Step 1. Establish multiple levels structure for criteria weights
Chen et al. [1] provided a three-level structure to summarize the sustainability factors when choosing manufacturing facility location. Assume that a four-level structure based on Chen et al.’s [1] three-level structure is established to depict the relationship among criteria as displayed in Figure 7. In Figure 7, the first level includes C1: Economic, C2: Environmental, C3: Social; the second level includes C11: Cost, C12: Market, C13: Economic stability, C14: Suppliers, C15: Growth; C21: Ecosystem vitality, C22: Environmental health, C23: Environmental factors within production; C31: Governance, C32: Education, C33 : Individual, C34: Community; the third level includes C111: Labor cost, C112: Energy cost, C113: Material cost, C114: Facility cost, C115: Logistic cost, C121: International markets, C122: Potential demand, C131: Favorable tax, C132: Exchange rate fluctuations, C141: Proximity to key suppliers, C142: Potential high quality suppliers, C151: Industry growth, C152: Competitiveness in the host region, C211: Air pollution related to the ecosystem, C212: Water quality related to the ecosystem, C213: Biodiversity protection, C214: Climate change performance, C221: Environmental burden of disease, C222: Air pollution related to humans, C223: Water quality related to humans, C231: Material use, C232: Energy consumption, C233: Renewable resources, C234: Waste generation and management, C235: Recycling of material, energy, and waste, C311: Corruption, C312: Political stability, C313: Trade and tariff barriers, C321: Literacy, C322: General education level, C331: Civil liberties, C332: Human rights, C341: Equity, C342: Safety, C343: Cohesion, C344: Local technology. In addition, according to a report from United Nations publication [34], some sub-sub-criteria can be further classified to sub-sub-sub criteria in the fourth level, such as Energy consumption (C232) can be further classified to Annual energy consumption, total and by main user category (C2321) and Intensity of energy use, total and by economic activity (C2322); Waste generation and management (C234) can be further classified to Generation of hazardous waste (C2341) and Waste treatment and disposal (C2342); and General education level (C322) can be further classified to Gross intake ratio to last grade of primary education (C3221), Adult secondary (tertiary) schooling attainment level (C3222) and Net enrolment rate in primary education (C3223), as displayed in Figure 8.
Herein, criteria can be classified to benefit (B) and cost (C) ones such as C111 (C, US$), C112 (C, US$), C113 (C, million US$), C114 (C, US$), C115 (C, US$), C131 (B, %), C132 (C, %), C151 (B, %), C214 (C, index), C221 (C, %), C222 (C, air quality index), C223 (C, %), C231 (C, ton), C233 (B, %), C235 (B, ton), C311 (C, index), C321 (B, index), C344 (B, number), C2321 (C, ton), C2322 (B, index), C2341 (C, ton), C2342 (B, %), C3221 (B, %), C3222 (B, %) and C3223 (B, %). And C121, C122, C141, C142, C152, C211, C212, C213, C312, C313, C331, C332, C341, C342, C343 are treated as qualitative criteria, and all qualitative criteria are benefit criteria.

Four-Level Structure of Criteria.
Step 2. Build up fuzzy AHP
Assume that the pairwise comparisons are conducted by the three decision makers by using the triangular fuzzy numbers in Table 2 as shown in Tables 4–22. The shapes of those trapezoidal fuzzy numbers are displayed in Figure 6.
Step 3. Establish a defuzzified
By Equations (4)–(15), triangular fuzzy numbers can be defuzzified to be crisp values as also presented in Tables 4–22.
Step 4. Produce weights
The weights of criteria for each matrix in the structure can be obtained by Equation (28) as shown in Table 23.
Step 5. Test consistency
By Equations (29)–(32), consistency ratio (CR) can be produced for each matrix as 0.06, 0.08, 0.02, 0.09, 0.03, 0.07, 0.05,0.08, 0, 0, 0.04, 0.06, 0, 0, 0, 0, 0, 0, 0.05 for Tables 4–22. All ratios are less than 0.1, which shows consistency.
Step 6. Obtain weights of criteria
The aggregated weight for each final criterion in the structure can be produced by Equation (33) as shown in Table 24.
Step 7. Establish MCDM matrix
The MCDM matrix can be obtained as displayed in Equation (34) by using the final criteria from Equation (27) and the final weights from Equation (33).
Step 8. Average values of alternatives versus each qualitative criterion
Assume that alternatives versus qualitative criteria can be evaluated by decision makers using linguistic values in section 3.3 as shown in Table 25. Those linguistic values can be defuzzified by Equations (4)–(15) and averaged by Equation (35) as also shown in Table 25.
Step 9. Normalize alternatives values versus criteria
Assume that numerical values of alternatives versus quantitative criteria are shown in Table 26. By Equations (36)-(37), normalized values of alternatives versus all criteria can be obtained as shown in Table 27.
Step 10. Obtain final evaluation
Finally, the additive weighted evaluation of each alternative can be obtained by Equation (38) as shown in Table 28. From Table 28, the ranking order of the five locations is A4 > A1 > A5 > A2 > A3. The location A4 is selected with priority because it has the highest evaluation with 0.92034.
Best-worst method
The key elements in MCDM involve two main aspects, including the evaluation of criteria importance and the ranking of alternative options [78]. When assessing criteria importance, numerous subjective MCDM techniques are available such as the Analytic Hierarchy Process (AHP), Analytic Network Process (ANP), and Best-Worst Method (BWM) [78]. Among these, AHP and BWM stand out as prominent and robust techniques for deriving criteria weights through pairwise comparisons. Despite their widespread applications, these methods are not without limitations. For instance, the AHP method imposes a workload due to the exhaustive nature of pairwise comparisons [79]. Addressing this limitation, Rezaei [80] introduced the BWM in 2015 and further refined it in 2016 [81]. BWM presents some advantages compared to alternative MCDM methods because it requires less pairwise comparison data than a full pairwise comparison matrix and it tends to yield more consistent results compared to other MCDM methods employing a full pairwise comparison matrix [82]. However, a drawback of BWM is the absence of a consistency threshold to validate result reliability, as highlighted by Liang et al. [83]. Consequently, decision-makers face the challenge of determining when to revise their judgments and a comparative analysis of the two methods becomes needed. Therefore, in this work, the proposed method is compared with the best-worst method.
The above numerical example is used to compare with the Best–Worst method [80] to show the effectiveness of proposed method, in which BWM is used to derive the criteria weights. Decision makers can determine a pairwise comparison vector for the best (e.g., most desirable and most important) criterion in the structure by using Equation (39), as shown in Table 29, and that for the worst (e.g., least desirable and least important) criterion by using Equation (40), as shown in Table 30.
The BWM model is shown as Equation (41) [80]:
And the consistency ration of the matrix is obtained by the Equation (42).
Next, the weights can be obtained using Equations (41) and (42), as shown in Table 32. The final weights can be obtained using Equation (33), as also shown in Table 32. The final ranking can be obtained using Equations (34)–(38), as shown in Table 28.
Both BWM and AHP rely on a decision maker’s evaluations of the relative priorities of the decision-making elements, which are represented in a comprehensive pairwise comparison matrix [83], however, BWM requires fewer comparisons compared to AHP [84]. BWM and AHP stand out as the most popular methods for determining criteria weights. Therefore, conducting a comparison between these two methods becomes essential to validate the results.
The results of the proposed method can be validated using BWM, because both methods produce the same ranking order for the five alternatives. Although BWM uses less comparison data than the other MCDM methods, it lacks consistency threshold for verifying the reliability of the results [83]. With no consistency threshold, the decision makers are left with addressing the major problem of determining when their judgements should be revised, along with the consideration of the number of criteria and evaluation scale, making the situation more complicated [83]. In case of inconsistency, a matrix review process must be followed, which requires decision makers to provide new comparison judgments [49]. Furthermore, the original BWM utilizes a nonlinear model that can lead to multiple optimal weights, implying that the weight of each criterion is presented as an interval [85]. Whereas AHP provides the consistency threshold (i.e. 10%), which means that the matrix is consistent if the consistency ratio is smaller than this threshold. Moreover, AHP method provides a single optimal result for the criteria weights, making it straightforward for calculation in ranking alternatives. With all the reasons above, this study utilized AHP method to produce the criteria weight.
Theoretical and practical implications
Theoretical implications
This study provideda Fuzzy AHP-Based MCDM method for selecting sustainable manufacturing facility location. In this study, a novel total distance ranking approach is developed to defuzzify the fuzzy numbers. A new topic of sustainable manufacturing facilitylocation selection is put forward. This paper firstcontributed to establishing the comprehensive list of criteria for sustainable manufacturing location selection which considers fourth-level structure of criteria. Numerous quantitative and qualitative criteria with different weights in a multilevel structure must be comprehensively considered and aggregated to assist the company in decision-making. These criteria are classified as benefit and cost criteria. Besides that,this study proposed a total distance approach to fuzzy AHP-based MCDM method to resolve this problem. Formulas for the proposed total distance ranking approach have been clearly developed for ranking fuzzy numbers. Some properties have been investigated to derive formulas for trapezoidal and triangular fuzzy numbers. A comparison with some relevant ranking methods including Yao and Wu [14], Wang et al. [15], Deng at al. [16], Asady & Zendehnam [17] has been made to reveal the advantage of the proposed approach. The proposed ranking approach was employed to defuzzify the fuzzy numbers used in fuzzy AHP and linguistic values under qualitative criteria to obtain the criteria weights under multi-level structure and crisp values under qualitative criteria, respectively. The final criteria and their corresponding weights were further used to establish an MCDM model to come up with the final evaluation values. The ranking of alternative locations was then obtained by the final evaluation values through simple additive weighting method. A numerical example with a four-level structure for evaluating and selecting sustainable manufacturing facility locations was utilized to illustrate the proposed method feasibility. Finally, the proposed method was compared with BWM to validate its effectiveness in yielding the same ranking order of alternatives.
Practical implications
In addition to its theoretical implications, this study also offers valuable contributions to the practical aspects of sustainable manufacturing facility selection process. Firstly, the identified evaluation criteria provide decision-makers with the opportunity to target appropriate locations in terms of sustainability dimensions, encompassing environment, society, and economic aspects. This enables firms to focus on improving the most crucial aspects from a sustainable standpoint. Secondly, the fuzzy AHP-based MCDM method can be conveniently employed using tools like Excel or other applications, facilitating more accurate and precise selection results. This approach can prove beneficial for smart PSS developers and other professionals involved in sustainable decision-making. Thirdly, the model developed in this study holds potential for application in various other fuzzy MCDM problems in future endeavors, such as green supplier selection, sustainable facility layout selection, green marketing tools selection, and more. This versatility enhances its value in different areas of decision-making and sustainable practices. This study offers a comprehensive set of criteria for the selection process of sustainable manufacturing facilities. However, policymakers have the flexibility to adjust the number of criteria to align with the firm’s size or the company’s goals. Furthermore, this proposed method can be adapted for other MCDM issues by modifying the list of criteria and alternatives.
Conclusion and discussion
Selecting a facility location with a focus on sustainability, encompassing economic, environmental, and social aspects, is a crucial aspect of a manufacturing company’s strategy for long-term success in today’s competitive environment of sustainable development. This complex decision-making process involves considering numerous quantitative and qualitative criteria, each carrying different weights within a multilevel structure. To address this complex problem, this study introduces a total distance approach to the fuzzy AHP-based MCDM method. The proposed total distance ranking approach offers a clear formulation for ranking fuzzy numbers, with specific investigation into properties concerning trapezoidal and triangular fuzzy numbers. A comparison with relevant ranking methods highlights the advantages of the proposed approach. By employing this ranking approach, fuzzy numbers used in fuzzy AHP and linguistic values under qualitative criteria are defuzzified to obtain criteria weights within the multi-level structure and crisp values under qualitative criteria, respectively.
These final criteria and their corresponding weights are then incorporated into an MCDM model to derive the final evaluation values. Subsequently, the alternative facility locations are ranked based on the final evaluation values using the simple additive weighting method. To demonstrate the feasibility of the proposed method, a numerical example featuring a four-level structure for evaluating and selecting sustainable manufacturing facility locations is presented.Furthermore, the effectiveness of the proposed method is validated by comparing it with the Best Worst Method (BWM) to ensure both methods yield the same ranking order of alternatives. Overall, this study showcases a comprehensive and effective approach for sustainable facility location selection, taking into account economic, environmental, and social aspects, and contributes to the advancement of decision-making practices in sustainable manufacturing.
The proposed method exhibits several strengths. Firstly,this study offers a comprehensive set of criteria for the selection process of sustainable manufacturing facilities. To address this complex problem, this study introduces a total distance approach to the fuzzy AHP-based MCDM methodwhich yields more accurate ranking results compared to other ranking methods such as Yao and Wu [14], Wang et al. [15], Deng et al. [16], and Asady & Zendehnam [17]. Additionally, it offers the convenience of easy implementation through tools like Excel or other applications. Moreover, its versatility allows it to be applied to address various other fuzzy MCDM problems in future applications. However, some problems require closer consideration. First, different ranking approach may lead to various ranking result. Second, weights may be different if a method other than fuzzy AHP is used. Third, the number of criteriacan be adjusted as per the requirement, and the change in ranking result may happen if different criteria and levels are used. Finally, the ranking result may change if, for example, different fuzzy numbers are used, different aggregation method is used, or different normalization formulae are used, etc.
Appendix
Pairwise comparison matrix –Level 1
Pairwise comparison matrix under economic –Level 2
Pairwise comparison matrix under environment –Level 2
Pairwise comparison matrix under Social –Level 2
Pairwise comparison matrix under cost –Level 3
Pairwise comparison matrix under market –Level 3
Pairwise comparison matrix under economic stability –Level 3
Pairwise comparison matrix under suppliers –Level 3
Pairwise comparison matrix under growth –Level 3
Pairwise comparison matrix under ecosystem vitality –Level 3
Pairwise comparison matrix under environmental health- Level 3
Pairwise comparison matrix under environmental factors within production- Level 3
Pairwise comparison matrix under governance –Level 3
Pairwise comparison matrix under education- Level 3
Pairwise comparison matrix under individual- Level 3
Pairwise comparison matrix under community- Level 3
Pairwise comparison matrix under Energy consumption –Level 4
Pairwise comparison matrix under Waste generation and management –Level 4
Pairwise comparison matrix under education level –Level 4
Weights of criteria in the structure
Average weights of criteria
Linguistic values of alternatives versus qualitative criteria and averaged values
Ratings of alternatives versus quantitative criteria
Normalized values of location versus quantitative and qualitative criteria
The evaluation values from proposed method
Pairwise comparison vector for the best criterion in the structure
Pairwise comparison matrix for the worst criterion
Consistency index (CI)
Final weights by Best-Worst Method
Footnotes
Acknowledgments
The authors would like to sincerely thank the three anonymous reviewers, Editor and Editor-in-Chief for providing helpful comments and suggestions. Their insights and comments led to a better presentation of the ideas expressed in this paper. This paper was supported in part by the National Science and Technology Council, Taiwan, under Grant NSTC 112-2410-H-218-005-.