
Abstract
The technologically adapted agricultural procedures convert conventional farming practices and introduce smart farming or smart agriculture. Manual interventions in farming are unavoidable, however, it was reduced due to the Internet of Things (IoT). Sensors are used to monitor the farms which reduce the manpower requirements as well the cost. In this research work, a smart monitoring and prediction system was developed using IoT along with Fog computing. The physical data from farms are collected through IoT sensors and processed using a novel correlation-based ensemble classifier. Fog computing is adopted in the proposed work to reduce the data transmission delay and computation complexities. Simulation analysis using benchmark datasets demonstrates the proposed model performance in terms of precision, recall, F1-score, and accuracy. Comparative analysis with conventional techniques like neural networks, extreme learning machine, and hybrid particle swarm optimization algorithm, validates the superior performance of the proposed model. With maximum accuracy of 96.67% proposed model outperforms conventional approaches.
Keywords
Introduction
India is the second largest food producer in the world next to China. As per the statistics time report, for the year 2020-2021, the Gross Value Added (GVA) services of India is 53.89% with which industries contribute 25.92% and next to that, agriculture and its allied sectors contribute 20.19%. More than 57% of rural areas are used for agriculture. Meanwhile due to ecological risks, cultivation costs, inadequate soil maintenance, low per capita productivity, and lack of experienced professionals, the number of farmers has reduced to 45.1% from 71.9% [1] and it continues. Presently the digital revolution changes the agriculture trend using technology and connects farmers with the land through digital applications. This converts traditional farming practices into a profitable and highly productive domain. Thanks to the current communication and sensor technologies which can provide the field details on handheld devices without visiting the farms. Timely utilization of sensors reduces the risks in conventional farming practices and provides precise results which help to monitor the farms and are useful to predict the crop requirements.
Recent technologies like the Internet of Things (IoT), Artificial Intelligence (AI), and big data are involved in the present agricultural era 4.0 [2]. These technologies utilize low-cost sensors and reliable networks to improve agricultural activities which parallelly enhances production efficiency. Real-time field data helps farmers to take decisions on further processes. Artificial intelligence and IoT applications for farming support farmers by providing a reliable best solution like experienced professionals which attracts youngsters to turn the direction towards smart farming. Sophisticated technology, modern concepts, and remote monitoring are the major features of smart farming. Precise monitoring helps to harvest the crops on time and technology-driven machines reduce cost and increase productivity. To enhance product quality and quantity, and reduce labor requirements, modern smart farming involves information and communication technologies (ICT). This technology analyzes the farmer’s requirements and provides the best solution with the highest accuracy in a short time which increases crop productivity.
Smart farming based on IoT has numerous benefits like real-time monitoring, irrigation, fertilization, product quality enhancement, crop protection, disease prediction, etc., Precision agriculture is made possible through smart devices [3]. However, sensors in smart farming environments continuously collect data that needs to be processed in real-time. But the computation ability of IoT sensors is low due to their size and memory. Thus, cloud computing is incorporated with IoT applications to perform data analysis. The collected through sensors are transferred to cloud computing and after analysis, the decisions are provided to the user which introduces a delay in getting decisions in real-time. Thus, fog computing was introduced which brings the cloud resources to the end user and reduces the transmission delay.
Data analysis in a smart farming environment utilizes statistical approaches in the past times. Based on the previous year’s statistics and procedures, the current data will be processed to obtain necessary decisions. Where the recent technology development, machine learning concepts are widely used to classify smart data from farms. From product categorization to future crop production suggestions and productivity prediction can be made through machine learning algorithms. As a result, farmers’ income increases, and the agricultural value increases. The research community performs deep analysis every day to improve the performances of smart agriculture through innovative algorithms and applications. To attain a better-performing smart agriculture module than machine learning, an ensemble classifier-based smart monitoring and prediction process is presented in this research work. Multiple classifiers are combined to create an ensemble classifier to attain better performances in smart agriculture. For this, the contributions made in this research work are presented as follows. Presented an effective monitoring and prediction system for smart farming in a fog-based IoT environment using correlation-based ensemble techniques. Presented an intense experimental analysis to exhibit the performance of the proposed method using benchmark datasets. Presented relative comparative analysis of the proposed model with other existing prediction models such as Neural Networks (NN), Extreme Learning Machines (ELM), and Hybrid Particle Swarm Optimization (PSO)-Extreme Learning Machine (ELM).
The remainder of the section is arranged as follows: A discussion of various smart farming systems and their features is presented in Section 2. The proposed monitoring and prediction model is presented in Section 3, and its performance analysis is presented in Section 4. The final observations are concluded in Section 5.
Related works
A wide survey related to the existing monitoring and prediction of smart farming systems is enumerated in this section. Various techniques, feature merits, and demerits are reviewed for investigation, and finally, the limitations are discussed to frame the research motivation. Smart farming, or precision agriculture, is a rapidly growing technology that offers various benefits for farmers and yields better production of agricultural products. The incorporation of cloud and IoT systems into smart farming systems enables farmers to monitor and predict the ongoing status of agricultural land [4]. The article reported in [5] utilized a Wi-Fi-based Long-Distance Network (WilD) and Fog computing to create an effective monitoring and prediction system for smart farming systems. The massive growth of agricultural data and an extensive distance between the data and the cloud server cause a latency problem. Fog computing overcomes this challenge by bringing the Fog server nearer to the source of data. A brief review of the combination of multidisciplinary techniques of Agri fusion towards the future of Precision Agriculture (PA) was discussed. An outlier is a point that deviates from other observations. It may have been caused by anomalous activity. The detection of outliers in greenhouses is performed in [6] using the Kalman filter.
The Arduino is a very famous single-board microcontroller, which is most significantly utilized by various automated applications. Monitoring the agricultural environment is essential for the better growth of crops. The integration of mobile systems with Arduino, Raspberry pi, and various soil sensors was utilized in the smart farming system proposed in the article [7], and this proposed system helps to monitor the information of soil parameters continuously. The misbehavior of humans or animals in agricultural areas causes severe damage to the farming fields. The misbehavior activity in the farming area is identified using the embedded systems Arduino and Raspberry Pi. A sufficient amount of water is essential for every farming area to improve plant growth. In the article [8], different WSNs (Wireless sensor nodes) are used to track farming data like temperature, humidity, etc. This research model achieved the benefit of reduced installation costs due to the usage of WSN. The smart agriculture system reported in [9] utilized a combination of microcontrollers, GSM, and wireless sensors to monitor and control various congestion parameters in an agricultural environment.
Machine learning is a fast-growing technology utilized by various domains, especially in the agricultural field. The proposed smart farming system utilized in [10] involves four stages, which include pre-production, production, post-production, and distribution of paddy rice. The last stage uses an image processing technique along with a machine-learning algorithm to recognize and classify the quality of paddy rice. The article [11] reports on a comparative analysis of Naive Bayes, Decision Tree, Support Vector Machine, K-Nearest Neighbor (KNN), Bagging, and Random Forest Classifiers for crop prediction. The results of the analysis show that the RF classifier works better than the other traditional classifiers. The article reported in [12] utilizes a combination of Convolutional Neural Network (CNN) and Recurrent Neural Network (RNN) prediction models to classify the different types of blood-related diseases in patients. The comparison analysis of ResNet and Inception V3 with the CNN-RNN model was enumerated, and the result demonstrates that the CNN-RNN model provides better results [13]. The prediction of imbalanced data creates a crucial problem in the machine learning approach. In research work [14–16] a Synthetic Minority Oversampling Technique (SMOTE) is used along with an adaptive support vector machine to balance the data and predict disease.
Feature selection is a major process and creates a crucial task for data processing in machine learning techniques. The process of extracting the most significant data and eliminating the irrelevant data from the input data is called feature extraction. The K-Means Clustering algorithm and correlation-based technique were utilized in the article [17] to extract the features of high-dimensional data. Similarly, the multispectral image feature extraction model is reported in [18] which calculates the crop growth days to minimize the root and leaf damage rate. The presented software approach validates the soil testing parameters and vegetative developments. Multispectral drone mapping images are used to measure the quality of food production [19]. The presented approach considers the vegetative indices and enhances the quality of agricultural food production through image feature processing. The proposed system in the study [20] employs an ensemble technique to detect structural damage in a bridge, with Multi-Layer Perceptron (MLP), Support Vector Machine (SVM), and K-Nearest Neighbor (KNN) techniques serving as base classifiers. The use of a greater number of classifiers in the ensemble classifier creates a diversity problem due to its different accuracy ranges. The proposed work in the article [21] solves this problem using the diversity measure technique. The structure of the construction of the ensemble classifier is also discussed.
A comprehensive analysis was presented in [22, 23] for smart agriculture. The presented discussion presents the limitations of traditional farming practices and the benefits of smart agriculture based on artificial intelligence, sensor networks, the Internet of Things, cloud computing, etc., Distributed learning approaches are employed [24] to enhance the performance of smart agriculture. The presented data analytic service module provides feasible solutions for user queries using a neural network algorithm which is combined with a partial least square regression model. The quality analysis model enhances the yield and encourages sustainable farming practices. A similar IoT-based smart farming model reported in [25] tracks animal behavior in farms to avoid infections. The presented approach performs GPS-based tracking and performs probabilistic analysis to detect infections. The attained results are near to real-world scenarios which is the major feature of the presented research model. The smart agriculture monitoring system reported in [26] employs IoT sensors to measure the soil, air, water, and insects in the farm. Based on the collected information decisions are obtained for smart irrigation, pesticide spray, fertigation, etc., manual cost reduction is the feature of the presented smart agriculture model. Recently deep learning-based smart farming solutions are introduced. The precision farming model reported in [27] includes a deep learning approach to classify the soil moisture sensor data. compared to traditional statistical approaches and machine learning models, better data classification results are obtained in the presented approach.
From the above literature survey, it is analyzed that the performance of monitoring depends on the selection of microcontroller and sensors used, and the performance of prediction depends on the type of feature selection technique and classifiers used. Among all the machine learning classifiers discussed, the Support Vector Machine (SVM) based prediction model provides better performance. Also, in a few cases, convolutional neural networks provide better performance than other models. A few researchers employed combinations of classifiers for the prediction process, but the performance was not up to the level. To enhance the performance of the predicting system, the correlation approach-based ensemble classifier technique is introduced in this work and is discussed in the following section.
Proposed work
The proposed Smart farming system is discussed in this section. The proposed system is divided into two phases. The first phase includes the hardware modules required for the system and the second phase includes the machine learning approach used in the proposed work. The following Fig. 1 depicts the block diagram connection of the hardware used in the proposed system.
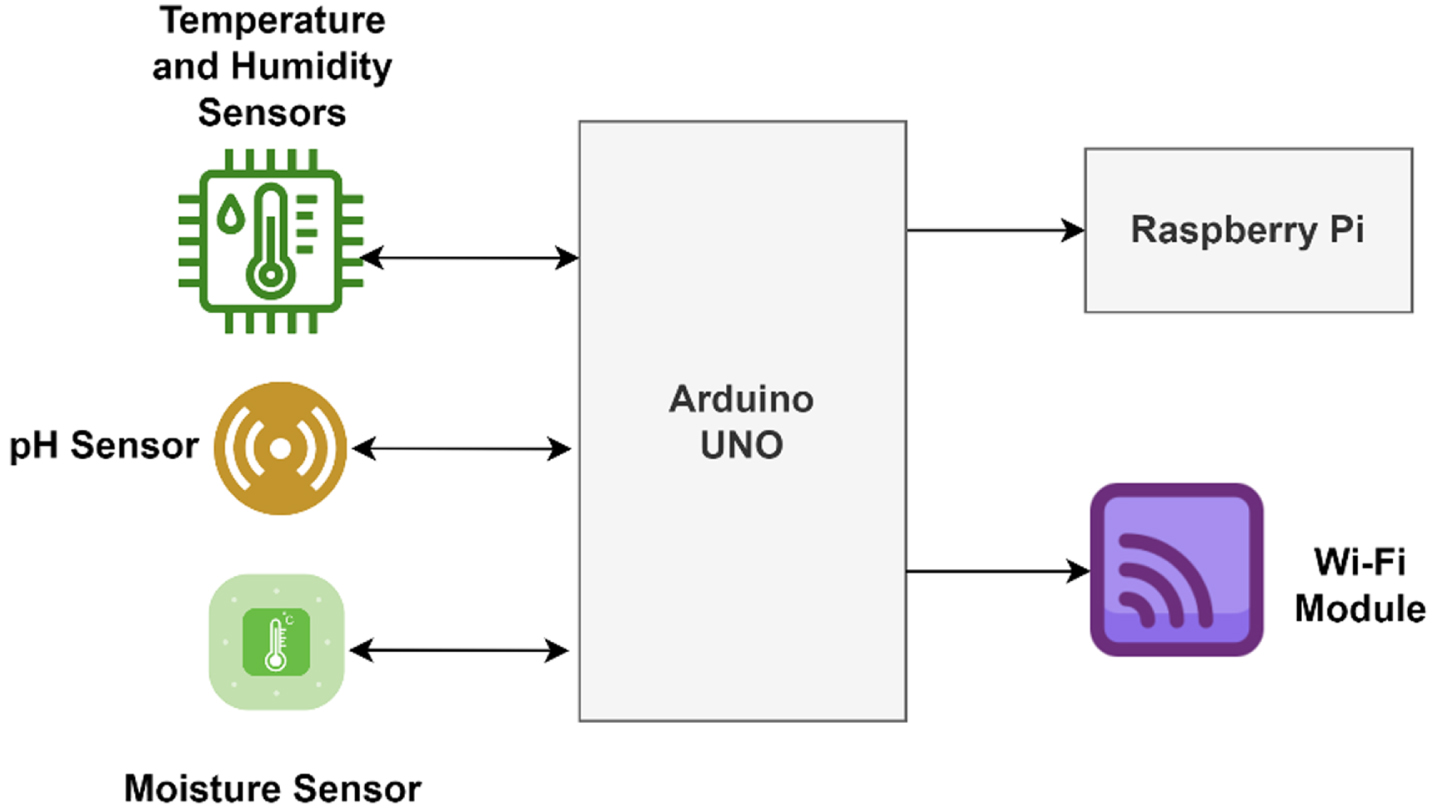
Block Diagram connection of the proposed system Hardware.
A) Arduino and Raspberry Pi
Arduino is the idea of an Open-source electronic prototyping platform that designs and construct and can be highly useful as a hardware tool in various automated application. Raspberry Pi is a sequence of tiny single-board computers with low cost and is also hugely used in many automated applications and research works. In this proposed work, an Arduino UNO R3 version microcontroller and Raspberry Pi 3 Model B+ are used.
B) Wireless Sensor Nodes (WSN)
WSN comprises a group of sensors to examine, monitor, and record the physical condition of the environment and it is also referred to as a network of sensors that can transmit the knowledge collected from an observed field through wireless links. A sensor unit is considered to constantly gather various soil information data such as temperature, humidity, moisture, and pH of the soil The WSN used in this proposed work includes three types of sensors namely i) SLHT5 Sensor ii) SKU: SEN0193 iii) pH EZO sensor.
i) SLHT5 Sensor
This sensor helps to measure the value of temperature and humidity in the soil. This sensor is designed with a weather-proof casing to make it long-lasting in underground soil conditions
ii) SKU: SEN0193
This sensor helps to find the value of moisture content in the soil. The value of moisture content represents the availability of water in the soil. The purpose of using this sensor is due to the property of having highly corrosion-resistant material.
iii) pH EZO sensor
This sensor is used to measure the amount of hydrogen present in the soil. The soil has a pH value in between the range of 0 to 7 is considered to have a high concentration of hydrogen ions whereas pH values in between the range of 8 to 14 are considered to have a low concentration of hydrogen ions and a pH value of 7 is considered to be neutral.
In farming activities, Soil monitoring is a necessary step for yielding better crop production. Soil monitoring helps the farmers to know about the soil information frequently. To focus on Soil monitoring, this work proposes scalable network architecture for monitoring agricultural farms in rural areas which are depicted in the following Fig. 2. The proposed monitoring system consists of four types of wireless sensor nodes (WSN) namely Temperature, Humidity, Moisture, and Ph, and each WSN is interfaced with an Arduino UNO microcontroller unit along with a Raspberry Pi and Wi-Fi module. These sensor nodes are also called edge nodes, they are used to detect the values and are connected with FOG gateways through MQTT. MQTT is called Message Queuing Telemetry Transport which sends the sensor value from the sensor to the fog gateway in a message form. Finally, FOG devices are connected to the cloud environment. The cloud will receive the sensor information through FOG gateways.
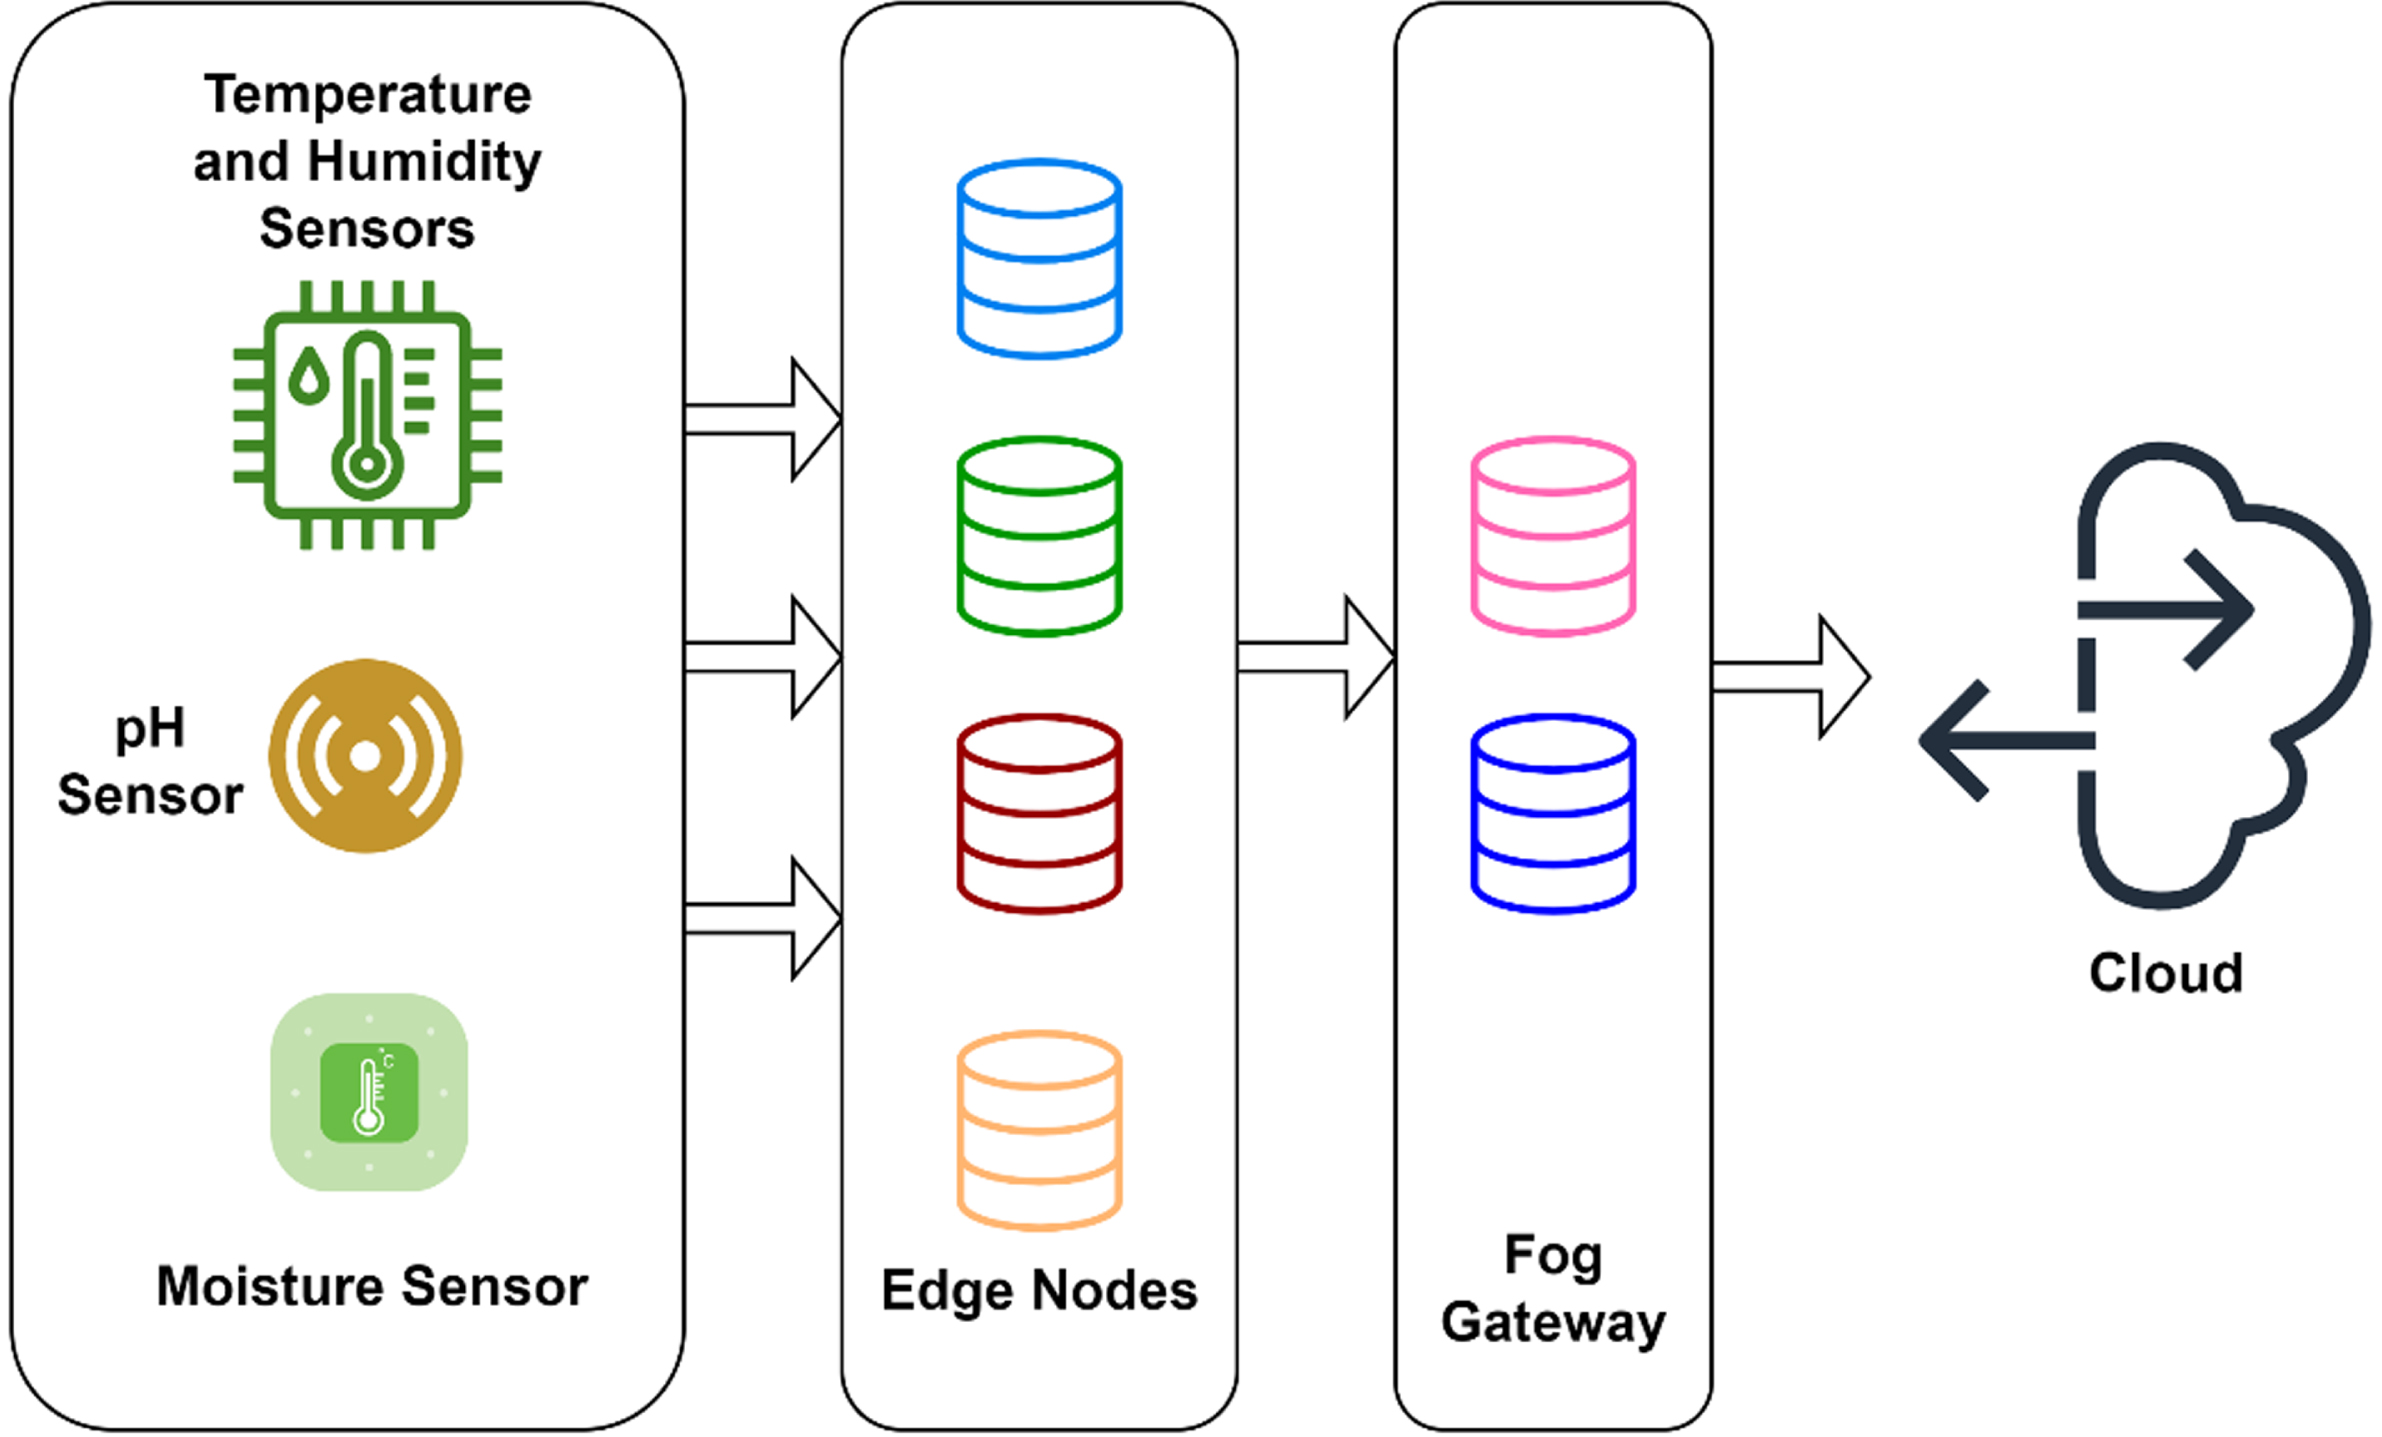
IoT – Fog-based Monitoring System for Smart Farming.
Feature Extraction is the most significant task to be performed by various machine learning techniques. It is the method of minimizing the feature set by choosing the important features from the real feature set corresponding to an evaluation condition and also eliminating the unnecessary features from the complete feature set. The proposed work uses a correlation-based feature selection technique to extract the features of the collected sensor data. This method extracts the features of the input data based on the correlation between the features. The value of the correlation coefficient becomes ±1 if the features between are linearly dependent, whereas the value of the correlation coefficient becomes 0 if the features between are not linearly dependent. The linear correlation coefficient for two variables (A, B) are given by
Consider the training set as X (G1, G2, G3, …, G
y
, G
n
) Gz, and assume X
s
be the important feature to be determined. Where ‘y’ represents the number of features and G
z
defines the class feature. The important features can be determined by finding the accurate T value. The value of t can be determined by considering that there is no correlation between them ∂=0
Where N represents the total number of data and C represents the value of the correlation coefficient for the sample instance. N-2 represents the degree of freedom. For finding the important features consider the significant level as P. From equation 2, when the T value satisfies the condition of significant level P, then those features are selected as important features.
The managing of missing values in a feature set causes an increased misclassification rate. This work uses the finite difference measure method to defeat this difficulty. Consider G to be the feature set with {G1, G2, G3, …, G
y
, G
z
}, X
list
be the dataset for training with n samples and X
miss
be the missed value from the missing value set {M1M2M3, … , M
m
}, where m is the number of missing values and U ={ U1, U2, U3, …, U
n
} be the samples. The missing value of G
i
can be obtained by using the finite difference operator Δ. Consider U1, U2, U3, …, U
n
be the values of the Feature G
i
, then the difference between the two preceding values in G
i
are given by the following equation
Prediction is a major process in smart farming to yield a good quality agricultural product. The proposed work introduces Ensemble classifiers to predict the desired output from the extracted features. The ensemble is a method of combining several individual classifiers to improve the performance of the prediction process. Rather than utilizing a single classifier for the prediction process, this technique combines various classifiers which in turn will increase the learning performance. In the proposed work, the Ensemble classifier is constructed using three base classifiers namely Linear Regression (LR), Support Vector Machine (SVM), and Random Forest (RF). From the Ensemble classifier, the predicted result will be identified. The prediction of the ensemble classifier can be performed using six different methods namely) Majority voting ii) Average Rule iii) Extrema Rule iv) Product Rule v) Decision Trees and vi) DS-based Rule. The proposed ensemble classifier uses a majority voting technique to determine the prediction result. The following Fig. 3 depicts the block diagram of the workflow for the prediction process.

Block diagram of workflow for prediction process.
Assuming the output label vector from the ith classifier as [qi,1, … . , qi,n]
T
∈ [0, 1]
n
. Where i = 1, 2, … ,m and When the classifier Q
i
labels the given sample as class β
j
then qi,j = 1 otherwise qi,j = 0. The majority voting result decision of the ensemble classifier for class β
k
is given by
Where ‘R’ represents the total number of classifiers used and ‘n’ represents the total number of classes used. The prediction result from the ensemble classifier depends on the majority voting of the classifiers used. Commonly there are three types of voting methods used for ensemble classifiers (i) unanimous voting (ii) more than half voting (iii) the highest number of votes. The proposed method uses more than half the voting technique. So, by using more than half voting technique, majority voting of the ensemble classifier gives an accurate prediction result (i.e., correct class label) when
Where ‘b’ represents the correct classification probability. The different classifiers used in the ensemble techniques do not have similar accuracy. To overcome this, there is a necessity to give high weight to the most accurate classifier. Since this work uses a concept of weighted majority voting, the degree of support for the various classes is used to define the output label. The individual function for class β
j
determined from weighted majority voting is given by the following equation
Where w
i
defines the value of the weighting coefficient for classifier Q
i
. From the above equation, the decision condition of the ensemble classifier becomes
If this condition is satisfied, then the ensemble classifier predicts the class label as β
k
=1 (i.e., Class 1), if not satisfied, then the ensemble classifier predicts the class label as β
k
=0 (i.e., Class 2). The value of selection for the weight is most significant in finding the overall performance of the ensemble classifiers. The weight of the individual classifier with independent accuracies b
i
, … b
R
are assigned using the below equation
The summarized pseudocode for the proposed ensemble classifier is presented as follows.
The performance of the proposed Ensemble prediction model for smart farming is discussed in this section using the benchmark Kaggle crop-recommendation dataset. The dataset contains 2201 agricultural data like rice, maize, banana, watermelon, etc. The dataset includes the values of temperature, humidity, pH, and rainfall and the values of the ratio of Nitrogen, phosphorous, and potassium content in the soil. The dataset is divided into two sets where 75% is used for training and 25% is used for testing. The average values are obtained from the last 20 epochs in the experimentation. The simulation parameters used in the proposed work are shown in the following Table 1(a).
Simulation parameters
Simulation parameters
The performance of the proposed model is validated through the values obtained from the confusion matrix. Figure 4(a) – (d) depicts the confusion matrix for neural network, ELM, PSO-ELM, and the proposed ensemble approach.
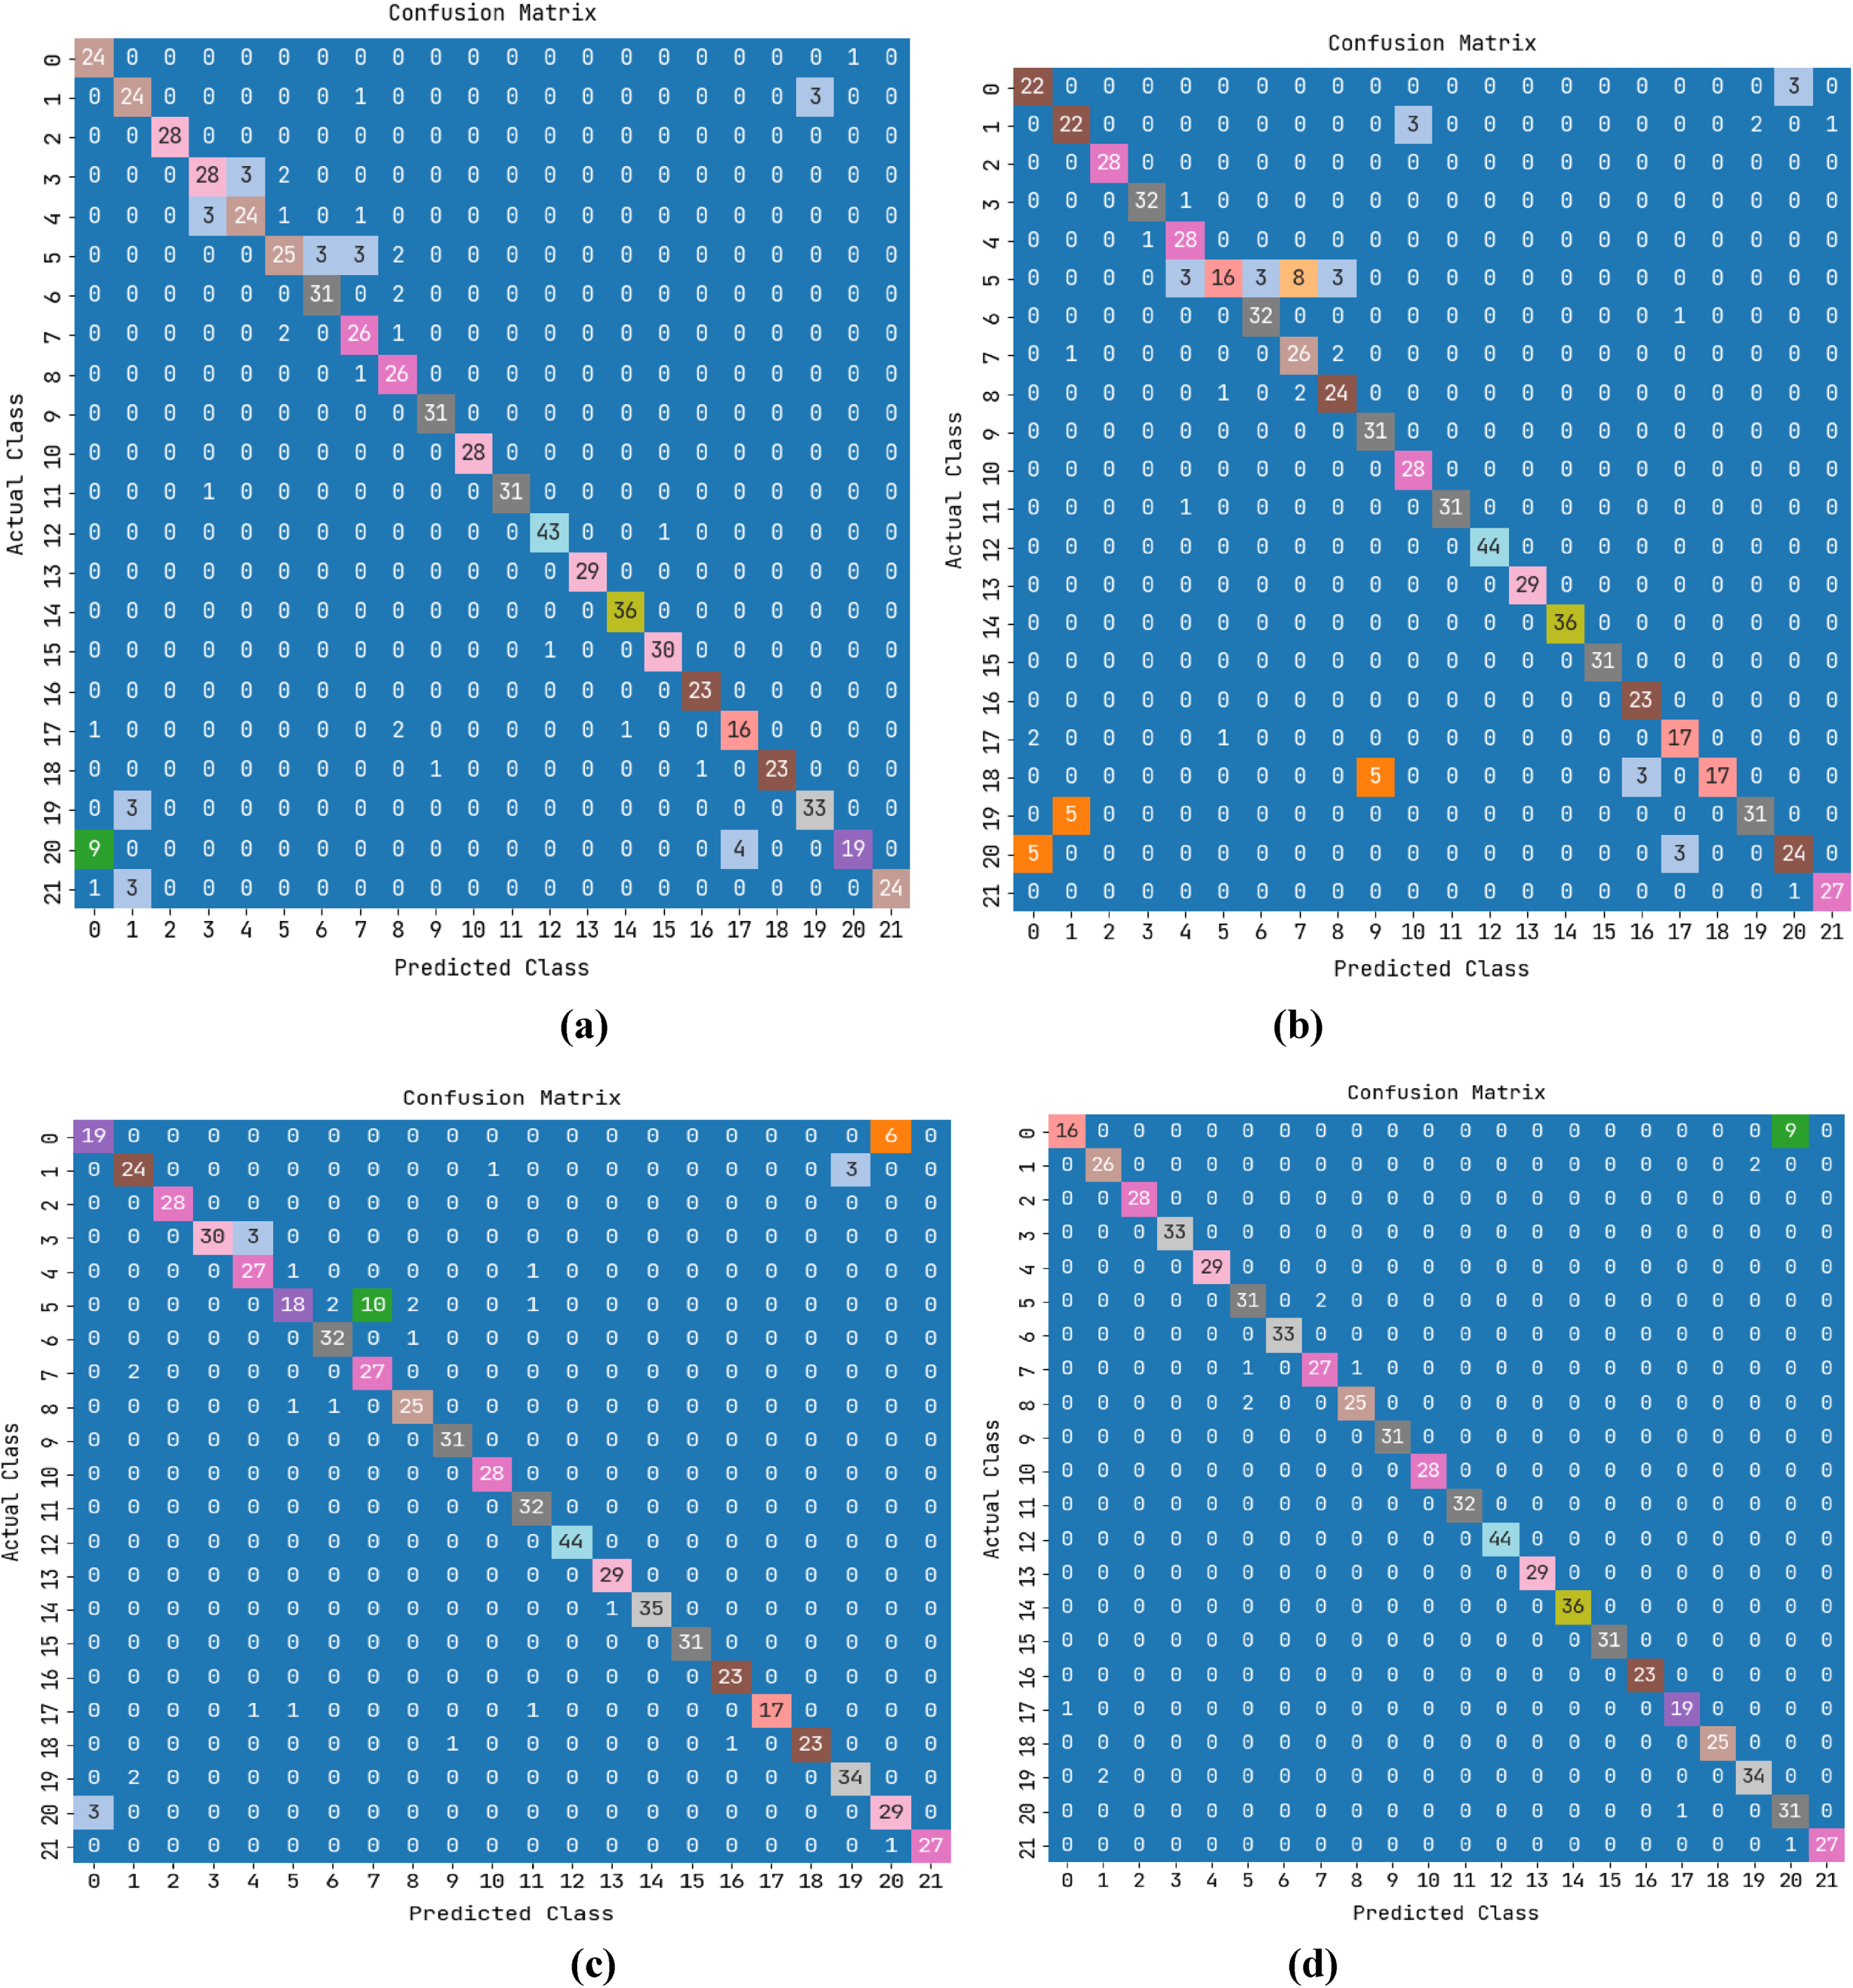
Confusion Matrix (a) Neural Network (b) ELM (c) PSO-ELM (d) Ensemble.
The ROC curve of the proposed model for both training and testing data is shown in Fig. 5 (a) and (b) respectively. It can be observed from the results that the true positive initially increases and reaches maximum even if the false positive increases. Similarly, the precision and Recall curve proposed model for both training and testing data is shown in Fig. 6 (a) and (b) respectively. Figure 7 (a to g) are depicted as simulation output of proposed system, the datasets of sensor values are obtained from sensor nodes. Which is available in the common platform (https://thingspeak.com/ channels/ 165 7668). For further validation, the performance metrics such as Accuracy, Precision, Recall, Specificity, ROC AUC Score, F1-Score, and Mathews Co-relation Coefficient are compared with existing techniques like Neural Network, ELM, and PSO-ELM Model and are presented in Figs. 8 and 9. From the results, it is observed that the proposed ensemble model obtained an accuracy of 96% for train data which is 7% greater than NN, 4% greater than ELM, and 3% greater than PSO-ELM. Similarly, the proposed ensemble model obtained an accuracy of 97% which is 5% greater than NN,6% greater than ELM, and 4% greater than PSO-ELM, for test data.

ROC Curve (a) Train Data (b) Test Data.
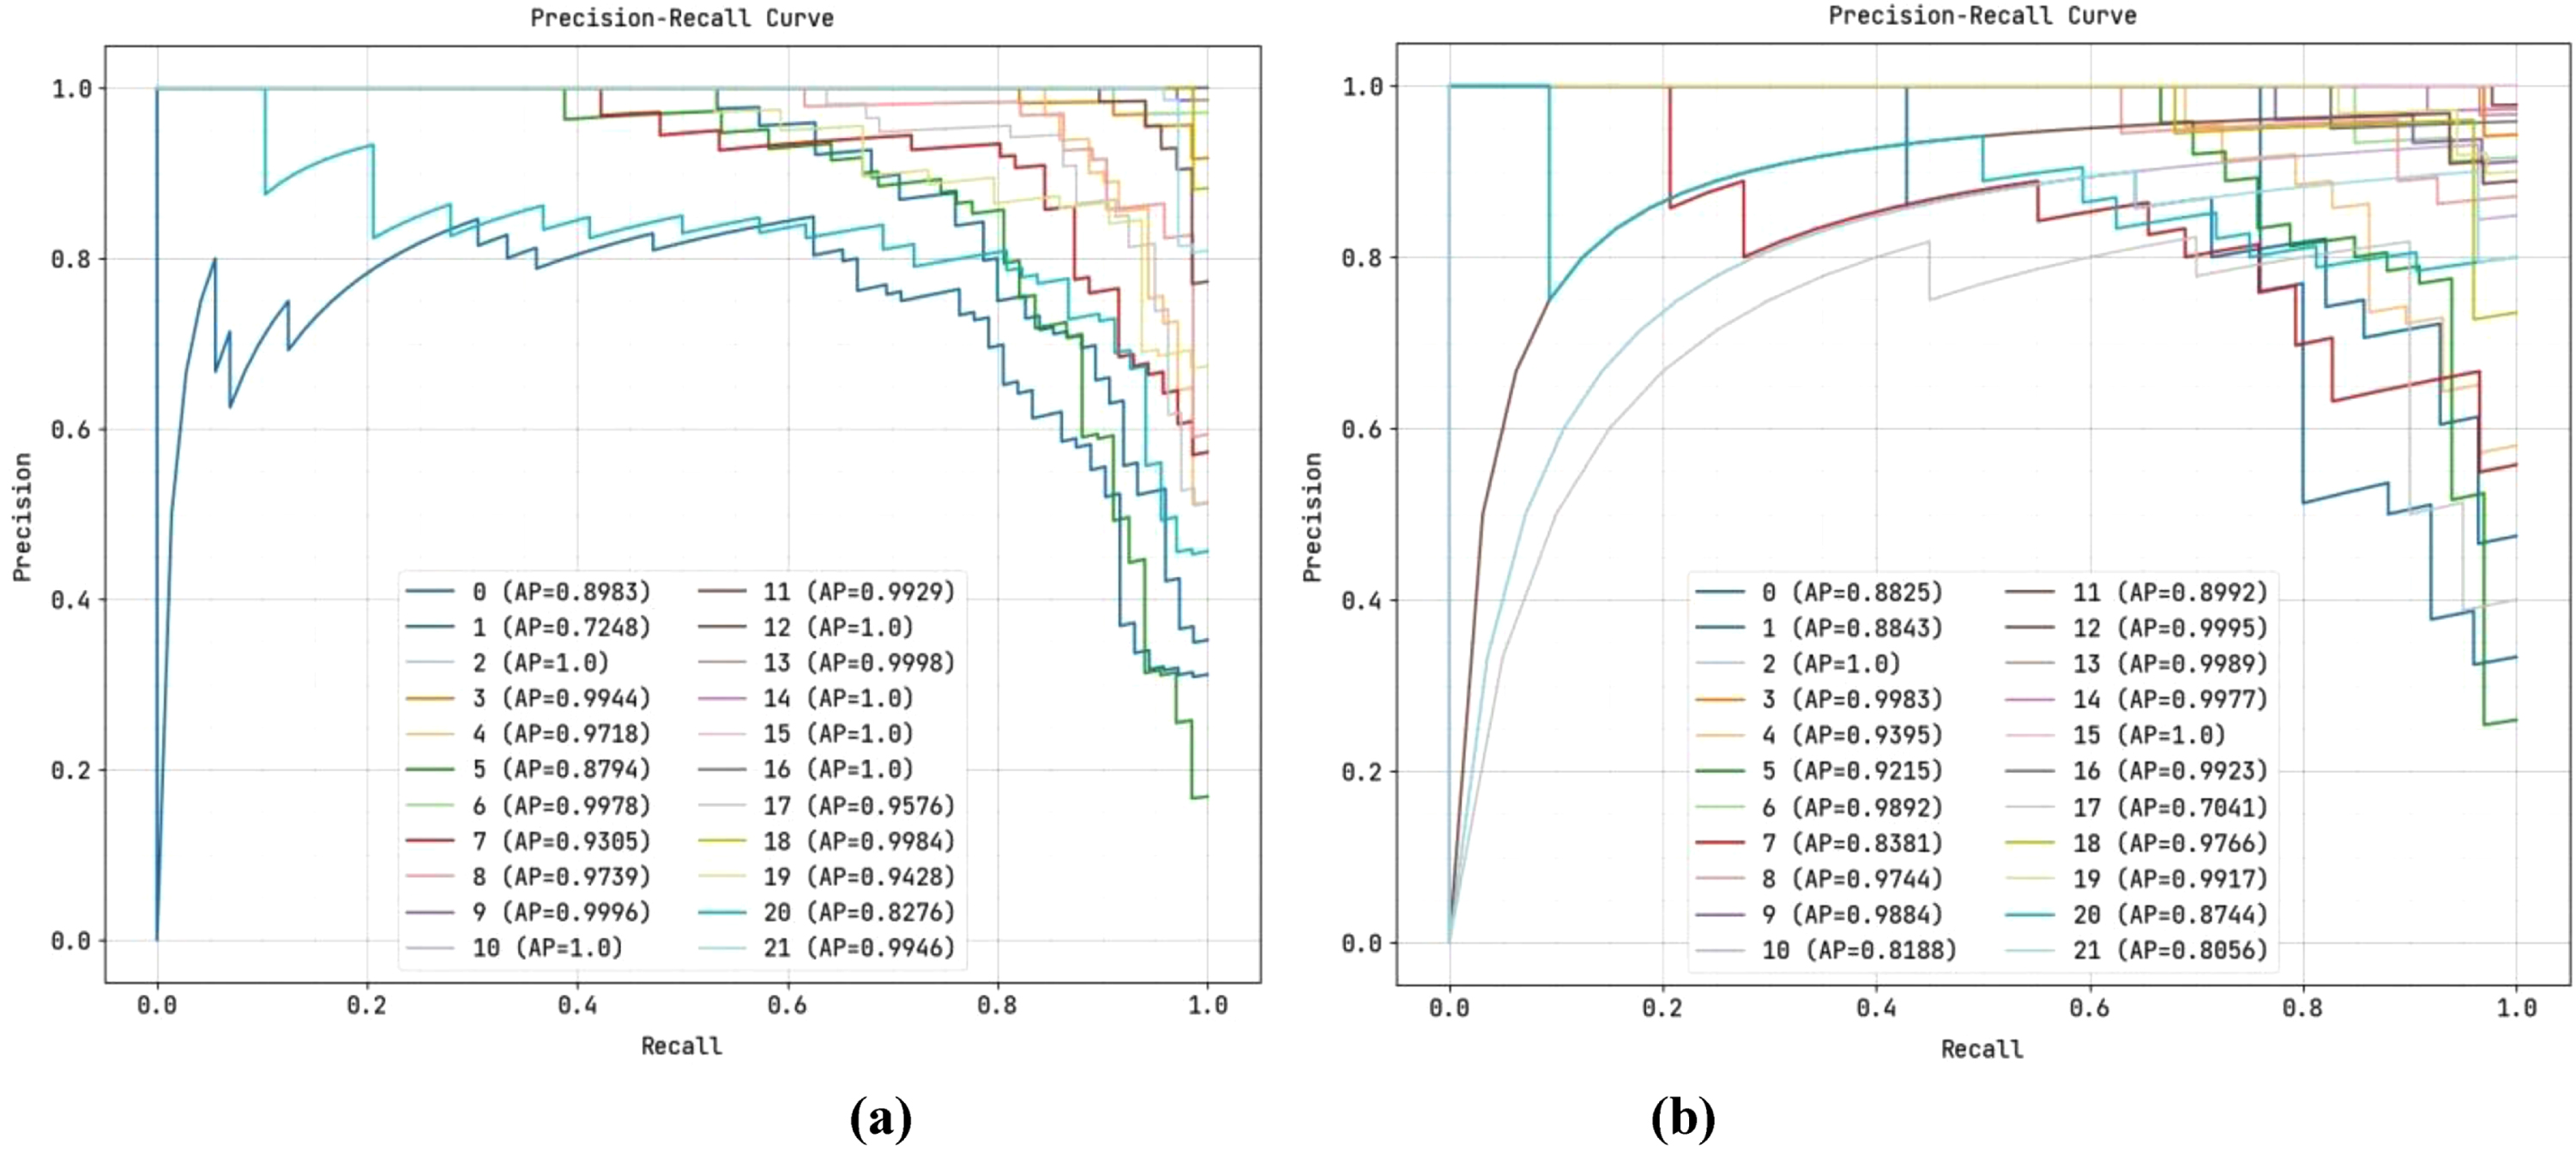
Precision-Recall Curve (a) Train Data (b) Test Data.

(a&b) Air-soil temperature measurements. (c&d) Air-soil humidity measurements. (e&f) Pressure measurements. (g) UV intensity measurements.
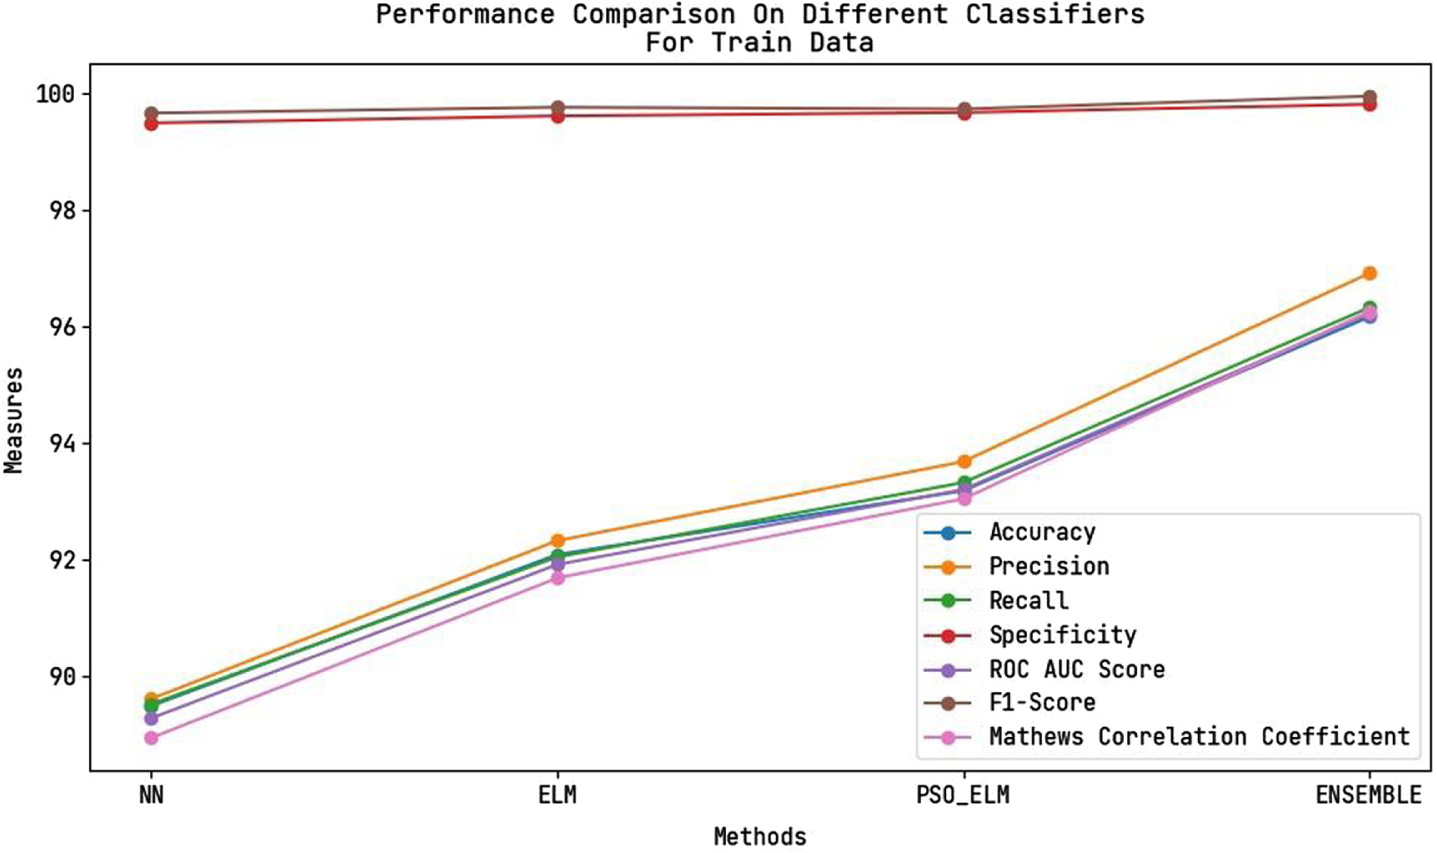
Performance comparison for Train Data.

Performance comparison for Test Data.
Table 1(b) shows that proposed system for sensor specifications, Table 2 depicted as comparative analysis of proposed work, and Table 3 depicted as performance analysis of various methods and accuracy. Further to validate the superior performance of the proposed model, existing research works in smart agriculture, and prediction models are considered for analysis. Different methods like Multiple Linear Regression, XGBoost-SVM, Neural Network, LS-SVM, Deep Neural Network, boosted regression, kNN-PCA, Random Forest, and Decision tree models are considered for analysis. From the results, it is clear that the proposed ensemble model attains maximum performance compared to conventional approaches.
Sensor parameters using proposed system
Performance comparative analysis
Comparative analysis with existing research works
This research work presents a monitoring and prediction method for smart farming in an IoT-FOG-based environment using a correlation-based ensemble method. The proposed system monitors with Arduino UNO and Raspberry Pi and uses a correlation-based ensemble technique for feature extraction and prediction. The proposed work was developed to reduce the farmers’ burden by reducing their physical effort and labor costs. Standard agricultural datasets are used for experimentation and verified through performance metrics like accuracy, recall, precision, f1-score, ROC curve, and Mathews Correlation Coefficient. To demonstrate better performance, traditional techniques like Neural Network (NN), Extreme Machine Learning (ELM), and Particle Swarm Optimization (PSO)-Extreme Machine Learning (ELM) are compared with the proposed correlation-based ensemble technique. Experimental results show that the performance of the proposed model is much better than the conventional approaches. Also, the performance of the proposed ensemble model has several benefits. However, the prediction result is possible only for binary classes, which is considered a minor limitation of this work. In the future, this research may be extended to predict multiple classes.
Footnotes
Declaration
Funding – The author did not receive support from any organization for the submitted work. Conflicts of interest – The author has no relevant financial or non-financial interests to disclose. Ethics approval – The paper is an original contribution of research and is not published elsewhere in any form or language. Consent statement – All authors mentioned have contributed towards the research work, and drafting of the paper as well as have given consent for publishing of this article. Availability of data & material – The author hereby declares that no specific data sets are utilized in the proposed work. The have also agree to be accountable for all aspects of the work in ensuring that questions related to the accuracy or integrity of any part of the work are appropriately investigated and resolved. Consent to publication – all authors listed above have consented to get their data and image published Code Availability – Since future works are based on the custom codes developed in this work, the code may not be available from the author. The authors have no relevant financial or non-financial interests to disclose. No Humans or Animals were involved in the experimentation.