
Abstract
Since prostate cancer is one of the most important causes of death in today’s society, the investigation of why and how to diagnose and predict it has received much attention from researchers. The cooperation of computer and medical experts provides a new solution in analyzing these data and obtaining useful and practical models, which is deep learning. In fact, deep learning as one of the most important tools for analyzing data and discovering relationships between them and predicting the occurrence of events is one of the practical tools of researchers in this way. This study segments and classifies prostate cancer using a deep learning approach and architectures tested in the ImageNet dataset and based on a method to identify factors affecting this disease. In the proposed method, after increasing the number of data based on removing dominant noises in MRI images, image segmentation using a network based on deep learning called faster R-CNN, and then feature extraction and classification with architecture Various deep learning networks have reached the appropriate accuracy and speed in detection and classification. The aim of this study is to reduce unnecessary biopsies and to choose and plan treatment to help the doctor and the patient. Achieving the minimum error in the diagnosis of malignant lesion with a criterion called Sensitivity of 93.54% and AUC equal to 95% with the ResNet50 architecture has achieved the goal of this research.
Keywords
Introduction
Convolution Neural Network (CNN) is one of the most important deep learning methods in which multiple layers are trained in a new way. These networks are a type of multi-layer neural network designed for two-dimensional data such as images. Different parts of the image are applied as input to the layers of the neural network, which is hierarchical, and appropriate features are extracted from the image in each layer by applying digital filters [1]. Convolution layers convolute different features of the image using different kernels. Convalo operation has three important features, including 1. Weight sharing mechanism in the same feature that reduces the number of parameters. 2. Connection of local learning 3. Invariability according to the position of the object. Due to the advantages introduced by the convolution operation, some well-known research papers use it as an alternative to fully connected layers in order to speed up the learning process. Prostate cancer is common cancer among men and is one of the leading causes of death. Statistics for 2018 indicate an equal number of 1.276106 new cases of prostate cancer, suggesting the untimely and inaccurate diagnosis of this disease and its symptom [2–4]. Prostate cancer is asymptomatic during its early stages and can be expressed only via PSA (prostate-specific antigen) [5].
With PSA increasing, tissue sampling is also carried out that may prove the presence of cancer. But to determine the progression of the disease and its stage, it is necessary to use imaging. The reason is that it is much more reliable and less repeatable; it is also less dangerous than sampling (biopsy) [6].
Magnetic imaging by providing an acceptable report on the condition of prostate and PI-RADS increase sensitivity in diagnosing prostate cancer [7]. As there are various magnetic imaging techniques such as T2 W, T1 W, DWI, and ADC, a correct diagnosis is also highly a matter of the radiologist’s experience and physician [8–11].
Figure 1 displays an image of prostate MRI scanned using T2 W. Both images show prostate cancer, but as it is seen, the malignant tumor type is dark, and the benign one is light. In the images provided by T2 W, prostate cancer tends to be seen as an area of low signal in an area of high signal [12].
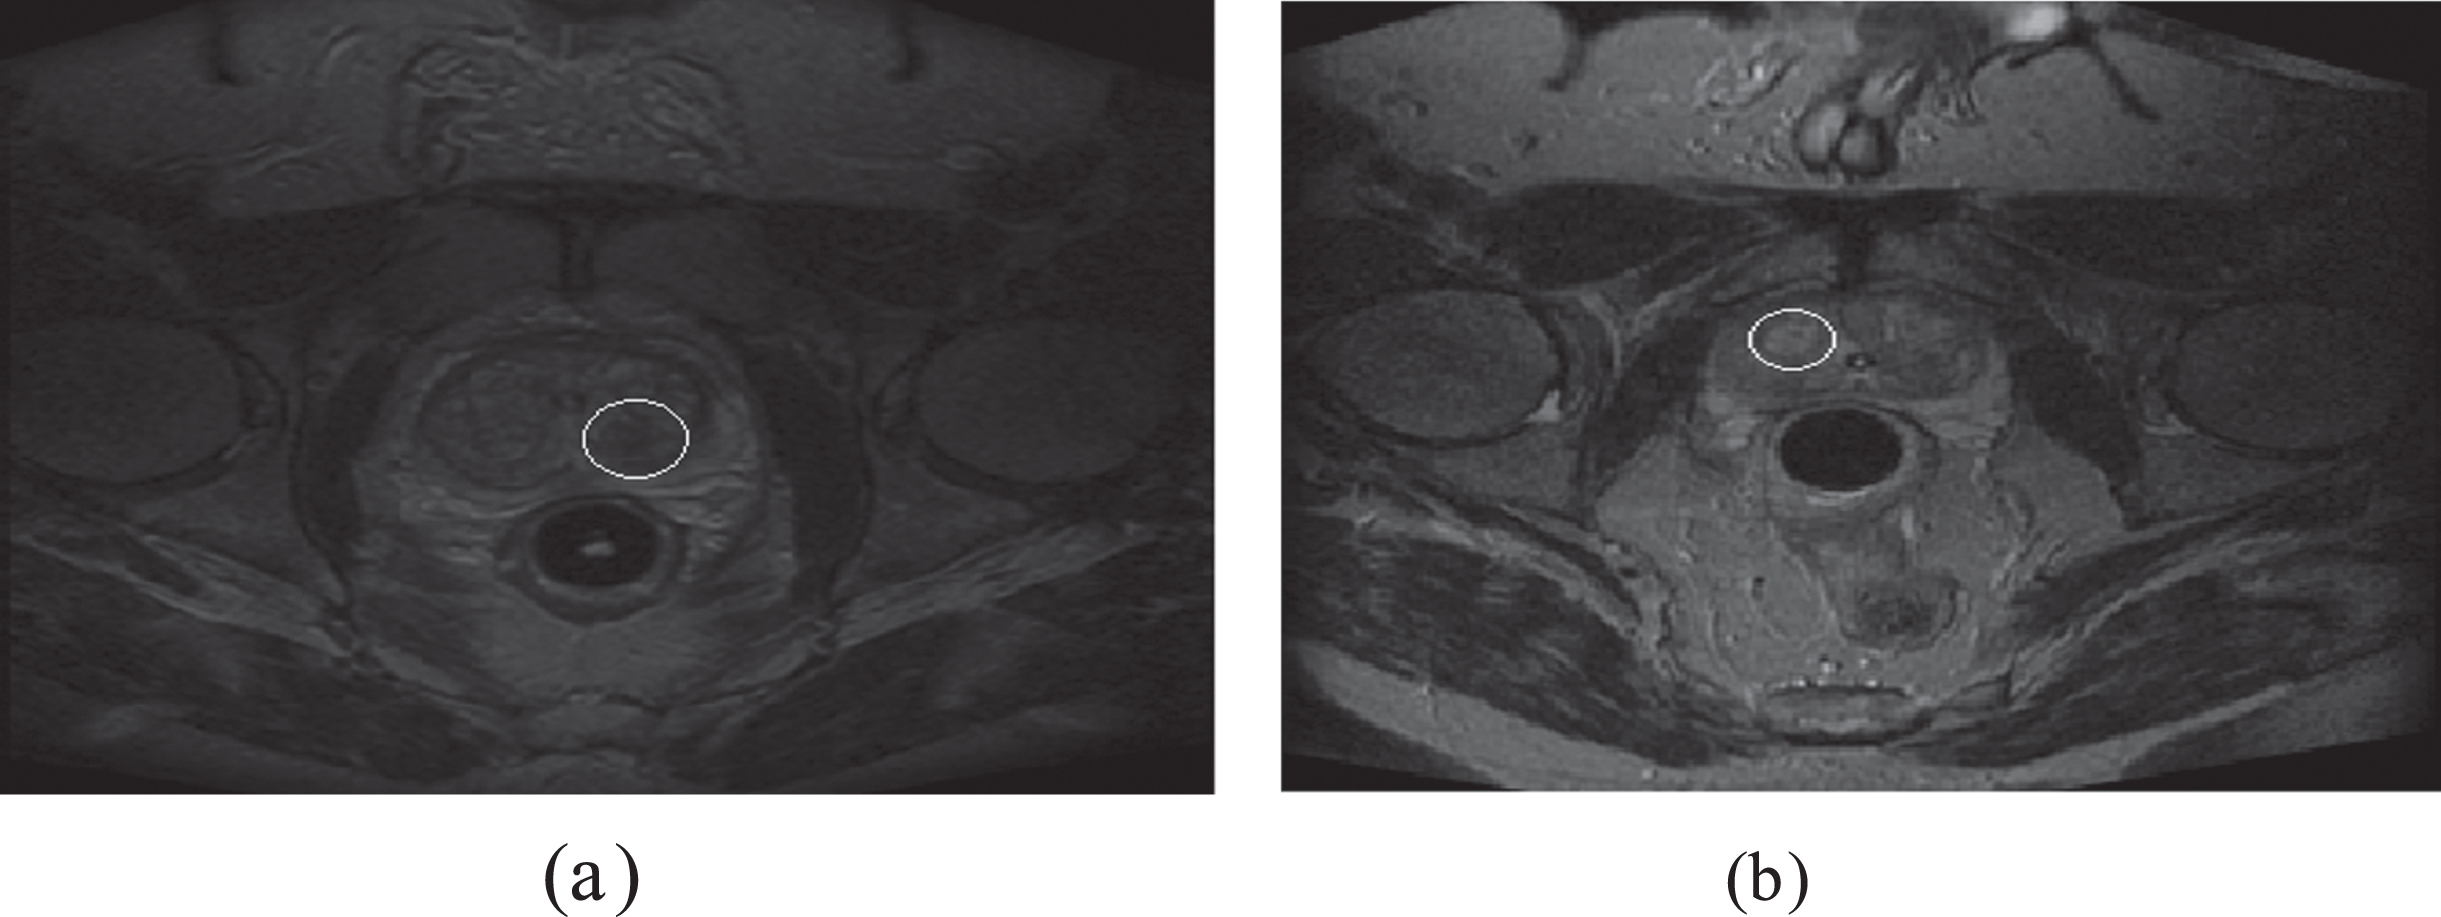
Images of the prostate gland located in the pelvis at the center of the image. Image (a) shows malignant cancer and (b) benign type.
Hence, the accuracy in imaging and choosing features effective in the disease are very important. Deep learning techniques which use extremely powerful convolutional neural networks have been hugely successful in diagnosing and classifying lesions in medical images [13].
But what has called these techniques into question is the limited data they provide for these networks as the input for training. This article has aimed to present a new method for increasing data. Then, results have been examined with the application of a deep learning network for diagnosing prostate cancer. Due to the high importance of morphological features of images, this method enables the production of new images with high differentiation. In the end, performance has been assessed by comparing the results obtained from other methods and those from this method.
In [14] using transfer learning method, they investigated the differentiation between benign and malignant lesions. They have used the MRI images of 200 patients by combining the images obtained from the protocols T2 W and ADC and a pre-trained network named Vgg16.
In the research conducted in [15] the authors have been able to identify different areas by combining the images obtained from protocols T1 W and T2 W and applying the deep learning based neural network named U-net Separate the damaged prostate.
In the research conducted in [16] a 3D neural network was created based on three different types of imaging in the T2 protocol (axial, sagittal, coronal). They have given the name of this network. In the performed work, the prostate gland is separated from the rest of the image. The number of patients was 89.
In [17] deep learning network and protocol T2 W is used, in this article the u-net architecture is combined with the ResNet50 architecture and finally to separate benign prostate cancer from malignant, the result is AUC = 0.645. In [18] with a change in the ResNet architecture and the use of images with DWI protocol related to MRI and forest classification to finally separate benign prostate cancer from malignant, the result is AUC = 0.84. in [19] With several different protocols, prostate cancer examination by a physician such as DRE and PSA and MRI images and the use of deep learning networks resulted is AUC = 0.889. in [20] reviewed articles on the use of CNNs in the diagnosis of prostate cancer and concluded that the mean AUC was 0.79 (range between 0.77 and 0.87).
Considerable research has been done on the issue of automatic cancer detection on digital histopathology tissue imaging and mammography images; These research efforts have provided valuable insight into the nature of this problem.
In (21) using the extraction of energy and entropy characteristics of multi-wavelength coefficients of images, they presented a system for automatic grading. In this method, two-level multi-wavelet transform is taken from each image. Which is graded using those images, in which 90% accuracy is reported. In (22), the authors achieved accuracy values of 90 and 85% by using two steps of AdaBoost classification: 1. Labeling in a superpixel image configuration 2. Using except for texture to provide a classification of prostate cancer images. In [23] the authors extracted subgraphs from labeled images by using local structure training in the training phase and stored them in the codebook. Then, in the test phase, the subgraph extracted from each image is compared with the code book and graded. In this method, the accuracy of 91.25% has been observed in the best case for images related to prostate cancer grade.
In the field of combined methods of testing with different features with properties such as texture, which includes multiple Harlick wavelet transform and shape features, has been used to identify benign and malignant masses in breast cancer. And genetic algorithms are considered to extract more features, which increases the accuracy of cancer diagnosis [24]. In the field of support vector machine, by increasing the maximum threshold level for the image, the applied differences are improved, then the texture and spectral characteristics of the domain are selected, and a support vector machine classifier is used to classify benign and malignant breast cancer [25–27]. In the field of deep neural networks, the Googlenet algorithm with its own architecture, which is one of the most widely used deep learning algorithms, has been used on the digital mammography database related to breast cancer, and its results have been reported to be 85% accurate in tumor detection.
Unusual findings in pathology and mammography images such as mass and asymmetric density can lead to the diagnosis of cancer. The risk of classifying cancer patients has made many research teams focus on using deep learning methods. These techniques have also been used to model cancer risk, disease progression and treatment. The challenge of deep learning to identify key features from complex data sets shows their importance in this modern era of medicine.
The proposed model is more accurate than other methods. Because deep convolutional network with hierarchical learning and extraction of high-level features can achieve better performance than other methods that use low-level features of images. In addition, in this method, the feature vector extracted from each image is reduced, and this increases the speed of classification and recognition.
According to recent research, the main contribution of this article can be categorized as follows: Introducing the Faster R-CNN network for regionalization and separation of the prostate region from the pelvic MRI image. Since the Faster R-CNN network has not been used as an automatic separation network of the prostate gland from the rest of the pelvic image, and by conducting research, we have shown that the use of this network has been able to separate the prostate region with high accuracy. Integration of preprocessing and data augmentation stage in order to reduce the computational load. Since in the use of images for a computer system, there are always pre-processing methods such as applying noise removal filters as a mandatory procedure in the stages of using the image, and this causes changes in the image level and possibly removing some pixels; As a result, raw images are always deleted. Therefore, relying on the principle that we need raw images to process medical images and also due to the use of deep learning architectures, we need a large number of images, so it is possible to use filtered images as Added images included; Because the doctor, in order to analyze a medical image in the computer system, applies different filters on the image, examines and categorizes and applies the final result based on the visible data in different images. Increasing the accuracy of separating the type of disease in order to distinguish the benign and malignant type of the disease. It is always important to increase the accuracy of detection in the use of computer systems. In the conducted research, the aim of increasing the accuracy was to increase the accuracy in separating benign from malignant cancer. Diagnosing the area of the lesion in the prostate gland with high accuracy. Because ResNet50 has 50 convolution layers and ResNet101 contains 101 convolution layers. Generally, the more the number of layers, the greater the depth of the network and, as a rule, the better response should be obtained.
Materials and method
The images used in this study are taken from a database on the Brigham Hospital website [28]. In this database, MRI images of 230 patients of different weights are available. Of course, a small number of these images were usable in image processing, so the number of images approved by the doctor with the method has been increased. All patients registered on this site have prostate cancer and the benign and malignant type of this disease has been confirmed by a reputable doctor. This set is a small set that can be considered as a development set in deep learning systems to generalize to large classes. The development set is the set on which the experiments are performed and the hyperparameters of the deep learning architecture are set for it, and after obtaining suitable results, they are considered for the larger set. In this study, the number of MRI images of the prostate using T2 W falling into two benign and malignant types by the physician increased using the popular methods of noise removal in image processing. Then to separate the prostate gland from the rest of the image, the efficient method of Faster R-CNN utilized for region segmentation. Later, for feature extraction and automatic classification, a convolutional neural network with different architectures was used. Finally, these architectures will compare in terms of their efficiency. The results will compare with that of similar methods, which showed the efficiency of this method in response speed and relative accuracy. Figure 2 displays a general overview of the presented methods.
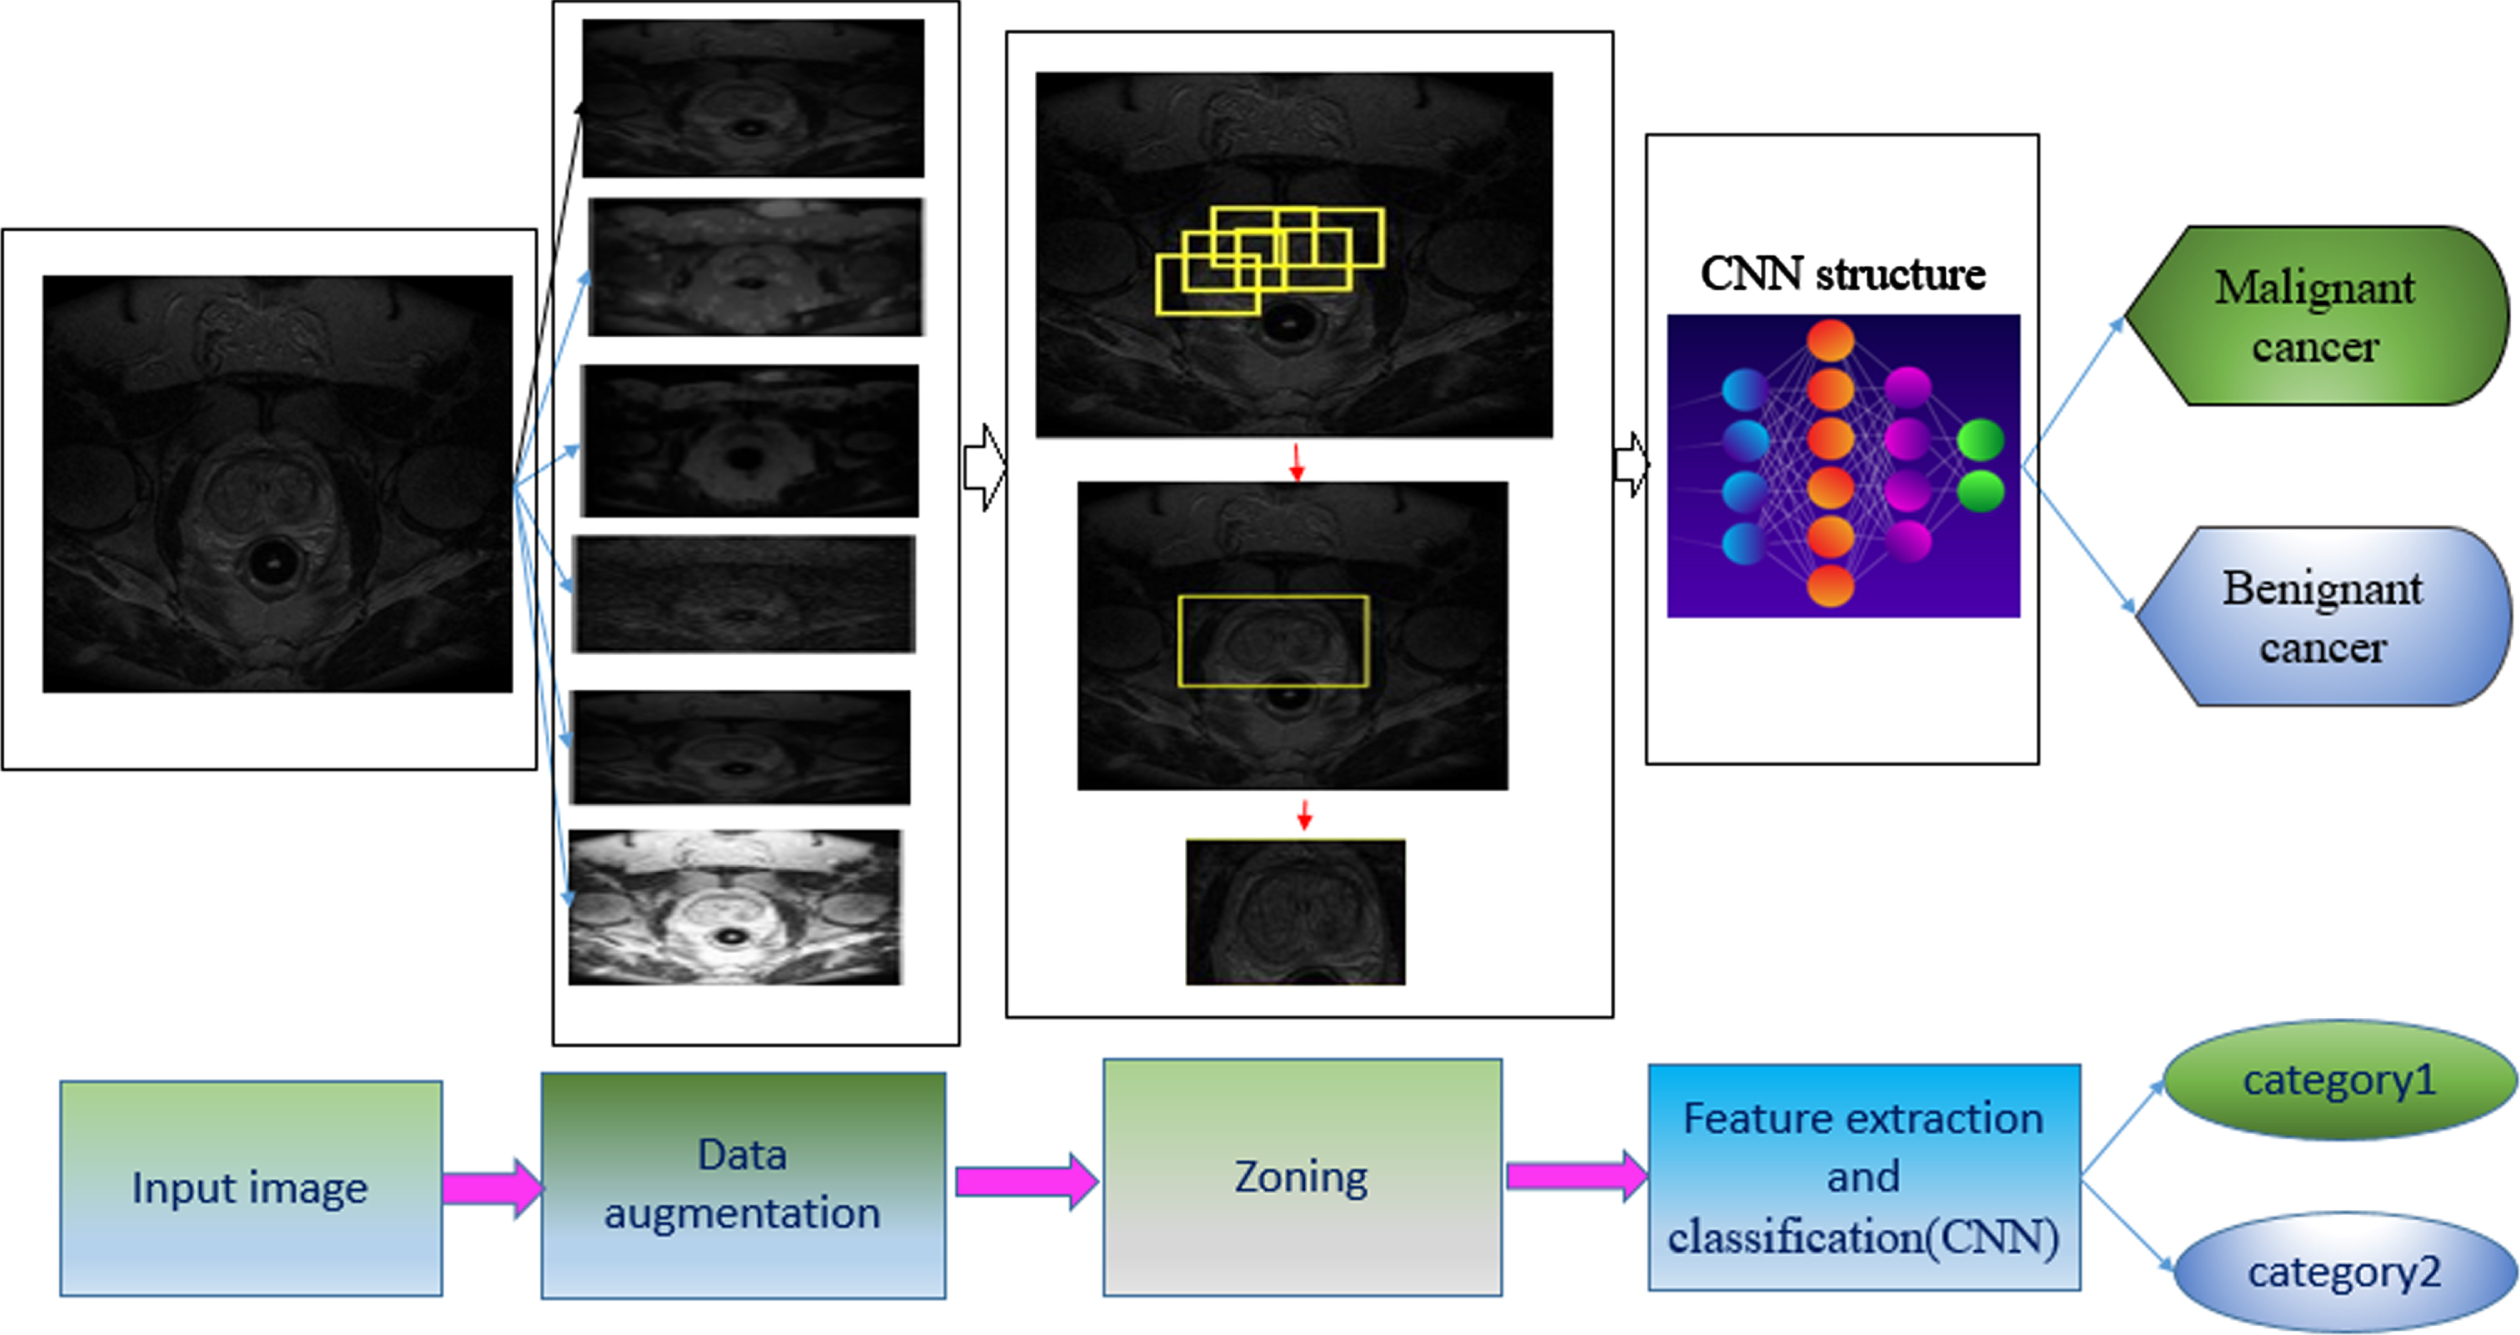
Overview of the proposed method. The Faster R-CNN function sequence, followed by feature extraction by CNN and finally classifying the input image as benign or malignant.
In this study, MRI images were used using T2 W related to 31 prostate cancer patients. This number of images was too small for an in-depth learning-based education system. Thus, it is possible to increase this number using common techniques of data augmentation like rotation, scaling, cropping, translation, color augmentation and then carry out preprocessing which includes applying noise removal filters [29, 31]. Here to minimize the execution time, data augmentation was done using the popular methods of image processing. Due to its valuable characteristics in extracting the features of images, morphology was also used for increasing their number. Structural and formal characteristics like shape, color, and patterns are investigated in morphology. The basic morphological operators are erosion, opening, closing, and dilation. These operators are used for filling holes, connecting objects, etc. In morphological processing, the sizes of the input and output images are the same. In utilizing the dilation operator, the pixels related to the borders of objects are added. In erosion, the pixels of the borders of objects are removed. The closing and opening operators are a combination of the other two operators. Due to their characteristics, the dilation and erosion operators are more widely used [32].
And this article has used these two more common operators, too.
As shown in the Fig. 3, it is clear that the use of dilation and erosion operators to display image information and prostate anatomy perform better compared to the image opening and closing operators.

In number a, the original image of the prostate taken from the MRI device is shown, and in images b to e, the image created after applying morphological filters includes expansion, erosion, closing and opening.
Therefore, these two more common operators have also been used in this research.
Gaussian filters [33], histogram equalization [34], and the median filter are among popular filtering methods in image processing for removing noises common in MRI images [35, 36].
Hence, we will have more realistic images for processing. Surely the response speed will go higher with the removal of the preprocessing stage independently and the combination of the preprocessing stage and data augmentation. Therefore, in addition to the image itself, five different types of masks have been applied to the images, bringing their number to 186.
Zoning or separating the image means separating one part of the image from the others. Separating one area from the rest of the image can be done using area segmentation methods. Currently, one of the popular methods in this regard is Faster R-CNN [37]. This network has several advantages for region segmentation; in this network, the features of each convolutional layer can be used for predicting the related region proposals. Hence, there is no need for an algorithm like selective search, and therefore the model gains speed without repetitive computations. Faster R-CNN is formed of two modules: RPN [38]and Fast R-CNN [24]. In this network, the input image enters the RPN network after mapping the feature by CNN network convolution layers. Suggested areas are generated in RPN; these areas are likely to be present in the area in question. This network has many advantages over one-stage systems such as Yolo [39], SSD [40]. Among other things, the computational cost of the proposed areas is significantly reduced and also this network has no limit to perform calculations on the size of the input image and it can be implemented on real images.
On the other hand, in Yolo, the input size should be 3*448*448, and in SSD, the input size is equal to 3*300*300. The next problem of zoning networks introduced with deep learning infrastructure such as YOLO and SSD is having only one integration threshold equal to 0.5, which we do not face in the Faster R-CNN network and by choosing a different integration threshold, we can create boxes Choose the high score as the output for multiple overlap [41].
Figure 4 shows how the Faster R-CNN network works on the image. The extraction process of the prostate area is depicted. After extracting the specific features through the domain selection network, the domains produce the same size called ROI, then transfer to the fully connected layer, where they are sorted by a Fast R-CNN layer.

Shows that after entering the image; the important parts of the image are selected using the selected CNN network.
The way the network works Faster R-CNN is that at first the feature map of the desired image is mapped by a pre-trained convolutional neural network such as AlexNet. The selected feature map is given to the network. On the other hand, at the same time, the extracted feature map is given to the area suggestion network to create a number of bounding boxes and perform the necessary adaptations based on the suggested bounding boxes in the training data set. The output of the proposed network of areas that are bounding boxes is combined with the output of the network Fast R-CNN and finally we will have the answer of the network that includes the bounding box enclosed around the desired area and its location.
This network is set up for implementation in Matlab software environment after the labeling operation and preparation of the training data set, with only several parameters in the input for the training section, and then the trained network in the evaluation section to reveal the desired areas on the images. Test rejections are used. The reason for using AlexNet network is the low number of parameters and finally the high-performance speed for using the used hardware.
In this research, 80% of images are given to Faster R-CNN as the training. This training is done by the pre-trained network AlexNet [42] then 20% of images are used for assessing the network [43, 44]. In this way, the prostate area is separated from the rest of the MRI as the target area.
In using a deep learning network in order to reach the best answer, an optimization method should be used. In optimization methods, the selection of hyperparameters is very important to minimize the error in the shortest time and with minimum calculations. In this research, in the separation part, the stochastic gradient descent method (SGDM) with the initial rate 0.001 and momentum equal to 0.65 has been used.
After applying the Faster R-CNN network, we were able to achieve an accuracy of 89% in the stage of separation and creation of a bounding box for the prostate gland in the MRI pelvic image.
In recent years, deep learning networks have helped physicians diagnose diseases. Using improved algorithms, the method of deep learning can provide precise and professional predictions about an image. This is carried out by creating a training model from a separate data set, the validity of which is later assessed. In unsupervised learning, the software identifies a behavioral algorithm unassisted. In supervised learning, a new set with correct tags is produced. Today machine learning systems are mostly based on supervised learning. To train a network, we must either create a new architecture based on the different layers introduced in the Caffe framework, or Keras, or ONNX, or use the structured frameworks introduced. Research shows that creating a new network can increase computing costs. In addition, there will be a need for strong hardware. Of course, the advantage off-the-shelf-network cannot be lost. But currently, due to the capabilities of the introduced networks due to training on a large number of data sets, including ImageNet [31] pre-trained networks can also be used. These networks have high generalizability, robustness and certainly, and measures have been built into them to deal with the problem of overfitting. If we want to use these pre-trained networks and architectures, this can be done well with the transfer learning method. In the learning transfer method, the weight of the upper-level layers of a network of valid pre-learning related to one’s field of work can be maintained. Preservation of layers is done by a method called freezing. After freezing the high-level layers, the last layers, including the last fully connected layer, were privatized for the desired training data. For example, the Google Net network, which was trained on the ImageNet image dataset, and its weights and biases are publicly available, has 1000 output classes. This network can be fine-tuned on the image dataset with two output classes [45, 46]. Some features need shallow networks while others produce better responses with deeper networks. However, the main aim of medical image processing is to segment images into several regions having the same features. In this regard, CNNs are best for this challenge because feature extraction and classification are done simultaneously in them. In this research, different CNN architectures were compared to diagnose the two types of benign and malignant prostate cancers [47].
Much work has been done to use CNN [48] to diagnose prostate cancer and the extent of the disease [49]. In this study, different CNN architectures for the diagnosis of prostate cancer in both benign and malignant types are compared, and the results show the acceptable performance of the proposed design.
In choosing a pre-trained network, three points should be considered; The number of parameters extracted; size of network and the accuracy created in the predictions. The number of network parameters is important because they affect the processing time. In a computer system, in addition to accuracy, we also need high speed. In this research, the architectures of ResNet family and MobileNet architecture have been compared in terms of performance. According to the results announced in ImageNet Dataset, it is expected that ResNet18 network has the highest response speed and ResNet101 has the lowest response speed. Also, the ResNet101 network should produce the best answer for the accuracy of the network.
ResNet neural network
Residual neural networks rank first in regard to the challenge of LSVRC2015. The ResNet architecture with a maximum of 152 layers is designed to overcome the overfitting problem for teaching and learning. This architecture outperforms its previous architectures like AlexNet and GoogleNet [50]. In this structure, the network is formed of accumulated residual blocks. The word residual or sediment actually means the calculation of the residual or error between two inputs. In deep learning networks, the goal is to obtain the identity function. In ResNet architecture, the design is such that the network itself learns to obtain exactly the training input by generating the residual function compared to the same function. The building block of a sediment network is depicted in Fig. 5.

The block used in ResNet architecture is shown. F(X)+X formulation can be realized by networks with training type adjustment with shortcut connections.
Different architectures with various layers have been introduced so far including ResNet18 where 18 layers are used for training and learning. ResNet34, ResNet50 and ResNet101 are 34, 50 and 101 layers deep, respectively [51]. The more layers, the deeper the network, and the better the response should be. But if the response speed is lower and the relative accuracy is desired, shallow networks should also be considered.
It is a convolutional neural network that has 53 layers of depth. You can download a pre-training version of the trained network of over one million images from the ImageNet database. The pre-trained grid can categorize images into 1000 categories of objects, such as keyboards, mice, pencils, and many animals. The MobileNetV2 architecture reverses from a residual structure in which the input and output of the remaining blocks are thin layers of bottlenecks. It also uses lightweight twists to filter the properties of the expansion layer. Finally, it eliminates nonlinearities in thin layers. High speed, low number of parameters, and acceptable accuracy feature strongly in MobileNetv2 neural networks. Having a convolution different from the standard one is the reason for having the minimum parameter in this architecture [52].
The internal structure of the CNN network is shown in Fig. 6.
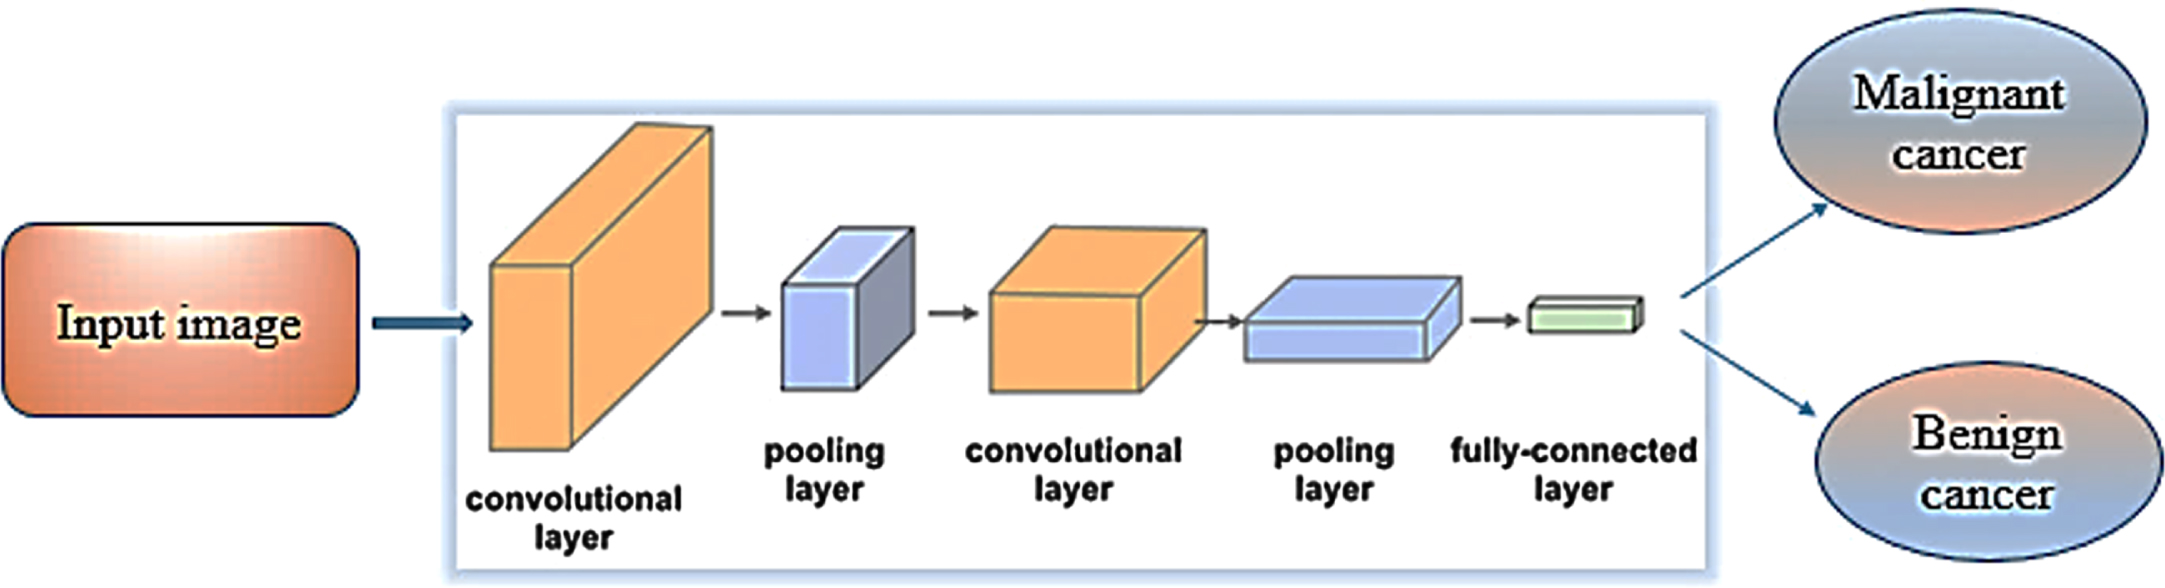
The internal structure of the CNN network is shown.
Figure 6 shows how to extract features and classify data. In this way, the images from the previous stage, after passing through the convolution layers and pooling layers, the features extracted by the fully connected layers are divided into two categories, benign and malignant.
One of the main stages after designing the proposed model is performance assessment, accuracy, and truth. Sensitivity and specificity are two vital indices for the statistical evaluation of performance and the results of classification tests. The quality of the proposed method is possible to be measured and described using sensitivity and specificity [53]. Post-analysis data are classified as below:
True positive (TP), false positive (FP), true negative (TN), and false-negative (FN).
Figure 7 shows the location of the TP, FP, TN, and FN criteria in the confusion matrix.
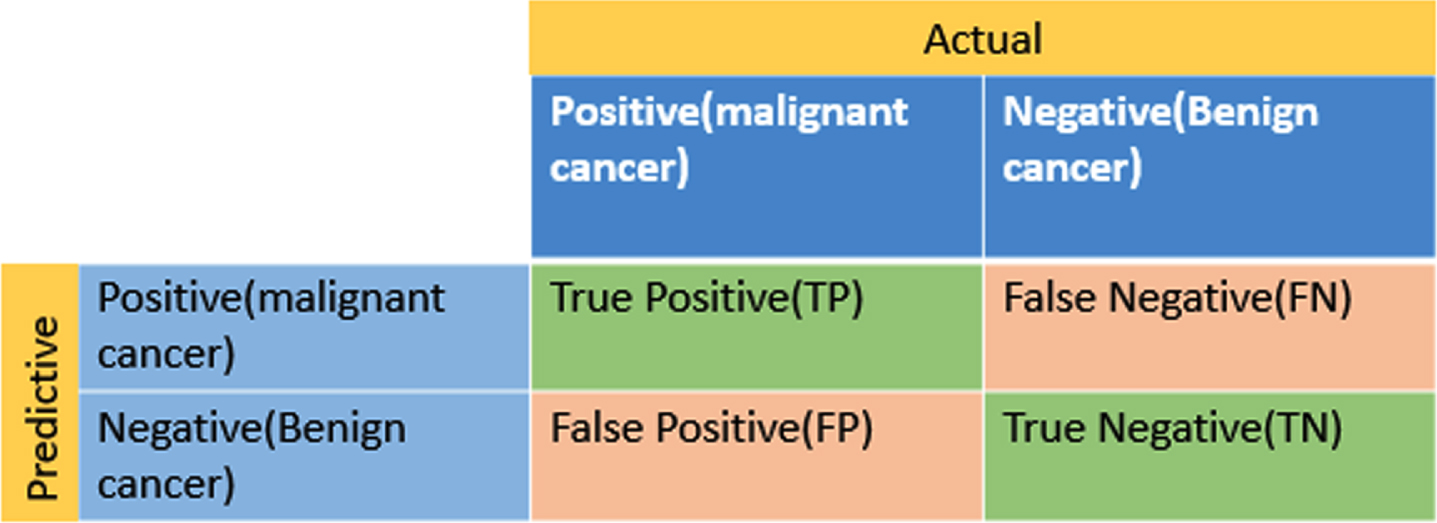
Displays the location of the TP, FP, TN, and FN criteria in the confusion matrix.
In this research, malignancy has been chosen as the first group and tagged as positive. Benignancy has been selected as the second group and labeled as negative. Thus, if TP is close to 100%, malignant tumors have been correctly diagnosed and if FP is big, the group wrongly diagnosed as malignant has a larger percentage. In order to simultaneously show all criteria, a confusion matrix has been drawn. This matrix is usually used for supervised algorithms. The criteria derived from the confusion matrix are calculated as follows:
Accuracy indicates the correct diagnosis for the whole set, which is calculated by formula 1.
Another criterion used for the measurement is the receiver operating characteristic curve (ROC) where the vertical axis is the true rate of change for the first group (true positive) and the horizontal axis is the false rate of change in the first group (false positive) [54].
One more criterion utilized for performance assessment in machine learning methods is the area under the curve (AUC). AUC value obtains ROC, showing a number between 0 and 1. The closer this number is to 1, the truer diagnoses are.
In this section, the results obtained from the proposed method have been given. The number of images has been increased to 186 and in the first stage, the region of interest (prostate gland) has been separated from the rest of the pelvic MRI. Then, image classification into two benign and malignant types has been done using CNN with different architectures. The total data was divided into 80 to 20, meaning that 80% of the images were for training and 20% for experiments, validation data is used to adjust the model parameters. And since the validation data should not be the same as the training data therefore the validation data should not be used in the training phase, so 20% of the training images are used for validation. These architectures have been ResNet18, ResNet50, ResNet101, and MobileNetV2, the performances of which have been compared in regard to two malignant and benign types. The computer execution of the recommended method has been conducted in MATLAB with GPU.
In the feature extraction part, the stochastic descent gradient algorithm (SGDM) with torque introduced in caffe is used. This algorithm selects the optimal point by the two selected parameters of the initial rate and the amount of torque in a post-error propagation process. It is very important and vital to choose the correct point of Away, and the smaller this number is, the smaller number of repetitions we will have to converge. Therefore, in this research, the initial rate equal to 0.01 was chosen. Then by reducing the initial rate, after 40 repetitions and an impulse equal to 0.65 momentum, convergence was reached.
It is clear that the best classification performance in the ROC diagram is achieved when the classifier shows a point (0, 1), and this is exactly the case when the classifier has the lowest error rate and the highest evaluation or sensitivity rate.
In the categories; Class 1 indicates malignant cancer and class 2 indicates benign cancer.
In Fig. 8 shows the ROC diagram for the proposed method by ResNet18 and mobilenetv2.
As it is clear in Fig. 8, the classification in ResNet18 architecture was better than MobileNet architecture. The better performance difference can be shown by obtaining the area under the curve.

Roc Diagram Proposed method, Image (a) shows proposed method by ResNet18, (b) shows proposed method by mobilenetv2.
In Fig. 9 shows the ROC diagram for the proposed method by ResNet50 and ResNet101.

Roc Diagram Proposed method, Image (a) shows proposed method by ResNet50, (b) shows proposed method by ResNet101.
Clearly, as depicted in Fig. 9, the classification performance in ResNet50 architecture was better than ResNet101 architecture.
The diagrams generated in ROC accurately show that the performance stability is higher in the ResNet50 architecture, which corresponds to the results obtained for the AUC criterion.
Table 1, AUC criteria compare the four selected architectures.
Results for AUC criteria with four selected methods: ResNet18, ResNet50, ResNet101 and MobileNetV2
Another important criterion is the overall accuracy of the proposed algorithm. In the accuracy criterion, all correct diagnoses, whether malignant or benign, are included.
In Table 2, the Accuracy criterion for four architectures) ResNet18, ResNet50, ResNet101 and MobileNetV2 (has been calculated.
Results for Accuracy criteria with four selected methods: ResNet18, ResNet50, ResNet101 and MobileNetV2
The overall accuracy and the surface area under the graph are important criteria, but they express the general state of the algorithm, what is important is the accuracy of classification in each of the categories.
Therefore, sensitivity and specificity criteria are much more important.
In Table 3, Specificity and sensitivity criteria were calculated for the four selected architectures) ResNet18, ResNet50, ResNet101 and MobileNetV2.
Results for specificity and sensitivity criteria with two selected methods) ResNet18, ResNet50, ResNet101 and MobileNetV2
For example, Accuracy and AUC for the ResNet family have almost the same answer, but in the details, i.e., sensitivity, which is related to the malignant group, ResNet18 does not have a suitable answer, and the best answer is related to the architecture of ResNet50. For the criterion of exclusivity, which is related to the benign class, the MobileNet architecture has a better answer.
The execution time of this method using ResNet18, ResNet50, ResNet101, and MobileNetV2 architectures has been shown in Table 4.
The duration of the proposed program with the selected architectures
Sometimes processing and response time is a priority in a computer system. For this reason, the training time in this algorithm has been compared with different architectures. As seen in Table 4, the execution time in ResNet18 has given the best response. MobileNetv2 has also, however, an acceptable response.
The duration of training and testing is another characteristic that can be considered, but the importance of accuracy in diagnosing the type of disease and lesion in medical images is more important.
The results clearly indicate that response accuracy is the same in three ResNet architectures and a little lower in MobileNetv2 architecture. Hence, if a general accuracy is desired, each of these architectures can be a correct choice. But given the lower response time in ResNet18, this architecture is the better choice. And if specificity is regarded as the selection criterion, MobileNetv2 architecture will provide a much better response than other ones. And should sensitivity be seen as the criterion, ResNet50 will be an appropriate option. And the comparison of the AUC results obtained from the proposed method with the ResNet50 architecture with the methods that worked in this field in recent years is shown in Table 5. These comparisons show that the accuracy obtained by the proposed method for medical applications and initial studies can be acceptable.
Comparison of the obtained result AUC with the proposed method with the result obtained in recent years
The present study was conducted with the aim of dividing and classifying prostate cancer into two types, benign and malignant, based on pelvic MRI images. It was shown that by classifying images based on deep learning networks, a suitable answer can be reached to achieve this goal. Appropriate parameters should be selected for the hyperparameter optimization algorithm and the training process can also be increased by increasing the number of images using noise removal filters according to the noise in MRI images and the use of very effective morphological features in the images such as very important data. Improve image processing. The results show that the relative accuracy and acceptable performance speed of the ResNet50 architecture compared to the three ResNet-18, MobileNet and ResNet101 architectures can reflect the proper performance of this processing design. In general, the use of ResNet50 is recommended due to its better overall performance in detecting the malignant type of prostate cancer.
Availability of data and materials
The datasets used and/or analyzed during the current study are available from the corresponding author on reasonable request.
Declaration of competing interest
The authors declare that they have no known competing financial interests or personal relationships that could have appeared to influence the work reported in this paper.
Footnotes
Acknowledgments
The work described in this paper was supported by the Shahid Chamran University of Ahvaz, as a PhD Thesis. The authors would like to thank the Shahid Chamran University of Ahvaz for financial support.
CRediT authorship contribution statement
The N.Pirzad-Mashak conceived the study, participated in its design and coordination, and helped produce the manuscript. The G. Akbarizadeh and E. Farshidi participated in the design and coordination and helped draft the version. All authors of the final version have read and approved the manuscript and agree with it.
Consent for publication
All the authors have consented to the publication of this manuscript.
Competitive advantages
The authors participating in the study stated that they do so, do not have any conflict of interest with this version.