
Abstract
The usage of cloud-based grid computing services and Internet of Things (IoT) devices in medical diagnoses is increasing enormously. The cloud service provider’s data centers store vast amounts of data without processing it. This big data need some intelligent technique to analyze and classify heart disease from the considerable volume of data; it is a challenging task. Many deep learning techniques are introduced earlier for heart disease diagnosis in the literature study. Still, all other classification techniques failed to achieve the minimum loss in heart disease classification with the highest accuracy and faster performance. This research introduces a new classification approach to overcome these issues: elephant herding optimizer turned restricted Boltzmann machine EHO-RBM network. The optimizer is used in this network to optimize the number of neuron utilization during the learning process by updating the network weight without compromising the loss. The previous research proves that the optimizer is performed well in reaching global minima efficiently. Therefore, the new classifier incorporates the optimizers instead of the classical stochastic gradient descent optimizer to improve the network performance by minimizing the global minima faster with less loss in predicting heart disease. The simulation result of the new heart disease classification framework shows that the elephant herding optimizer-trained classification model has reduced the loss rate and maximized the accuracy rate up to 0.0027 then the comparison method. As a result, the new classifier has obtained a maximum accuracy of up to 99.96% .
Keywords
Introduction
The cloud and based grid computing technologies [1] based IoT sensor devices help more precisely diagnose disease in healthcare services. Various healthcare IoT sensor devices [2] are available for tracking chronicle disease patients and medical equipment such as nebulizers, insulin level monitoring, locating the patient’s wheelchair, and oxygen pump monitoring. This research uses IoT devices to predict a patient’s heart disease risk level. Various factors must be analyzed and tested to predict heart disease, such as blood pressure, ECG level, heart rate, motion sensor, etc. A few heart disease diagnosis IoT sensor specifications are as follows, the pulse sensor [3] contains amplification and noise cancellation circuits. The cables with male header connectors have perfect-sized ear clips for the sensor. In the backside of the sensor, hot glue is fixed. The ultrasonic motion sensor [4] provides an accurate and non-contact 2 cm to 400 cm detection range; it can be able to pass eight 40 khz square wave pulses, produces high precision up to 0.30, and uses the <2mA static current, 5VDC voltage power. The blood pressure monitoring [5] sensor can make able to measure the pressure range from 0mmHg to 258 mmHg and 1550 mmHg maximum pressure without permanent damage with ±1 mmHg accuracy; it also counts the temperature range between -20°C to 85°C and the average response times is 1 ms(millisecond). The ECG monitor [6] sensor AD8232 uses 16bit RISC 32 MHz; the internal memory contains 10kb for data RAM and 48kb for program flash, and the external memory has 1MB. It uses a 250kb data rate 3.3V battery power, and the ADC uses a 12-bit resolution with eight channels and the size is 73*29 mm, and has produced analog signals. The sensors can be able to connect with raspberry Pi.
Figure 1 illustrates the general structure of the IoT sensors-based data collection, processing, and database services. Initially, the patient needs to visit the diagnosis center for disease diagnosis. The Diagnosis center data collection unit technicians fix the various IoT sensors [7] on the patient’s body. These sensors collect appropriate signal information, managed by the sensor access point device; it transmits and receives sensor signals and stores them in the local data analysis unit, also known as the grid node. The grid node performs various data analytics processes with the sensor’s data and predicts the patient’s heart disease risk level, such as feature extraction, normalization, reduction, and classification. The sensors collected and the prediction results are transmitted to the cloud data center through the internet with the help of the gateway. The centralized data center maintains all the information, and the diagnosis center host system can access the diagnosis result through the website or application. As a result, IoT-based healthcare sensors can diagnose more precisely and produce outputs faster than early days analyze devices. Most existing heart disease prediction approaches use classical model sensor data; it makes heart disease data with more noise. Due to the less data transmission distance for grid computing, the IoT sensor data can directly produce signal data without noise. The combined features of the grid technology and heart disease diagnosing IoT sensors [8] help improve data capturing and analyzing accuracy.
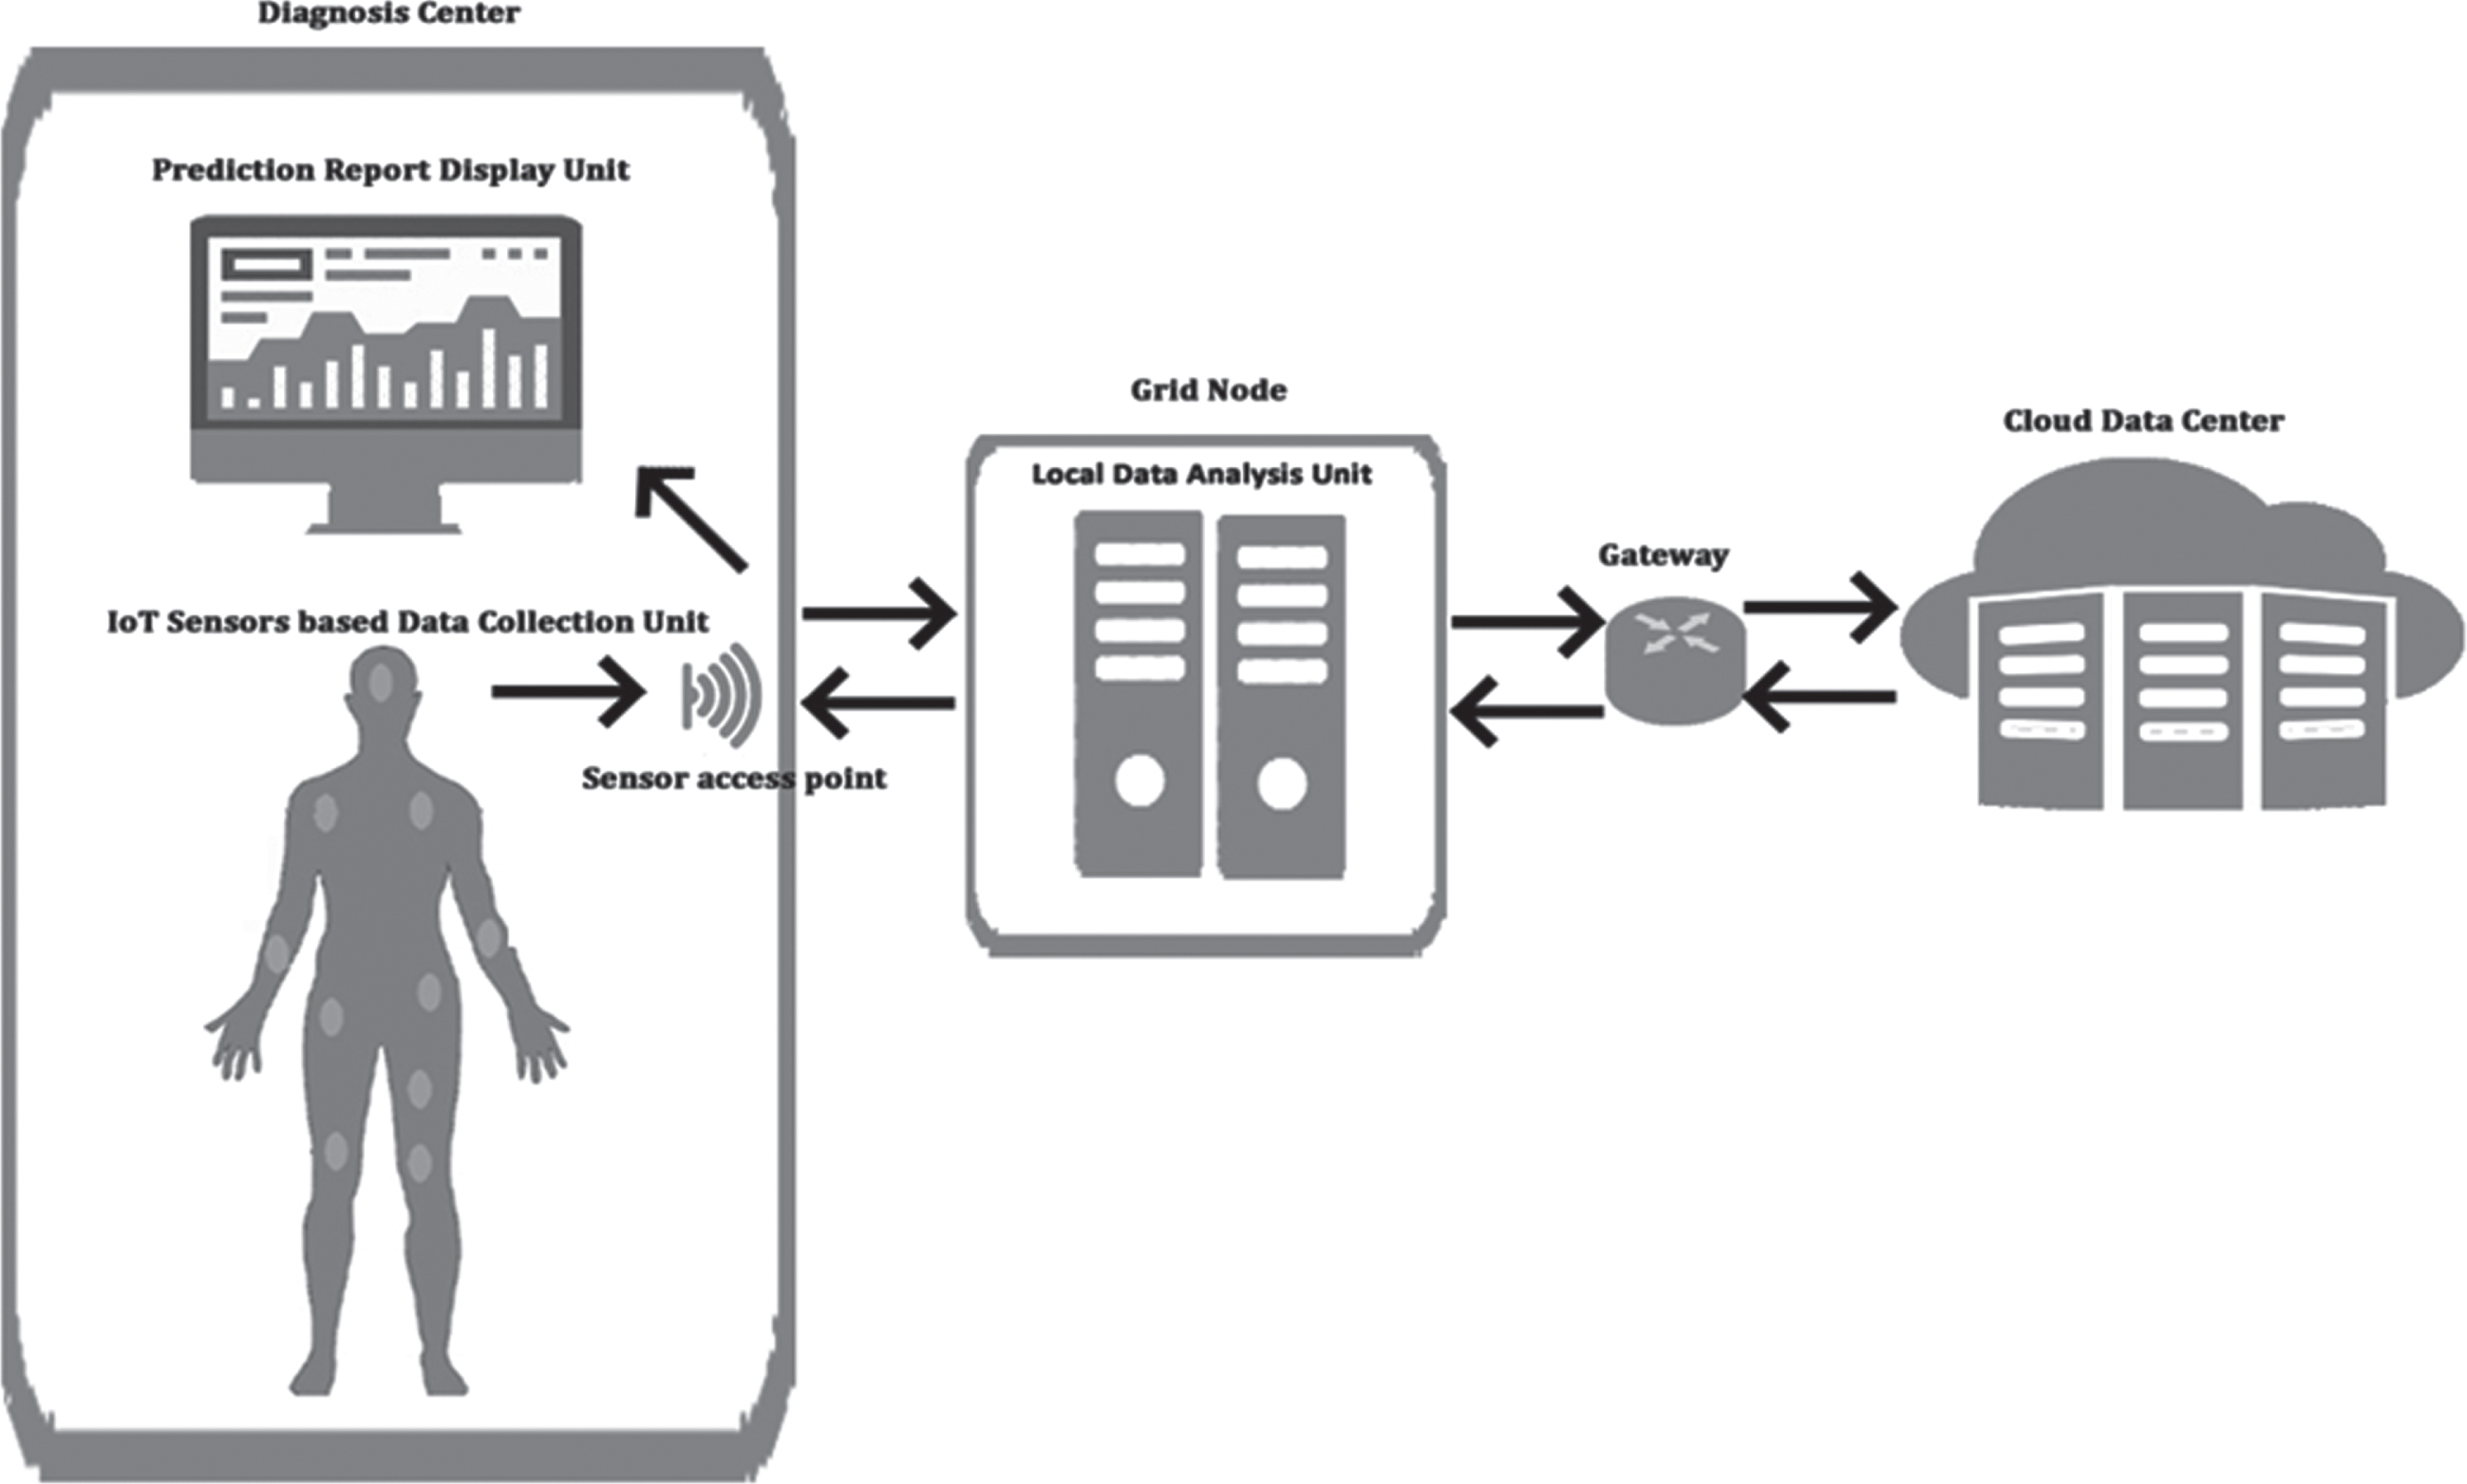
General structure of IoT based Data Collection and Cloud and Grid services based data analysis.
The research aims to utilize features of advanced technologies and introduces a new classification algorithm to reduce the classification loss rate than existing heart disease classification approaches. The new EHO-RBM utilizes elephant herding optimizer’s elephant separating behavior and restricted Boltzmann machine network node restriction behaviors to predict heart disease efficiently. The IoT heart disease data analyzing framework performs wavelet thresholding-based feature extraction, min-max normalization, feature ranking-based feature selection, and EHO-RBM network for classification to predict heart disease levels and store reports in a cloud data center. The detailed descriptions of the new framework are explained clearly in subsequent sections.
This part discusses the various researchers’ research on heart disease classification and the bio-inspired optimizers trained classification approaches. [9] investigated a classification approach for early heart disease prediction by combining multiple algorithms. The ensemble classifier approach helps to increase the performance (85.48 %) of the week classifier. However, multi-classifier concepts slow down the prediction process. Because it takes more time to compute the multiple classifiers, trains weak classifiers, and fails to achieve reasonable accuracy. In [10] constructed, a hybrid intelligent framework has been built by combining the features of random forest and linear method and also compared the performance with five existing machine learning algorithms; the experimental results show that the newly constructed hybrid classification approach has obtained superior performance in obtaining maximum accuracy (88.7%) than other comparison algorithms. But this classifier combines the traditional machine learning algorithms features, which perform poorly in some cases due to the underfitting issue, in [11] introduced a genetic algorithm trained recurrent fuzzy neural networks to classify heart disease. This classification approach gives quite a good accuracy rate (97.78%) in predicting heart disease, but small changes in the parameter values take much time to reach the predefine positive class labels. [12] performed a comparative analysis of artificial neural networks with the support vector machine. The evaluation results show that the SVM performs a better precision rate (92.32%) than the traditional multi-layer perceptron network in ANN. But the neural network uses a standard stochastic gradient descent-based optimizer to update the network weight during the backpropagation; it takes a long time to achieve the correct labeled classes. In [13] modified the default parameter values of random forest classifiers based on arbitrary values adjustment, tree count, minimal spilled count, and minimal count of the leaf node. The comparative analysis is made with the five different machine learning approaches; the evaluation results show that the modified random forest approach has produced superior performance in obtaining higher accuracy (85.81%) than the seven existing machine learning-based classification approaches but the traditional machine learning approaches, failed good accuracy in predicting heart disease.
In [14] investigated the six different machine learning algorithm’s efficiency in predicting the heart diseases such as multi-objective evolutionary fuzzy classifier, Logistic regression, Genetic fuzzy system GFS-logit boost, Fuzzy unordered rule induction, fuzzy hybrid Genetic based machine learning and adaptive boosting the evaluation results show that the GFS-logit boost is obtained superior accuracy (94.99 %) in but doesn’t achieve good accuracy. In [15] introduced a novel approach, which classifies the high dimensional heart disease data. The clustering-based dimensionality optimization has been introduced to improve the ensemble classifiers’ pulse monitoring precision rate (0.932). However, due to the high load of the multiple classifiers, it takes more time to compute the results. This research only concentrates on plus changes based on heart disease identification method, not other factors like ECG, BP, etc. In [16] evaluated the performance of four existing classification approaches for classifying heart disease, such as random forest, K-NN, SVM, and ANN. The result shows that the artificial neural network model has obtained more accuracy (92.21%) than others. In [17] introduced a new approach, which is an elephant herding optimizer (EHO), based on parameters turning in support vector machine. The performance of the optimizer is evaluated with various datasets. The results show that the classification optimizer-based turning approach gives maximum promising accuracy (99.78 for vowel dataset) than other optimizers such as genetic optimizer and grid search. In [18] introduced a new deep learning framework, which has been combined, restricted the Boltzmann machine (RBM) network and faster convolution neural network properties to classify images. This classification approach obtained the acceptable convergence of nearly 240 batches, the fastest convergence rate. The network model has utilized the default stochastic optimizer to update the network’s parameters weight, and the algorithm efficiency was only tested with the image dataset.
The related study has investigated the various heart disease diagnosis and classification approaches. It shows that traditional machine learning techniques can handle only low-dimensional data to predict heart disease with a maximum loss rate. Also, the algorithms failed to achieve the disease classification with a good accuracy rate and faster performance in prediction. Very few classification approaches are used in deep learning approaches for heart disease prediction. Those network models are utilized traditional optimizers for parameter turning in the classifier. The traditional optimizers like genetic algorithms, stochastic gradient decant, and grid search-based parameter turning take. While handling the high dimensional data, these optimizers suffer from fitting issues during the backpropagation, which increases the network’s prediction loss rate. A new deep learning framework has been introduced to resolve these issues in machine learning and deep learning techniques. In the new deep learning, the framework is combined with the features of EHO and RBM. According to the related study, the elephant separation behavior of elephant herding optimizers helps to reach global minima faster with minimal loss than other bio-inspired optimizers. In addition, the restricted visibility-based connection feature of the RBM networks helps achieve the target class more quickly. The elephant herding optimizer replaces the default optimizer’s functions for turning the Restricted Boltzmann machine network, which has optimized the number of hidden neuron utilization during the learning process by updating the network weight without compromising the loss. The new classification approach can able to handle high-dimensional data. In each analyzing step, the subsequent section discusses how the new EHO-RBM network works in the heart disease classification process.
IoT-based Heart Disease Prediction framework
Figure 2 illustrates the new framework to classify heart disease risk levels. These various heart disease diagnosis sensors collect appropriate signal information and are transmitted to the local Grid-based data analysis unit. The grid node performs different data analytics processes to classify heart disease risk levels, such as Wavelet threshold-based feature extraction, Feature ranking-based feature selection, and EHORBMN-based classification to generate reports. This research considers three types of heart disease risk levels, which is 0 (Low), 1 (Average), and 2 (High risk), based on the classification prediction. The report has been generated for further treatment. The flows of the above steps have been explained in subsequent sections.

Data Analysis Framework.
This new framework aims to analyze the IoT heart disease diagnosis sensor signal data. As discussed in the introduction, these IoT sensors predict patients’ heart disease-related diagnosis information and transfer it to analyze the Grid node’s host system. The server system keeps on stores the sensor’s information; the new heart disease classification framework analysis these sensors information by using various analyses steps and generates disease risk level reports; the classification framework is pre-trained with sample heart disease datasets, which have been collected from publicly available heart disease datasets [19] and [20]. The Cleveland and Switzerland heart disease datasets, have been used to train (taking 75 % of data) and test (taking 25% of data) the new disease classification framework. The datasets contain a multi-variant attribute values dataset. The datasets also have missing values; two methods are utilized to handle the missing values. Firstly, the tuple with the highest null values is considered irrelevant, and those tuples are removed. Next, the tuple with less null value is replaced by the average values of the appropriate previous and next columns. Each dataset initially contains 76 attributes, but only 14 significant features, which many researchers widely accept, were taken for the analysis.
Table 1 shows a few of the sample heart disease dataset values and the formats. The subsequent sections discuss the new classification framework and its methods.
Sample Heart Disease Dataset
Sample Heart Disease Dataset
The IoT sensors contain noise removal options by default; therefore, no noise removal techniques are needed for these signal data. For Feature extraction, heart disease diagnosis-related IoT sensors such as ECG sensor, Blood pressure, ECG level, heart rate, and motion sensor captures and transmits the disease information as signals. The signals contain heart disease information of that patient; from these signal data, the wavelet thresholding approach is used to transform the signals into numerical for analysis, and statistical features are applied to extract the feature information. Hence, the noise-free signals are taken for feature extraction directly. The wavelet Thresholding makes use of high and low pass threshold based transformation for extracting features which has the median value to determine the signal strength. The coefficient values determines the noise level of signal. This research uses low-pass and high-pass threshold-based transformation methods to extract the features. The derivative of the combined hard and soft Threshold [21] approach is described as follows,
Where, in Equation (2), Equation (3), Equation (4), ns denotes the number of time-based signal observation samples, f represents the first feature value, and s denotes the second feature value. The notation ‘ns’ indicates the total number of time-based signal observation samples, τ denotes the mean of the sample values and f l denotes the value from the sample. The wave length-based transformed features of the ECG sensor, Blood pressure, ECG level, heart rate, and motion sensor are extracted using the above-discussed statistical features. Next to this feature extraction process is dimensionality reduction, described clearly in a subsequent section. The feature extraction makes use of the sample data mean, standard deviation and correlation coefficient values. The feature vector normalization range varies between 0 to 1. The minimum values and maximum values is normalized with the input feature.
The extracted high-dimension features are normalized and reduced to improve the classification performance. Information gain and chi-square methods-based score vectors [22] are normalized using the min-max normalization techniques, denoted in Equation (5).
Where nv is denoted as the new normalized value, av represents the actual value of the feature igs a andchis a Vector. min _ fv and max _ fv minimum and maximum value of the feature vector and n mx rng and n mn rng denotes the maximum and minimum normalization range. The Equation (5) is normalized to the input feature values between the range from 0 to 1. The minimum values and the maximum values are represented as n mx rng , n mn rng in the normalized vectors. The magnitude value comparison with the feature value is considered as the highest ranked feature and the selected features are given as the input to the other features.
The representation of the score vector is denoted as
The magnitude values are compared with the feature values. If the feature value is higher than the appropriate magnitude |sv a | value, then it is considered the highest-ranked feature. Finally, the selected significant features are taken as the input to the elephant herding optimizer turned restricted Boltzmann machine EHO-RBM network model. The description of the new classifier is explained in a subsequent section.
As discussed earlier in the previous section, the results value of the feature selection and the appropriate heart disease patient record are input to the new EHORBMN classifier. This section discusses the characteristics of RBM networks and the EHO method and how the new classification approach works to achieve a minimum error rate during heart disease prediction. The restricted Boltzmann machine is a category of and stochastic recurrent neural network. It is one of the first deep-learning models capable of learning internal representations. Initially, the model does not provide intra-layer connections among hidden and visible nodes. Unlike other models, the model establishes relationships among the hidden units to the visible unit node. Therefore, there are no dependencies among the same type of units’ node, like hidden to hidden and visible to visible. This feature helps to improve the model’s efficient performance. After training the first neuron by input value, the activities of the hidden unit nodes can be treated as data for training the higher-level layers. The stacking behavior of this model helps to train the hidden unit efficiently. Initially, the model is designed to handle only binary input values, but the extended version also supports absolute values. EHO approach and the Restricted Boltzmann Machine Network minimize the error rate with heart disease prediction and classification. The input unit and the hidden nodes can be used as data for training. As a result, the EHORBMN classifier achieves the highest classification accuracy for heart disease prediction.
Figure 3 illustrates the model weight updating process during the sample training. During training, the extracted features of heart disease dataset tuples are initially utilized as input to train the model. The extracted features from the IoT sensors are used during the testing phase. The EHO-RBM network establishes the connections after the first set of training; the activities of the hidden unit nodes can be treated as data for training the higher-level layers. The activation probability is calculated for each visible node and hidden node. If the probability value of the visible node (e.g., p = 0.9990) comes under the Threshold, then its activation function activates the state and is considered the worst node (e.g., p = 0.0220). So it updates the parameters weight using the elephant separation behavior of elephant herding optimizers (e.g., w = 2.87) by back-propagating; this process continues till it achieves the correct class label value (global best). The process continues for all the samples until it reaches stopping criteria epochs.

Internal Structure of the new EHO-RBM network during weight updating for sample training.
The hidden unit contains hidden nodes of heart disease features, which are denoted as h1, h2, …, h
s
visible variables v contains the visible variable (various heart disease features), which is denoted as v1, v2, …, v
r
. Unlike other deep neural network models, this RBM establishes connectivity between visible and hidden unit nodes. The model parameter needs to learn from the given set of heart disease training samples total dimension DS ={ v1, v2, …, v
r
}. The visible variables vɛ { 0, ⩾ 1 }
DS
are connected to hidden variables hɛ { 0, ⩾ 1 }
F
. The value≥1 denotes the active state, and 0 indicates the ignore state. The energy function EN of the joint is represented as,
In Equation (7) the model parameters represented as ∅ ={ W, a, b }, where W indicates the weight between the visible node ′and hidden node . A and b denote the visible and hidden nodes’ bias values. And the r and s represent the positions of nodes, such as the dimension of visible variables and remote nodes. The Activation probability is denoted as,
Where rectified linear unit (relu) activation function is initialized as default, represented as ρ. The model training is equal to the depreciation of E (v, h| ∅). The probability (P∅) of the joint distribution is represented as,
Where
Where factories are denoted as
The stochastic gradient descent is a default iterative optimizer in the RBM network. However, due to frequent updates, the steps taken towards the minima are very noisy. This can often lead the optimizer in some other direction, so reaching the global optima of the loss function takes more time. In this research, the default functions of the stochastic gradient descent optimizers’ weight updating process are replaced with the elephant herding optimizer to overcome these issues. It is utilized to reduce the depth of the hidden layers by updating its weights. It can help reduce the loss function value in predicting heart disease and the computation time.
The elephant-separating behavior minimizes the hidden node depth and updates the network weights during the backpropagation. To reduce the depth of hidden nodes in the RBM network, the derivation of elephant separating operator is utilized, which has been denoted as follows,
Whereas the random number generator rand in Equation (11) is used to generate the random numbers between randɛ [0, 1]. The DS min andDS max denotes the lower and upper bands of the search space. In each clan clnr, a constant number of elephants with the worst fitness value in the search space are moved to the new position. In this RBM network, the input feature vector is considered the elephant population in EHO, and the Clan is regarded as a hidden node. The position updating behavior of the EHO is considered for the weight updating during the backpropagation.
Initially, the RBM network was designed to handle only binary class values. Still, now it is extended to handle multi-class values due to the availability of the various multi-class values supporting activation functions. In this research, the rectified linear unit (relu) activation function (ρ) has been utilized to handle the sate activation function during the model training. This function can be able to take multi-class values.
Where the ‘d’ is the predicted probability value of the class label (heart disease risk level label), the activation will check whether the expected probability is ⩾1. If yes, it considers that value; otherwise, it is 0. This new classification network model’s stacking behavior is explained in the algorithm below.
The EHO-RBM algorithm describes the step-by-step workflow of the new EHO-RBM model training approach. Initially, data are collected by IoT sensor devices from the patient’s body. The IoT sensor’s signal data is retrieved and saved in a local grid server for analysis. The signal information is extracted by using the wavelet thresholding approach. The wavelet Thresholding approach retrieves the features of the data collected and combines them with the vector. Min-max normalization techniques obtain the vector analysis. The class prediction is obtained from visible node weight, hidden node weight, and bias weight. Compute the information gain score and chi-square for the extracted features score and create a combined vector. Rescale the vector values using the min-max normalization techniques and compute the score vector. Calculate the magnitude for each vector value, check for the Threshold for ranking, and reduce the feature. The top 17 features are selected for the classification approach. The number of heart disease records has been taken to train (population), iteration count, and hidden layers count to feed to the classification model. Compute energy functions by calculating the probability of the parameters such as visible node weight, hidden node weight, and bias weight. If the possibility is less than or equal to 0, then the activation function opens, which has been considered as a negative label of the predicted class; otherwise, it is regarded as a positive label; for example, one denotes that the patient record has an average risk to identify the heart disease and two denotes that the patient record has high-risk symptoms to get heart disease. If the probability of the visible node is equal to the average or medium of the risk level of the class, then the hidden node considers it a visible node and establishes connections to train the given input; otherwise ignores that variable node and updates the weights during backpropagation using elephant herding optimizer. The process has been continued until the specified iteration count ends. Finally, calculate the log-likelihood loss function and its derivatives. The main objective of the new classification approach is to minimize the loss value and improve the accuracy in classifying heart disease effectively. The subsequent section describes the new classification approach’s performance evolution using the two heart disease datasets mentioned above. The evaluation results of the new classifier in predicting heart disease have been discussed in the subsequent section.
This section discusses the performance evaluation results and efficiency of the EHO-RBM with Cleveland and Switzerland heart disease datasets. Furthermore, the efficiency of the new classification algorithms is compared with GA-RFNN, which was discussed earlier in the related study, and the competence is evaluated with the various loss functions and accuracy matrices. Cleveland, Hungary, Switzerland, and Long Beach V are the four datasets that make up the 1988 data collection. There are 76 qualities total, including the anticipated attribute, however only 14 have been used in any of the published trials. The patient’s cardiac condition is the “target” in this context. sickness is represented by a zero and the absence of sickness by a one.
Loss functions
The role of the loss function [23] in any classification algorithm in the model, the train is to calculate the best-converged optima of the optimizer. It makes the algorithm predict the target accurately with less loss. The Loss function is utilized to calculate heart disease risk level prediction loss for all the iterations of the classification models. The derivative of various loss functions has been used in this research to test the efficiency of the new model.
The above derivations Equation (13), Equation (14), and Equation (15) are utilized to calculate the sum of log loss values across classes for each class prediction during the model training. Where ’
Figure 4 illustrates the convergence rate to reach the global minima for EHO-RBM and GA- RFNN, calculated by the log-likelihood loss function. The EHO-RBM obtained a minimum loss value of 0.0004 in the 152nd epoch and 0.0005 in the 156th epoch for Cleveland and Switzerland, respectively. The Cleveland heart disease dataset obtained less loss value in earlier iterations than the Switzerland heart disease dataset. The GA-RFNN has obtained a minimum loss value of 0.00031 in the 233rd epoch and 0.00033 in the 235th epoch for Cleveland and Switzerland, respectively. The log-likelihood loss curve clearly shows that the elephant and elephant separation behavior of elephant herding optimizers and the restricted visibility-based connection feature of the RBM networks model help to classify the heart disease level efficiently with minimum loss and faster convergence than GA- RFNN.
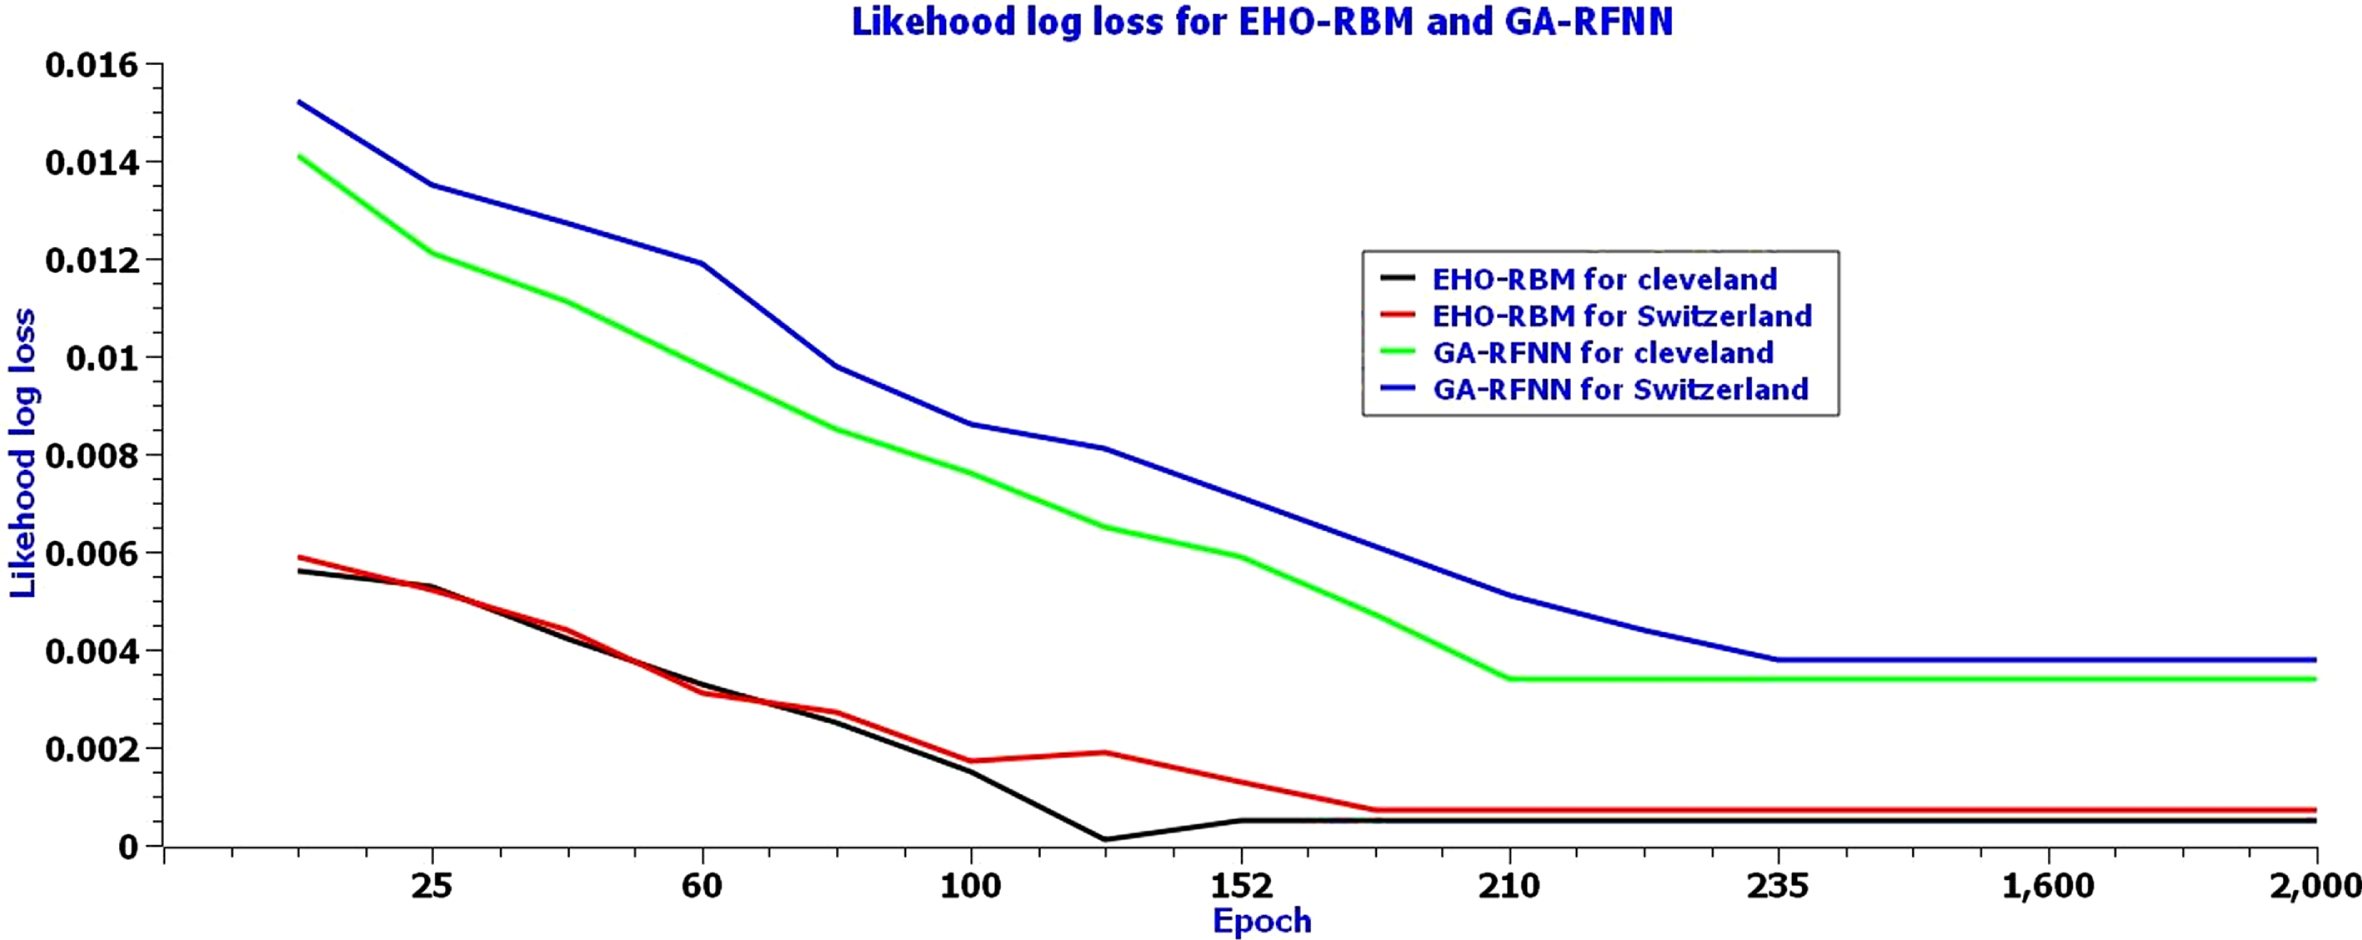
Log-likelihood loss of EHO-RBM network model for the Cleveland dataset.
Figure 5 illustrates the convergence rate to reach the global minima for EHO-RBM and GA- RFNN, calculated by the Multi-class log loss function. The EHO-RBM has obtained a minimum loss value of 0.0005 in the 152nd epoch and 0.0007 in the 156th epoch for Cleveland and Switzerland, respectively. The Cleveland heart disease dataset obtained less loss value in earlier iterations than the Switzerland heart disease dataset. On the other hand, the GA-RFNN has obtained a minimum loss value of 0.00034 in the 233rd epoch and 0.00038 in the 235th epoch for Cleveland and Switzerland, respectively. The log-likelihood loss curve clearly shows that the elephant and elephant separation behavior of elephant herding optimizers and the restricted visibility-based connection feature of the RBM networks model help to classify the heart disease level efficiently with minimum loss and faster convergence than GA- RFNN.
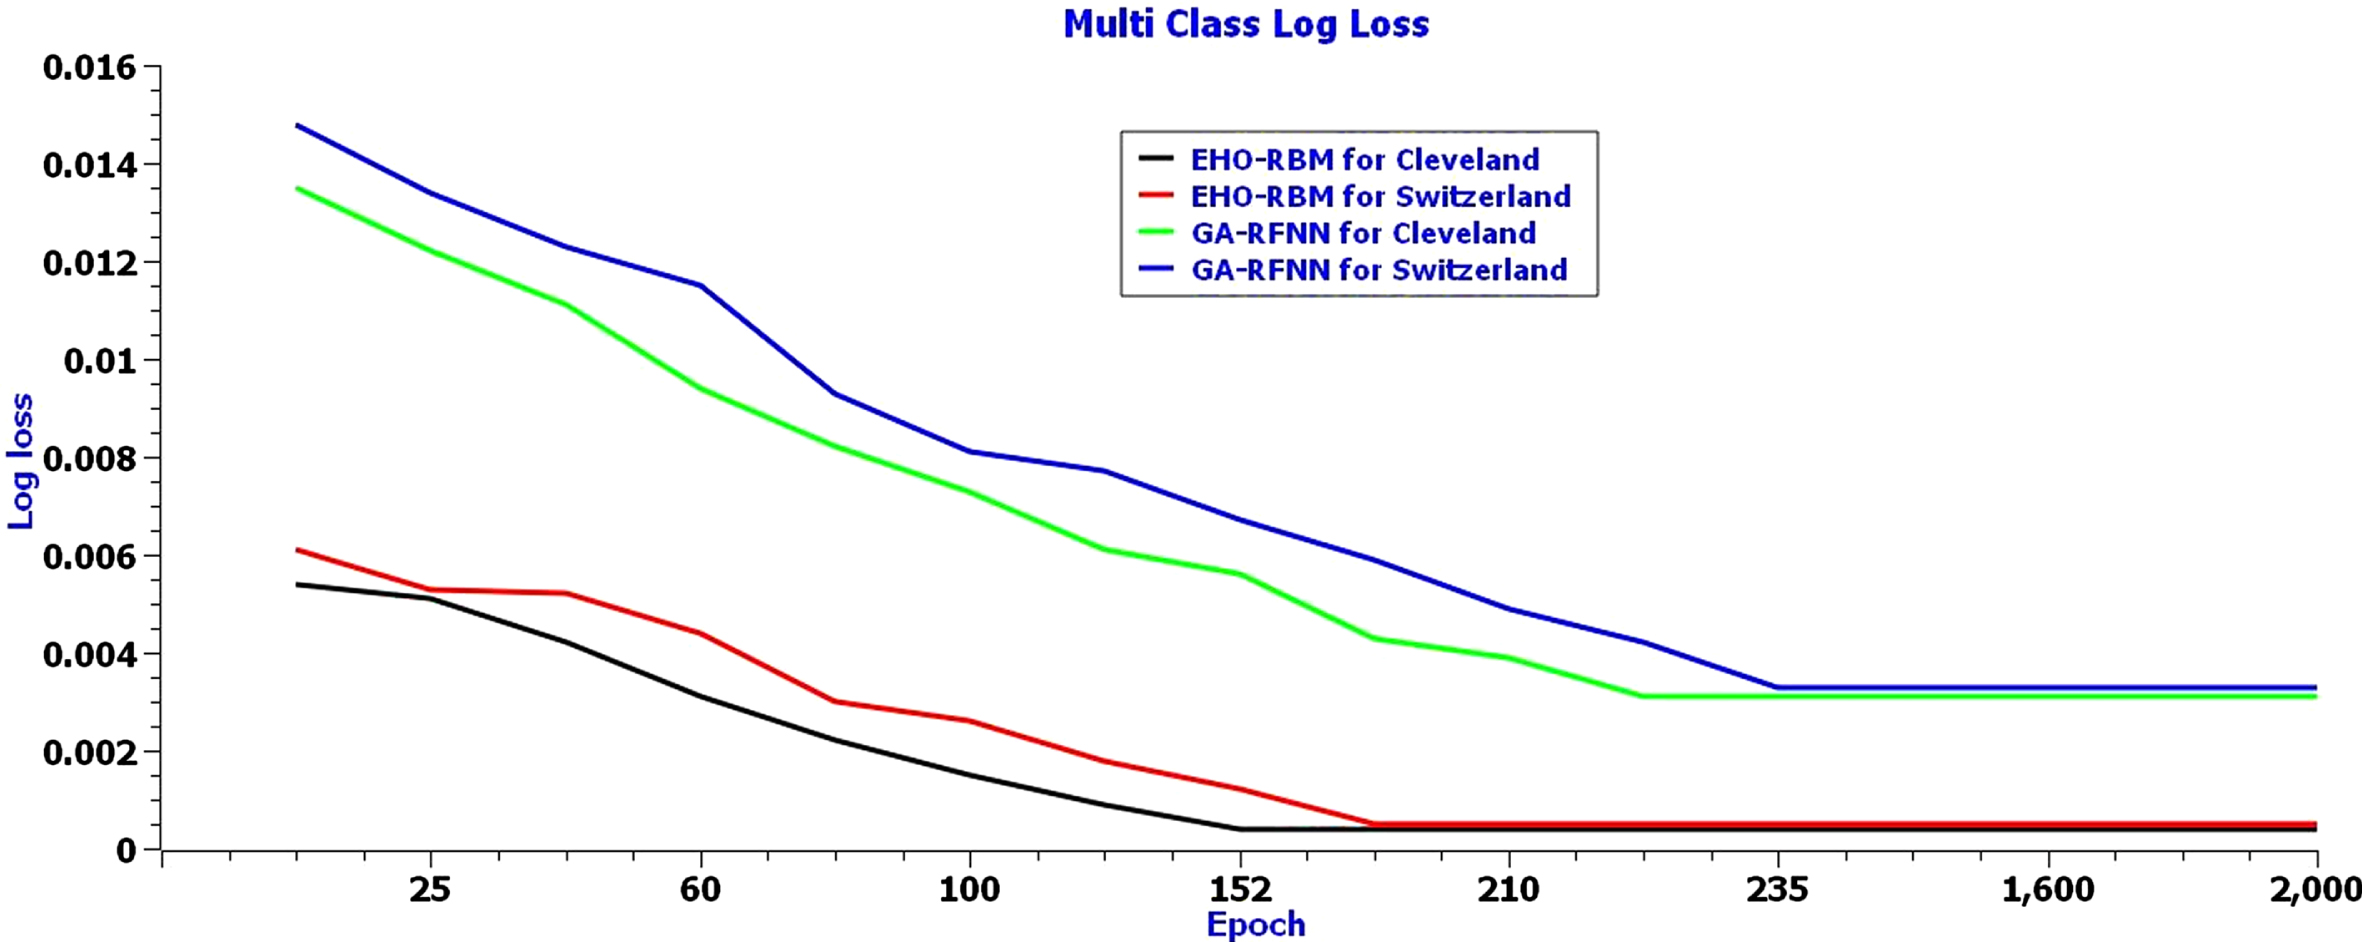
Multi-class log loss of EHO-RBM network model for Cleveland dataset.
Figure 6, mean square deviation error rate curves, illustrates the error rate obtained by the EHO-RBM network and GA-RFNN for Cleveland and Switzerland heart disease datasets. The Blue color curve shows the error rate curve of the new network model for Cleveland heart disease datasets. The minimum error rate (0.0005) has been obtained from 152 to 153rd epoch. The red color curve shows the error rate of the EHO-RBM network for Switzerland’s heart disease datasets. The new network model obtained a minimum error rate 0.0006 for the dataset from 156 to 157th epoch. The pink color curve shows the error rate of the GA-RFNN classifier for Switzerland’s heart disease datasets. The minimum error rate (0.0037) has been obtained in the 235 to 237th epoch. The Green color curve shows the error rate of the GA-RFNN classifier for Switzerland’s heart disease datasets. For the dataset, the GA-RFNN classifier has obtained a minimum error rate of 0.0039 from 236 to 237th epoch. The mean square deviation error rate curve clearly shows that an elephant separation behavior of elephant herding optimizers and the restricted visibility-based connection feature of the RBM networks model helps to classify the heart disease level efficiently with minimum loss and faster convergence than GA-RFNN for both heart disease datasets.

Mean square deviation rate curves for EHO-RBM network and GA-RFNN for Cleveland and Switzerland heart disease datasets.
The role of accuracy metrics [24] in the classifier is to calculate the efficiency of the classification algorithm in predicting the heart disease risk level. The accuracy evaluation metrics used in this research have been denoted as follows,
In the above derivations, the true positive, True Negative, False positive, and False Negative is represented as α, β, γ, δ, respectively.
Table 2 shows the successful round’s accuracy rate of the EHO-RBM and GA-RFNN for Cleveland and Switzerland. The EHO-RBM classifier has obtained the maximum accuracy of 0.9996 for the Cleveland heart disease dataset, and the Cleveland dataset has obtained a maximum of 0.9995 with acceptable loss. The GA-RFNN classifier has obtained the maximum accuracy of 0.9969 in the 210th iteration for the Cleveland heart disease dataset. For the Cleveland dataset, it has been obtained a maximum of 0.9967 with acceptable loss. The overall accuracy tables values show that the elephant separation behavior of elephant herding optimizers and the restricted visibility-based connection feature of the RBM networks model helps to achieve the promising accuracy rate of the EHO-RBM classifier in classifying heart disease.
Accuracy rate is obtained by the EHO-RBM and GA-RFNN for Cleveland and Switzerland
The above Fig. 7 shows the graphical representation of the accuracy rate for a few successful epochs. The curves show that the elephant separation behavior of elephant herding optimizers and the restricted visibility-based connection feature of the RBM networks model helps the EHO-RBM network secure maximum accuracy rate in most epochs for both datasets. Furthermore, the GA-RFNN classifier has obtained a lesser accuracy value for both datasets than EHO-RBM.
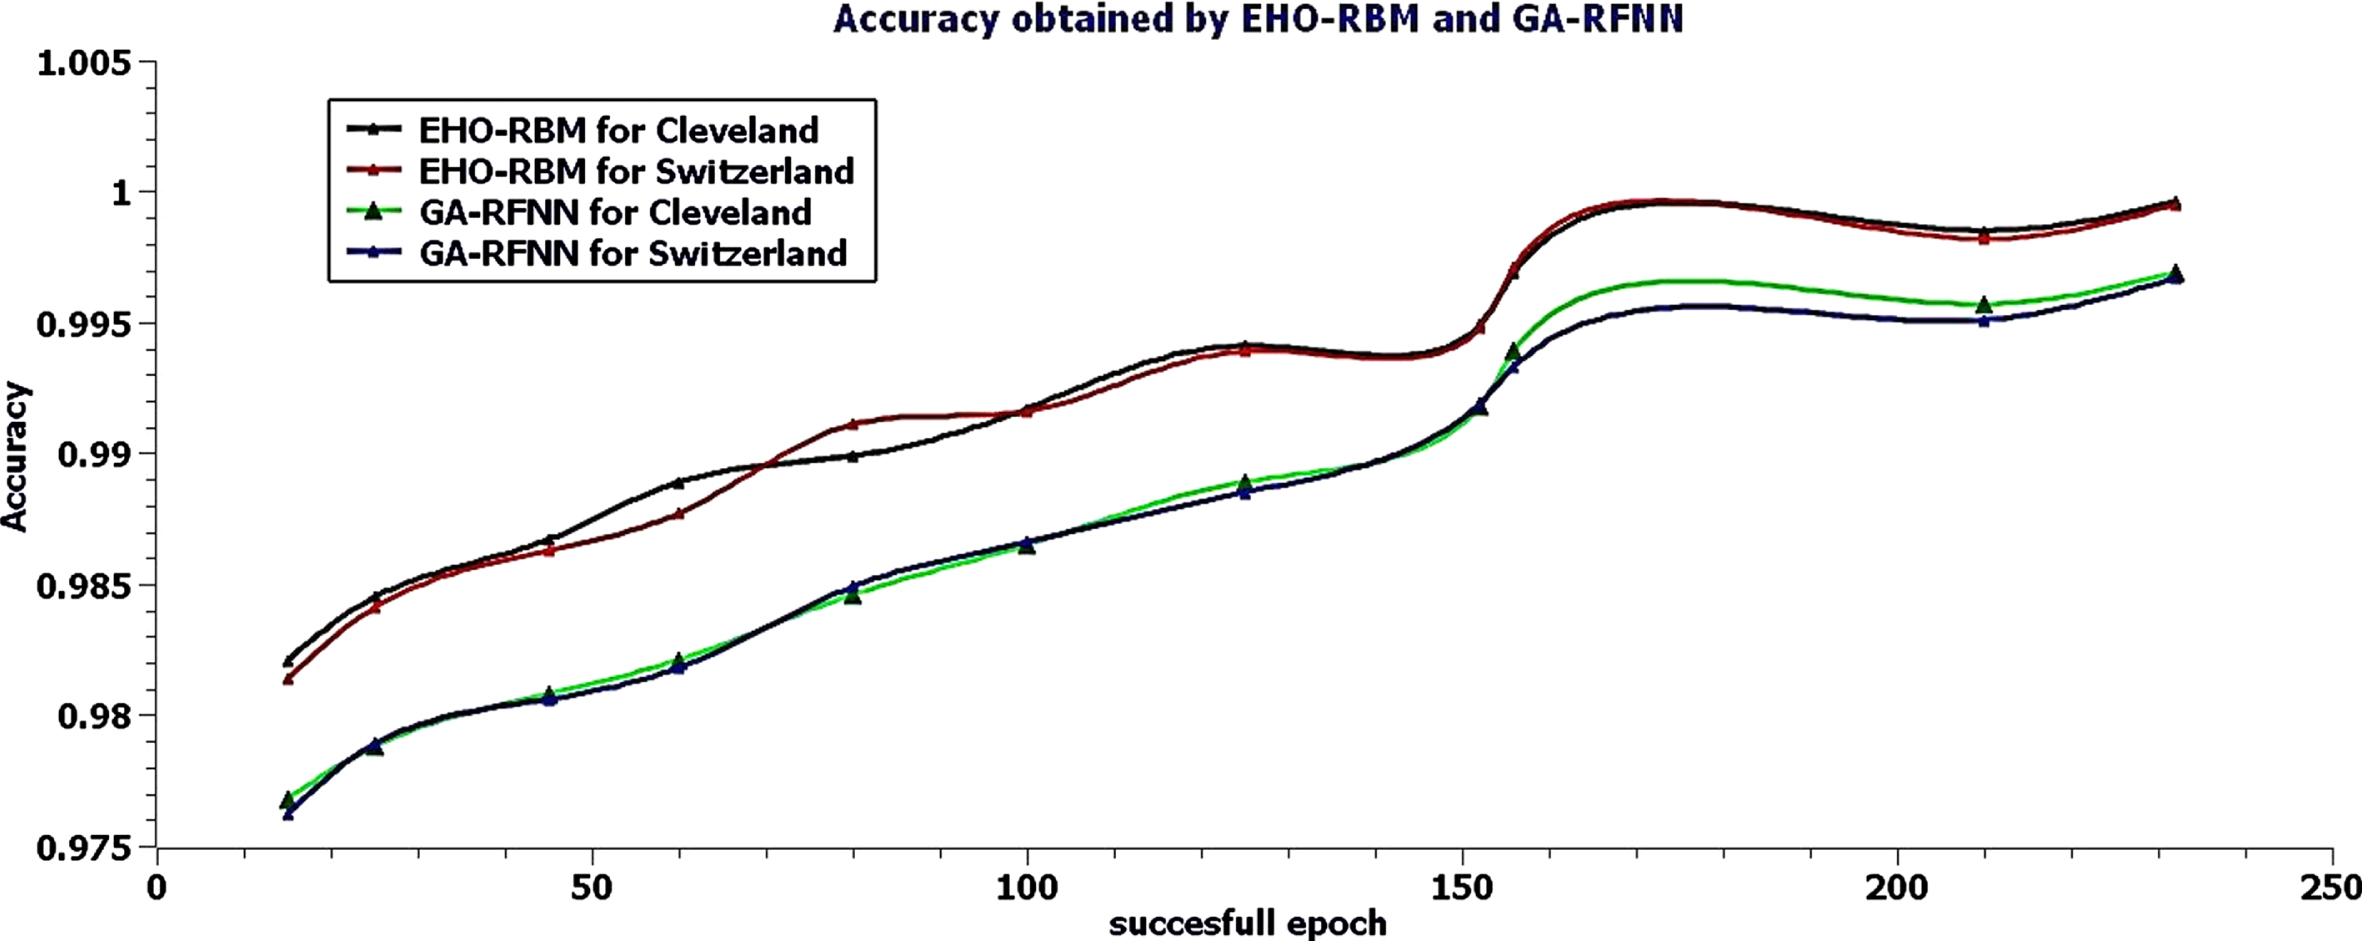
Accuracy rate of Successful rounds for EHO-RBM and GA-RFNN classifier.
Table 3 shows the successful round’s EHO-RBM and GA-RFNN precision rates for Cleveland and Switzerland. The EHO-RBM classifier has obtained a maximum precision of 0.9995 for the Cleveland heart disease dataset, and for the Cleveland dataset, it has obtained maximum precision of 0.9993 with acceptable loss. The GA-RFNN classifier has obtained the maximum precision of 0.9962 for the Cleveland heart disease dataset, and for the Cleveland dataset, it has obtained a maximum of 0.9967 with acceptable loss. The overall precision value table values show that an elephant separation behavior of elephant herding optimizers and the restricted visibility-based connection feature of the RBM networks model helps to achieve the promising precision rate of the EHO-RBM classifier in classifying heart disease.
Precision rate obtained by the EHO-RBM and GA-RFNN for Cleveland and Switzerland
Figure 8 shows the precision rate’s graphical representation for a few successful epochs. The curves show that the elephant separation behavior of elephant herding optimizers and the restricted visibility-based connection feature of the RBM networks model helps the EHO-RBM network to secure maximum precision value in most of the iterations for both datasets. Furthermore, the GA-RFNN classifier has obtained a lesser precision value for both datasets than EHO-RBM.
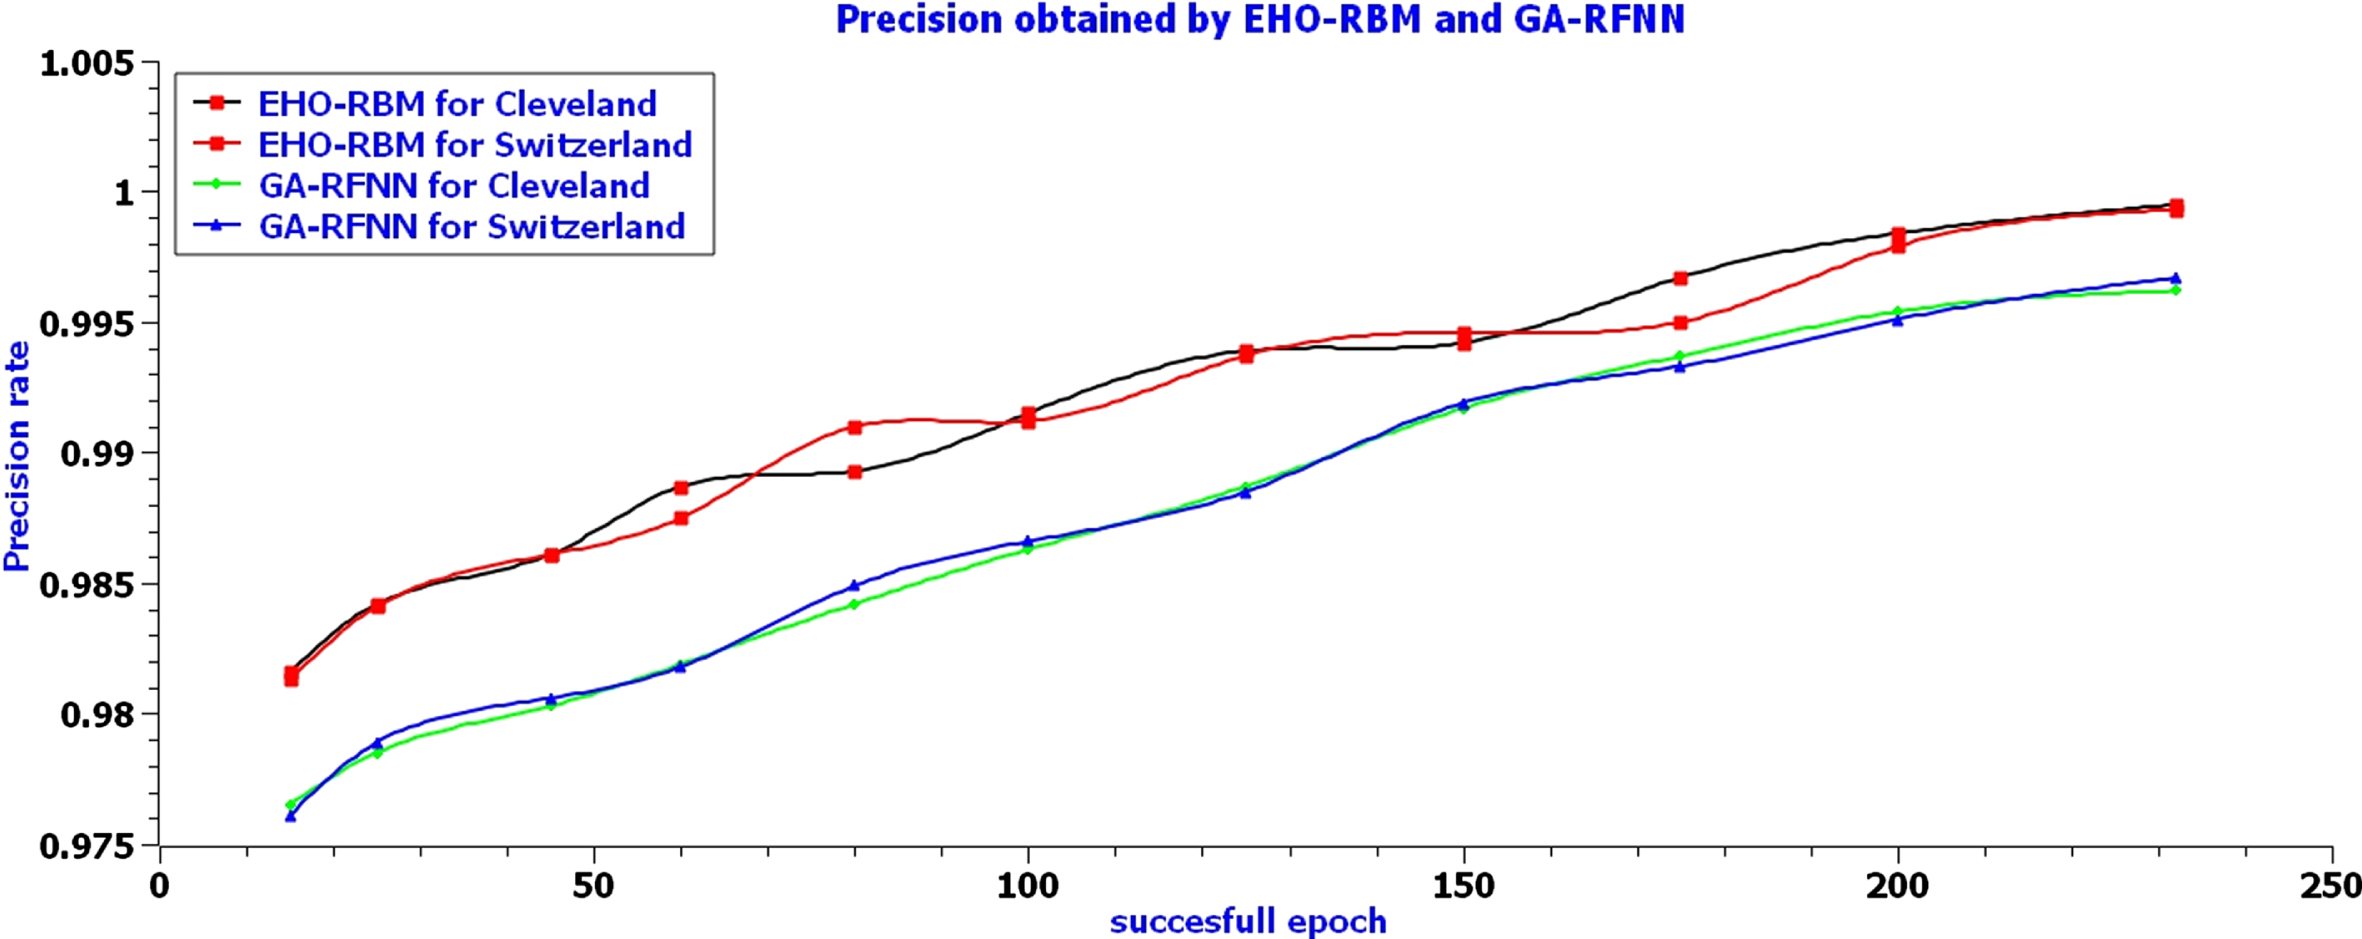
Precision rate of Successful rounds for EHO-RBM and GA-RFNN classifier.
Table 4 shows the successful round’s recall or sensitivity value of EHO-RBM and GA-RFNN for Cleveland and Switzerland. The EHO-RBM classifier has obtained the maximum recall value of 0.9994 in the 152nd iteration for the Cleveland heart disease dataset. The Cleveland dataset obtained a maximum recall value of 0.9993 in the 156th iteration with acceptable loss. The GA-RFNN classifier has obtained the maximum recall value of 0.9961 in the 210th iteration for the Cleveland heart disease dataset. The Cleveland dataset obtained a maximum of 0.9966 in the 232nd iteration with acceptable loss. The overall recall rate table values show that an elephant separation behavior of elephant herding optimizers and the restricted visibility-based connection feature of the RBM networks model helps to achieve the promising recall rate of the EHO-RBM classifier in classifying heart disease.
Recall rate is obtained by the EHO-RBM and GA-RFNN for Cleveland and Switzerland
The above Fig. 9 shows the graphical representation of the recall value for a few successful epochs. The curves show that the elephant separation behavior of elephant herding optimizers and the restricted visibility-based connection feature of the RBM networks model helps the EHO-RBM network to secure maximum recall value in most of the iterations for both datasets. Furthermore, the GA-RFNN classifier obtains a lesser recall value for both datasets than EHO-RBM.
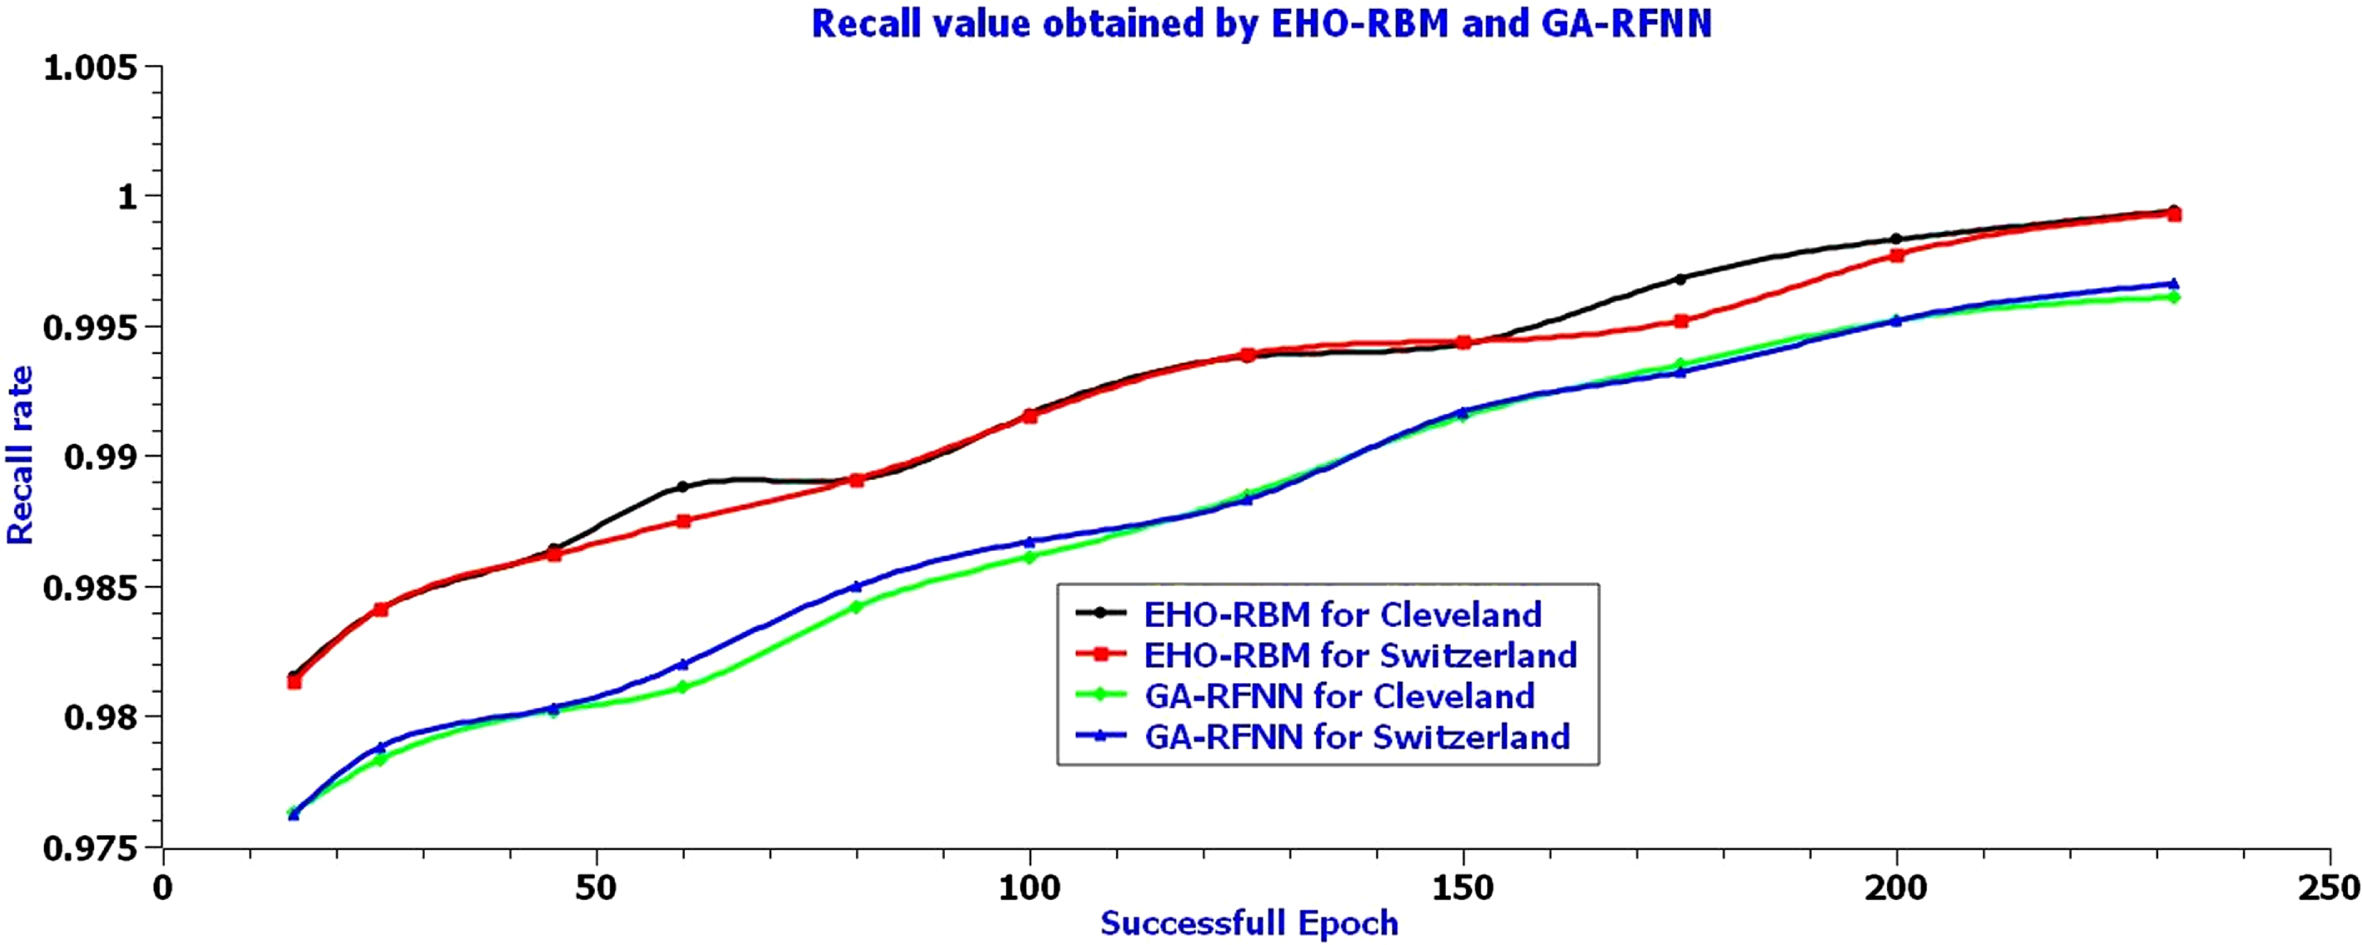
Recall the value of Successful rounds for the EHO-RBM and GA-RFNN classifier.
Table 5 shows the successful round’s Matthews Correlation Coefficient value of EHO-RBM and GA-RFNN for Cleveland and Switzerland. The EHO-RBM classifier has obtained the maximum value of 0.9995 for Cleveland’s heart disease dataset, and for the Cleveland dataset, it has obtained the maximum value of 0.9994 with acceptable loss. The GA-RFNN classifier has obtained the maximum value of 0.9961 for Cleveland’s heart disease and the Cleveland dataset. It has obtained a maximum of 0.9959 with an acceptable loss. The overall table values show that an elephant separation behavior of elephant herding optimizers and the restricted visibility-based connection feature of the RBM networks model helps to achieve the maximum Matthews Correlation Coefficient value of the EHO-RBM classifier in classifying heart disease.
Matthews Correlation Coefficient value of EHO-RBM and GA-RFNN for Cleveland and Switzerland
The above Fig. 10 shows the graphical representation of the Matthews Correlation Coefficient value for a few successful epochs. The curves show that the elephant separation behavior of elephant herding optimizers and the restricted visibility-based connection feature of the RBM networks model helps the EHO-RBM network to secure the maximum value in most of the iterations for both datasets. Furthermore, the GA-RFNN classifier has obtained a lesser value for both datasets than EHO-RBM.

Matthews Correlation Coefficient value of Successful rounds for EHO-RBM and GA-RFNN classifier.
Figure 11 shows the overall Performance comparison of EHO-RBM and GA-RFNN for the Cleveland and Switzerland heart disease dataset. The EHO-RBM classifier obtained the maximum value of 0.9996 and 0.9995 for Cleveland and Switzerland heart disease datasets, respectively. The GA-RFNN classifier has obtained the maximum value of 0.9967 and 0.9969 for the Cleveland and Switzerland heart disease dataset, respectively. The above-all evaluation results show that an elephant separation behavior of elephant herding optimizers and the restricted visibility-based connection feature of the RBM networks model helps to perform excellently to predict the heart disease risk level labels. The EHO-RBM is a minimized loss rate and increased the accuracy rate to 0.0027 to predict heart disease after training with the elephant herding optimizer. The conclusion of the research work has been given in the subsequent section. The conclusion of the research work has been shown in the subsequent section.
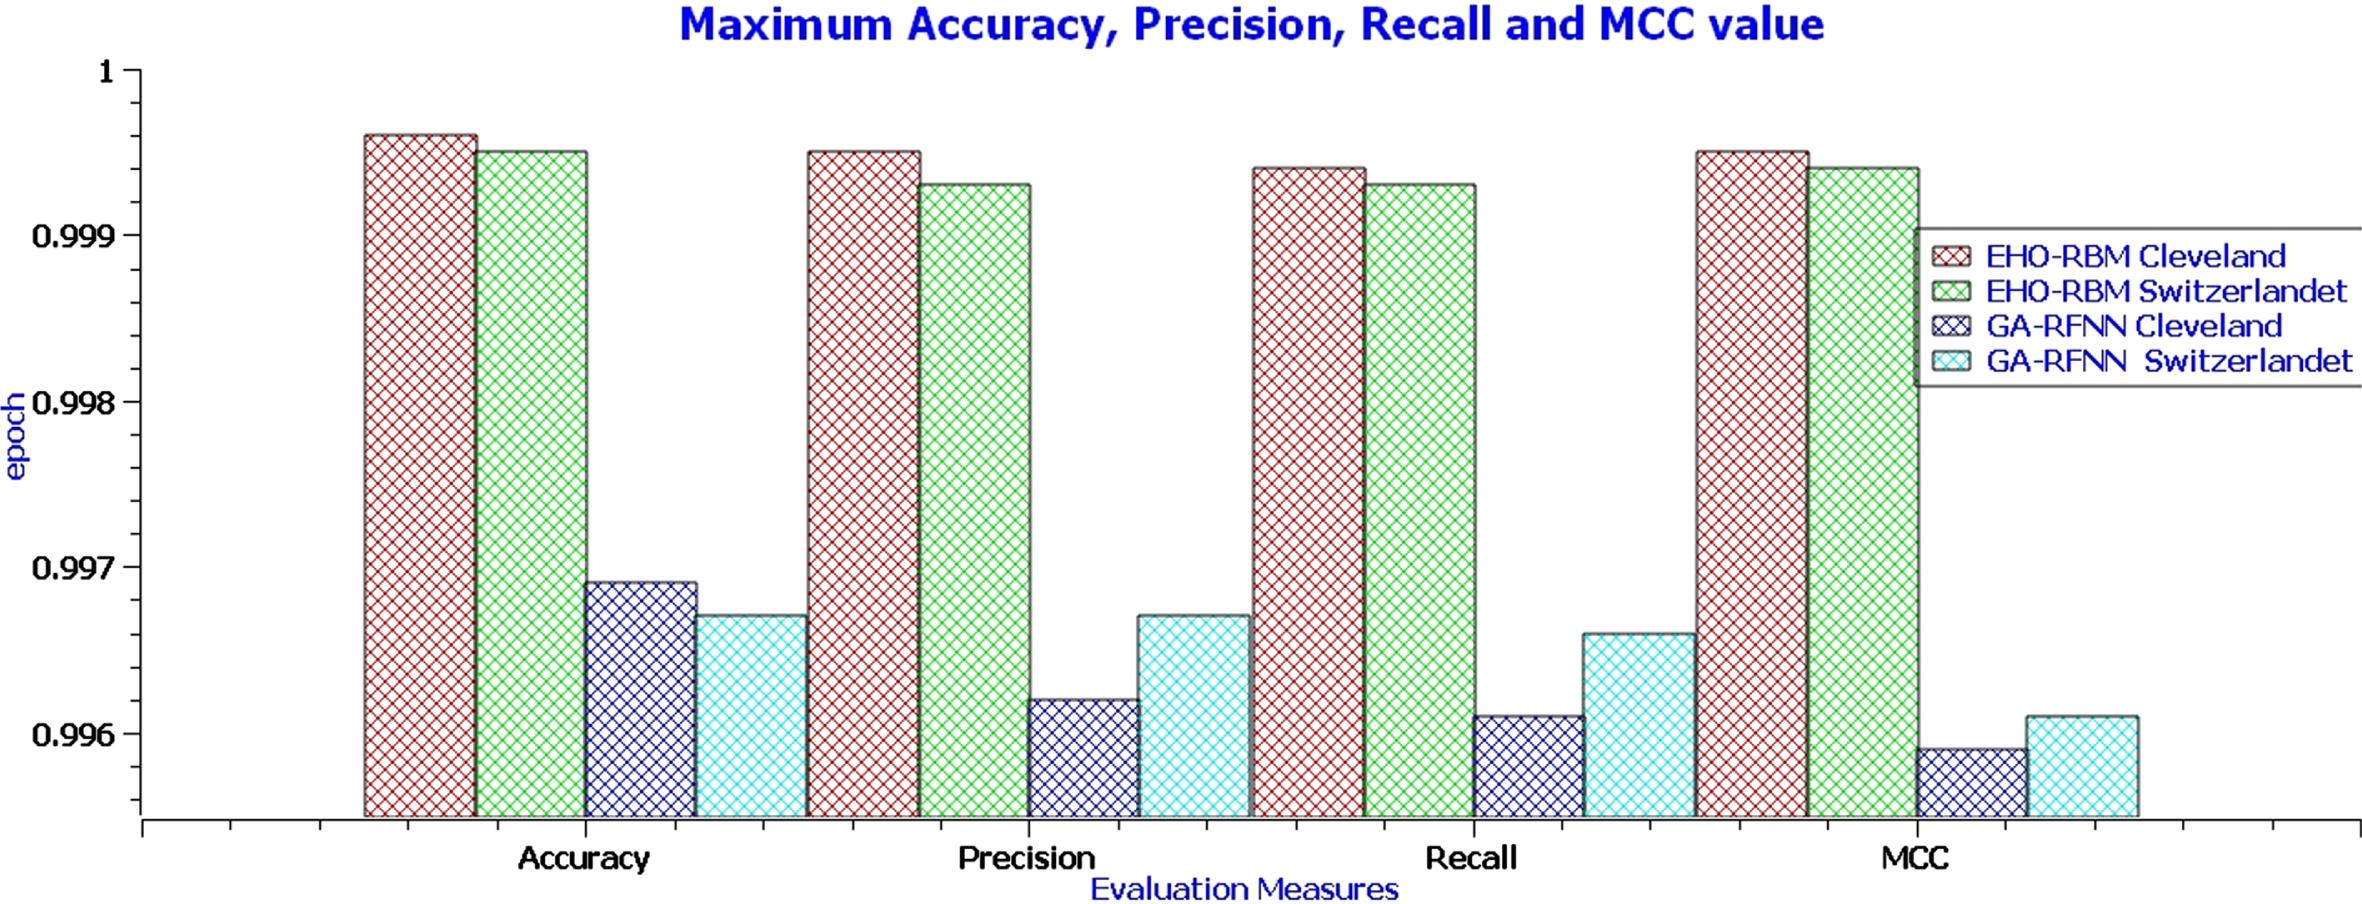
Performance comparison of EHO-RBM and GA-RFNN for Cleveland and Switzerland heart disease dataset.
Thus the above section briefly discusses the evaluation results of the EHO-RBM and GA-RFNN classifiers. It clearly shows that the new classification framework, which incorporates an elephant separation behavior of elephant herding optimizers and the restricted visibility-based connection feature of the RBM networks model, helps to predict the heart disease risk level successfully. The loss functions curve shows that the new classifier has been performed remarkably in predicting heart disease prediction with a minimum acceptable loss value of 0.0004 in the 152nd iteration for the Cleveland dataset. The minimum loss of the new classifier has been obtained as the best-reduced loss value in finding the global minima than the GA-RFNN classifier. Furthermore, fewer epochs (152nd) have been taken to reach the global minima than the GA-RFNN classifier. The new classifier obtained a maximum accuracy value of 99.96% for the Cleveland dataset. This is the best maximum accuracy than a comparison algorithm. The research concluded that the new classifier performs excellently predicting the heart disease risk level for Cleveland and Switzerland heart disease datasets with the highest accuracy rate and fewer loss values. The limitation of the new classification approach is the size of the dataset. The research has taken datasets to train the model in thousands. Future research focuses on resolving the limitation and as well as focuses on improving the model training rate for high dimensional data.